2003 msa annual report · consolidated statement of changes in 30 retained earnings and accumulated...
TRANSCRIPT

APassion for Safety
2003 Annual Report
39451 MSA '03 Ann. Rpt NARR COM 3/25/04 10:55 AM Page 2

OUR MISSION...
That men and women may
work in safety and that
they and their families
and their communities
may live in health
throughout the world, our
mission is to be the
leading innovator and
provider of quality prod-
ucts, related technologies
and services that protect
people’s health, safety
and the environment.
Behind every successful, and sometimes even life-saving, application of an MSA product stands a team of professionals committed to advancingMSA’s mission of protecting life. Decades ago,MSA founders John T. Ryan and George H. Deike personified this mission while directing rescueoperations at a mine explosion in westernPennsylvania.
On that particular day, the two men had ventured two miles into the mine with an MSAcrew when a second explosion cut loose.Thrownin all directions and stunned, the crew found theirway back to fresh air – except one. John Ryan wasmissing. George Deike donned a breathing appara-tus and ran into the mine.Through the smoke,he saw Ryan kneeling without a mask. He wastrying to pick up an injured miner he had found.The miner was wearing Ryan’s mask.
For 90 years, MSA has been protecting the livesof people throughout the world with the samePassion for Safety John Ryan and George Deikeexhibited in that Pennsylvania mine.
In this year’s annual report, we profile the connection that exists between five MSA associates and select MSA customers. In their own way, these associates represent the Passion for Safety that exists among all MSA associates and the principle that truly defines a culture that is unique to MSA. Fittingly, this serves as thetheme for our 2003 annual report.
ABOUT THE COVER
APassion for Safety
2003 Annual Report
CONTENTS
The Business of MSA 1
Chairman’s Letter 2
A Passion for Safety...Southern Peru 4Copper Corporation
A Passion for Safety...in Titusville, Pa. 6
A Passion for Safety...Bechtel 8
A Passion for Safety...Region 13 10Terrorism Task Force
The MSA Culture...A Passion for 12Safety
Financial Contents 19
Management’s Discussion and 20Analysis
Responsibility Statements 26
Consolidated Statement of Income 27
Consolidated Balance Sheet 28
Consolidated Statement of 29Cash Flows
Consolidated Statement of Changes in 30Retained Earnings and Accumulated Other Comprehensive Income
Notes to Consolidated Financial 31Statements
Summary of Selected Financial Data 41
39451 MSA '03 Ann. Rpt NARR COM 3/25/04 10:56 AM Page 3
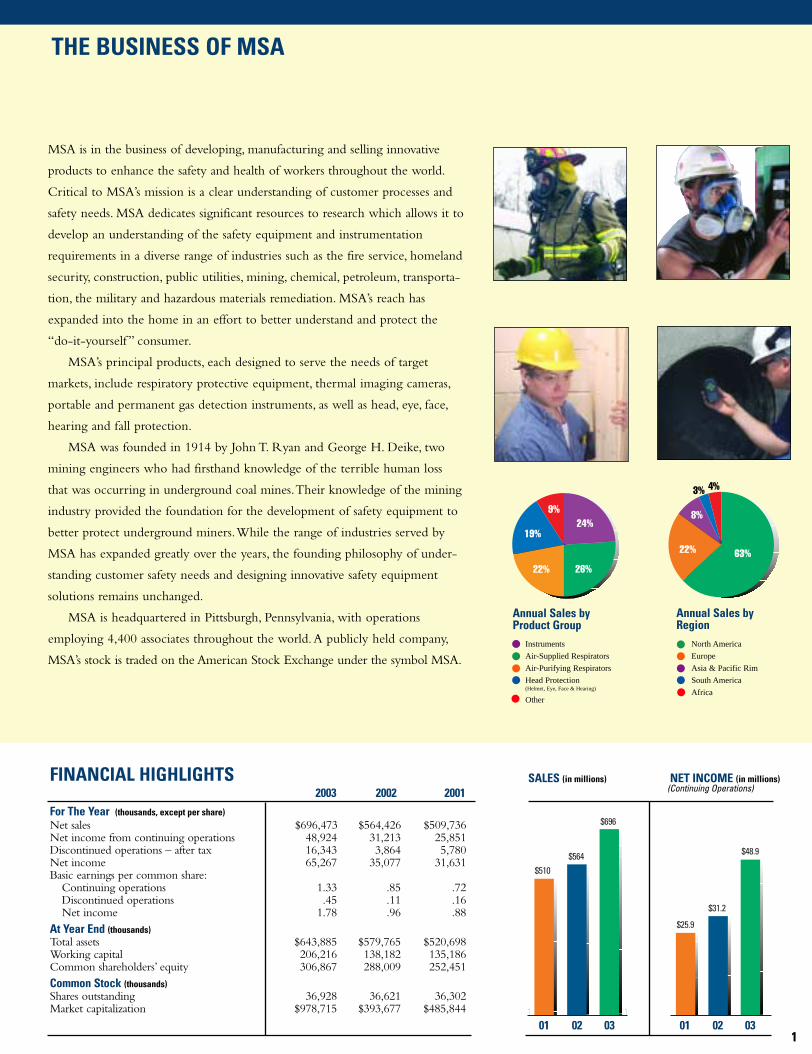
MSA is in the business of developing, manufacturing and selling innovative
products to enhance the safety and health of workers throughout the world.
Critical to MSA’s mission is a clear understanding of customer processes and
safety needs. MSA dedicates significant resources to research which allows it to
develop an understanding of the safety equipment and instrumentation
requirements in a diverse range of industries such as the fire service, homeland
security, construction, public utilities, mining, chemical, petroleum, transporta-
tion, the military and hazardous materials remediation. MSA’s reach has
expanded into the home in an effort to better understand and protect the
“do-it-yourself ” consumer.
MSA’s principal products, each designed to serve the needs of target
markets, include respiratory protective equipment, thermal imaging cameras,
portable and permanent gas detection instruments, as well as head, eye, face,
hearing and fall protection.
MSA was founded in 1914 by John T. Ryan and George H. Deike, two
mining engineers who had firsthand knowledge of the terrible human loss
that was occurring in underground coal mines.Their knowledge of the mining
industry provided the foundation for the development of safety equipment to
better protect underground miners.While the range of industries served by
MSA has expanded greatly over the years, the founding philosophy of under-
standing customer safety needs and designing innovative safety equipment
solutions remains unchanged.
MSA is headquartered in Pittsburgh, Pennsylvania, with operations
employing 4,400 associates throughout the world.A publicly held company,
MSA’s stock is traded on the American Stock Exchange under the symbol MSA.
$510$564
$696For The Year (thousands, except per share)Net sales $696,473 $564,426 $509,736Net income from continuing operations 48,924 31,213 25,851Discontinued operations – after tax 16,343 3,864 5,780Net income 65,267 35,077 31,631Basic earnings per common share:
Continuing operations 1.33 .85 .72Discontinued operations .45 .11 .16Net income 1.78 .96 .88
At Year End (thousands)Total assets $643,885 $579,765 $520,698Working capital 206,216 138,182 135,186Common shareholders’ equity 306,867 288,009 252,451Common Stock (thousands)Shares outstanding 36,928 36,621 36,302Market capitalization $978,715 $393,677 $485,844
FINANCIAL HIGHLIGHTS
THE BUSINESS OF MSA
22%
8%
63%
3% 4%
22%
24%
Instruments
Air-Supplied Respirators
Air-Purifying Respirators
Head Protection(Helmet, Eye, Face & Hearing)
Other
26%
19%
9%
North America
Europe
Asia & Pacific Rim
South America
Africa
SALES (in millions) NET INCOME (in millions) (Continuing Operations)
101 02 03 01 02 03
2003 2002 2001
Annual Sales by Product Group
Annual Sales by Region
$48.9
$31.2
$25.9
39451 MSA '03 Ann. Rpt NARR COM 3/25/04 10:56 AM Page 1

In the last Leap Year, four years ago, in times of challenge forthe company, I used at a meeting the following words fromthe Letter of Paul to the Galatians, Chapter 6,Verse 9,“Let us
not be weary in doing good; for at the proper time we will reapthe harvest if we do not give up.”Though we are now workingfor many more and better harvests in the years to come, I mustsay that the 2003 vintage was a very successful and pleasant one.
The passion for safety that we have at MSA which has inspired us for years and decades has been particularly evident in the per-formance of the company in recent times. Sales and income fromcontinuing operations reached record levels for the third consecu-tive year and improved over 2002 by 23% and 57%, respectively.The company’s net income from continuing operations for 2003totaled $48.9 million on sales of $696.5 million.
These results came primarily from our focus on being the premierglobal developer, manufacturer and supplier of safety products.The 2003 success came particularly from fully taking advantage ofour opportunities in prosperous markets, limiting the shortfall ofbusiness in those markets with difficult economic circumstances,and getting the most out of every bit of our sales by strong per-formance in our manufacturing operations and other elements ofproductivity within the company.
Prosperous markets start with our largest one, the fire service.In the United States increased federal government funding toimprove the quality of the equipment used by our firefightersand, particularly, new performance standards increased marketdemand. Due to the fine efforts of so many MSA associates, MSAwas positioned to realize this opportunity and excelled in fulfillingthis demand. It was particularly noteworthy that our self-con-tained breathing apparatus was the first, and for a good while theonly, such product to be approved under both recent standards –the 2002 National Fire Protection Association (NFPA) standardsfor SCBA performance and the NIOSH Chemical BiologicalRadiological and Nuclear (CBRN) standard to protect first responders against terrorist chemical agents.
MSA provided service for the Homeland Security market wellbefore the tragedies of 2001, and our Millennium Gas Mask isthe leading product for this market and one of our Products ofthe Year in 2003. Several years ago the company identifiedInternational operations, which we define as those outside ofNorth America and Europe, as having the greatest proportionalopportunity for growing our business. Results from this area werevery satisfactory in 2003 with strong growth in sales and evenbetter improvement in earnings. Particularly good results wereturned in by MSA Australia, MSA Argentina, MSA Japan, MSAAfrica and MSA Middle East. MSA Gallet achieved anotherexcellent year of performance and led the company’s Europeanoperations.
Distinctly noteworthy is the performance of our U.S. NationalSales Force in North America that exceeded its sales targets forthe fourth consecutive year and did so this time by a wide margin.Creativity, adaptability and diligent effort backed by a top productline generated these fine results. In North America, this passionfor excellence resulted in MSA receiving “Best Field Support andCustomer Service” awards from two of our major distributionchannel partners – Airgas and Orr Safety.
Sales to the U.S. federal government in the year were verystrong led by the MCU-2/P Gas Mask and our newest productto protect military people in the war against terrorism – theAdvanced Combat Helmet (ACH) with the MICHCommunications System.These latter products came from acombined effort of MSA Gallet and MSA North America to fullymeet the requirements for a ballistically effective and comfortablenew-generation helmet integrated with an effective electroniccommunications system and are being widely deployed to savethe lives of American men and women in combat.This productwas recognized by the U.S.Army Material Command as one ofthe greatest inventions of 2002.
As we move forward to meet new challenges, the NorthAmerican Sales Organization completed a strategic review of
its operations to identify areas whereMSA’s value proposition to its customersparticularly fits the value requirementsof our current and potential customers.Based on this study, the company isinvesting in added sales efforts to focuson selected markets where we think thebest opportunities lie.
The second element of the company’ssuccess were sales efforts and new prod-uct introductions that enabled the company to sell reasonably well inmany parts of the global economy thatwere sluggish or deteriorating during2003.This particularly involved elementsof industrial North America, continentalWestern Europe and capital goods markets worldwide.
New product development continuesto be a crucial element of our efforts. In2003, we reached a significant internalgoal as nearly one-third of sales weregenerated from products introducedover the last three years.
To Our Shareholders,Associates,Customers and Supplier Partners:
2
MSA’s North American Sales Organization (NASO) played a major role in helping the company achieve recordresults in 2003. Shown above with John T. Ryan III (front center) and members of MSA’s executive team arerepresentatives of NASO, including U.S. regional sales managers, market sales managers, and directorsresponsible for field sales, government sales and customer service.
39451 MSA '03 Ann. Rpt NARR COM 3/25/04 10:56 AM Page 2

As a global leader in the safety products industry, MSA is com-mitted to strategic efforts in new product development that meetmarket needs and to fulfill,“ahead of the pack,” important newstandards.The Evolution 5000 Thermal Imaging Camera was oneof our Products of the Year as it combines a superior camera image –for firefighters involved in life-or-death decisions – with compactsize, low weight and high durability against both drops and external heat, all delivered at a very market-competitive price.The development of the value-priced MSA Solaris MultigasDetector, with its compact size, was our Process of the Year as itwent from initial concept to a product launched in ten months.Many other exciting new products are helping the company asyou will read throughout this report, such as the UltimaX permanent instrument sensors and the SafeSite System for homeland security applications.
I am pleased to report that our new executives and managerspromoted or hired last year have stepped into their new positionswithout missing a beat, and our team is working smoothly and well.
Operational ExcellenceMSA has been getting the most out of its business with high pro-ductivity. Particularly distinguished were Safety Products Divisionoperations in North America that exceeded measured performancelevels by a considerable margin. Initiatives in Lean Sigma, a combi-nation of Lean Manufacturing and Six Sigma programs, have continued to show benefits for our business. One immediate ben-efit from Lean Sigma is to improve the productivity in our use offloor space. In our Murrysville, Pennsylvania factory, this openedup space for an entirely new product line for that factory, improvingthe throughput and generating new jobs for the area.
A bittersweet element of MSA activities in 2003 was the sale ofthe Callery Chemical Division to the BASF Corporation. From itsorigin in the late 1930s in making chemicals for life-saving appli-cations for U.S. Naval forces in World War II, Callery Chemicalgrew to be a leading manufacturer of boron and potassium chemicals.Callery was a valuable and profitable element of MSA for manyyears. However, it became quite clear that MSA, with our focus on safety, was not in a position to add value to Callery’s growingspecialty chemical business and that it would fit better with BASF.
MSA shareholders benefited directly from the success ofCallery through the special distribution of $4.38 per share, repre-senting the net proceeds the company received from the sale.Thistransaction sharpens MSA’s focus on driving growth in our corebusiness.As the old saying goes, safety is our business – our onlybusiness. It is a wide, complex, diversified, global business involvingmany technologies and many markets, but it is one where a passionfor safety well executed can generate very satisfactory results.
OutlookAt MSA our passion for safety can be directly expressed in thepursuit of our mission – that men and women may work in safetyand that they, their families and communities may live in healththroughout the world.We take the tough jobs where people’slives and health are particularly threatened; and the more difficultthe assignment, generally the better MSA’s market position is.We are approaching our 90th anniversary and, throughout thisentire time, we and our predecessors in the workplace have beenessentially pursuing this very same mission.
We had believed for several years now that the area in whichthe placement of investment in money and organizational effortthat would produce the best results is in MSA International oper-ations.We plan to continue to expand our global reach because inevery place where workers, including consumers in their homeworkshops, need protection, MSA wants to be there becauseevery such place is in “our neighborhood.”
We should remember that some of our important markets havea history of being volatile. Some sales to the U.S. Department ofDefense in 2003 were unique to the requirements of militaryoperations conducted that year and in rebuilding the nation’s
stocks of military equipment. However, MSA has received inrecent months a number of large orders for the AdvancedCombat Helmet and MICH communications system.This is aproduct in which there will be a steep ramp-up of production attwo MSA locations which will present challenges that I’m surewe can successfully meet. Our indications at the present time, bothfrom our internal activity and feedback from our distributionpartners and from data on the U.S. Government’s FIRE Actfunding are that the North American fire service market shouldcontinue to be strong and growing throughout this year.
Our Millennium Gas Mask has been the industry’s first prod-uct approved to the new CBRN standard. Funding for homelandsecurity in the United States has been very strong over the lasttwo years.There are differing opinions in the marketplace aboutthe extent of growth in this area in 2004 and 2005, but we feelthat it will continue to make a positive contribution to MSA sales.
Our efforts in international markets are continuing and accel-erating, and we see good opportunities there in the future in eachof our major regions.A new management team is in place in China,and with global support we look forward to good progress there.
The overall economies in the U.S. and China seem at the pres-ent time to be going strongly with good prospects.This is helpfulfor the global economy which, however, is excessively dependenton growth in these two countries.This growth should helpMSA’s operations in the affected areas, particularly industrial markets in North America. Growth in China, as well as NorthAmerica, helps many third country markets in which MSA is particularly active, such as South America. It would be very help-ful, though, for the world that economic development wouldhave more breadth, and particularly have some help from WesternContinental Europe which continues to be an area of businessslowness and uncertainty.
We will continue at MSA to be watchful for both opportunitiesand challenges in a volatile world where the forces of terrorismhave been suppressed but not eliminated. It has been a very satis-fying four years since I used that quote from Galatians which wasfulfilled in the interim. Now, opportunities and challenges shoulddevelop in new and interesting areas.
For a number of years we have been pursuing the goal ofsolid profitability.While this is a never-ending challenge, I ampleased that we made much progress in this area over the lastseveral years.All of this rewards our shareholders, and a particularmeasure of this was that MSA stock was one of the top ten performers of the American Stock Exchange in 2003 in termsof stock price improvement over the year.
I close with a thought from Woodrow Wilson who wasPresident of the United States in the year MSA was founded,“We are not here merely to make a living; we are here in orderto enable the world to live more amply with greater vision andwith the finest spirit of hope and achievement.We are here toenrich the world and one impoverishes oneself if one forgets that errand.”
With our noble mission, our passion for it and our globalreach, we are in a particularly good position to fulfill these idealsand go on to reap new and better harvests.
John T. Ryan IIIChairman of the Boardand Chief Executive Officer
3
39451 MSA '03 Ann. Rpt NARR COM 3/25/04 10:56 AM Page 3

Peru offers some of the world’s most spectacular and varied scenery. But this nation’s ruggedand mountainous landscape also presents unique safety and business challenges. MSA Peru,however, has risen to the challenge.
By tailoring MSA products to meet specific needs and supporting their customers with out-standing service, MSA Peru leads all other competitors in providing customers with safer workplaces.
In South America, perhaps no customer values MSA’s leadership more than Southern PeruCopper Corporation (SPCC), which employs more than 5,000 people at three separate locationsin the rugged foothills of the Andes Mountains: the Cuajone and Toquepala mines and the ItoRefinery.At these sites, sales calls can last for weeks and generations of MSA employees can recallthe challenges of such visits – including MSA chairman and CEO John T. Ryan III, who remem-bers traveling to the Cuajone Mine nearly 30 years ago.
But long hours and years of work by MSA and SPCC do pay off.Just ask Mr. Santos Nuñez, a supply train driver at SPCC’s Mines. In 2001, a rock slide cut
loose a boulder down 200 feet of mountainside causing it to crash through the windshield of alocomotive operated by Mr. Santos. Fortunately he was wearing MSA’s V-Gard Helmet, which was credited with saving his life. No one is more grateful than Mr. Nuñez.
“My older daughter had just finished Civil Engineering studies and the younger one just earnedher bachelor’s degree in Architecture. I could have missed all this, but I had an MSA helmet,” saidMr. Nuñez.
Today SPCC employees like Mr. Nuñez are among MSA’s best advocates because they understand that behind the quality of MSA products there is a loyal team of experts who provideunparalleled service and support.
“There is no doubt the quality of our products opens doors here in Peru, but it’s also the dedication of our sales team. Our team steadfastly supports all customer requests for training andconsultation and this is where we differentiate ourselves from competitors,” said Luis FernandoFlores, MSA’s General Manager, Peru.“In the final analysis, it’s MSA Peru’s people who make a difference.”
For SPCC workers like Santos Nuñez it’s Manuel Ocsas, an MSA Peru sales representative, whomakes that difference. Manuel helps SPCC leverage new safety technologies to ensure workers likeSantos Nuñez are protected.
“Each security requirement is unique,” said Manuel.“And the only way to understand the security requirement is to thoroughly know the company and its procedures, visit the exact placewhere a security solution is required, and then analyze the risks.”
At far right, Southern Peru Copper Corporation safety experts leverage MSA’s Manuel Ocsas’ safety expertise. (From left to right Anibal Tapia,Manuel Ocsas, Jorge Medina, Ana Aguilar, andAlberto Paz)
At center below, Víctor Díaz, a heavy equipmentoperator at SPCC’s Cuajone mine goes to work with MSA’s V-Gard® Helmet.
A PASSION FOR SAFETY...
Southern Peru Copper Corporation
Santos Nuñez, left, a supply traindriver for the Southern Peru Copper Corporation, credits MSA’s V-Gard® Helmet with saving his life.
MSA’s V-Gard® Helmet is on the job with Francisco Calizaza, right, aheavy truck operator at SPCC’sCuajone mine.
4
39451 MSA '03 Ann. Rpt NARR COM 3/25/04 10:56 AM Page 4

,d
nt
MANUEL OCSAS Sales Representative, MSA Peru
5
For Manuel Ocsas, the challenges of his job prompts him to excel. “On a given day I can work whereit’s about 85°F (29°C) and then travel 16,400 feet (5,000 meters) above sea level, where the temperature could be around 15°F (-10°C),” said Manuel, whose work typically begins around 4:00 a.m. when heleaves his home office in Arequipa for remote areas in southern Peru where sales calls can last for weeks.
“A passion for safety is what drives Manuel,” said Luis Fernando Flores, MSA’s General Manager, Peru. “He is there for the customer, visits them, follows up, and has mastered all of our customer servicepractices. His passion has helped him earn the respect and trust of our customers. He’s a tremendous asset for MSA Peru and a great ambassador for safety.”
39451 MSA '03 Ann. Rpt NARR COM 3/25/04 10:56 AM Page 5
Walk along Franklin Street in Titusville, Pa., and you can sense the pride residentsfeel toward their hometown. Home to Drake’s Well, the birthplace of the U.S. oilindustry, this close-knit town in northwestern Pennsylvania has a deep sense of
community.Although the wells stopped pumping years ago, the bond of shared history givesthe people of Titusville an appreciation for their community and each other.
City residents rely on Captain Joe Crotty and the Titusville Fire Department to keep thiscommunity safe. And the department, which responds to more than 550 calls per year, relies onMSA to advance their firefighting capabilities.
In 2000, the Titusville Fire Department, like many departments across the country, sought to improve its capabilities by adding the latest advancement in firefighting technology:an MSA Evolution Thermal Imaging Camera.
During a recent summer evening, Chief Crotty and his men learned just how valuable asafety tool an MSA Thermal Imaging Camera can be.The call came in for immediate responseto a two-and-a-half story florist shop that was engulfed in smoke.A team of firefighters enteredthe building, battling the blaze on two floors. Inside, firefighters reported that heat conditionswere rapidly worsening.
Noticing a subtle shift in the building’s front door frame, Chief Crotty grabbed theEvolution Thermal Imaging Camera and conducted a quick two-sided scan of the exterior.The structure was white hot.The chief ordered the crews out of the building. Seconds later, thefirst floor began to disintegrate.Within two minutes, the roof collapsed into the second floor.
“Thermal imaging can and does save lives,” said Crotty.“The thought of what might havehappened at that fire is still sobering. I could have lost half a dozen men.Thank God for theEvolution Thermal Imaging Camera.”
Chief Crotty has since incorporated the Evolution Thermal Imaging Camera into Titusville’sstandard operating procedures and training processes.“It improves the efficiency of our fire-fighting resources tremendously. Most of all,” he adds,“it protects the most precious resourcesany fire department has – our firefighters.”
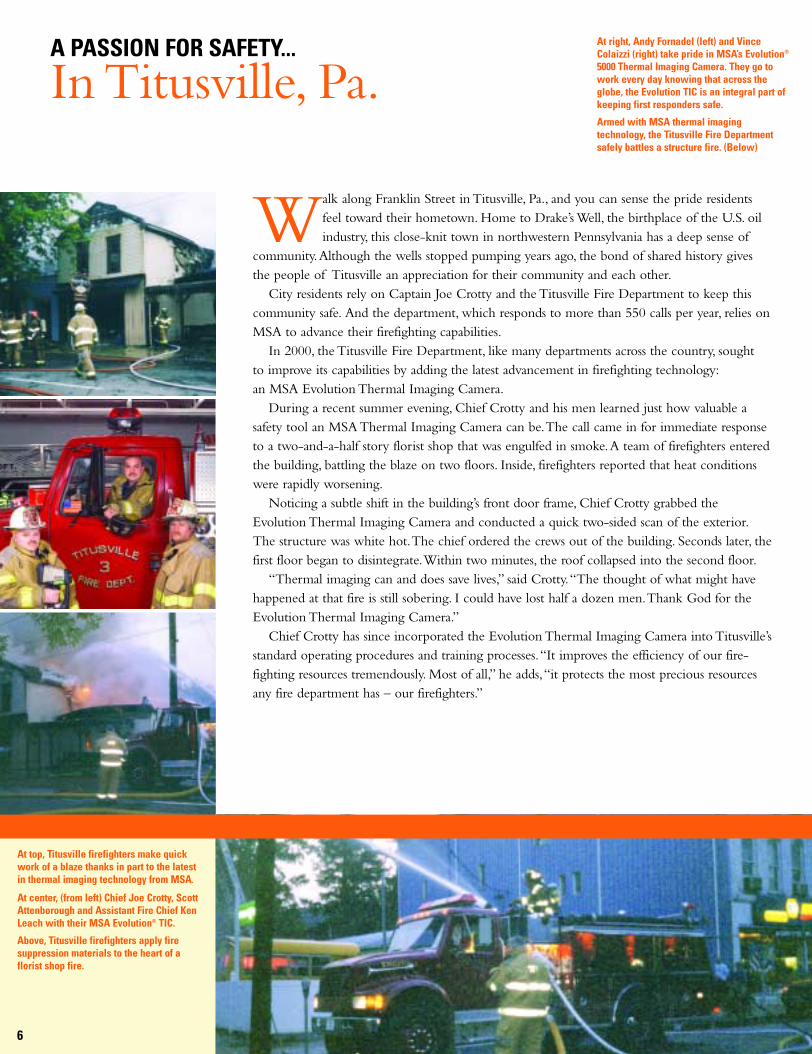
At top, Titusville firefighters make quickwork of a blaze thanks in part to the latest in thermal imaging technology from MSA.
At center, (from left) Chief Joe Crotty, ScottAttenborough and Assistant Fire Chief KenLeach with their MSA Evolution® TIC.
Above, Titusville firefighters apply fire suppression materials to the heart of a florist shop fire.
A PASSION FOR SAFETY...
In Titusville, Pa.
6
At right, Andy Fornadel (left) and VinceColaizzi (right) take pride in MSA’s Evolution®
5000 Thermal Imaging Camera. They go towork every day knowing that across theglobe, the Evolution TIC is an integral part ofkeeping first responders safe.
Armed with MSA thermal imaging technology, the Titusville Fire Departmentsafely battles a structure fire. (Below)
39451 MSA '03 Ann. Rpt NARR COM 3/25/04 10:57 AM Page 6

ANDY FORNADEL Design Engineer, MSA Instrument Division
VINCE COLAIZZI Design Engineer, MSA Safety Products Division
The life-saving potential of the Evolution TIC is well known to MSA’s Thermal Imaging Camera team. Engineers Andy Fornadel and Vince Colaizzioften hear stories like the one told by Titusville, Pa. firefighters, and they find them inspiring.
“Our team has an immediate and direct impact on safety. We get letters from grateful customers all the time,” says Fornadel, who is responsible forthe electronics design and display technologies that are integrated into every MSA Thermal Imaging Camera. “Being able to work on something likethis every day is incredible. It has become very evident that the efforts of our team help save lives.”
Colaizzi, a design engineer whose contributions have helped shape MSA Evolution cameras into the most ergonomic thermal imaging cameras onthe market, concurs. “It’s extremely satisfying to work for a company that focuses on protecting people,” he said. “We don’t just design products; we are an active part of MSA’s mission to protect life.”
7
Vince Colaizzi makes sure that the Evolution®
5000 TIC meets the ergonomic needs of firstresponders and builds the camera to with-stand extreme heat and high impact.
Andy Fornadel tests the boundaries of his latest thermal imaging electronic designs. He makes sure that the camera’s displayfunctions properly every time a first responder turns it on.
39451 MSA '03 Ann. Rpt NARR COM 3/25/04 10:57 AM Page 7

A PASSION FOR SAFETY...
Bechtel
8
As part of Bechtel’s safety regimen,employees wear white MSA helmets fortheir first 30 days on a site. Following thisperiod and safety training, workers gradu-ate to wear the yellow V-Gard® Helmet.
Bechtel workers, below center, positionsteel frames prior to pouring concreteat a work site in Springerville, Ariz. Theproject is scheduled to employ more than1,600 workers over the next three years.
In Springerville, Ariz., MSA supports Bechtelin the building of a 400 megawatt powerplant, right, that wlll provide energy through-out the southwest United States.
At far right, safety is always part of the planas Ben Smith, civil superintendent (left),confers with Greg Zurlinden, carpenterforeman, at Bechtel’s Springerville, Ariz.,work site where all employees wearMSA V-Gard® Helmets.
At Bechtel, one of the world’s premier engineering construction and managementcompanies, dedication to superior environmental, safety and health practices is a corevalue, one that pervades the business. So it’s not surprising that Bechtel relies on
MSA’s quality products and support services to help it maintain an industry-leading record ofzero lost-time incidents on 90 percent of its projects worldwide.
Having such an enviable safety record is no easy task for a company like Bechtel, whichemploys more than 40,000 employees on hundreds of projects in nearly 60 countries. But byteaming up with MSA, this international leader in the construction industry has found a globalpartner with a shared vision for safety.
“A real strength of MSA is their people and service,” said John Mathis, manager of environ-mental safety and health for Bechtel’s largest business line, Bechtel Systems & Infrastructure,Inc.“You’re not just buying MSA equipment; you’re buying the support and service that goesalong with that equipment.”
Throughout the world – from Chile to China – MSA tirelessly supports Bechtel as it strivesfor a high level of safety at each of its work sites. Most recently this support includes Bechtel’sefforts to rebuild key infrastructure in Iraq, where MSA is working to ensure that the rightsafety equipment and training is available to Bechtel on demand. Such global support wouldnot be possible without MSA’s dedicated associates.
“They’ve responded to our project needs on a moment’s notice,” said Mathis, who explainedthat MSA products are a standard part of the company’s inventory and equipment catalog.With this comprehensive support, MSA has consistently demonstrated an ability to bring bothtop quality equipment and support for that equipment on site under the most difficult conditions.
Perhaps nothing better reflects the strength of the relationship between MSA and Bechtelthan the moments following the tragic September 11 attacks on New York City. In the hoursfollowing the attacks, Bechtel was on site volunteering to provide assistance and turned toMSA to get much of the vital safety equipment and personnel to support its use on site.
“The response was absolutely outstanding.These guys got it there right away,” said Mathis,recalling MSA’s ability to get critical safety equipment and personnel to the site of the WorldTrade Center within 24 hours of the attack.
“It was certainly a team effort,” says Victor Vendetti, regional sales manager for MSA’s NorthAmerican construction market.Vendetti credits many within MSA, Bechtel and the govern-ment for enabling MSA to effectively do its part in the post-September 11 recovery efforts.
“Anywhere you find a Bechtel project, you’ll likely find an MSA presence,” says Victor.
39451 MSA '03 Ann. Rpt NARR COM 3/25/04 10:57 AM Page 8

9
VICTOR VENDETTI Regional Sales Manager, North American Construction Market
"For a safety program to be truly effective, it’s vital you have top down support and that the program has teeth," says Victor Vendetti, MSA’s regionalsales manager for the North American construction market. According to Victor, it is customers like Bechtel that help give him the drive and the passion to provide the proper equipment and training.
"You’re not just selling equipment or providing training," said the MSA associate who has traveled to more than 40 countries in his 13 years with thecompany. "You’re helping somebody do their job safely so they can go home every night."
Victor unabashedly has a Passion for Safety he shares within his own community of Seven Fields, a suburb near Pittsburgh, Pa."You really can’t drive anywhere here without seeing a construction site. Sometimes I’ll just stop and talk to the workers about safety. It’s what I do." Where does the passion originate? The answer is simple: "MSA’s culture instills a real passion for protecting people," says Victor. "Any time you use
an MSA product, you should know that product has been designed, assembled and sold by people who understand its life-saving ramifications."
39451 MSA '03 Ann. Rpt NARR COM 3/25/04 10:57 AM Page 9

With a self-proclaimed passion to protect, Alice Martin, right, assembles and tests anotherSolaris™ unit according to customer specification.
The Solaris™ Multigas Detector, below right, gives Region 13 Terrorism Task Force membersan easy, reliable method of evaluating the levelof harmful gases and quickly implementing proper safety precautions.
At top, intense training exercises prepareRegion 13 first responders for emergencyscenarios. Securing a position while wearing MSA Advantage® 1000 Gas Masksprotects this unit from breathing potentiallyharmful airborne toxins.
A member of the Region 13 Terrorism TaskForce, above, wears MSA’s Advantage®
1000 Gas Mask during training maneuvers.
Region 13 Terrorism Task Force consultantAlan Hausman in blue, demonstrates thefunctionality of the MSA Solaris™Multigas Detector.
A PASSION FOR SAFETY...
Region 13Terrorism Task Force
10
The world in which we live changed forever on September 11, 2001. It changed theway we travel, the way we work and the way we attend events. It changed the wayFederal intelligence and law enforcement agencies communicate, and it changed the
way local first response agencies interact, collaborate and share personnel and equipmentresources.
Perhaps nowhere is this more evident than in western Pennsylvania where 13 counties andthe City of Pittsburgh have joined forces to create the Region 13 Terrorism Task Force.Theirefforts have been lauded as a best practice example of how a large geographic region, coveringnearly 10,000 square miles, can best manage resources in the event of a domestic emergency.A group ahead of its time, the Region 13 Terrorism Task Force was actually formed in 1998 asa proactive means to share services and to formally develop mutual aid and response protocols.
Since 2001, this task force has quickly addressed the issues of homeland security by ensuringits personnel are properly equipped to face hazardous situations and unknown chemical andbiological agents.
Alan Hausman is a consultant to the Allegheny County Department of Emergency Servicesand the equipment manager for the Region 13 Terrorism Task Force. He has a long-standingrelationship with MSA, as the Task Force has relied on the company for safety equipment fromthe beginning.“Our first priority was respiratory protection,” said Hausman.“We’ve used theAdvantage® 1000 Gas Mask for years and are migrating to the new Millennium model.” Thegroup also uses MSA Photo Ionization Detectors that measure trace amounts of airbornevolatile organic compounds.
Involved in emergency management for more than 20 years, Hausman doesn’t compromisewhen it comes to purchasing safety equipment.“You never know what you’re walking into,”he says.“And while you hope it never happens, you must be prepared for the worst.”
Most recently, Hausman and the more than 725 Region 13 fire departments have turned to MSA’s Solaris Multigas Detector to help them assess emergency situations.“Our staff tested the Solaris and responded positively to its distinctive features such as ergonomics,backlighting and ease of operation,” said Hausman.“An emergency situation can become quiteintense with excessive noise and activity. Because the Solaris is easy to read and operate, itallows our personnel to quickly detect and monitor unknown gases in chaotic environments.”Hausman says this is critical to maximizing the safety of both responders and citizens.
“I’ve been at this for a long time,” Hausman commented.“I know what works.”
39451 MSA '03 Ann. Rpt NARR COM 3/25/04 10:58 AM Page 10

ALICE MARTIN Production Technician, MSA Instrument Division
11
Alice Martin, a 48-year veteran associate of MSA, is not surprised that the Region 13 Terrorism Task Force has opted for MSA’s new SolarisMultigas Detector. “We make some of the most durable and reliable products available,” she says.
Martin, a production technician, works in the Assemble-to-Order work cell for the Solaris line. She assembles products according to customer specifications, calibrates the final products and ships them out. Martin says, “Tell us how you want it, and we’ll make sure it works.”
For Martin, having a Passion for Safety means that the MSA products she helps produce must function exactly as designed every time. “Our products have to work as soon as a customer opens the box,” Martin says. “I’ve been here a long time and I’ve sent safety equipment all over the world to assist all types of customers. There’s a reason they come to us. We keep people safe.”
Martin recalls an instrument that was returned to MSA after being involved in a fire with temperatures approaching 1,600°F. “In my 48 yearsat MSA, I’ll never forget what that looked like. It was an unbelievable mess, but you know what? When I turned it on, it still worked. That’s areliable product.”
39451 MSA '03 Ann. Rpt NARR COM 3/25/04 10:58 AM Page 11

United States Army First Sergeant Colin Rich, a native of Raeford, North Carolina, traveled
nearly 10,000 miles from the Middle East to express his gratitude to the associates of MSA’s
Newport,Vermont manufacturing plant. He was grateful for the Advance Combat Helmet
(ACH) MSA produces there, because just seven months earlier one of those helmets saved his life in
Afghanistan.
Sgt. Rich is just one of the millions of people around the world who benefit from the Passion for
Safety that the 4,400 men and women of MSA bring to work each day.
Having a Passion for Safety is a principle of working life at MSA.You sense it in the engineering
labs and on the manufacturing floor; you hear it in the voice of the customer service representative
responding to a customer question; or see it in the dedication of the company’s field sales representa-
tives. It reflects a realization that what one contributes at MSA does matter, regardless of the position or
job function. It matters to the people who put their trust in MSA products to protect them on the job.
It matters to families of those people, who expect their loved ones to return home in the same condi-
tion they left.And it matters to the shareholders of MSA, who understand the company’s value propo-
sition and put their trust in MSA to achieve its mission.
To be sure, 2003 was a year of achievement for MSA on many fronts.
From a broad perspective, MSA’s success over the past year is attributable to initiatives begun years
ago aimed at positioning the company to become the leading safety equipment provider in markets
where the need is greatest – fire service, homeland security, federal government, international and the
consumer marketplace. In addition to reaching growth markets, MSA recognized the importance of
limiting the impact on the company of a sluggish economy in other markets by continuing efforts to
improve productivity, allowing MSA to make the most of these opportunities. Perhaps that is the single
greatest reason why, in these uncertain economic times, MSA was able to achieve record earnings and
record revenue growth while many companies struggled in 2003.
New Product DevelopmentWith an eye on growth markets, MSA relied on innovative and fast-to-market product development to
fuel expansion in 2003. Indeed, from a product development perspective, few companies in the safety
industry could match MSA’s achievements in 2003. In North America alone, sales from products intro-
duced in the past three years accounted for nearly one third of total North America revenue.
With an ever-present global threat of terrorism, MSA responded with new products that directly
benefited first responders in the fire service and law enforcement sectors.
As an example, MSA led the fire service industry in developing the first self-contained breathing
apparatus (SCBA) that met two new performance standards that captured significant industry attention
in 2003.The first standard, established by the National Fire Protection Association (NFPA), enhanced
SCBA performance for structural firefighting applications.
The second, set forth by the National Institute for Occupational Safety and Health (NIOSH), focused
on an issue of more growing concern: exposure to chemical, biological, radiological and nuclear agents
(CBRN).The NIOSH standard, which is voluntary and an add-on to existing NIOSH approval require-
ments, is arguably the most difficult SCBA test protocol ever adopted, due largely to the wide and
varied destructive characteristics of these lethal agents on equipment on which the user’s life depends.
Borrowing from decades of experience in developing advanced respiratory protection equipment
for the military and fire service, MSA won the race to gain both NIOSH CBRN and NFPA
The MSA Culture...A PASSION FOR SAFETY
12
During a visit to MSA’s Newport, Vt. production facility, U.S. Army FirstSergeant Colin Rich, top right, expresses his appreciation to MSA associateCharles Geraw for his role in producingthe Advanced Combat Helmet that savedRich’s life in Afghanistan.
Above, MSA associates Holly Boucher,left, and Abby Smith complete strapassembly for a new shipment ofAdvance Combat Helmets for the U.S.Army. Associates at the Vermont plantachieved remarkable production levelsin 2003 to meet and exceed the Army’sdelivery goals.
39451 MSA '03 Ann. Rpt NARR COM 3/25/04 10:58 AM Page 12

In 2003, MSA reaffirmed its leadership position indeveloping products that meet and exceed new performance standards. The MMR EXTREME® AirMask, left, was the first SCBA to not only meet new fire service industry requirements but also be approved for protection against chemical, bio-logical, radiological and nuclear agents (CBRN).The Millennium® Gas Mask, far left, followed suitin early 2004 as the industry’s first gas maskapproved for CBRN protection.
13
certifications for its line of MMR EXTREME Air Masks.
Undergoing stringent, live-agent testing, MSA Air Masks were the
first to be certified to the latest NFPA requirements and deemed
suitable for use in situations involving CBRN agents.Today, one
third of all SCBAs produced by MSA are NFPA and CBRN
compliant, and this number continues to grow.
Utilizing this expertise, MSA quickly followed this achievement
with development of the first gas mask to meet new CBRN test
criteria for air-purifying respirators. In fact, MSA engineers and
technical associates – working closely with the safety industry’s
leading trade association – offered expertise to help guide develop-
ment of the standard itself.With a final standard in place, MSA sub-
mitted the Millennium facepiece and CBRN canister to NIOSH
for testing on March 24 – the first day submittals were accepted.
Only recently did MSA learn its gas mask was the first to pass
muster.With this accomplishment, the company is now positioned
as the first manufacturer capable of offering first responders this
level of CBRN protection.
Thermal Imaging LeadershipIn 2003, MSA also set performance benchmarks for thermal
imaging camera technology.Thermal imaging cameras, also known
as TICs, utilize infrared sensing technology to enable firefighters to
see through smoke and darkness, locate trapped victims, pinpoint
the source of a fire to better combat it, or help firefighters exit
from a fire as needed. In short, MSA TICs are the latest develop-
ment in advanced fire fighting equipment (see story on Titusville,
Pa. Fire Department, page 6).
MSA pioneered development of the first hand-held TIC in the
late 1990s. Since then, the company has established itself as the
leader in TIC technology with a product brand recognized for
exceptional durability and quality.
The Evolution 5000 is the company’s newest generation ther-
mal imaging camera.Weighing 50 percent less than its predecessor,
and costing half as much, the Evolution 5000 TIC is the first small-
format thermal imager to deliver a screen resolution equal to if not
better than larger, heavier cameras. It features leading-edge sensing
technology with advanced MSA features, including spot tempera-
ture measurement and a convenient vehicle-mounted charging unit.
In head-to-head “live fire” evaluations with competitive products,
the Evolution 5000 TIC was consistently the top performer in
2003.This performance resulted in MSA acquiring more orders
and shipping more cameras in 2003 than in any other previous year.
The NFPA-compliant and CBRN-certified breathing apparatus,
new air-purifying respirators, and thermal imaging cameras were all
substantial contributors to MSA business growth over the past year.
Among the major SCBA orders MSA secured in 2003 were con-
tracts with some of the largest municipal fire departments in North
America as well as the U.S. Department of Defense.
The Evolution® 5000 Thermal Imaging Camera helped MSA distance itself from thecompetition in 2003. Compact, lightweight and extremely durable, this next genera-tion camera delivers image clarity never before seen in a small-format TIC.
39451 MSA '03 Ann. Rpt NARR COM 3/25/04 10:58 AM Page 13

The technological advancements in air-purifying respirators previously described also helped
generate robust sales of gas masks and other respirators to the law enforcement market. Notable users
of these products in 2003 included the New York City transit police, the state of Connecticut, and
the City of New York. Overall, gas mask sales in 2003 grew 43 percent from the previous year.
In the air-purifying respirator arena, MSA also helped combat the frightening outbreak of
SARS in Asia and in Canada. Just as MSA has responded in previous times of emergency,
associates worked closely with government officials in these countries to provide respirators to
the medical community.
MSA’s timely development and introduction of these products are not just important for growth,
but they are critically important to first responders throughout the world – firefighters, police officers
and emergency medical technicians – who rely on MSA innovation, quality products and training to
protect them in the event of a terrorist attack or other national emergency.
Keeping Tradition AliveWhile products designed for first responders commanded much of MSA’s attention in 2003, the
company also worked to advance products required in everyday applications in the fire service and
general industry. The new Cairns 880 Tradition Fire Helmet, developed and introduced in the third
quarter, is a perfect example.
This historically popular, traditional-style helmet was discontinued more than a decade ago due to
changes in NFPA requirements. However, by combining the latest in high performance thermal and
impact resistant materials with advanced design techniques, MSA’s 880 Tradition project team was able
to develop a state-of-the-art helmet that bridges the gap between traditional designs and advanced
protection.The result is a helmet that’s 48 percent smaller and 20 percent less costly than competitive
models. More simply, it’s the lightest traditional fire service helmet available today.
While firefighters enjoyed the comfort features of the 880 Tradition Helmet, workers in industrial
environments benefited from a “cool” new helmet that is a tribute to MSA global resources. As its
name implies, the V-Gard Advance hardhat is the next generation of MSA’s flagship product first
introduced in the late 1960s. Based on a very successful design originating from MSA Australia, the
Advance Helmet sports a vented top to promote cooling. However, to gain broad acceptance of this
product in a price competitive market, manufacturing costs needed to be reduced. Contributions
came from manufacturing engineers in the U.S., who enabled the product to be produced utilizing
innovative press processes in MSA’s Murrysville, Pa., plant.
The U.S.-produced V-Gard Advance Helmet achieved a 10 percent weight reduction and a 31
percent cost reduction, demonstrating MSA global strengths in design and manufacturing expertise.
A Soldier’s StoryPerhaps no other head protection system made headlines in 2003 like MSA’s Advanced Combat
Helmet – a key product innovation that is helping protect American forces combating terrorism.
Known as the ACH with Modular Integrated Communications system, it has been credited with
saving soldiers’ lives during combat operations in Iraq and Afghanistan, including that of First
Sergeant Colin Rich of the 82nd Airborne Division, mentioned at the beginning of this report.
Sgt. Rich was on duty in Afghanistan in early 2003 when his unit was ambushed by terrorists
posing as allies. On a mission to destroy two Taliban positions, Rich was struck in the back of the
The MSA Culture...A PASSION FOR SAFETY
14
MSA took a “back-to-the-future” approach in developing the Cairns 880 Tradition™ FireHelmet, below. What resulted is a helmet thatcombines the best of both worlds: advanced,lightweight protection with a “traditional look”preferred by many U.S. firefighters.
Keeping a cool head is what the new V-Gard® Advance® Hardhat, above, is allabout. Featuring design input from MSAAustralia, this U.S. produced product isquickly gaining market acceptanceamong workers exposed to hot, humidenvironments.
39451 MSA '03 Ann. Rpt NARR COM 3/25/04 10:58 AM Page 14

15
head with a sniper’s shot, but survived because of his ACH. Upon returning to the U.S., Rich made it a point to visit MSA’s factory in Vermont
to personally thank the employees for helping save his life. MSA associates there were equally pleased to thank him and his fellow soldiers for
their great efforts and sacrifices.
Derived from MSA’s acquisition of Gallet in 2002, the ACH was originally designed for U.S. Special Forces units but has since become
the helmet of choice by U.S.Army personnel involved in Afghanistan and Iraq.The helmet’s unique retention and suspension system gives
maximum balance, stability and comfort, while providing the proper size, fit and ventilation.
It’s become such a staple of the U.S. soldier’s arsenal that the U.S.Army Material Command named it one of the greatest inventions of 2002
based on evaluations by six active Army Divisions and the U.S.Army Training and Doctrine Command. In accepting this honor, Ron Herring, Jr.,
vice president and general manager of MSA’s Safety Products Division, said the recognition is a testimony to the quality, reliability and durability
of the products MSA produces every day, and to the commitment and Passion for Safety demonstrated by all MSA associates.
Closer to the home front, new product development also helped MSA’s fall protection group fulfill opportunities over the past year.
Impressively, 28 percent of 2003 fall protection sales were from products developed just over the past three years, including the versatile
Aptura™ SRL and TechnaCurv™ harnesses, both of which exceeded sales goals in their first year of availability.
Other new fall protection products that made an impact in 2003 included the FP5K Tieback Snaphook and Lanyard and PointGard™ Anchor.
A “Stellar” Performance in InstrumentationIn 2003, MSA’s Instrument Division defined its Passion for Safety two ways: innovation and speed to market. Impressively, the Instrument
Division improved on-time delivery performance to more than 97 percent – among the finest by any operating unit in MSA North America.
But above all, 2003 will be remembered as the year MSA’s instrument professionals established a new benchmark for new product develop-
ment (NPD).Their challenge? Develop a new low-cost multigas detector that outpaced the competition in terms of performance, durability and
cost – and have it ready in less than a year to meet rapidly intensifying competition.
With a global, multi-functional team in place, the Instrument Division launched its most significant 2003 NPD project – the Solaris®
Multigas Detector.
An affordable, durable and easy-to-use device, the Solaris Detector is one of the smallest and lightest four-gas monitors available today. Designed
for first responders and workers in the chemical, construction, mining, oil and gas, and telecommunications industries, the Solaris unit detects the
presence of O2, H2S, CO and combustible gas. But what truly differentiates it from the competition, aside from its affordability, is its unobtrusive,
lightweight design that doesn’t interfere with a user’s range of motion, making the product comfortable enough to be worn all day long.
The list of accomplishments associated with the development of the Solaris Detector is substantial. For example:
• The Solaris Detector went from concept-to-customer in a record ten months.
• Its value proposition is unmatched (and easy to remember) – “half the size at about half the price.”
• The global development team came to within two percent of its established cost target.
• The Solaris Detector is proving to be highly successful in the field – the most important measure of NPD success.
With these accomplishments, the Solaris Detector proved to be a significant contributor to MSA’s top line in 2003,
particularly in Canada where MSA established a special distribution agreement with Acklands-Grainger. Remarkably,
Acklands-Grainger achieved its six-month Solaris sales goals in less than two.
In the permanent instruments market, gains were more challenging to come by, given the economic recession
that has restricted capital expenditures and related large projects – a critical driver for permanent instrument sales.
Yet, the MSA Instrument Division made real progress into 2003 due in part to such products as the Ultima X line of sensors, which feature
an innovative “disconnect under power” feature.This MSA exclusive allows users to change individual sensors in hazardous atmospheres without
having to cut off power to the entire sensing system. In addition to convenience, the benefit of this technology is that it enables personnel to
perform sensor maintenance without compromising protection in other areas monitored by the system. It’s a remarkable feature and one that
further distances MSA from the competition.
at,
ok”
Sizeable orders for MSA Gallet firefighter helmets helpedMSA Europe turn in a strong performance in 2003. At left,members of the Stratchclyde Fire Brigade in GlasgowScotland proudly display their new F1 Helmets. Shown,from left, are officer Ian Clark, procurement manager David Anderson and officer James Anderson.
A technology transfer agreement with Spectronix Ltd.,negotiated in 2003, enhances MSA’s ability to serve the oilproduction industry with advanced infrared detection systemsfor monitoring potentially hazardous environments.
Ultima® XE Sensor
39451 MSA '03 Ann. Rpt NARR COM 3/25/04 10:58 AM Page 15

International PerformanceAt MSA, having a Passion for Safety knows no borders. Indeed, this passion helped drive positive results among nearly all of MSA’s global
operations in 2003.
In particular, MSA Australia delivered remarkable performance in 2003, adding 24 percent sales growth driven largely by increased
demand from the fire service market. In fact, fire brigades in Australia are among the most recent beneficiaries of new advancements in
MSA firefighter head protection – the 660CAS Metro Helmet.
The 660CAS Metro helmet was designed specifically to meet requirements of the New South Wales Fire Brigade – one of the 10
largest fire departments in the world. MSA associates there demonstrated their Passion for Safety by detailing the design for the 660CAS
Metro, executing in-house qualification tests, constructing a new mold and achieving certification to Australian standards – all in a remark-
able five months.This coordinated effort resulted in an order for 7,000 helmets.
Performance in the Pacific Rim was also strengthened by MSA Japan, which achieved a 17 percent increase in revenue while establish-
ing what promises to be a mutually rewarding relationship with one of Japan’s largest safety distributors, Midori. In 2003, the company
was also pleased to “plant a flag” in a new country, Malaysia, to serve that diverse and growing market.
In South America, the company saw robust performance by MSA Argentina, with strong recoveries by MSA Chile and MSA Peru,
both of which managed successful transitions to new leadership. Solid results were also achieved by MSA Brazil.
In the Middle East, MSA revenues were bolstered by significant business gains generated through sales of head protection products
derived from the acquisition of Gallet.Additionally, the company recently gained a large upgrade order for permanent instruments to
Qatar Petroleum.
MSA Gallet’s contributions in 2003 were particularly evident in Europe where helmet sales helped offset the impact of an ongoing
sluggish economy, enabling MSA Europe to record an overall increase in sales. European fire brigades – particularly those in France –
turned to MSA Gallet for the latest in firefighter head protection.
Through our associates in Europe, MSA was also able to negotiate in 2003 a promising technology transfer agreement with
Spectronix Ltd. Under the agreement, the two companies will share technology and production expertise for detection systems that
incorporate open-path infrared (OPIR) and IR3 technologies. Extremely versatile, these systems utilize infrared optics to detect potentially
hazardous conditions across distances as far as 130 yards (approximately 120 meters), making them ideal for use in such places as storage
vessels, refineries, pipelines and ventilation ducts.
These technologies were first used in the oil production industry, primarily in offshore drilling platforms to alert personnel of the
presence of potentially hazardous situations.Today, the technology is finding broad application in refineries, chemical plants, petrochemical
facilities, the transportation industry and pharmaceutical production.
With this alliance MSA and Spectronix strengthen their presence in the fire, gas and safety systems marketplace by adding cutting-edge
OPIR and flame-detection technologies as new core competencies for personal and plant-wide protection.
Among the products MSA expects to market under the alliance are the SafEye® 700 Xenon System and the FlameGard® IR3 XI Detector.
Over the past year, MSA Europe also significantly enhanced its position as a leader in thermal imaging cameras for the fire service
market by gaining numerous, significant orders.The company was pleased to announce in December that delivery time for TICs, widely
sought by European fire brigades, is being significantly reduced as a result of a new export license attained by MSA in the U.S.
The license covers export of the Evolution 5000 TIC to governmental fire brigades. In short, it allows MSA Europe greater access
to TIC inventory in order to provide European fire service customers with the timely delivery they have been seeking for these life-
saving TICs.
Fire brigades in Spain also turned to MSA in 2003 for leading edge personal protective equipment, including SCBA and firefighter
helmets from MSA Gallet. In fact, sales of SCBA accounted for one fourth of MSA Spain’s annual sales, helping generate overall revenue
growth of 26 percent.An increased emphasis on distributor sales, along with a stronger presence in the Portuguese market, served to
further enhance MSA Spain’s performance. Ultimately, these initiatives led to greater sales activity in such key markets as chemicals,
petrochemicals and the general industry sector.
The MSA Culture...A PASSION FOR SAFETY
16
39451 MSA '03 Ann. Rpt NARR COM 3/25/04 10:58 AM Page 16

17
MSA at HomeBringing a Passion for Safety home has been the driving focus of MSA Safety Works since the unit’s inception in 1999.As the
company’s consumer products arm, the group achieved meaningful growth in 2003 while building greater brand awareness and
enhancing consumer safety education.
Among the group’s achievements were 19 new product introductions, adding a strong rental channel of distribution with 140 new
outlets, and strengthening business with the addition of several new retail partners.
Following the adage that better service almost always leads to more sales, MSA Safety Works concentrated on improving its already
strong record for outstanding customer service. In 2003, the consumer business group successfully trained and supplied pertinent product
information to all industrial customer service associates, enabling them to respond to consumer questions quickly and with confidence.
The result? Ninety-eight percent of all calls were answered within four rings, with the vast majority answered on the first ring.
The hard-to-overlook MSA Safety WorksLearning Center, below, served as home base for MSA’s consumer safety educa-tion outreach efforts in 2003. Through aseries of fun, interactive demonstra-tions, kids and parents learned aboutthe many home-related hazards thatoften get overlooked.
39451 MSA '03 Ann. Rpt NARR COM 3/25/04 10:58 AM Page 17

MSA Safety Works also continued its commitment of taking
safety education “on the road” with its development of an eye-
catching and interactive Home Safety Learning Center.An
important new element of the Safety Works’ consumer safety
awareness program, the 25' by 37' by 18' inflatable structure visited
seven cities in the eastern U.S., generating “inflated” awareness of
safety issues within key MSA markets.
Supporting this education effort, MSA Safety Works’ highly
customized Volkswagen “Safety Bug” also took to road again in 2003.
Touring 30-plus cities, the “Bug” resulted in an impressive store
satisfaction score of 6.89 out of 7 based on retailer survey data.
A Year of AchievementTo be sure, MSA’s market presence in 2003, be it in the home, at a
fire, in a mine, on the battlefield or inside an industrial plant, has
never been greater.The drivers of this growth have been consistent
product demand from the fire service, homeland security and mili-
tary sectors in the U.S., and from industrial customers outside of the
U.S. and Europe.
Demand, however, is just part of the equation. MSA associates have a true Passion for Safety.
Their commitment to improve MSA, to make the company more competitive, to develop and
manufacture innovative and leading-edge products that meet customer needs, and to reach markets
that have the greatest need and opportunity, is the true driver of success.
For all of MSA’s accomplishments over its history, the company was recognized in 2003 by the
Newcomen Society of the United States for outstanding business achievement.The award, which has
been presented annually to select companies since the Society’s founding in 1923, recognizes signifi-
cant achievement by private institutions in the American free enterprise system.
In his presentation to MSA, Leighton Wildrick, president and CEO of the Newcomen Society,
commented,“MSA’s mission to protect the health and safety of people throughout the world began
in 1914 when the company’s founders convinced Thomas Edison to develop the first battery-
powered miner’s cap lamp that greatly reduced the risk of explosion in coal mines. Over these many
decades, MSA has stayed true to that mission and today protects life in virtually every industry and
anywhere people are at risk.”
This recognition is a tribute to the many fine people, past and present, who have served MSA as
associates and have consistently demonstrated a Passion for Safety and commitment to protecting
life. It is a passion driven by the knowledge that what one does at MSA – on any given day – could
make a lifetime of difference for another.The company’s success over the past year is a tribute to
these individuals and to MSA customers throughout the world who put their trust in MSA…
every day.
18
The MSA Culture...A PASSION FOR SAFETY
Enclosed with this report is areview of MSA’s history given onthe occasion of the NewcomenAward presentation. It provides aretrospective look at how MSA’sPassion for Safety emerged fromthe very beginning and has continuedover these many decades.
MSA chairman and CEO John T. Ryan III, left, accepts the Newcomen Award for outstanding business achieve-ment from Leighton Wildrick,president and CEO of theNewcomen Society of the United States.
39451 MSA '03 Ann. Rpt NARR COM 3/25/04 10:58 AM Page 18

2003 FINANCIAL CONTENTS
Management’s Discussion and Analysis 20
Responsibility Statements 26
Consolidated Statement of Income 27
Consolidated Balance Sheet 28
Consolidated Statement of Cash Flows 29
Consolidated Statement of Changes in Retained Earnings and Accumulated Other Comprehensive Income 30
Notes to Consolidated Financial Statements 31
Summary of Selected Financial Data 41
19
39451 MSA '03 Ann. Rpt NARR COM 3/25/04 10:58 AM Page 19

20
Forward-looking StatementsThe following discussion should be read in conjunc-
tion with the consolidated financial statements containedin this Annual Report to Shareholders. Certain state-ments contained in this discussion and elsewhere in thisreport may constitute forward-looking statements withinthe meaning of the Private Securities Litigation ReformAct of 1995.These forward-looking statements involve anumber of risks, uncertainties and other factors thatcould cause actual results to differ materially fromexpectations contained in such statements.
Factors that may materially affect financial conditionand future results include: global economic conditions;the impact of unforeseen economic and politicalchanges, including the threat of terrorism and its poten-tial consequences; the timely and successful introductionof new products; the availability of funding in the fireservice, military, and homeland security markets; fluctua-tions in the cost and availability of key materials andcomponents; the company’s ability to generate sufficientcash flow to support capital expenditures, debt repay-ment, and general operating activities; the company’sability to achieve sales and earnings forecasts; and interestand currency exchange rates.
The foregoing list of important factors is not exclusive.The company undertakes no obligation to publiclyupdate or revise its forward-looking statements.Critical Accounting Policies and Estimates
MSA prepares its consolidated financial statements inaccordance with accounting principles generally acceptedin the United States of America.The preparation of thesefinancial statements requires MSA to make estimates andjudgements that affect the reported amounts of assets, lia-bilities, revenues and expenses, and the related disclosures.MSA bases its estimates and judgements on historicalexperience and various other assumptions that arebelieved to be reasonable under the circumstances, theresults of which form the basis for making judgementsabout the carrying values of assets and liabilities that arenot readily apparent from other sources. MSA evaluatesthese estimates and judgements on an on-going basis.Actual results may differ from these estimates andjudgements.
MSA believes the following critical accounting policiesaffect the more significant estimates and judgements usedin the preparation of the financial statements. MSArecognizes revenue from the sale of products when title,ownership, and risk of loss pass to the customer. MSArecords estimated reductions to sales for customer pro-grams including volume-based incentives. If marketconditions were to change the amounts due to customersunder these programs could differ from the recorded esti-mates. MSA maintains allowances for doubtful accountsfor estimated losses resulting from the inability of its cus-tomers to make required payments. If the financial condi-tion of MSA’s customers were to deteriorate, resulting inan impairment of their ability to make payments, addi-tional allowances could be required. MSA provides for theestimated cost of product warranties at the time that sales
are recognized.While MSA has extensive product qualityprograms and processes, the company’s warranty obliga-tion is affected by product failure rates, material usage, andservice delivery costs incurred in correcting a productfailure. Should actual product failure rates, material usage,or service delivery costs differ from MSA’s estimates,revisions to the estimated warranty liability would berequired. MSA maintains reserves covering the uninsuredportion of product liability claims.These reserves arebased on management’s evaluation of known claims andactuarial valuations. Should actual claims be greater thanMSA’s estimates, additional product liability charges couldbe required. MSA writes down its inventory for estimatedobsolescence or unmarketable inventory equal to thedifference between the cost of the inventory and theestimated market value based on assumptions about futuredemand and market conditions. If demand and actualmarket conditions were less favorable than those projectedby management, additional inventory write-downs couldbe required. MSA records an estimated income tax liabilitybased on management’s best judgement of the amountslikely to be paid in the various tax jurisdictions in whichit operates.The tax liabilities ultimately paid are depen-dent on a number of factors, including the resolution oftax audits, and may differ from the amounts recorded.Taxliabilities are adjusted through income when it becomesprobable that the actual liability differs from the amountrecorded.Actuarial assumptions have a significant impacton the determination of net periodic pension costs andcredits. If actual experience differs from these assump-tions, future net periodic pension costs and credits couldbe adversely affected.
Significant accounting policies are described in note 1to the consolidated financial statements.Subsequent Event – 3-for-1 Common Stock Split
As more fully described in note 2, the company’scommon stock split 3-for-1 on January 28, 2004.All shareand per share information in this Management Discussionand Analysis and throughout this annual report to share-holders has been adjusted to reflect the split.Results of Operations
Overview – MSA is committed to being the premierworld-wide provider of a full line of products thatenhance the safety and health of workers. In recent yearsthe company has concentrated on specific initiativesintended to help us meet this commitment and improveour competitive position and profitability by developinginnovative new products, by acquiring companies andtechnologies that expand and complement our productlines, by entering emerging geographic markets wherewe believe there are opportunities to meet an unan-swered demand for safety products, and by emphasizingoperational excellence.
To sharpen our focus on our core safety products busi-ness, in November 2002 we announced our decision toexplore the potential sale of Callery Chemical, our onlynon-safety products business unit.As discussed in the fol-lowing section, this division was sold in September 2003.
MANAGEMENT’S DISCUSSION AND ANALYSIS
39451 MSA Financials 10F COMBO. 3/25/04 10:52 AM Page 20

21
In 2003, the company achieved record sales and netincome from continuing operations for the third consec-utive year.We believe that this performance and ourimproving financial performance in recent years are theresult of initiatives that have allowed us to anticipate andrespond quickly to market demand, particularly in theU.S. fire service, homeland security and military markets.Sales growth in the fire service market reflects our abilityto quickly bring to market products that comply withchanging industry standards and to create new marketdemand with innovative products like the Evolution5000 hand-held thermal imaging camera, which is oneof the smallest and lightest on the market. In addition,the company has successfully responded to increasedhomeland security and military market demand for prod-ucts such as the Millennium and MCU 2/P gas masksand the Advanced Combat Helmet that has occurredsince the September 11th attacks and during the ongoingwar on terrorism. Demand in these markets has morethan offset continuing sluggishness in North Americanindustrial markets.The level of demand for our productsin the U.S. fire service, homeland security and militarymarkets is strongly influenced by the levels of govern-ment funding available to address the needs of firstresponders and to meet the requirements of militaryoperations.A reduction in available government fundingin the future could adversely affect the demand for ourproducts in these markets.
Our results in Europe improved modestly in 2003, butcontinue to suffer from the effects of the poor economicclimate in Western Europe.The acquisition of MSAGallet in 2002 added the leading line of Europeanfirefighter head protection to our product line and hashelped improve our overall performance in Europe. Inother international markets, 2003 results were generallyhigher in most markets, but particularly Australia andLatin America.These improvements reflect focusedefforts to effectively reach customers and, particularlyin Latin America, improvements in general economicconditions.
Discontinued Operations – On September 12, 2003, thecompany sold its Callery Chemical Division to BASFCorporation. In accordance with accounting principlesgenerally accepted in the United States of America, theoperating results of the Callery Chemical Division andthe gain on the sale to BASF Corporation have beenreported as discontinued operations in the consolidatedstatements of income.The net assets of the division havebeen classified as assets held for sale in the consolidatedbalance sheets.
Discontinued operations, for which further informa-tion is included in note 17, reported sales of $21.3 mil-lion, $29.5 million, and $33.1 million and net income of$2.7 million, $3.9 million, and $5.8 million for the yearsended December 31, 2003, 2002, and 2001, respectively.Discontinued operations for the year ended December31, 2003, represent operating results of the CalleryChemical Division through the date of sale. The sale ofthe division to BASF Corporation resulted in an after-tax gain of $13.7 million.
At December 31, 2003, approximately $2.3 million oftrade receivables related to the Callery operation werereported as assets held for sale.A substantial portion ofthis balance was collected in January and February 2004.
The after-tax proceeds of $53.8 million received fromthe sale of the division and the subsequent liquidation ofnet assets retained by the company were distributed toshareholders on November 24, 2003 and charged toretained earnings as a capital distribution.
Continuing Operations – 2003 versus 2002 – Salesfor 2003 were $696.5 million, an increase of $132.1million, or 23%, from $564.4 million in 2002.
Sales by North American operations were $452.6 mil-lion in 2003, an increase of $82.9 million, or 22%, from$369.7 million in 2002.The sales improvement occurredin the United States and is largely related to highershipments of self-contained breathing apparatus andthermal imaging cameras to the fire service market andof gas masks and ballistic helmets to military and home-land security markets. Sales of instruments and fallprotection equipment were flat, reflecting continuedsluggishness in industrial markets.
During 2003, the company changed its standard shippingterms to U.S. distributors.The effect of this change was todelay revenue recognition on the affected shipments, whichreduced current year sales and gross margins by approxi-mately $4.7 million and $2.7 million, respectively.
Sales by European operations were $146.2 million in2003, an increase of $23.8 million, or 19%, from $122.4million in 2002.The sales increase in 2003 includes a fullyear of sales by MSA Gallet, which was acquired duringthe second quarter of 2002.When stated in U.S. dollars,approximately half of the sales increase in Europe wasdue to the favorable currency translation effects of thestronger Euro.
Sales by international operations were $97.7 million in2003 compared to $72.2 million in 2002, an increase of$25.5 million, or 35%.The sales improvement occurredprimarily in Australia, on higher shipments of breathingapparatus to the Australian Navy, and in Latin America.Approximately one-third of the increase in Internationalsales, when stated in U.S. dollars, was due to the favorablecurrency translation effects of a stronger Australian dollarand South African Rand.
Gross profit for 2003 was $288.3 million, an increase of$55.1 million, or 24%, from $233.2 million in 2002.Theratio of gross profit to sales was steady at 41.4% in 2003compared to 41.3% in 2002.
Selling, general and administrative expenses in 2003were $170.1 million, an increase of $29.2 million, or21%, from $140.9 million in 2002.Approximately half ofthe increase was related to higher marketing and sellingexpenses required to support the significant sales growthin North America.The remainder of the increaseoccurred in Europe, and reflects the inclusion of a fullyear’s expenses for MSA Gallet, which was acquired inthe second quarter of 2002, and the currency exchangeeffect of a stronger Euro. Selling, general and administra-tive expenses were 24.4% of sales in 2003 compared to25.0% of sales in 2002..
39451 MSA Financials 10F COMBO. 3/25/04 10:52 AM Page 21

22
The effective income tax rate, for which further infor-mation is included in note 5, was 33.7% in 2003 and35.1% in 2002.The effective tax rate in 2003 was lowerthan the U.S. statutory income tax rate due in part to thefavorable effect of research and development credits andthe one-time effect of releasing $1.2 million of previously-established valuation allowances on foreign tax creditcarry forwards.These valuation allowances were releasedin 2003 as a result of tax planning strategies that wereimplemented during the year and an improved outlookfor foreign source income.The company has maintainedtax reserves established in prior years on research anddevelopment credits that were claimed in tax years thatare currently being examined by the Internal RevenueService. Management is cautiously optimistic that afavorable settlement of these examinations could bereached in late 2004.
Net income from continuing operations was $48.9million in 2003, an increase of $17.7 million, or 57%,over 2002 net income from continuing operations of$31.2 million. Continuing operations basic earnings pershare of common stock improved to $1.33 in 2003compared to 85 cents in 2002.
Continuing Operations – 2002 versus 2001 – Sales for2002 were $564.4 million, an increase of $54.7 million,or 11%, from $509.7 million in 2001.
Sales by North American operations were $369.7 mil-lion in 2002, an increase of $26.1 million, or 8%, from$343.6 million in 2001.The sales improvement occurredin the United States and is largely related to higher ship-ments of gas masks to the military and homeland securitymarkets. Sales to the fire service market were relatively flatyear-to-year with increased shipments of self-containedbreathing apparatus being offset by lower shipments ofthermal imaging cameras.Thermal imaging camera salesare dependent on the level of federal government fundingprovided to local fire departments. During 2002 much ofthis funding was diverted to meeting homeland securityrequirements. Sales of instruments and fall protectionequipment were slightly lower in 2002.
Sales by European operations were $122.4 million in2002, an increase of $28.2 million, or 30%, from $94.2million in 2001.A significant portion of the improve-ment was due to the acquisition of MSA Gallet duringthe second quarter. European sales also benefited fromstrong shipments of escape breathing devices for use inthe merchant marine fleet.
Sales by international operations were $72.2 million in2002 compared to $71.7 million in 2001, an increase of$471,000, or 1%. Local currency sales growth of approxi-mately 7% was largely offset by unfavorable currencytranslation effects when stated in U.S. dollars. Substantiallocal currency sales growth was achieved in Africa, Brazil,and Australia.
Research and development expenses were $21.7 mil-lion in 2003, an increase of $1.3 million, or 6%, from$20.4 million in 2002. Research and development activi-ties are performed primarily in the U.S and Europe.
Depreciation and amortization expense was $23.2million in 2003, a increase of $1.7 million, or 8%, from$21.5 million in 2002.The increase was due to the inclu-sion of a full year of depreciation for MSA Gallet, whichwas acquired during the second quarter of 2002, andregular asset additions.
Cost of products sold and operating expenses in 2003were favorably affected by a change in the vacation vest-ing policy for U.S. employees. Under the vacation vestingpolicy adopted in 2003, employees earn their vacationentitlement during the current year. Previously, vacationwas vested on the last day of the prior year. The policyresulted in favorable adjustments to cost of products soldand operating expenses during 2003 of $3.6 million and$1.8 million, respectively. The vacation policy waschanged to align the year the benefit is earned with theyear it is received.
Cost of products sold and operating expenses includenet periodic pension benefit costs and credits.Asdescribed in note 7, pension credits, combined with pen-sion costs, resulted in net pension credits of $8.8 millionin 2003 and $13.1 million in 2002. Net pension credits of$10.8 million in 2003 include a $2.0 million curtailmentgain that was related to the sale of the Callery ChemicalDivision and is reflected in net income from discontinuedoperations.The current recognition of pension income isprimarily the result of the exceptional investment perfor-mance of the U.S. pension fund over the past ten years.During that period, the investment performance of theMSA Noncontributory Pension Fund has ranked amongthe top 1% of all U.S. pension funds. Future net pensioncredits can be volatile depending on the future perfor-mance of plan assets, changes in actuarial assumptionsregarding such factors as the selection of discount ratesand rates of return on plan assets, changes in the amorti-zation levels of actuarial gains and losses, plan amend-ments affecting benefit pay-out levels, and profile changesin the participant populations being valued. Changes inany of these factors could cause net pension credits tochange.To the extent net pension credits decline in thefuture, income would be adversely affected.
Interest expense in 2003 was $4.6 million compared to$4.8 million in 2002.The decrease relates to reductions inlong term debt and lower average short term borrowings.
Currency exchange gains of $3.4 million were recordedin 2003 compared to gains of $191,000 in 2002.Currency exchange gains in 2003 were primarily relatedto Euro and Canadian dollar denominated assets held bythe U.S. company, and reflect a significant strengtheningof those currencies during the year.
Other income, for which further information isincluded in note 12, was $1.7 million in 2003 comparedto $2.3 million in 2002.
MANAGEMENT’S DISCUSSION AND ANALYSIS
39451 MSA Financials 10F COMBO. 3/25/04 10:52 AM Page 22

23
Gross profit for 2002 was $233.2 million, an increase of$16.4 million, or 8%, from $216.8 million in 2001.Theratio of gross profit to sales was 41.3% in 2002 comparedto 42.5% in 2001.The lower gross profit percentage islargely related to sales mix changes and somewhat lowergross margins in North American industrial markets.
Selling, general and administrative expenses increased$10.8 million, or 8%, to $140.9 million in 2002, butdecreased as a percent of sales to 25.0% in 2002 com-pared to 25.5% in 2001.The increase in selling, generaland administrative expenses occurred in North Americaand Europe and reflects costs associated with higher salesvolumes, higher insurance costs, and the acquisition ofMSA Gallet.
Research and development expenses in 2002 were $20.4million, an increase of $3.7 million, or 22%, from $16.7million in 2001.These expenses relate to safety productsequipment research and development activities conductedprimarily in the U.S. and Europe.The increase reflectshigher research and development costs in the U.S. and theacquisition of MSA Gallet in the second quarter of 2002.
Depreciation and amortization expense was $21.5 mil-lion in 2002, a decrease of $1.1 million, or 5%, from$22.6 million in 2001.As required by FAS No. 142,goodwill amortization was discontinued at the beginningof 2002. Goodwill amortization expense was $2.2 mil-lion in 2001.The decrease associated with the absenceof goodwill amortization in 2002 was partially offset bythe inclusion of MSA Gallet depreciation following itsacquisition and regular asset additions.
Cost of products sold and operating expenses includenet periodic pension benefit costs and credits.Asdescribed in note 7, pension credits, combined with pen-sion costs, resulted in net pension credits of $13.1 millionin 2002 and $15.0 million in 2001.
Interest expense in 2002 was $4.8 million compared to$5.3 million in 2001.The decrease relates to reductionsin long term debt.
Currency exchange gains of $191,000 were recordedin 2002 compared to a loss of $1.2 million in 2001.Thefavorable swing was primarily due to the strengthening ofthe Euro during 2002.The most significant losses fromcurrency valuation changes in 2001 related to the strength-ening of the U.S. dollar against the Canadian dollar.
Other income, for which further information isincluded in note 12, was $2.3 million in 2002 comparedto $2.8 million in 2001.
The effective income tax rate, for which further infor-mation is included in note 5, was 35.1% in 2002 and40.7% in 2001.The effective tax rate in 2002 was sub-stantially the same as the U.S. statutory income tax ratedue to favorable tax effects associated with the charitabledonation of property and adjustments to prior year taxprovisions, net of valuation allowances taken on deferredtax assets.The 2001 rate was higher than the U.S. statutoryincome tax rate due to the recognition of a valuationallowance on deferred tax assets related to foreign taxcredit carry-forwards in the U.S. and improved earningsin high tax rate countries.
Net income from continuing operations was $31.2million in 2002, an increase of $5.4 million, or 21%, over2001 net income from continuing operations of $25.9million. Continuing operations basic earnings per shareof common stock improved to 85 cents in 2002 com-pared to 72 cents in 2001.Liquidity and Financial Condition
The main sources of liquidity for the company are cashgenerated from operations and borrowing capacity.Thecompany’s principal liquidity requirements are for workingcapital, capital expenditures, and principal and intrest pay-ments on outstanding indebtedness.
Cash and cash equivalents increased $36.8 million dur-ing 2003, compared to an increase of $9.8 million in 2002.
Continuing operations provided cash of $32.5 millionin 2003 compared to providing $43.0 million in 2002.Higher net income from continuing operations in 2003was more than offset by increases in net operating assets.In 2003, increases in receivables used cash of $27.0 mil-lion compared to using $3.0 million in 2002. Increases ininventories during 2003 used $3.2 million compared toinventory reductions in 2002 which provided $5.5 mil-lion in cash.Trade receivables related to continuing oper-ations were $89.9 million at December 31, 2003.Tradereceivables for continuing operations expressed in num-ber of days sales outstanding were 47 days at December31, 2003, compared to 38 days at December 31, 2002.The increase in trade receivables and days sales outstand-ing reflect increased government and internationalreceivables. Other receivables were $39.0 million atDecember 31, 2003 and $35.5 million at December 31,2002, representing a retained interest in securitizedreceivables. Inventories of continuing operations were$90.1 million at December 31, 2003 and $76.7 millionat December 31, 2002. Inventory measured against salesturned 7.7 times in 2003 and 7.4 times in 2002. Cashflow from continuing operations in 2002 was $22.9million higher than in 2001. Improved cash flow fromcontinuing operations in 2002 reflects higher operatingincome and relatively small changes in receivables andinventories.
Cash provided by discontinued operations in 2003 was$1.6 million higher than in 2002.The increase is primar-ily related to the liquidation of trade receivables. Cashprovided by discontinued operations in 2002 was $1.2million lower than in 2001, mainly due to lower income.
Investing activities provided cash of $66.7 million in2003 compared to using $34.1 million in 2002. In 2003,the sale of the Callery Chemical Division and propertyin Germany provided cash of approximately $63.0 mil-lion and $22.9 million, respectively. In 2002, net cash ofapproximately $14. 5 million was used for the acquisitionof Gallet. In 2001, cash was used for the acquisition ofSurety Manufacturing and Testing, Ltd. Capital expendi-tures of $19.6 million in 2003, $20.1 million in 2002,and 20.0 million in 2001 were primarily related to pur-chases of new or replacement tooling and productionequipment.
39451 MSA Financials 10F COMBO. 3/25/04 10:52 AM Page 23

24
Financing activities used cash of $76.3 million in 2003compared to using $7.1 million in 2002.The higher useof cash in 2003 includes a special distribution to com-mon shareholders of $53.8 million, representing theafter-tax proceeds from the sale of the Callery ChemicalDivision and the subsequent liquidation of net assetsretained by the company. Dividends paid on commonstock during 2003 (the 86th consecutive year of dividendpayment) were 26 cents per share. Dividends paid pershare in 2002 and 2001 were 22 cents and 18 cents,respectively.
The average amount of short term debt outstandingduring 2003 and 2002 was $560,000 and $3.1 million,respectively. Credit available at year-end with financialinstitutions was the U.S. dollar equivalent of $20.4 mil-lion, of which $19.6 million was unused.
Long-term debt, including the current portion, atDecember 31, 2003 was $64.8 million, or 17.4% of totalcapital. For purposes of this calculation, total capital isdefined as long-term debt plus the current portion oflong-term debt and shareholders’ equity.
Outstanding short and long-term indebtedness atDecember 31, 2003 and 2002 was as follows:
(In thousands) 2003 2002Bank lines of credit . . . . . . . . . . . . . $ 828) $09,096)Industrial development debt . . . . . . 10,750) 10,750)Senior notes . . . . . . . . . . . . . . . . . . 52,000) 56,000)Other . . . . . . . . . . . . . . . . . . . . . . . . 2,003) 2,564)
65,581) 78,410)Current portion . . . . . . . . . . . . . . . . . (5,666) (14,060)
59,915) 64,350)
Accounts Receivable SecuritizationAs described in note 9, the company sells eligible trade
accounts receivable to Mine Safety Funding Corporation(MSF), an unconsolidated wholly-owned subsidiary. MSFwas established in November 1999 to provide the com-pany with an inexpensive and reliable source of financingto replace borrowings under short term lines of credit.Under accounting principles generally accepted in theUnited States of America, MSF is not consolidated withMSA because legally it is a bankruptcy remote entity. Inthe event that MSA declared bankruptcy all cash collec-tions on trade receivables owned by MSF would first beused to satisfy MSF’s borrowings before any remainingproceeds could be returned to MSA.This arrangementpermits MSF to borrow at advantageous interest ratesusing its portfolio of trade receivables as security.As aresult of the securitization agreement, $15.0 million ofaccounts receivable and short-term debt has beenremoved from the company’s December 31, 2003balance sheet.At December 31, 2002, $29.0 million ofaccounts receivable and short-term debt were removedfrom the company’s balance sheet under thisarrangement.Cumulative Translation Adjustments
The year-end position of the U.S. dollar relative tointernational currencies resulted in translation gains of$14.7 million being credited to the cumulative transla-tion adjustments shareholders’ equity account in 2003,compared to gains of $5.8 million in 2002 and losses of$4.9 million in 2001.Translation gains in 2003 reflect thestrengthening of most currencies against the U.S. dollar.The most significant gains related to MSA’s operations inEurope and Australia.Translation gains in 2002 occurredprimarily in Europe, partially offset by losses in SouthAmerica.Translation losses in 2001 occurred primarily inSouth Africa, Brazil, Chile and most European countries.
eight year agreement to lease back the portion of theproperty that it occupies. Under sale-leaseback account-ing, $12.1 million of gain was deferred and is beingamortized over the term of the lease.
On September 12, 2003, the company entered into alease agreement with BASF Corporation pertaining tothat portion of the Callery Chemical site that is occupiedby MSA’s Evans City, PA manufacturing operations.Theinitial term of the lease is one year and the company hasthe option to renew for five successive one year periods.
The company expects to make net contributions of$1.3 million to its pension plans in 2004.
The company has purchase commitments for materi-als, supplies, services, and property, plant and equipmentas part of the ordinary conduct of business.
During the third quarter of 2003, the company sold itsreal property in Berlin, Germany for approximately $25.7million, resulting in a gain of approximately $13.6 mil-lion.At the same time, the company entered into an
MANAGEMENT’S DISCUSSION AND ANALYSIS
Commitments and ContingenciesThe company is obligated to make future payments under various contracts, including debt and lease agreements.
Significant cash obligations of MSA as of December 31, 2003 were as follows:
(In thousands) Total 2004 2005 2006 2007 2008 ThereafterLong-term debt . . . . . . . . . . . . . . . . . . . . $ 64,753 $ 4,838 $ 4,561 $ 8,231 $ 105 $ 8,105 $38,913Operating leases . . . . . . . . . . . . . . . . . . . 27,613 5,262 4,259 3,621 2,739 2,657 9,075Technology transfer agreement . . . . . . . . 2,250 1,500 750 – – – – Take or pay supply contract . . . . . . . . . . . 7,000 1,500 1,500 1,500 1,500 1,000 – Totals . . . . . . . . . . . . . . . . . . . . . . . . . . . . 101,616 13,100 11,070 13,352 4,344 11,762 47,988
39451 MSA Financials 10F COMBO. 3/25/04 10:52 AM Page 24

25
Various lawsuits and claims arising in the normal courseof business are pending against the company. These law-suits are primarily product liability claims. Pending claimsinclude several multi-party asbestosis or silicosis suits,generally as a result of the presence of safety equipmentsupplied by MSA and other manufacturers at locationsnamed in the suits.While the amounts claimed may besubstantial, the ultimate liability of the company is notdeterminable because of uncertainties, including thenumber of defendants in each suit and the jurisdiction.
The company maintains a reserve for uninsured prod-uct liability based on expected settlement charges forpending claims and an estimate of unreported claimsderived from experience, sales volumes, and other rele-vant information.The company reevaluates its exposureson an ongoing basis and makes adjustments to reserves asappropriate. Based on information currently available,management believes that the disposition of matters thatare pending will not have a materially adverse effect onthe financial position of the company.
The company has retained responsibility for certainenvironmental costs at the Callery Chemical site in theevent that corrective action is required by governmentalagencies or regulations. Under the terms of the asset pur-chase agreement with BASF, MSA’s maximum liabilityfor these matters is capped at $50.0 million. Based onenvironmental studies performed prior to the sale of thedivision, the company does not believe that its potentialexposure under the terms of this agreement will materi-ally affect the results of operations, cash flows, or financialcondition.
Financial Instrument Market RiskMarket risk represents the risk of adverse changes in
the value of a financial instrument caused by changes incurrency exchange rates, interest rates, and equity prices.The company is exposed to market risks related tocurrency exchange rates and interest rates.
Currency Exchange Rate Sensitivity – By the verynature of our global operations, the company’s cash flowand earnings are subject to fluctuations due to exchangerate changes. Because the company operates in a numberof locations around the world, currency exchange risk iswell diversified.When appropriate, the company mayattempt to limit its exposure to changes in currencyexchange rates through both operational and financialmarket actions.These actions may include contracts andother actions designed to reduce existing exposures byessentially creating offsetting currency exposures.AtDecember 31, 2003, contracts for the purpose of hedgingcash flows were not significant.
Interest Rate Sensitivity – The company is exposed tochanges in interest rates primarily as a result of borrow-ing and investing activities used to maintain liquidity andfund business operations. Because of the relatively shortmaturities of temporary investments and the variable ratenature of industrial development debt, these financialinstruments are reported at carrying values whichapproximate fair values.
As more fully described in note 11, the company has$52.0 million of fixed rate debt which matures at variousdates through 2012.The incremental increase in the fairvalue of fixed rate long term debt resulting from a hypo-thetical 10% decrease in interest rates would be approxi-mately $1.1 million. However, the company’s sensitivityto interest rate declines and the corresponding increase inthe fair value of its debt portfolio would unfavorablyaffect earnings and cash flows only to the extent that thecompany elected to repurchase or retire all or a portionof its fixed rate debt portfolio at prices above carryingvalues.Related Party Transactions
The company does not have any related party transac-tions that materially affect the results of operations, cashflow, or financial condition.Common Stock
At December 31, 2003, there were 36,927,984 shares ofcommon stock outstanding and approximately 7,500 iden-tifiable common stockholders. Common stock price andvolume information is included on the American StockExchange under the symbol MSA.The quarterly high andlow price quotations and cash dividend information forcommon shares follow. On November 24, 2003, the com-pany made a special distribution of $1.46 per commonshare, representing the after-tax proceeds received from thesale of the Callery Chemical Division and the subsequentliquidation of net assets retained by the company, to share-holders of record on November 14, 2003.
2003 2002Quarter High Low High LowFirst $12.44 $10.05 $14.40 $11.78Second 14.99 11.76 16.83 11.67Third 22.63 14.21 13.58 10.63Fourth 28.83 17.27 13.08 9.13
Dividend Record PaymentQuarter Per Share Date Date
2003First $ .06 Feb. 21, 2003 Mar. 10, 2003Second .06 May 21, 2003 Jun. 10, 2003Third .07 Aug. 15, 2003 Sep. 10, 2003Fourth .07 Nov. 17, 2003 Dec. 10, 2003Total .26
2002First $ .04 Feb. 22, 2002 Mar. 10, 2002Second .06 May 17, 2002 Jun. 10, 2002Third .06 Aug. 26, 2002 Sep. 10, 2002Fourth .06 Nov. 22, 2002 Dec. 10, 2002Total .22
The company’s stock transfer agent is Wells FargoBank, N.A., Shareowner Services, 161 North ConcordExchange, South St. Paul, MN 55075.
39451 MSA Financials 10F COMBO. 3/25/04 10:52 AM Page 25

26
RESPONSIBILITY STATEMENTSResponsibility for Financial Statements
The management of Mine Safety Appliances Companyprepared the accompanying financial statements and isresponsible for their integrity and objectivity.These state-ments were prepared in conformity with accountingprinciples generally accepted in the United States ofAmerica.The financial statements include amounts thatare based on management’s best estimates and judgments.The other information in this annual report is consistentwith the financial statements.
The company maintains a system of internal controls,including a program of internal auditing. Managementbelieves that the company’s system of internal controlsprovides reasonable assurance that assets are safeguardedagainst losses and that the financial records are reliable foruse in preparing financial statements.The concept of rea-sonable assurance recognizes that the cost of a controlshould not exceed the expected benefits. Managementbelieves that its internal control system appropriatelyrecognizes this cost/benefit relationship.
Management recognizes its responsibility for fosteringa strong ethical climate so that the company’s affairs areconducted according to the highest standards of personaland corporate conduct.This responsibility is character-ized and reflected in a broad business ethics policy thataddresses, among other things, conduct of businessactivities within the laws of the United States and othercountries in which the company operates and potentialconflicts of interest of its associates. Ethics policyviolations are throughly investigated and may lead todisciplinary action, including termination of employment.
The Audit Committee of the Board of Directors per-forms an oversight role in the preparation of the financialstatements.The Audit Committee is composed of fourindependent directors.The Audit Committee meetsregularly to discuss audit and financial reporting matterswith management, the internal auditors, and the inde-pendent auditors.The internal auditors and independentauditors have direct access to the Audit Committee todiscuss the results of their audits or any other matters.
David W. Bishop IIControllerChief Accounting Officer
Dennis L. ZeitlerVice President and TreasurerChief Financial Officer
John T. Ryan IIIChairman of the BoardChief Executive Officer
Report of Independent AuditorsTo the Shareholders and Board of Directors of Mine
Safety Appliances Company:In our opinion, the accompanying consolidated bal-
ance sheets and the related consolidated statements ofincome, changes in retained earnings and accumulatedother comprehensive income, and of cash flows presentfairly, in all material respects, the financial position ofMine Safety Appliances Company and its subsidiariesat December 31, 2003 and 2002, and the results oftheir operations and their cash flows for each of thethree years in the period ended December 31, 2003in conformity with accounting principles generallyaccepted in the United States of America.These finan-cial statements are the responsibility of the Company’smanagement; our responsibility is to express an opinionon these financial statements based on our audits.Weconducted our audits of these statements in accordancewith auditing standards generally accepted in theUnited States of America, which require that we planand perform the audit to obtain reasonable assuranceabout whether the financial statements are free ofmaterial misstatement.An audit includes examining,on a test basis, evidence supporting the amounts anddisclosures in the financial statements, assessing theaccounting principles used and significant estimatesmade by management, and evaluating the overall finan-cial statement presentation.We believe that our auditsprovide a reasonable basis for our opinion.
PricewaterhouseCoopers LLPPittsburgh, PennsylvaniaFebruary 20, 2004
39451 MSA Financials 10F COMBO. 3/25/04 10:52 AM Page 26

27
CONSOLIDATED STATEMENT OF INCOME(In thousands, except per share amounts)
Year Ended December 31 2003 2002 2001
Net sales.......................................................................................................................... $696,473) $564,426) $509,736
Other income................................................................................................................... 1,724) 2,271) 2,776
698,197) 566,697) 512,512
Costs and expenses
Cost of products sold .................................................................................................. 408,219) 331,215) 292,940
Selling, general and administrative ............................................................................. 170,081) 140,924) 130,092
Research and development ........................................................................................ 21,722) 20,372) 16,740
Depreciation and amortization..................................................................................... 23,208) 21,525) 22,590
Interest......................................................................................................................... 4,564) 4,769) 5,349
Currency exchange (gains) losses .............................................................................. (3,356) (191) 1,197
624,438) 518,614) 468,908
Income from continuing operations before income taxes............................................. 73,759) 48,083) 43,604
Provision for income taxes.............................................................................................. 24,835) 16,870) 17,753
Net income from continuing operations......................................................................... 48,924) 31,213) 25,851
Net income from discontinued operations..................................................................... 2,685) 3,864) 5,780
Gain on sale of discontinued operations – after tax....................................................... 13,658)
Net income ...................................................................................................................... $ 65,267) $035,077) $031,631
Basic earnings per common share:
Continuing operations.................................................................................................. $0001.33) $0 00.85) $0 00.72
Discontinued operations.............................................................................................. .45) .11) .16
Net income .................................................................................................................. $0001.78) $0 00.96) $0 00.88
Diluted earnings per common share:
Continuing operations.................................................................................................. $ 001.31) $0 00.85) $0 00.71
Discontinued operations.............................................................................................. .44) .10) .16
Net income .................................................................................................................. $0001.75) $0 00.95) $0 00.87
See notes to consolidated financial statements.
39451 MSA Financials 10F COMBO. 3/25/04 10:52 AM Page 27

28
(In thousands, except share amounts)December 31 2003 2002AssetsCurrent Assets Cash and cash equivalents . . . . . . . . . . . . . . . . . . . . . . . . . . . . . . . . . . . . . . . . . . $ 73,244) $ 36,477)
Trade receivables, less allowance for doubtful accounts of $6,418 and $4,134 . . . 89,919) 58,648)Other receivables . . . . . . . . . . . . . . . . . . . . . . . . . . . . . . . . . . . . . . . . . . . . . . . . . 38,981) 35,456)Inventories . . . . . . . . . . . . . . . . . . . . . . . . . . . . . . . . . . . . . . . . . . . . . . . . . . . . . . 90,103) 76,748)Deferred tax assets . . . . . . . . . . . . . . . . . . . . . . . . . . . . . . . . . . . . . . . . . . . . . . . . 17,890) 20,396)Prepaid expenses and other current assets . . . . . . . . . . . . . . . . . . . . . . . . . . . . . 10,794) 10,157)Assets held for sale . . . . . . . . . . . . . . . . . . . . . . . . . . . . . . . . . . . . . . . . . . . . . . . 02,311) 45,062)Total current assets . . . . . . . . . . . . . . . . . . . . . . . . . . . . . . . . . . . . . . . . . . . . . . . . 323,242) 282,944)
Property Land . . . . . . . . . . . . . . . . . . . . . . . . . . . . . . . . . . . . . . . . . . . . . . . . . . . . . . . . . . . 4,642) 5,615)Buildings . . . . . . . . . . . . . . . . . . . . . . . . . . . . . . . . . . . . . . . . . . . . . . . . . . . . . . . . 80,044) 91,320)
) Machinery and equipment . . . . . . . . . . . . . . . . . . . . . . . . . . . . . . . . . . . . . . . . . . 269,739) 250,797)) Construction in progress . . . . . . . . . . . . . . . . . . . . . . . . . . . . . . . . . . . . . . . . . . . . 5,521) 5,580)
Total . . . . . . . . . . . . . . . . . . . . . . . . . . . . . . . . . . . . . . . . . . . . . . . . . . . . . . . . . . . 359,946) 353,312)Less accumulated depreciation . . . . . . . . . . . . . . . . . . . . . . . . . . . . . . . . . . . . . . . (239,386) (222,905)Net property . . . . . . . . . . . . . . . . . . . . . . . . . . . . . . . . . . . . . . . . . . . . . . . . . . . . . 120,560) 130,407)
Other Assets Prepaid pension cost . . . . . . . . . . . . . . . . . . . . . . . . . . . . . . . . . . . . . . . . . . . . . . . 121,290) 107,338)Deferred tax assets . . . . . . . . . . . . . . . . . . . . . . . . . . . . . . . . . . . . . . . . . . . . . . . . 23,047) 7,800)Goodwill . . . . . . . . . . . . . . . . . . . . . . . . . . . . . . . . . . . . . . . . . . . . . . . . . . . . . . . . 44,810) 42,963)Other noncurrent assets . . . . . . . . . . . . . . . . . . . . . . . . . . . . . . . . . . . . . . . . . . . . 10,936) 8,313)Total . . . . . . . . . . . . . . . . . . . . . . . . . . . . . . . . . . . . . . . . . . . . . . . . . . . . . . . . . . . $643,885) $579,765)
LiabilitiesCurrent Liabilities Notes payable and current portion of long-term debt . . . . . . . . . . . . . . . . . . . . . . $ 05,666) $014,060)
Accounts payable . . . . . . . . . . . . . . . . . . . . . . . . . . . . . . . . . . . . . . . . . . . . . . . . . 40,029) 30,979)Employees’ compensation . . . . . . . . . . . . . . . . . . . . . . . . . . . . . . . . . . . . . . . . . . 15,486) 16,216)Insurance and product liability . . . . . . . . . . . . . . . . . . . . . . . . . . . . . . . . . . . . . . . . 13,518) 8,899)Taxes on income . . . . . . . . . . . . . . . . . . . . . . . . . . . . . . . . . . . . . . . . . . . . . . . . . . 4,976) 3,748)Other current liabilities . . . . . . . . . . . . . . . . . . . . . . . . . . . . . . . . . . . . . . . . . . . . . 35,040) 25,798)Total current liabilities . . . . . . . . . . . . . . . . . . . . . . . . . . . . . . . . . . . . . . . . . . . . . . 114,715) 99,700)
Long-Term Debt . . . . . . . . . . . . . . . . . . . . . . . . . . . . . . . . . . . . . . . . . . . . . . . . . . . . . . . . . . . . . . . 59,915) 64,350)Other Liabilities Pensions and other employee benefits . . . . . . . . . . . . . . . . . . . . . . . . . . . . . . . . . 74,808) 61,198)
Deferred tax liabilities . . . . . . . . . . . . . . . . . . . . . . . . . . . . . . . . . . . . . . . . . . . . . . 70,845) 61,402)Other noncurrent liabilities . . . . . . . . . . . . . . . . . . . . . . . . . . . . . . . . . . . . . . . . . . 15,744) 4,053)Total other liabilities . . . . . . . . . . . . . . . . . . . . . . . . . . . . . . . . . . . . . . . . . . . . . . . . 161,397) 126,653)
Shareholders’ EquityPreferred stock, 41⁄2% cumulative, $50 par value (callable at $52.50) . . . . . . . . . . 3,569) 3,569)Common stock, no par value (shares outstanding:
2003—36,927,984 2002—12,207,029) . . . . . . . . . . . . . . . . . . . . . . . . . . . . . 31,187) 28,626)Stock compensation trust . . . . . . . . . . . . . . . . . . . . . . . . . . . . . . . . . . . . . . . . . . . (19,385) (21,697)Treasury shares, at cost . . . . . . . . . . . . . . . . . . . . . . . . . . . . . . . . . . . . . . . . . . . . (137,173) (134,827)Deferred stock compensation . . . . . . . . . . . . . . . . . . . . . . . . . . . . . . . . . . . . . . . . (993) (801)Accumulated other comprehensive income . . . . . . . . . . . . . . . . . . . . . . . . . . . . . (6,037) (20,501)Earnings retained in the business . . . . . . . . . . . . . . . . . . . . . . . . . . . . . . . . . . . . . 436,690) 434,693)Total shareholders’ equity . . . . . . . . . . . . . . . . . . . . . . . . . . . . . . . . . . . . . . . . . . . 307,858) 289,062)Total . . . . . . . . . . . . . . . . . . . . . . . . . . . . . . . . . . . . . . . . . . . . . . . . . . . . . . . . . . . $643,885) $579,765)
CONSOLIDATED BALANCE SHEET
See notes to consolidated financial statements.
39451 MSA Financials 10F COMBO. 3/25/04 10:52 AM Page 28

29
(In thousands)Year Ended December 31 2003 2002 2001
Operating ActivitiesNet income . . . . . . . . . . . . . . . . . . . . . . . . . . . . . . . . . . . . . . . . . . . . . . . . . . . . . . . . $65,267) $35,077) $31,631)Net income from discontinued operations . . . . . . . . . . . . . . . . . . . . . . . . . . . . . . . . (2,685) (3,864) (5,780)Gain on the sale of discontinued operations . . . . . . . . . . . . . . . . . . . . . . . . . . . . . . . (13,658) (000) (000)Net income from continuing operations . . . . . . . . . . . . . . . . . . . . . . . . . . . . . . . . . . 48,924) 31,213) 25,851)Depreciation and amortization . . . . . . . . . . . . . . . . . . . . . . . . . . . . . . . . . . . . . . . . . . 23,208) 21,525) 22,590)Pensions . . . . . . . . . . . . . . . . . . . . . . . . . . . . . . . . . . . . . . . . . . . . . . . . . . . . . . . . . . (8,845) (13,125) (14,962)Net gain on sale of investments and assets . . . . . . . . . . . . . . . . . . . . . . . . . . . . . . . (2,332) (35) (1,764)Deferred income taxes . . . . . . . . . . . . . . . . . . . . . . . . . . . . . . . . . . . . . . . . . . . . . . . 4,922) 4,765) 9,259)Receivables and other receivables . . . . . . . . . . . . . . . . . . . . . . . . . . . . . . . . . . . . . . (27,039) (3,008) (16,846)Inventories . . . . . . . . . . . . . . . . . . . . . . . . . . . . . . . . . . . . . . . . . . . . . . . . . . . . . . . . (3,162) 5,518) (10,716)Accounts payable and accrued liabilities . . . . . . . . . . . . . . . . . . . . . . . . . . . . . . . . . . 1,253) (3,616) (2,955)Other assets and liabilities . . . . . . . . . . . . . . . . . . . . . . . . . . . . . . . . . . . . . . . . . . . . (1,864) (1,775) 4,132)Other—including currency exchange adjustments . . . . . . . . . . . . . . . . . . . . . . . . . . (2,554) 1,582) 5,561)Cash Flow From Continuing Operations . . . . . . . . . . . . . . . . . . . . . . . . . . . . . . . . . . 32,511) 43,044) 20,150)Cash Flow From Discontinued Operations . . . . . . . . . . . . . . . . . . . . . . . . . . . . . . . . 8,029) 6,412) 7,635)Cash Flow From Operating Activities . . . . . . . . . . . . . . . . . . . . . . . . . . . . . . . . . . 40,540) 49,456) 27,785)
Investing ActivitiesProperty additions . . . . . . . . . . . . . . . . . . . . . . . . . . . . . . . . . . . . . . . . . . . . . . . . . . . (19,628) (20,072) (19,987)Property disposals . . . . . . . . . . . . . . . . . . . . . . . . . . . . . . . . . . . . . . . . . . . . . . . . . . . 23,521) 649) 6,685)Proceeds from sale of discontinued operations . . . . . . . . . . . . . . . . . . . . . . . . . . . . 63,042) ) )Acquisitions, net of cash acquired, and other investing . . . . . . . . . . . . . . . . . . . . . . . (279) (14,667) (6,765)Cash Flow From Investing Activities . . . . . . . . . . . . . . . . . . . . . . . . . . . . . . . . . . . 66,656) (34,090) (20,067)
Financing ActivitiesAdditions to long-term debt . . . . . . . . . . . . . . . . . . . . . . . . . . . . . . . . . . . . . . . . . . . 245) 677) 12)Reductions of long-term debt . . . . . . . . . . . . . . . . . . . . . . . . . . . . . . . . . . . . . . . . . . (4,902) (7,089) (5,259)Changes in notes payable and short-term debt . . . . . . . . . . . . . . . . . . . . . . . . . . . . . (9,146) 5,578) 1,150)Cash dividends and special distributions . . . . . . . . . . . . . . . . . . . . . . . . . . . . . . . . . . (63,270) (7,961) (6,480)Company stock purchases . . . . . . . . . . . . . . . . . . . . . . . . . . . . . . . . . . . . . . . . . . . . (2,309) (846) (3,227)Company stock sales . . . . . . . . . . . . . . . . . . . . . . . . . . . . . . . . . . . . . . . . . . . . . . . . 3,036) 2,508) 7,477)Cash Flow From Financing Activities . . . . . . . . . . . . . . . . . . . . . . . . . . . . . . . . . . . (76,346) (7,133) (6,327)
Effect of exchange rate changes on cash . . . . . . . . . . . . . . . . . . . . . . . . . . . . . . . . . . . . . 5,917) 1,543) (1,231)Increase in cash and cash equivalents . . . . . . . . . . . . . . . . . . . . . . . . . . . . . . . . . . . . . . . 36,767) 9,776) 160)Beginning cash and cash equivalents . . . . . . . . . . . . . . . . . . . . . . . . . . . . . . . . . . . . . . . . 36,477) 26,701) 26,541)Ending cash and cash equivalents . . . . . . . . . . . . . . . . . . . . . . . . . . . . . . . . . . . . . . . . . . $73,244) $36,477) $26,701)
Supplemental cash flow information:Interest payments . . . . . . . . . . . . . . . . . . . . . . . . . . . . . . . . . . . . . . . . . . . . . . . . . . . $05,025) $05,890) $06,566)Income tax payments . . . . . . . . . . . . . . . . . . . . . . . . . . . . . . . . . . . . . . . . . . . . . . . . 35,743) 18,546) 9,765)
CONSOLIDATED STATEMENT OF CASH FLOWS
See notes to consolidated financial statements.
39451 MSA Financials 10F COMBO. 3/25/04 10:52 AM Page 29

30
(In thousands) AccumulatedOther
Retained Comprehensive ComprehensiveEarnings Income Income
Balances January 1, 2001 . . . . . . . . . . . . . . . . . . . . . . . . . . . . . . . . . . . . . . . . . . . . $382,426) $(20,869)Net income . . . . . . . . . . . . . . . . . . . . . . . . . . . . . . . . . . . . . . . . . . . . . . . . . . . . . 31,631) $31,631)Cumulative translation adjustments . . . . . . . . . . . . . . . . . . . . . . . . . . . . . . . . . . . (4,934) (4,934)Minimum pension liability adjustments (a) . . . . . . . . . . . . . . . . . . . . . . . . . . . . . . (413) (413)
Comprehensive income . . . . . . . . . . . . . . . . . . . . . . . . . . . . . . . . . . . . . . . . . . $26,284)Common dividends . . . . . . . . . . . . . . . . . . . . . . . . . . . . . . . . . . . . . . . . . . . . . . . (6,432)Preferred dividends . . . . . . . . . . . . . . . . . . . . . . . . . . . . . . . . . . . . . . . . . . . . . . . (48)
Balances December 31, 2001 . . . . . . . . . . . . . . . . . . . . . . . . . . . . . . . . . . . . . . . . . 407,577) (26,216)Net income . . . . . . . . . . . . . . . . . . . . . . . . . . . . . . . . . . . . . . . . . . . . . . . . . . . . . 35,077) $35,077)Cumulative translation adjustments . . . . . . . . . . . . . . . . . . . . . . . . . . . . . . . . . . . 5,772) 5,772)Minimum pension liability adjustments (a) . . . . . . . . . . . . . . . . . . . . . . . . . . . . . . (57) (57)
Comprehensive income . . . . . . . . . . . . . . . . . . . . . . . . . . . . . . . . . . . . . . . . . . $40,792)Common dividends . . . . . . . . . . . . . . . . . . . . . . . . . . . . . . . . . . . . . . . . . . . . . . . (7,914)Preferred dividends . . . . . . . . . . . . . . . . . . . . . . . . . . . . . . . . . . . . . . . . . . . . . . . (47)
Balances December 31, 2002 . . . . . . . . . . . . . . . . . . . . . . . . . . . . . . . . . . . . . . . . . 434,693) (20,501)Net income . . . . . . . . . . . . . . . . . . . . . . . . . . . . . . . . . . . . . . . . . . . . . . . . . . . . . 65,267) $65,267)Cumulative translation adjustments . . . . . . . . . . . . . . . . . . . . . . . . . . . . . . . . . . . 14,699) 14,699)Minimum pension liability adjustments (a) . . . . . . . . . . . . . . . . . . . . . . . . . . . . . . (235) (235)
Comprehensive income . . . . . . . . . . . . . . . . . . . . . . . . . . . . . . . . . . . . . . . . . . $79,731)Special distribution to common shareholders . . . . . . . . . . . . . . . . . . . . . . . . . . . (53,799)Common dividends . . . . . . . . . . . . . . . . . . . . . . . . . . . . . . . . . . . . . . . . . . . . . . . (9,425)Preferred dividends . . . . . . . . . . . . . . . . . . . . . . . . . . . . . . . . . . . . . . . . . . . . . . . (46)
Balances December 31, 2003 . . . . . . . . . . . . . . . . . . . . . . . . . . . . . . . . . . . . . . . . . $436,690) $(6,037)
(a) – Charges to minimum pension liability adjustments in 2003, 2002 and 2001 are net of tax benefits of $157,000, $38,000 and$275,000, respectively.
Components of accumulated other comprehensive income are as follows:(In thousands)
2003 2002 2001Cumulative translation adjustments . . . . . . . . . . . . . . . . . . . . . . . . . . . . . . . . . . . . $(4,894) $(19,593) $(25,365)Minimum pension liability adjustments . . . . . . . . . . . . . . . . . . . . . . . . . . . . . . . . . . (1,143) (908) (851)Accumulated other comprehensive income . . . . . . . . . . . . . . . . . . . . . . . . . . . . . . $(6,037) $(20,501) $(26,216)
CONSOLIDATED STATEMENT OF CHANGES IN RETAINED EARNINGSAND ACCUMULATED OTHER COMPREHENSIVE INCOME
See notes to consolidated financial statements.
39451 MSA Financials 10F COMBO. 3/25/04 10:52 AM Page 30

31
NOTES TO CONSOLIDATED FINANCIAL STATEMENTSNote 1 – Significant Accounting Policies
Use of Estimates – The preparation of financial statements in conformity with accounting principles generally accepted in theUnited States of America requires management to make estimates and assumptions that affect the reported amounts of assets and liabil-ities and disclosure of contingent assets and liabilities at the date of the financial statements and the reported amounts of revenues andexpenses during the reporting period.Actual results could differ from those estimates.
Principles of Consolidation – The consolidated financial statements include the accounts of the company and all subsidiaries exceptMine Safety Funding Corporation. Intercompany accounts and transactions are eliminated.To facilitate timely reporting, several inter-national subsidiaries have November 30th fiscal year ends. Certain prior year amounts have been reclassified to conform with thecurrent year presentation.
Currency Translation – The functional currency of all significant foreign subsidiaries is the local currency.Assets and liabilities ofthese subsidiaries are translated at year-end exchange rates. Income statement accounts are translated at the average rates of exchangeprevailing during the year.Translation adjustments for these companies are reported as a component of shareholders’ equity and arenot included in income. Foreign currency transaction gains and losses are included in net income for the period.
Cash Equivalents – Cash equivalents include temporary deposits with financial institutions and highly liquid investments withoriginal maturities of 90 days or less.
Inventories – Inventories are stated at the lower of cost or market. Most U.S. inventories are valued on the last-in, first-out (LIFO)cost method. Other inventories are valued on the average cost method or at standard costs which approximate actual costs.
Property and Depreciation – Property is recorded at cost. Depreciation is computed using straight-line and accelerated methodsover the estimated useful lives of the assets. Expenditures for significant renewals and improvements are capitalized. Ordinary repairsand maintenance are expensed as incurred. Gains or losses on property dispositions are included in income and the cost and relateddepreciation are removed from the accounts.
Goodwill and Other Intangible Assets – Effective January 1, 2002, the company adopted FAS No. 142, Goodwill and OtherIntangible Assets. Under this standard, goodwill and intangible assets with indefinite lives are not amortized, but are subject to impair-ment write-down tests that must be performed at least annually. For years ending prior to 2002, goodwill was amortized on a straightline basis over periods not exceeding 35 years. Other intangible assets are amortized on a straight-line basis over their useful lives.
Revenue Recognition – Revenue from the sale of products is recognized when title, ownership, and risk of loss pass to the customer.Shipping and Handling – Shipping and handling expenses for products sold to customers are charged to cost of products sold as
incurred.Amounts billed to customers for shipping and handling are included in net sales.Research and Development – Research and development costs are expensed as incurred.Income Taxes – Deferred income taxes are provided for temporary differences between financial and tax reporting. Deferred tax assets
and liabilities are measured using enacted tax rates in effect for the year in which those temporary differences are expected to be recov-ered or settled. If it is more likely than not that some portion or all of a deferred tax asset will not be realized, a valuation allowance isrecognized. No provision is made for possible U.S. taxes on the undistributed earnings of foreign subsidiaries that are considered to bereinvested indefinitely. Calculation of the unrecognized deferred tax liability for temporary differences related to these earnings is notpracticable.Where it is contemplated that earnings will be remitted, credits for foreign taxes already paid are expected to generally offsetapplicable U.S. income taxes. In cases where they will not offset U.S. income taxes, appropriate provisions are recorded.
Stock-Based Compensation Plans – The company applies the intrinsic value-based method in accordance with AccountingPrinciples Board Opinion No. 25,Accounting for Stock Issued to Employees.Accordingly, no compensation cost is recognized forstock option grants. Compensation cost for restricted stock awards is measured at the market value of the shares when awarded.Unearned stock compensation is reported in shareholders’ equity and is charged to income over the restriction period.
If the company had elected to recognize compensation cost based on the fair value of the options at the grant date as prescribed byFAS 148,Accounting for Stock-Based Compensation – Transition and Disclosure, net income and earnings per share would have beenreduced to the pro forma amounts shown below:
(In thousands)2003 2002 2001
Net income as reported . . . . . . . . . . . . . . . . . . . . . . . . . . . . . . . . . . . . . . . . . . . $65,267) $35,077) $31,631)Fair value of stock options granted, net of tax . . . . . . . . . . . . . . . . . . . . . . . . . . (1,374) (1,717) (1,519)Pro forma net income . . . . . . . . . . . . . . . . . . . . . . . . . . . . . . . . . . . . . . . . . . . . 63,893) 33,360) 30,112)Basic earnings per share:
As reported . . . . . . . . . . . . . . . . . . . . . . . . . . . . . . . . . . . . . . . . . . . . . . . . . . $ 0.00$ 1.78) $ .96) $ .88)Pro forma . . . . . . . . . . . . . . . . . . . . . . . . . . . . . . . . . . . . . . . . . . . . . . . . . . . . 0.01.74) .91) .84)
Diluted earnings per share:As reported . . . . . . . . . . . . . . . . . . . . . . . . . . . . . . . . . . . . . . . . . . . . . . . . . . $ 1.75) $ .95) $ .87)Pro forma . . . . . . . . . . . . . . . . . . . . . . . . . . . . . . . . . . . . . . . . . . . . . . . . . . . . 0.001.71) .90) .83)
The fair value of the options granted was estimated at the grant dates using the Black-Scholes option pricing model and thefollowing weighted average assumptions for options granted in 2003, 2002, and 2001, respectively; risk-free interest rate of 4.0%, 5.3%,and 5.2%; dividend yield of 2.1%, 2.0%, and 2.1%; expected option life of 9.9 years, 9.9 years, and 9.9 years; and expected volatilityfactor of 23%, 23%, and 23%.
Derivative Instruments – The company uses derivative instruments to dampen the effects of changes in currency exchange ratesand to achieve a targeted mix of fixed and floating interest rates on outstanding debt.The company does not enter into derivativetransactions for speculative purposes and does not hold derivative instruments for trading purposes. Derivative instruments, includinginterest rate swaps and forward exchange contracts, are not accounted for as hedges and are marked-to-market each period.The real-ized and unrealized gains or losses on these instruments are recognized in income in the current period. MSA estimates the fair valueof all derivatives based on quoted market prices or pricing models, and records all derivatives on the balance sheet at fair value.
39451 MSA Financials 10F COMBO. 3/25/04 10:52 AM Page 31

32
NOTES TO CONSOLIDATED FINANCIAL STATEMENTSNote 2 – Subsequent Event
On January 28, 2004, the company paid a 3-for-1 stock split of the common stock to shareholders of record on January 16, 2004.Share and per share information in this report has been adjusted to reflect the split.
Note 3 – Capital Stock• Common stock, no par value - 180,000,000 shares authorized• Second cumulative preferred voting stock, $10 par value - 1,000,000 shares authorized; none issued• 41/2% cumulative preferred nonvoting stock, $50 par value - 100,000 shares authorized; 71,373 shares issued and 51,554 shares
($1,690,000) held in treasury (1,241 shares, $61,000, purchased for treasury in 2003; no activity in 2002; 600 shares,$21,000, purchased for treasury in 2001)
Common stock activity is summarized as follows:Shares Dollars (In thousands)Stock Stock
Shares Compensation Shares in Shares Compensation TreasuryIssued Trust Treasury Issued Trust Cost
Balances January 1, 2001 . . . . . . . . . . . . . . . . . . . 20,335,797) (1,639,320) (6,868,854) $ 18,841) $ (25,683) $(129,066)Restricted stock awards . . . . . . . . . . . . . . . . . . . . . 860) 12) 13)Restricted stock awards forfeited . . . . . . . . . . . . . (3,900) (80)Stock options exercised . . . . . . . . . . . . . . . . . . . . . 147,254) 223,087) 4,226) 3,491)Tax benefit related to stock plans . . . . . . . . . . . . . . 2,307)Treasury shares purchased . . . . . . . . . . . . . . . . . . . (94,197) (3,206)Balances December 31, 2001 . . . . . . . . . . . . . . . . 20,483,051) (1,415,373) (6,966,951) 25,386) (22,179) (132,352)Restricted stock awards . . . . . . . . . . . . . . . . . . . . . 23,198) 915)Stock options exercised . . . . . . . . . . . . . . . . . . . . . 73,860) 30,744) 1,786) 482)Tax benefit related to stock plans . . . . . . . . . . . . . . 539)Treasury shares purchased . . . . . . . . . . . . . . . . . . . (21,500) (846)Balances December 31, 2002 . . . . . . . . . . . . . . . . 20,580,109) (1,384,629) (6,988,451) 28,626) (21,697) (133,198)Restricted stock awards . . . . . . . . . . . . . . . . . . . . . 00,000) 27,235) 517) 427)Restricted stock awards forfeited . . . . . . . . . . . . . 00,000) ) (1,000) ) (37)Stock options exercised . . . . . . . . . . . . . . . . . . . . . 00,000) 120,317) 1,151) 1,885)Tax benefit related to stock plans . . . . . . . . . . . . . . 893)Treasury shares purchased . . . . . . . . . . . . . . . . . . . (44,253) (2,248)Balances December 31, 2003 . . . . . . . . . . . . . . . . 20,580,109) (1,237,077) (7,033,704) 31,187) (19,385) (135,483)3-for-1 stock split (January 2004) . . . . . . . . . . . . . . 41,160,218) (2,474,154) (14,067,408)Adjusted balances December 31, 2003 . . . . . . . . . 61,740,327) (3,711,231) (21,101,112) 31,187 (19,385) (135,483)
The Mine Safety Appliances Company Stock Compensation Trust was established to fund certain benefit plans, including employeeand non-employee directors stock options and awards. Shares held by the Stock Compensation Trust, and the corresponding cost ofthose shares, are reported as a reduction of common shares issued. Differences between the cost of the shares held by the StockCompensation Trust and the market value of shares released for stock-related benefits are reflected in shares issued.
The company has a Shareholder Rights Plan under which each outstanding share of common stock is granted one-ninth of a pre-ferred share purchase right.The rights are exercisable for a fraction of a share of preferred stock, only if a person or group acquires orcommences a tender offer for 15% or more of the company’s common stock. In the event a person or group acquires 15% or more ofthe outstanding common stock, each right not owned by that person or group will entitle the holder to purchase that number of sharesof common stock having a value equal to twice the $225 exercise price.The Board of Directors may redeem the rights for $.01 perright at any time until ten days after the announcement that a 15% position has been acquired.The rights expire on February 21, 2007.
39451 MSA Financials 10F COMBO. 3/25/04 10:52 AM Page 32

33
Note 4 – Segment InformationThe company is organized into three geographic operating segments: North America, Europe, and International.The company is
engaged in the manufacture and sale of safety equipment, including respiratory protective equipment, head protection, eye and faceprotection, hearing protectors, safety clothing, industrial emergency care products, mining safety equipment, thermal imaging cameras,and monitoring instruments.
Reportable segment information is presented in the following table:
(In thousands) North Reconciling ConsolidatedAmerica Europe International Items Totals
2003Sales to external customers . . . . . . . . . . . . . . . . . . . . . . . $452,567) $146,162) $097,744) $000000) $696,473)Intercompany sales . . . . . . . . . . . . . . . . . . . . . . . . . . . . . 24,215) 49,499) 3,061) (76,775) )Net income from continuing operations . . . . . . . . . . . . . . 38,666) 2,795) 6,349) 1,114) 48,924)Net income from discontinued operations . . . . . . . . . . . . . 2,685) 2,685)Gain on sale of discontinued operations . . . . . . . . . . . . . . 13,658) 13,658)Total assets continuing operations . . . . . . . . . . . . . . . . . . 419,472) 190,179) 68,611) (36,688) 641,574)Assets held for sale . . . . . . . . . . . . . . . . . . . . . . . . . . . . . 2,311) 2,311)Interest income . . . . . . . . . . . . . . . . . . . . . . . . . . . . . . . . 576) 115) 278) 102) 1,071)Interest expense . . . . . . . . . . . . . . . . . . . . . . . . . . . . . . . 4,357) 123) 84) ) 4,564)Noncash items:
Depreciation and amortization . . . . . . . . . . . . . . . . . . . . 17,071) 4,972) 1,144) 21) 23,208)Pension income (expense) . . . . . . . . . . . . . . . . . . . . . . 14,999) (3,847) (307) )13,125 10,845)
Equity in earnings of affiliates . . . . . . . . . . . . . . . . . . . . . . ) (5) ) (5)Income tax provision . . . . . . . . . . . . . . . . . . . . . . . . . . . . 18,632) 2,069) 2,985) 1,149) 24,835)Investments in affiliates . . . . . . . . . . . . . . . . . . . . . . . . . . 366) )158 153) ) 519)Property additions . . . . . . . . . . . . . . . . . . . . . . . . . . . . . . 13,221) 3,976) 2,423) 8) 19,628)Fixed assets . . . . . . . . . . . . . . . . . . . . . . . . . . . . . . . . . . . 93,296) 19,918) 7,319) 27) 120,560)
2002Sales to external customers . . . . . . . . . . . . . . . . . . . . . . . 369,728) 122,377) 072,206) 000115) 564,426)Intercompany sales . . . . . . . . . . . . . . . . . . . . . . . . . . . . . 21,472) 35,733) 3,116) (60,321) )Net income from continuing operations . . . . . . . . . . . . . . 25,933) 2,519) 2,372) 389) 31,213)Net income from discontinued operations . . . . . . . . . . . . . 3,864) 3,864)Total assets continuing operations . . . . . . . . . . . . . . . . . . 363,999) 145,663) 50,364) (25,323) 534,703)Assets held for sale . . . . . . . . . . . . . . . . . . . . . . . . . . . . . 45,062) 45,062)Interest income . . . . . . . . . . . . . . . . . . . . . . . . . . . . . . . . 424) 142) 281) 106) 953)Interest expense . . . . . . . . . . . . . . . . . . . . . . . . . . . . . . . 4,501) 67) 201) ) 4,769)Noncash items:
Depreciation and amortization . . . . . . . . . . . . . . . . . . . . 16,012) 4,446) 1,047) 20) 21,525)Pension income (expense) . . . . . . . . . . . . . . . . . . . . . . 16,360) (3,123) (112) )13,125 13,125)
Equity in earnings of affiliates . . . . . . . . . . . . . . . . . . . . . . ) 23) ) 23)Income tax provision . . . . . . . . . . . . . . . . . . . . . . . . . . . . 13,884) 1,056) 1,647) 283) 16,870)Investments in affiliates . . . . . . . . . . . . . . . . . . . . . . . . . . 1,374) )158 158) ) 1,532)Property additions . . . . . . . . . . . . . . . . . . . . . . . . . . . . . . 15,538) 3,698) 831) 5) 20,072)Fixed assets . . . . . . . . . . . . . . . . . . . . . . . . . . . . . . . . . . . 100,213) 25,329) 4,824) 41) 130,407)
2001Sales to external customers . . . . . . . . . . . . . . . . . . . . . . . 343,646) 94,187) 71,735) 168) 509,736)Intercompany sales . . . . . . . . . . . . . . . . . . . . . . . . . . . . . 20,074) 21,668) 2,124) (43,866) )Net income from continuing operations . . . . . . . . . . . . . . 22,575) 130) 3,619) (473) 25,851)Net income from discontinued operations . . . . . . . . . . . . . 5,780) 5,780)Total assets . . . . . . . . . . . . . . . . . . . . . . . . . . . . . . . . . . . 399,912) 96,372) 48,816) (24,402) 520,698)Interest income . . . . . . . . . . . . . . . . . . . . . . . . . . . . . . . . 513) 146) 408) 116) 1,183)Interest expense . . . . . . . . . . . . . . . . . . . . . . . . . . . . . . . 4,844) 156) 349) ) 5,349)Noncash items:
Depreciation and amortization . . . . . . . . . . . . . . . . . . . . 17,714) 3,680) 1,170) 26) 22,590)Pension income (expense) . . . . . . . . . . . . . . . . . . . . . . 17,885) (2,783) (140) ) 14,962)
Equity in earnings of affiliates . . . . . . . . . . . . . . . . . . . . . . ) 40) ) 40)Income tax provision . . . . . . . . . . . . . . . . . . . . . . . . . . . . 15,094) 900) 1,732) 27) 17,753)Investments in affiliates . . . . . . . . . . . . . . . . . . . . . . . . . . 1,374) ) 135) ) 1,509)Property additions . . . . . . . . . . . . . . . . . . . . . . . . . . . . . . 13,407) 4,916) 1,621) 43) 19,987)Fixed assets . . . . . . . . . . . . . . . . . . . . . . . . . . . . . . . . . . . 132,213) 18,118) 6,033) 49) 156,413))Reconciling items consist primarily of intercompany eliminations and items reported at the corporate level.Sales are attributed to segments and countries based on the location of the selling company. Sales to external customers in Germany
were $57,973,000 in 2003, $50,925,000 in 2002, and $46,865,000 in 2001.
39451 MSA Financials 10F COMBO. 3/25/04 10:52 AM Page 33

34
NOTES TO CONSOLIDATED FINANCIAL STATEMENTSNote 5 – Income Taxes
The U.S. and non-U.S. components of income before income taxes and provisions for income taxes are summarized as follows:
(In thousands)2003 2002 2001
Income From Continuing Operations Before Income TaxesU.S. income . . . . . . . . . . . . . . . . . . . . . . . . . . . . . . . . . . . . . . . . . . . . . . . . . . . . . . . . . . . $64,289) $47,850) $34,190)Non-U.S. income . . . . . . . . . . . . . . . . . . . . . . . . . . . . . . . . . . . . . . . . . . . . . . . . . . . . . . . 15,148) 10,190) 6,226)Currency translation gains (losses) . . . . . . . . . . . . . . . . . . . . . . . . . . . . . . . . . . . . . . . . . . 28) (317) (776)Eliminations . . . . . . . . . . . . . . . . . . . . . . . . . . . . . . . . . . . . . . . . . . . . . . . . . . . . . . . . . . . (5,706) (9,640) 3,964)Income Before Income Taxes . . . . . . . . . . . . . . . . . . . . . . . . . . . . . . . . . . . . . . . . . . . . 73,759) 48,083) 43,604)
Provision For Income TaxesCurrent
Federal . . . . . . . . . . . . . . . . . . . . . . . . . . . . . . . . . . . . . . . . . . . . . . . . . . . . . . . . . . . . 9,608) 8,115) 5,370)State . . . . . . . . . . . . . . . . . . . . . . . . . . . . . . . . . . . . . . . . . . . . . . . . . . . . . . . . . . . . . . 2,526) 610) 404)Non-U.S. . . . . . . . . . . . . . . . . . . . . . . . . . . . . . . . . . . . . . . . . . . . . . . . . . . . . . . . . . . . 7,779) 3,380) 2,720)Total current provision . . . . . . . . . . . . . . . . . . . . . . . . . . . . . . . . . . . . . . . . . . . . . . . . . 19,913) 12,105) 8,494)
DeferredFederal . . . . . . . . . . . . . . . . . . . . . . . . . . . . . . . . . . . . . . . . . . . . . . . . . . . . . . . . . . . . 5,251) 4,101) 8,377)State . . . . . . . . . . . . . . . . . . . . . . . . . . . . . . . . . . . . . . . . . . . . . . . . . . . . . . . . . . . . . . 937) 936) 1,732)Non-U.S. . . . . . . . . . . . . . . . . . . . . . . . . . . . . . . . . . . . . . . . . . . . . . . . . . . . . . . . . . . . (1,266) (272) (850)Total deferred provision . . . . . . . . . . . . . . . . . . . . . . . . . . . . . . . . . . . . . . . . . . . . . . . . 4,922) 4,765) 9,259)
Provision for Income Taxes . . . . . . . . . . . . . . . . . . . . . . . . . . . . . . . . . . . . . . . . . . . . . . 24,835) 16,870) 17,753)
The following is a reconciliation of the U.S. Federal income tax rateto the effective tax rate for continuing operations: 2003 2002 2001
Provision for income taxes at statutory rate . . . . . . . . . . . . . . . . . . . . . . . . . . . . . . . . . . . 35.0% 35.0% 35.0%State income taxes, net of federal benefit . . . . . . . . . . . . . . . . . . . . . . . . . . . . . . . . . . . . 3.0) 2.9) 3.4)Effects of foreign operations . . . . . . . . . . . . . . . . . . . . . . . . . . . . . . . . . . . . . . . . . . . . . . .7 .2)Foreign tax credits . . . . . . . . . . . . . . . . . . . . . . . . . . . . . . . . . . . . . . . . . . . . . . . . . . . . . . (.7) (.5)Valuation allowance . . . . . . . . . . . . . . . . . . . . . . . . . . . . . . . . . . . . . . . . . . . . . . . . . . . . . (1.6)) 3.2) 2.3)Research and development credit . . . . . . . . . . . . . . . . . . . . . . . . . . . . . . . . . . . . . . . . . . (1.1) (.2) (1.0)Adjustment of prior years income taxes . . . . . . . . . . . . . . . . . . . . . . . . . . . . . . . . . . . . . (1.1) (4.4)Other—net . . . . . . . . . . . . . . . . . . . . . . . . . . . . . . . . . . . . . . . . . . . . . . . . . . . . . . . . . . . (.5) (1.4) 1.3Provision for income taxes . . . . . . . . . . . . . . . . . . . . . . . . . . . . . . . . . . . . . . . . . . . . . . . . 33.7% 35.1% 40.7%
The components of deferred taxes are as follows: (In thousands)2003 2002
Deferred tax assetsPostretirement benefits . . . . . . . . . . . . . . . . . . . . . . . . . . . . . . . . . . . . . . . . . . . . . . . . $05,598) $05,628)Inventory reserves . . . . . . . . . . . . . . . . . . . . . . . . . . . . . . . . . . . . . . . . . . . . . . . . . . . . 5,691) 4,836)Vacation allowances . . . . . . . . . . . . . . . . . . . . . . . . . . . . . . . . . . . . . . . . . . . . . . . . . . 1,184) 2,560)Net operating losses . . . . . . . . . . . . . . . . . . . . . . . . . . . . . . . . . . . . . . . . . . . . . . . . . . 7,407) 5,023)Foreign tax credit carryforwards (expiring between 2004 and 2008) . . . . . . . . . . . . . . 1,901) 1,975)Liability insurance . . . . . . . . . . . . . . . . . . . . . . . . . . . . . . . . . . . . . . . . . . . . . . . . . . . . 3,134) 1,363)Basis of capital assets . . . . . . . . . . . . . . . . . . . . . . . . . . . . . . . . . . . . . . . . . . . . . . . . . 6,400) 5,105)Intangibles . . . . . . . . . . . . . . . . . . . . . . . . . . . . . . . . . . . . . . . . . . . . . . . . . . . . . . . . . . 1,409) 1,371)Warranties . . . . . . . . . . . . . . . . . . . . . . . . . . . . . . . . . . . . . . . . . . . . . . . . . . . . . . . . . . 3,528) 1,016)Other . . . . . . . . . . . . . . . . . . . . . . . . . . . . . . . . . . . . . . . . . . . . . . . . . . . . . . . . . . . . . . 5,272) 3,734)Total deferred tax assets . . . . . . . . . . . . . . . . . . . . . . . . . . . . . . . . . . . . . . . . . . . . . . . 41,524) 32,611)Valuation allowance . . . . . . . . . . . . . . . . . . . . . . . . . . . . . . . . . . . . . . . . . . . . . . . . . . . (587) (1,975)Net deferred tax assets . . . . . . . . . . . . . . . . . . . . . . . . . . . . . . . . . . . . . . . . . . . . . . . . 40,937) 30,636)
Deferred tax liabilitiesDepreciation . . . . . . . . . . . . . . . . . . . . . . . . . . . . . . . . . . . . . . . . . . . . . . . . . . . . . . . . (20,033) (26,213)Pension . . . . . . . . . . . . . . . . . . . . . . . . . . . . . . . . . . . . . . . . . . . . . . . . . . . . . . . . . . . . (44,752) (37,296)Other . . . . . . . . . . . . . . . . . . . . . . . . . . . . . . . . . . . . . . . . . . . . . . . . . . . . . . . . . . . . . . (6,060) (333)Total deferred tax liabilities . . . . . . . . . . . . . . . . . . . . . . . . . . . . . . . . . . . . . . . . . . . . . (70,845) (63,842)
Net deferred taxes . . . . . . . . . . . . . . . . . . . . . . . . . . . . . . . . . . . . . . . . . . . . . . . . . . . . . . (29,908) (33,206)
During 2003, the company released $1.2 million of foreign tax credit carry forward valuation allowances based on theimplementation of various tax planning strategies and an improved outlook for utilization of these credits in future years.
Net operating loss carryforwards of $6,817,000 have no expiration date and $66,000, $471,000 and $53,000 expire in 2006, 2008and 2013, respectively.
Undistributed earnings of international companies for which U.S. income taxes have not been provided were $90,927,000 atDecember 31, 2003.
39451 MSA Financials 10F COMBO. 3/25/04 10:52 AM Page 34

35
Note 6 – Stock PlansThe 1998 Management Share Incentive Plan provides for grants of restricted stock awards and stock options to eligible key employees
through March 2008.The 1990 Non-Employee Directors’ Stock Option Plan, as amended April 1, 2001, provides for annual grants ofstock options and restricted stock awards to eligible directors.As of December 31, 2003, there were 1,684,815 shares and 162,021shares, respectively, reserved for future grants under these plans.
Restricted stock awards are granted without payment to the company in consideration of services to be performed in the ensuingthree years (four years for employee awards prior to 2002). Restricted stock awards of 81,705 shares (fair value of $944,000), 69,594shares (fair value of $915,000), and 2,580 shares (fair value of $25,000) were granted in 2003, 2002, and 2001, respectively. Restrictedstock awards expense charged to operations was $716,000 in 2003, $766,000 in 2002, and $437,000 in 2001.
Stock options are generally granted at market value option prices and expire after ten years (limited instances of option prices inexcess of market value and expiration after five years). Stock options granted in 2003 are exercisable beginning one year after the grantdate. Options granted prior to 2003 were exercisable six months after the grant date.
During November 2003, the company made a special distribution of $1.46 per common share to shareholders of record onNovember 14, 2003. For options outstanding as of November 12, 2003, the ex-distribution date, option shares and exercise prices wereadjusted to reflect the change in intrinsic value that resulted from the special distribution.The adjustments were based on the ratio ofthe change in the market price of common stock that occurred as a result of the special distribution.
A summary of option activity under the two plans follows:Weighted-Average Exercisable
Shares Exercise Price at Year-endOutstanding January 1, 2001 . . . . . . . . . . . 1,634,382) $ 6.69)Granted . . . . . . . . . . . . . . . . . . . . . . . . . . . 733,032) 8.46)Exercised . . . . . . . . . . . . . . . . . . . . . . . . . . (1,111,023) 6.95)Forfeited . . . . . . . . . . . . . . . . . . . . . . . . . . (15,930) 6.26)Outstanding December 31, 2001 . . . . . . . . 1,240,461) 7.52) 1,240,461Granted . . . . . . . . . . . . . . . . . . . . . . . . . . . 552,165) 13.17)Exercised . . . . . . . . . . . . . . . . . . . . . . . . . . (313,812) 7.23)Outstanding December 31, 2002 . . . . . . . . 1,478,814) 9.69) 1,478,814Granted . . . . . . . . . . . . . . . . . . . . . . . . . . . 744,630) 11.58)Exercised before adjustment . . . . . . . . . . . (259,752) 8.16)Adjustment for special distribution . . . . . . . 153,057) (.77)Exercised after adjustment . . . . . . . . . . . . (101,199) 9.06)Outstanding December 31, 2003 . . . . . . . . 2,015,550) 9.88) 1,270,920
The following table summarizes information about options outstanding at December 31, 2003:
Range of Exercise Weighted-AverageShares Price per Share Exercise Price Remaining Life
677,046 $5.88 - $7.80 $ 7.14 6.5 781,203 $9.03 - $10.65 10.60 9.1 557,301 $11.72 - $13.57 12.20 7.8
2,015,550 $ 5.88 - $13.57 9.88 7.9
39451 MSA Financials 10F COMBO. 3/25/04 10:52 AM Page 35

36
NOTES TO CONSOLIDATED FINANCIAL STATEMENTSNote 7 – Pensions and Other Postretirement Benefits
The company maintains various defined benefit and defined contribution plans covering the majority of its employees.The princi-pal U.S. plan is funded in compliance with the Employee Retirement Income Security Act (ERISA). It is the general policy to fundcurrent costs for the international plans except in Germany and Mexico, where it is common practice and permissible under tax lawsto accrue book reserves.
A minimum liability is recognized for unfunded defined benefit plans for which the accumulated benefit obligation exceeds accruedpension costs.The amount of the minimum liability in excess of unrecognized prior service cost, net of tax benefit, is recorded as areduction in shareholders’ equity. Non-contributory plan benefits are generally based on years of service and employees’ compensationduring the last years of employment. Benefits are paid from funds previously provided to trustees or are paid by the company andcharged to the book reserves.
The company provides certain health care benefits and limited life insurance for retired employees and their eligible dependents.
Information pertaining to defined benefit pension plans and other postretirement benefits plans is provided in the following table.
(In thousands)Pension Benefits Other Benefits
2003 2002 2003 2002Change in Benefit Obligations
Benefit obligations at January 1 . . . . . . . . . . . . . . . . . . . . . . . . . . . . . . . $218,010) $193,603) $20,677) $21,835)Service cost . . . . . . . . . . . . . . . . . . . . . . . . . . . . . . . . . . . . . . . . . . . . . . 6,802) 5,378) 423) 392)Interest cost . . . . . . . . . . . . . . . . . . . . . . . . . . . . . . . . . . . . . . . . . . . . . . 14,036) 12,917) 1,395) 1,404)Employee contributions . . . . . . . . . . . . . . . . . . . . . . . . . . . . . . . . . . . . . 159) 214)Plan amendments . . . . . . . . . . . . . . . . . . . . . . . . . . . . . . . . . . . . . . . . . . 000) 454) (0,000) (1,319)Actuarial losses . . . . . . . . . . . . . . . . . . . . . . . . . . . . . . . . . . . . . . . . . . . . 10,844) 11,666) 2,509) 487)Benefits paid . . . . . . . . . . . . . . . . . . . . . . . . . . . . . . . . . . . . . . . . . . . . . . (13,178) (12,242) (2,131) (2,122)Curtailments . . . . . . . . . . . . . . . . . . . . . . . . . . . . . . . . . . . . . . . . . . . . . . (2,143)Currency translation effects . . . . . . . . . . . . . . . . . . . . . . . . . . . . . . . . . . 9,810) 6,020)Benefit obligations at December 31 . . . . . . . . . . . . . . . . . . . . . . . . . . . . 244,340) 218,010) 22,873) 20,677)
Change in Plan AssetsFair value of plan assets at January 1 . . . . . . . . . . . . . . . . . . . . . . . . . . . 269,836) 314,122)Actual return on plan assets . . . . . . . . . . . . . . . . . . . . . . . . . . . . . . . . . . 97,710) (32,599)Employer contributions . . . . . . . . . . . . . . . . . . . . . . . . . . . . . . . . . . . . . . 3,822) 2,433) 231) 122)Employee contributions . . . . . . . . . . . . . . . . . . . . . . . . . . . . . . . . . . . . . 223) 263)Benefits paid . . . . . . . . . . . . . . . . . . . . . . . . . . . . . . . . . . . . . . . . . . . . . . (13,178) (12,242) (2,131) (2,122)Section 420 transfer to retiree medical plan . . . . . . . . . . . . . . . . . . . . . . (1,900) (2,000) 1,900) 2,000)Reimbursement of German benefits . . . . . . . . . . . . . . . . . . . . . . . . . . . (2,478) (719)Currency translation effects . . . . . . . . . . . . . . . . . . . . . . . . . . . . . . . . . . 2,442) 578)Fair value of plan assets at December 31 . . . . . . . . . . . . . . . . . . . . . . . . 356,477) 269,836)
Funded StatusFunded status at December 31 . . . . . . . . . . . . . . . . . . . . . . . . . . . . . . . 112,137) 51,826) (22,873) (20,677)Unrecognized transition gains . . . . . . . . . . . . . . . . . . . . . . . . . . . . . . . . . 342) (137)Unrecognized prior service cost . . . . . . . . . . . . . . . . . . . . . . . . . . . . . . . 1,323) 1,647) (1,910) (2,138)Unrecognized net actuarial (gains)/losses . . . . . . . . . . . . . . . . . . . . . . . . (46,909) 9,846) 8,686) 6,768)Prepaid (accrued) benefit cost . . . . . . . . . . . . . . . . . . . . . . . . . . . . . . . . . 66,893) 63,182) (16,097) (16,047)
Amounts Recognized in the Balance SheetPrepaid benefit cost . . . . . . . . . . . . . . . . . . . . . . . . . . . . . . . . . . . . . . . . 121,290) 107,338)Accrued benefit liability . . . . . . . . . . . . . . . . . . . . . . . . . . . . . . . . . . . . . . (56,785) (46,226) (16,097) (16,047)Intangible asset . . . . . . . . . . . . . . . . . . . . . . . . . . . . . . . . . . . . . . . . . . . . 524) 557)Minimum pension liability adjustments . . . . . . . . . . . . . . . . . . . . . . . . . . 1,864) 1,513)Prepaid (accrued) benefit cost . . . . . . . . . . . . . . . . . . . . . . . . . . . . . . . . . 66,893) 63,182) (16,097) (16,047)
Accumulated Benefit Obligation for all Defined Benefit Plans . . . . . . . 202,856) 177,424)
(In thousands) Pension Benefits Other BenefitsComponents of Net Periodic Benefit Cost (Credit) 2003 2002 2001 2003 2002 2001
Service cost................................................................. $0,6,802) $0,5,378) $0,4,645) $0,423) $0,392) $0,502)Interest cost ................................................................ 14,036) 12,917) 12,393) 1,395) 1,404) 1,488)Expected return on plan assets.................................. (27,785) (27,332) (27,202) )Amortization of transition asset.................................. (509) (592) (597)Amortization of prior service cost .............................. 310) 298) 300) (228) (138) (108)Recognized net actuarial (gains) losses ..................... (1,677) (3,794) (4,745) 590) 552) 377)Curtailment (gain) loss ................................................ (2,022) ) 244) )Net periodic benefit (credit) cost................................ (10,845) (13,125) (14,962) 2,180) 2,210) 2,259)
39451 MSA Financials 10F COMBO. 3/25/04 10:52 AM Page 36

37
Pension Benefits Other BenefitsAssumptions used to determine benefit obligations 2003 2002 2003 2002
Discount rate............................................................... 6.1% 6.4% 6.3% 6.5%Rate of compensation increase.................................. 3.5% 3.5%
Assumptions used to determine net periodic benefit costDiscount rate............................................................... 6.3% 6.4% 6.5% 7.0%Expected return on plan assets.................................. 8.5% 8.4%Rate of compensation increases................................ 3.5% 3.5%
The expected return on assets for the 2003 net periodic pension cost was determined by multiplying the expected returns ofeach asset class (based on historical returns) by the expected percentage of the total portfolio invested in that asset class.A totalreturn was determined by summing the expected returns over all asset classes.
Plan Assets at December 31Asset Category 2003 2002
Equity securities.......................................................... 79.2% 74.5% Debt securities............................................................ 15.3% 20.2% Real estate .................................................................. 0.3% 0.3% Cash/other................................................................... 5.2% 5.0% Total ............................................................................. 100.0% 100.0%
Investment policies are determined by the Plan’s Investment Committee and set forth in the Plan’s Investment Policy.Asset managersare granted discretion for determining sector mix, selecting securities and timing transactions, subject to the guidelines of theInvestment Policy.An aggressive, flexible management of the portfolio is permitted. No target asset allocations are set forth in theInvestment Policy.
The company expects to make net contributions of $1.3 million to its pension plans in 2004For measurement purposes, a 7.5% increase in the costs of covered health care benefits was assumed for the year 2003, decreasing
by .5% for each successive year to 4% in 2010 and thereafter.A one-percentage-point change in assumed health care cost trend rateswould have increased or decreased the other postretirement benefit obligations and current year plan expense by approximately$1.0 million and $100,000, respectively.
Expense for defined contribution pension plans was $3,360,000 in 2003, $3,049,000 in 2002, and $2,739,000 in 2001.The U.S. defined benefit pension plan owned 2,533,500 shares (market value $67.1 million) at December 31, 2003 and 3,049,500
shares (market value $32.8 million) at December 31, 2002 of the company’s common stock.The pension plan received dividends anddistributions of $4,506,865 and $666,650, respectively, on these shares.
In December 2003, Congress enacted the Medicare Prescription Drug, Improvement and Modernization Act of 2003.The actincorporates a plan sponsor subsidy based on a percentage of the beneficiary’s annual prescription drug benefits, within certain limits,and provides the retiree with the opportunity to obtain prescription drugs under Medicare. Specific authoritative guidance on theaccounting for federal subsidy is pending and that guidance, when issued, could require plan sponsors to change previously reportedinformation. Management is currently evaluating the effect of the act on the company, but does not expect the reductions in postretire-ment benefit costs to be significant. In accordance with FASB Staff Position FAS 106-1, the company has elected to defer accountingfor the effect of the act.Accordingly, the benefit obligation and net periodic benefit cost do not reflect any potential effects of the act.
Note 8 – Earnings per ShareBasic earnings per share is computed on the weighted average number of common shares outstanding during the period. Diluted
earnings per share includes the effect of the weighted average stock options outstanding during the period, using the treasury stockmethod.Antidilutive options are not considered in computing diluted earnings per share.
(In thousands)2003 2002 2001
Net income from continuing operations . . . . . . . . . . . . . . . . . . . . . . . . . . . . . . . . . . . . . . . . . . $48,924) $31,213) $25,851)Preferred stock dividends . . . . . . . . . . . . . . . . . . . . . . . . . . . . . . . . . . . . . . . . . . . . . . . . . . . . (46) (47) (48)Income available to common shareholders . . . . . . . . . . . . . . . . . . . . . . . . . . . . . . . . . . . . . . . 48,878) 31,166) 25,803)
Basic shares outstanding . . . . . . . . . . . . . . . . . . . . . . . . . . . . . . . . . . . . . . . . . . . . . . . . . . . . . 36,730) 36,512) 35,729)Stock options . . . . . . . . . . . . . . . . . . . . . . . . . . . . . . . . . . . . . . . . . . . . . . . . . . . . . . . . . . . . . . 534) 373) 508)Diluted shares outstanding . . . . . . . . . . . . . . . . . . . . . . . . . . . . . . . . . . . . . . . . . . . . . . . . . . . 37,264) 36,885) 36,237)Antidilutive stock options . . . . . . . . . . . . . . . . . . . . . . . . . . . . . . . . . . . . . . . . . . . . . . . . . . . . . 0) 552) 0)
39451 MSA Financials 10F COMBO. 3/25/04 10:52 AM Page 37

38
NOTES TO CONSOLIDATED FINANCIAL STATEMENTSNote 9 – Accounts Receivable Securitization
The company has securitization agreements with MineSafety Funding Corporation (MSF) under which the companysells MSF, on a continuous basis, an undivided interest ineligible trade accounts receivable generated by the company,while maintaining a subordinated interest in a portion of thereceivables. MSF is an unconsolidated wholly-owned, bank-ruptcy-remote subsidiary of the company. Financial assets, netof retained interests, are removed from the balance sheet whenthe assets are sold and control is surrendered.The companyservices the sold receivables for MSF at market rates and,accordingly, no servicing asset or liability has been recorded.MSF and the company have also entered into securitizationagreements with financial institutions under which MSF maysell up to $30 million of accounts receivable to a multi-sellerasset-backed commercial paper issuer.
At December 31, 2003, accounts receivable of $55.2 millionwere owned by MSF.The company held a subordinated interestin these receivables of $40.0 million, of which $39.0 million isclassified as other receivables. Net proceeds to the companyfrom the securitization arrangement were $15.0 million atDecember 31, 2003.The company incurred net costs associatedwith the securitization facility of $1.8 million in 2003, repre-senting the discount loss on the sale of the receivables, partiallyoffset by related servicing income and dividends received fromMSF. The net cost includes $473,000 in bad debt expenseborne by MSF during 2003.
At December 31, 2002, accounts receivable of $66.2 millionwere owned by MSF.The company held a subordinated inter-est in these receivables of $36.5 million, of which $35.5 mil-lion is classified as other receivables. Net proceeds to thecompany from the securitization arrangement were $29.0million at December 31, 2002.The company incurred netcosts associated with the securitization facility of $2.1 millionin 2002, representing the discount loss on the sale of thereceivables, partially offset by related servicing income anddividends received from MSF.The net cost includes $884,000in bad debt expense borne by MSF during 2002.
The key economic assumptions used to measure theretained interest at December 31, 2003 were a discount rate of3.3% and an estimated life of 2.2 months. At December 31,2003, an adverse change in the discount rate or estimated lifeof 10% and 20% would reduce the fair value of the retainedinterest by $32,000 and $64,000, respectively.The effect ofhypothetical changes in fair value based on variations inassumptions should be used with caution and generally cannotbe extrapolated.Additionally, the effect on the fair value of theretained interest of changing a particular assumption has beencalculated without changing other assumptions. In reality, achange in one factor may result in changes in others.
Note 10 – Inventories(In thousands)
2003 2002Finished products . . . . . . . . . . . . . . . . . $34,660 $25,928Work in process . . . . . . . . . . . . . . . . . . 17,476 14,936Raw materials and supplies . . . . . . . . . . 37,967 35,884Total inventories . . . . . . . . . . . . . . . . . . 90,103 76,748Excess of FIFO costs over LIFO costs . 39,083 39,431
Inventories stated on the LIFO basis represent 40%, 38%,and 52% of the total inventories at December 31, 2003, 2002,and 2001, respectively.
Reductions in certain inventory quantities during 2002resulted in liquidations of LIFO inventories carried at lowercosts prevailing in prior years.The effect of these liquidationsreduced cost of sales by $387,000 in 2002, and increased netincome by $235,000.
Note 11 – Long-Term Debt(In thousands)
2003 2002U.S.Industrial development debt issuespayable through 2022, 1.3% . . . . . . . $10,750 $10,750
Series B Senior Notes payable through 2006, 7.69% . . . . . . 12,000 16,000
Senior Notespayable through 2012, 8.39% . . . . . . 40,000 40,000
Other . . . . . . . . . . . . . . . . . . . . . . . . . . 150 200InternationalVarious notes payable through 2010,5.06% to 19.0% . . . . . . . . . . . . . . . . 1,853 2,364
Total . . . . . . . . . . . . . . . . . . . . . . . . . . . . 64,753 69,314Amounts due within one year . . . . . . . . 4,838 4,964Long-term debt . . . . . . . . . . . . . . . . . . . 59,915 64,350
Approximate maturities of these obligations over the nextfive years are $4,838,000 in 2004, $4,561,000 in 2005,$8,231,000 in 2006, $105,000 in 2007, and $8,105,000 in2008. Some debt agreements require the company to maintaincertain financial ratios and minimum net worth and containrestrictions on the total amount of debt.
Note 12 – Other Income(In thousands)
2003 2002 2001Interest . . . . . . . . . . . . . . . . $1,071) $0953) $1,183)Rent . . . . . . . . . . . . . . . . . . 532) 710) 739)Dividends . . . . . . . . . . . . . . 1,048) 725) 625)Dispositions of assets . . . . . (826) (864) (136)Other, net . . . . . . . . . . . . . . (101) 747) 365)Total . . . . . . . . . . . . . . . . . . 1,724) 2,271) 2,776)
Note 13 – LeasesThe company leases office space, manufacturing and ware-
house facilities, automobiles and other equipment underoperating lease arrangements. Rent expense was $9,120,000 in2003, $6,879,000 in 2002, and $6,020,000 in 2001. Minimumrental commitments under noncancelable leases are $5,262,000in 2004, $4,259,000 in 2005, $3,621,000 in 2006, $2,739,000in 2007, $2,657,000 in 2008, and $9,075,000 after 2008.
39451 MSA Financials 10F COMBO. 3/25/04 10:52 AM Page 38

39
Note 14 – Goodwill and Intangible AssetsDuring 2002, the company adopted FAS No. 142, Goodwill
and Other Intangible Assets. Under this standard, goodwill andother intangible assets with indefinite lives are not amortized,but are subject to impairment tests that must be performed atleast annually. Transitional impairment tests performed as ofJanuary 1, 2002 indicated that no goodwill impairment existedand as a result the company did not recognize a transitionalimpairment loss.Annual goodwill impairment tests performedduring the fourth quarters of 2002 and 2003 also indicatedthat no goodwill impairment existed and as a result thecompany has not recognized an impairment loss.
The effects of adopting the non-amortization provisions ofFAS 142 on net income from continuing operations and basicearnings per share were as follows:
(In thousands, except per share amounts)2003 2002 2001
Reported net income fromcontinuing operations . . . . . $48,924 $31,213 $25,851
Goodwill amortization, net of tax 1,365Adjusted net income from
continuing operations . . . . . 48,924 31,213 27,216Basic earnings per share:Reported net income from
continuing operations . . . . . $1.33 $ .85 $ .72Goodwill amortization, net of tax .04Adjusted net income from
continuing operations . . . . . 1.33 .85 .76
Intangible assets include patents and license agreements thatwill be fully amortized in 2005 and 2008, respectively. Theseitems are included in other noncurrent assets. At December 31,2003, intangible assets totaled $3,307,000, net of accumulatedamortization of $2.9 million. Intangible asset amortizationexpense is expected to be $702,000 in 2004, $655,000 in 2005,$650,000 in 2006, $650,000 in 2007 and $650,000 in 2008.
Changes in goodwill and intangible assets, net of accumulatedamortization during the year ended December 31, 2003 wereas follows:
(In thousands)Goodwill Intangibles
Net balances at January 1, 2003 $42,963 $ 171)Goodwill acquired 200Intangibles acquired 3,250)Amortization expense (114)Currency translation and other 1,647Net balances at December 31, 2003 44,810 3,307)
At December 31, 2003, goodwill of $34.3 million and $10.5million related to the North American and European operatingsegments, respectively.
Note 15 – Short-Term DebtShort-term bank lines of credit amounted to $20,403,000
of which $19,575,000 was unused at December 31, 2003.Generally, these short-term lines of credit are renewable annu-ally, and there are no significant commitment fees or compen-sating balance requirements. Short-term borrowings withbanks, which exclude the current portion of long-term debt,were $828,000 and $9,096,000 at December 31, 2003 and2002, respectively. The average month-end balance of totalshort-term borrowings during 2003 was $560,000 while themaximum month-end balance of $1,929,000 occurred atMarch 31, 2003.The average interest rate during 2003 was
approximately 9% based upon total short-term interest expensedivided by the average month-end balance outstanding, and3% at year-end.
Note 16 – AcquisitionsOn April 30, 2002, the company acquired CGF Gallet of
Lyon, France, the leading European manufacturer of protectivehelmets for the fire service, as well as head protection for thepolice and military.The acquisition of Gallet complements thecompany’s strong existing line of fire service products and pro-vides the opportunity to capitalize on opportunities in otherareas where Gallet is strong – such as the law enforcement,military, and aviation markets. Gallet’s results of operations havebeen included in the company’s consolidated financial state-ments from the acquisition date.
The aggregate purchase price was $16.6 million of cash andincludes amounts paid to the previous owners and other directexternal costs associated with the acquisition.The acquisitionwas recorded using the purchase method of accounting and,accordingly, the purchase price was allocated to assets acquiredand liabilities assumed based on their estimated fair values atthe acquisition date.
The following table summarizes the estimated fair values ofthe Gallet assets acquired and the liabilities assumed at the dateof acquisition:
April 30(In thousands) 2002Current assets.............................................. $17,427Property ....................................................... 5,800Goodwill ....................................................... 7,863Total assets acquired ................................... 31,090Current Liabilities ......................................... 11,093Long term debt ............................................ 3,016Other liabilities ............................................. 349Total liabilities assumed ............................... 14,458Net assets acquired ..................................... 16,632
Goodwill related to the Gallet acquisition, which is includedin the European operating segment, is not expected to bedeductible for tax purposes.
On February 1, 2001, the company acquired SuretyManufacturing and Testing, Ltd. (Surety), a leading provider offall protection equipment and rescue systems.The acquisitionwas recorded using the purchase method of accounting.Thepurchase price of $7.1 million was allocated to assets acquiredand liabilities assumed based on estimated fair values andincluded $5.6 million in goodwill, which is included in theNorth American operating segment.
The results of operations of Surety are included in the finan-cial statements from the acquisition date.
The following unaudited pro forma summary presents thecompany’s consolidated results as if the acquisitions hadoccurred at the beginning of 2001.The pro forma informationdoes not necessarily reflect the actual results that would haveoccurred and is not necessarily indicative of future results ofoperations for the combined companies.
(In thousands, except earnings per share)2003 2002 2001
Net sales . . . . . . . . . . . . . . $696,473 $578,252 $535,317Net income from
continuing operations . . . 48,924 32,189 26,559Basic earnings per share . . 1.33 .88 .74
39451 MSA Financials 10F COMBO. 3/25/04 10:52 AM Page 39

40
NOTES TO CONSOLIDATED FINANCIAL STATEMENTSNote 17 – Discontinued Operations
On September 12, 2003, the company sold certain assets of the Callery Chemical Division to BASF Corporation for $64.6 million.The operating results of the Callery Chemical Division and the gain on the sale of the division, as summarized below, have been
classified as discontinued operations for all periods presented. Net income from discontinued operations for 2002 includes $42,000 ofexpenses directly related to the sale of the division.
(In thousands)2003 2002 2001
Net sales . . . . . . . . . . . . . . . . . . . . . . . . . . . . . . . . . . . . . . . . . . . . . . . . . . . . . . . . . . . . . $21,345 $29,473 $33,120
Income before income taxes . . . . . . . . . . . . . . . . . . . . . . . . . . . . . . . . . . . . . . . . . . . . . . 4,210 6,147 9,282Provision for income taxes . . . . . . . . . . . . . . . . . . . . . . . . . . . . . . . . . . . . . . . . . . . . . . . . 1,525 2,283 3,502Net income from discontinued operations . . . . . . . . . . . . . . . . . . . . . . . . . . . . . . . . . . . . 2,685 3,864 5,780
Gain on sale of discontinued operations . . . . . . . . . . . . . . . . . . . . . . . . . . . . . . . . . . . . . . $22,390Provision for income taxes . . . . . . . . . . . . . . . . . . . . . . . . . . . . . . . . . . . . . . . . . . . . . . . . 8,732Gain on sale of discontinued operations – after tax . . . . . . . . . . . . . . . . . . . . . . . . . . . . . 13,658
At December 31, 2003 and 2002, discontinued operations net assets classified as held for sale consisted of the following:
(In thousands)2003 2002
Accounts receivable and other current assets . . . . . . . . . . . . . . . . . . . . . . . . . . . . . . . . . $2,311 $ 7,983Inventory . . . . . . . . . . . . . . . . . . . . . . . . . . . . . . . . . . . . . . . . . . . . . . . . . . . . . . . . . . . . . 7,705Property, net . . . . . . . . . . . . . . . . . . . . . . . . . . . . . . . . . . . . . . . . . . . . . . . . . . . . . . . . . . 29,374Net assets held for sale . . . . . . . . . . . . . . . . . . . . . . . . . . . . . . . . . . . . . . . . . . . . . . . . . . 2,311 45,062
Note 18 – ContingenciesVarious lawsuits and claims arising in the normal course of business are pending against the company.These lawsuits are primarily
product liability claims. Pending claims include several multi-party asbestosis or silicosis suits, generally as a result of the presence ofsafety equipment supplied by MSA and other manufacturers at locations named in the suits.While the amounts claimed may besubstantial, the ultimate liability of the company is not determinable because of uncertainties, including the number of defendants ineach suit and the jurisdiction.
The company maintains a reserve for uninsured product liability based on expected settlement charges for pending claims and anestimate of unreported claims derived from experience, sales volumes, and other relevant information.The company reevaluates its expo-sures on an ongoing basis and makes adjustments to reserves as appropriate. Based on information currently available, managementbelieves that the disposition of matters that are pending will not have a materially adverse effect on the financial position of the company.
The company has retained responsibility for certain environmental costs at the Callery Chemical site in the event that correctiveaction is required by governmental regulations. Under the terms of the asset purchase agreement with BASF, MSA’s maximum liabilityfor these matters is capped at $50.0 million. Based on environmental studies performed prior to the sale of the division, the companydoes not believe that its potential exposure under the terms of this agreement will materially affect the results of operations, cash flows,or financial condition.
Note 19 – Quarterly Financial Information (Unaudited)2003 2002
(In thousands, except earnings per share) Quarters Quarters1st 2nd 3rd 4th Year 1st 2nd 3rd 4th Year
Net sales . . . . . . . . . . . . . . . . . . . . . $160,391 $175,939 $171,927 $188,216 $696,473 $128,058 $141,862 $143,398 $151,108 $564,426Gross profit . . . . . . . . . . . . . . . . . . 66,538 72,652 69,918 79,146 288,254 55,638 57,090 57,910 62,573 233,211
Net income from continuing operations 10,499 12,192 10,984 15,249 48,924 7,724 7,897 5,323 10,269 31,213Net income from discontinuedoperations . . . . . . . . . . . . . . . . . 1,514 1,273 (102) 2,685 260 1,587 470 1,547 3,864
Gain on sale of discontinuedoperations – after tax . . . . . . . . . . 13,658 13,658
Net income . . . . . . . . . . . . . . . . . . 12,013 13,465 24,540 15,249 65,267 7,984 9,484 5,793 11,816 35,077
Basic earnings per share:Continuing operations . . . . . . . . . . .29 .33 .30 .41 1.33 .21 .21 .15 .28 .85Discontinued operations . . . . . . . . .04 .04 .37 .45 .01 .04 .01 .05 .11Total . . . . . . . . . . . . . . . . . . . . . . .33 .37 .67 .41 1.78 .22 .25 .16 .33 .96
Diluted earnings per share:Continuing operations . . . . . . . . . . .29 .33 .29 .40 1.31 .21 .21 .15 .28 .85Discontinued operations . . . . . . . . .04 .04 .36 .44 .01 .03 .01 .05 .10Total . . . . . . . . . . . . . . . . . . . . . . .33 .37 .65 .40 1.75 .22 .24 .16 .33 .95
39451 MSA Financials 10F COMBO. 3/25/04 10:52 AM Page 40

41
(In thousands, except as noted) 2003 2002 2001 2000 1999
Summary of Operations
Net sales $696,473) $564,426) $509,736) $468,307) $462,166)
Other income 1,724) 2,271) 2,776) 2,444) 3,619)
Cost of products sold 408,219) 331,215) 292,940) 277,972) 282,687)
Selling, general and administrative 170,081) 140,924) 130,092) 124,840) 131,281)
Research and development 21,722) 20,372) 16,740) 15,988) 15,235)
Depreciation and amortization 23,208) 21,525) 22,590) 20,936) 20,550)
Interest expense 4,564) 4,769) 5,349) 4,040) 3,916)
Currency exchange (gains) losses (3,356) (191) 1,197) (444) (694)
Provision for income taxes 24,835) 16,870) 17,753) 8,531) 3,098)
Net income from continuing operations 48,924) 31,213) 25,851) 18,888) 9,712)
Net income from discontinued operations 2,685) 3,864) 5,780) 4,351) 6,614)
Gain on sale of discontinued operations - after tax 13,658) )
Change in reporting period, net of tax ) ) ) 0(1,192)
Net Income 65,267) 35,077) 31,631) 23,239) 15,134)
Basic per common share continuing operations (in dollars) 1.33) .85) .72) .51) .22)
Diluted per common share continuing operations (in dollars) 1.31) .85) .71) .51) .22)
Dividends paid per common share (in dollars) .26) .22) .18) .16) .15)
Weighted average number of common shares outstanding—basic 36,730) 36,512) 35,729) 36,904) 38,917)
Year-End Position
Working capital $206,216 $138,182 $135,186) $114,175) $123,085)
Working capital ratio 2.8 2.4 2.6) 2.3) 2.5)
Net property 120,560 130,407 156,413) 159,586) 163,509)
Total assets 643,885 579,765 520,698) 489,683) 451,741)
Long-term debt 59,915 64,350 67,381) 71,806) 36,550)
Common shareholders’ equity 306,867 288,009 252,451) 225,382) 241,374)
Equity per common share (in dollars) 8.31 7.86 6.95) 6.35) 6.25)
Market capitalization 00978,715 393,677 485,844) 297,169) 274,624)
Notes:Cost of products sold and operating expenses include noncash pension income.a. Noncash pension income, pre-tax $ 8,845 $ 13,125 $14,962) $14,900) $10,175)
b. In 1999, the fiscal year end for certain international affiliates was changed from November 30th to December 31st. The after-taxeffect of the change in reporting period is included in the 1999 income statement as a change in accounting principle.
c. Working capital at December 31, 2003 and 2002 excludes assets held for sale.
SUMMARY OF SELECTED FINANCIAL DATA
39451 MSA Financials 10F COMBO. 3/25/04 10:52 AM Page 41

42
MSAPrincipal OperationsNorth America
Mine Safety Appliances Company,Corporate Headquarters – Pittsburgh, PA
Manufacturing – Clifton, NJ; Cranberry Twp., PA;Englewood, CO; Evans City, PA;Jacksonville, NC; Murrysville, PA;Newport,VT; Sparks, MD
Research – John T. Ryan Memorial Laboratory,Cranberry Twp., PA
MSA Canada,Toronto; MSA Gallet, QuebecMSA de Mexico, S.A. de C.V., Mexico City
EuropeMSA Europe (Headquarters), Berlin, GermanyAritron Instrument A.G., Forch, SwitzerlandMSA-Auer Almay, Almaty, Kazakhstan (Service Center/Office)MSA Auer, Berlin, GermanyMSA-Auer GmbH, Czech o.z., Praha, Czech (Service Center)MSA-Auer Polska Sp. z o.o.,Warsaw, PolandMSA-Auer Poznan, Poznan, Poland (Service Center)MSA-Auer Hungaria Safety Technology, Budapest, HungaryMSA-Auer Kiev, Kyiv, Ukraine (Representative Office)MSA-Auer Miskolc,Tiszaujvaros, Hungary (Service Center)MSA-Auer GmbH Romania, o.z., Bucuresti, Romania (Branch)MSA-Auer Petrosani, Petrosani, Romania (Service Center)MSA-Auer Moscow, Moscow, Russia (Representative Office)MSA-Auer Sicherheitstechnik Vertriebs GmbH, Absdorf,AustriaMSA-Auer GmbH, Slovakia o.z., Pezinok, Slovakia (Service Center)MSA-Auer Szczecin, Szczecin, Poland (Service Center)MSA Belgium, N.V., LierMSA (Britain) Limited, GlasgowMSA Española, S.A., BarcelonaMSA de France, ParisMSA Gallet, Chatillon sur Chalaronne, France;
Mohammedia, MoroccoMSA Italiana S.p.A., MilanMSA Nederland, B.V., HoornMSA Nordic, Malmo, Sweden
InternationalMSA Africa (Pty.) Ltd., JohannesburgMSA de Argentina S.A., Buenos AiresMSA (Aust.) Pty. Limited, SydneyMSA (Australia), Auckland, New Zealand (Branch Office)MSA do Brasil Ltda., São PauloMSA de Chile Ltda., SantiagoMSA (India) Limited, CalcuttaMSA Japan Ltd.,TokyoMSA Safety Malaysia Snd Bhd, Kuala LumpurMSA Middle East, Abu Dhabi, U.A.E.MSA del Peru S.A.C., LimaMSA S.E.Asia Pte. Ltd., SingaporeMSA Zimbabwe (Pvt.) Limited, HarareWuxi-MSA Safety Equipment Co., Ltd.,Wuxi, China
Board of DirectorsJohn T. Ryan III (1) (4)
Chairman of the Board and Chief Executive OfficerCalvin A. Campbell, Jr. (2) (3) (4)
Retired, formerly Chairman, President andChief Executive Officer, Goodman Equipment Corporation (manufactured underground mining and tunnelinglocomotives and parts and services for plastics injectionmolding machinery)
James A. Cederna (2) (3)Founder and owner, Cederna International, Inc.
Thomas B. Hotopp (1)Retired, formerly President Mine Safety Appliances Company
Diane M. Pearse (2)Chief Financial Officer, Crate and Barrel(home furnishings retailer)
L. Edward Shaw, Jr. (3) (4)Attorney in private practice
John C. Unkovic (3) (4)Partner and General Counsel – Reed Smith LLP(full service law firm)
Thomas H.Witmer (1) (2) (3)Chairman, Granite State Log Homes (log home construction)
(1) Member of Executive Committee(2) Member of Audit Committee(3) Member of Compensation Committee(4) Member of Nominating and Governance Committee
Director EmeritusEugene W. Merry
OfficersJohn T. Ryan III
Chairman of the Board and Chief Executive OfficerJames H. Baillie
Vice President; President, MSA EuropeJoseph A. Bigler
Vice PresidentKerry M. Bove
Vice PresidentRoberto Cañizares
Vice President; President, InternationalBenedict DeMaria
Vice PresidentRonald N. Herring, Jr.
Vice PresidentWilliam M. Lambert
Vice President; President, North AmericaDouglas K. McClaine
Secretary and General CounselDennis L. Zeitler
Vice President, Chief Financial Officer and Treasurer
39451 MSA Financials 10F COMBO. 3/25/04 10:52 AM Page 42

MSA BOARD OF DIRECTORS
(Front) John T. Ryan III, Diane M. Pearse, (back, from left) Calvin A. Campbell, Jr.,Thomas H.Witmer,Thomas B. Hotopp, L. Edward Shaw, Jr., James A. Cederna and John C. Unkovic.
Shareholders’ InquiriesA copy of the company’s 2003 AnnualReport on Form 10-K, as filed withthe Securities and ExchangeCommission, may be obtained byshareholders after April 1, 2004.Printed and electronic versions areavailable. Requests should be directedto the Vice President-Finance, who canbe reached at one of the following:
Phone: 412-967-3046Fax: 412-967-3367Internet: MSAnet.comU.S. Mail: MSA
Vice President-FinanceP. O. Box 426Pittsburgh, PA 15230
43
39451 MSA Financials 10F COMBO. 3/25/04 10:52 AM Page 43

Mine Safety Appliances Company
121 Gamma DriveRIDC Industrial Park
O’Hara TownshipPittsburgh, PA 15238
412-967-3000www.MSAnet.com
39451 MSA '03 Ann. Rpt NARR COM 3/25/04 10:55 AM Page 1