2001/02 report card for ontario drug benefit program
TRANSCRIPT

2001/02 2001/02 Report Card for Ontario Drug Report Card for Ontario Drug Benefit ProgramBenefit Program
2001/02 2001/02 Report Card for Ontario Drug Report Card for Ontario Drug Benefit ProgramBenefit Program

2
MOHLTC VisionMOHLTC Vision MOHLTC VisionMOHLTC Vision
“An accessible health system that promotes wellness and improves people’s health at every stage of their live.”
“...ensuring that all Ontarians have access to modern technologies and treatments.”
“…all institutions work together to ensure accountability to the patient and the system.”
“An accessible health system that promotes wellness and improves people’s health at every stage of their live.”
“...ensuring that all Ontarians have access to modern technologies and treatments.”
“…all institutions work together to ensure accountability to the patient and the system.”
MOHLTC 2000/2001 Business Plan
3
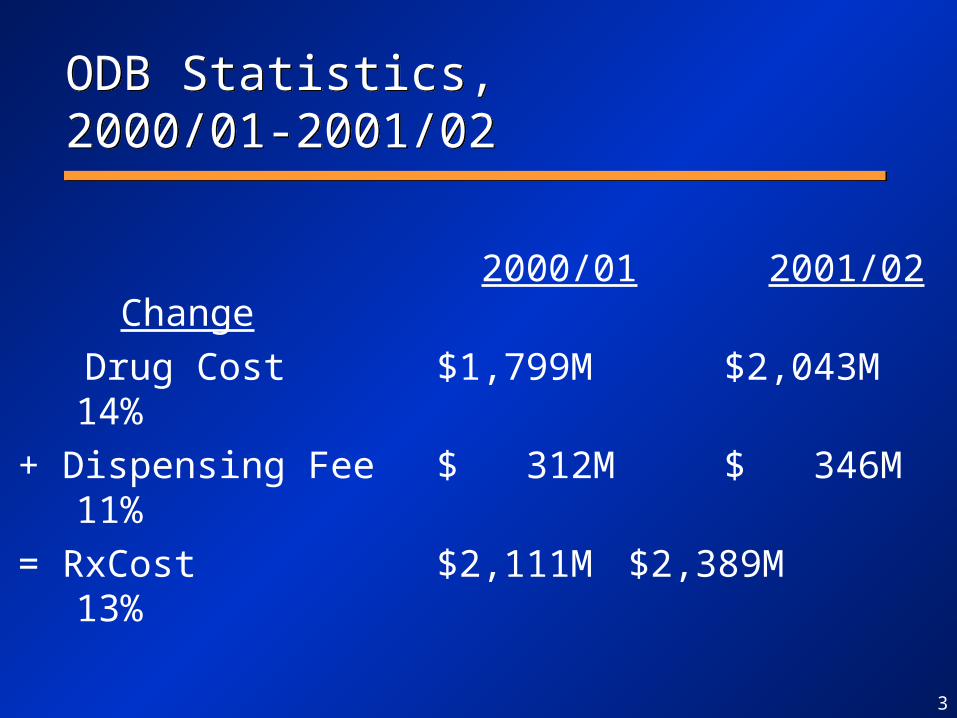
ODB Statistics,2000/01-2001/02ODB Statistics,2000/01-2001/02
2000/01 2001/02 Change
Drug Cost $1,799M $2,043M 14%
+ Dispensing Fee $ 312M $ 346M 11%
= RxCost $2,111M $2,389M 13%

4
ODB Statistics,2000/01-2001/02ODB Statistics,2000/01-2001/02
2000/01 2001/02 Change
Drug Cost $1,799M $2,043M 14%
+ Dispensing Fee $ 312M $ 346M 11%
= RxCost $2,111M $2,389M 13%
- Deductible $ 249M $ 274M 10%
= Government Cost $1,862M $2,115M 14%
MOHLTC $1,462M $1,678M 15%
MCSS $ 400M $ 438M 9%

5
ODB Statistics,2000/01-2001/02ODB Statistics,2000/01-2001/02
2000/01 2001/02 Change
Beneficiaries 2.07M 2.06M -1%
RxCost/Beneficiary $ 1,018 $ 1,160 14%
RxCost/Claim $ 42.19 $ 43.20 2%
Claims/Beneficiary 24.1 26.9 11%

6
IntroductionIntroduction
• Ontario is continuing to experience high drug expenditure growth, like other national and international jurisdictions
• Long term growth is projected at 15%/year:– 5% growing and aging population + inflation– 10% new drugs, new indications, more health
care delivered in the community
• Very modest projection and will be higher if there is significant scientific discovery

7
Growth FactorsGrowth Factors
– newer and more expensive drugs– aging population– new clinical evidence (indications) and better
treatment outcomes involving drug therapy– new diseases and new areas of pharmacology– increased utilization– restructuring of health system (shift to outpatient care)– continued pressure for manufacturers to increase
market share

8
Report Card FrameworkReport Card Framework
I. FinancialHow do we look to
our funders?
II. ClinicalCan we continue to improve
using clinical evidence?
III. Customer
SatisfactionHow do our customers
perceive us?
IV. Operational
PolicyWhat must we excel at?

9
DefinitionsDefinitions
• Drug cost = Ingredient cost + Mark up
• Gov’t cost = Drug cost + Dispensing fee - Deductible
• Cost includes MOH and MCSS programs
• Beneficiary: Eligible person who had a claim covered by the drug program
• Drug cost = Ingredient cost + Mark up
• Gov’t cost = Drug cost + Dispensing fee - Deductible
• Cost includes MOH and MCSS programs
• Beneficiary: Eligible person who had a claim covered by the drug program

I. Financial IndicatorsI. Financial IndicatorsI. Financial IndicatorsI. Financial Indicators
• National trends• Program growth• Beneficiaries• Cost Concentration• Cost Drivers
• National trends• Program growth• Beneficiaries• Cost Concentration• Cost Drivers
11
1.90M
1.95M
2.00M
2.05M
2.10M
2.15M
2.20M
2.25M
2.30M
Ben
efic
iari
es
M
10M
20M
30M
40M
50M
60M
Cla
ims
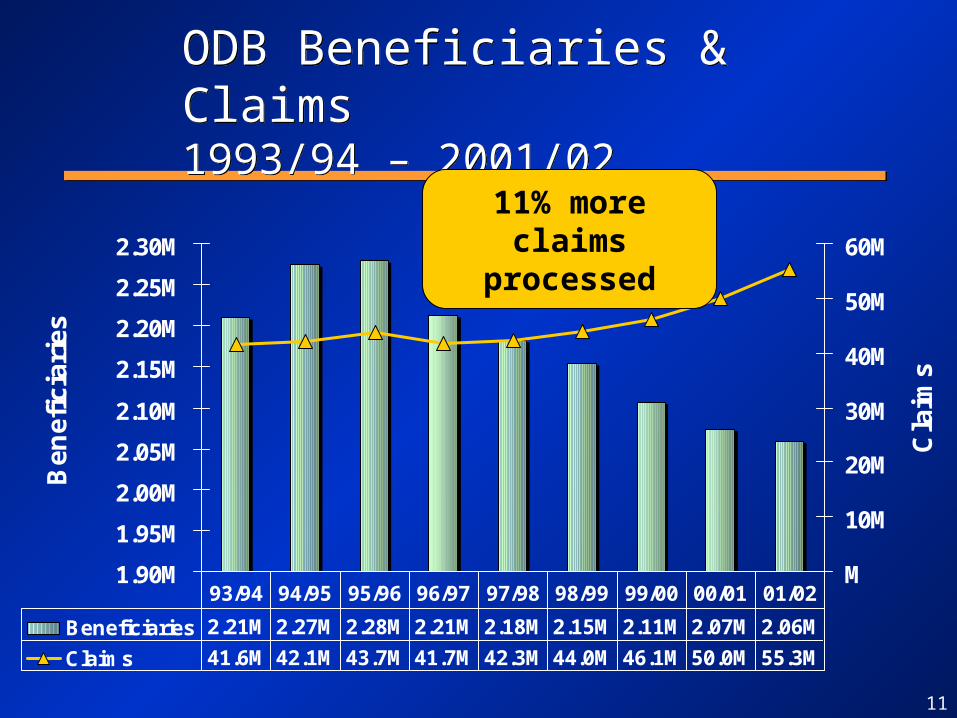
Beneficiaries 2.21M 2.27M 2.28M 2.21M 2.18M 2.15M 2.11M 2.07M 2.06M
Claims 41.6M 42.1M 43.7M 41.7M 42.3M 44.0M 46.1M 50.0M 55.3M
93/94 94/95 95/96 96/97 97/98 98/99 99/00 00/01 01/02
ODB Beneficiaries & Claims1993/94 – 2001/02ODB Beneficiaries & Claims1993/94 – 2001/02
11% more claimsprocessed

12
1,091 1,144 1,262 1,225 1,318 1,458 1,6151,862
2,115148
200211
222249
274
$0M
$500M
$1,000M
$1,500M
$2,000M
$2,500M
$3,000M
Cost
Deductible $0M $0M $0M $148M $200M $211M $222M $249M $274M
Gov't Cost $1,091 $1,144 $1,262 $1,225 $1,318 $1,458 $1,615 $1,862 $2,115
93/94 94/95 95/96 96/97 97/98 98/99 99/00 00/01 01/02
Government Cost & Patient Cost1993/94 – 2001/02
Government Cost & Patient Cost1993/94 – 2001/02
Growth rate of total cost
5% 10% 9% 11% 10% 10% 15% 13%

13
1,64
41,
869
312
346
940
1,03
01,
156
1,28
51,
417
857
174
155
134122
11097
8862
234224
262287
252246
$0M
$500M
$1,000M
$1,500M
$2,000M
$2,500M
$3,000M
94/95 95/96 96/97 97/98 98/99 99/00 00/01 01/02
Dispensing fee
Markup
Ingredient Cost
Total Cost by Type of Spending1995/96-2001/02
Year over Year Growth of Distribution Costs Year over Year Growth of Distribution Costs (Mark up + Dispensing fee)(Mark up + Dispensing fee)
13% 7% 6% 6% 10% 11% 11%13% 7% 6% 6% 10% 11% 11%

14
Age Distribution of Beneficiaries 1993/94-2001/02Age Distribution of Beneficiaries 1993/94-2001/02
0
100
200
300
400
500
600
700
800
0-24 25-44 45-64 65-74 75-84 85+
Be
ne
fic
iari
es
('0
00
s)
1993/94 1995/96 1997/98 1999/00 2001/02
8-year growth -46% +39% +8% +36% -13%
-371K +60K +51K +135K -26K
Faste
st
grow
ing
Faste
st
grow
ing

15
Share of Seniors, 1993/94 vs. 2001/02Share of Seniors, 1993/94 vs. 2001/02
1993/94
< 6544%
65+56%
1993/94
< 6544%
65+56%
2001/02
< 6529%
65+68%
Trillium3%
2001/02
< 6529%
65+68%
Trillium3%
<65 965K <65 593K
Trillium 61K65+ 1,245K 65+ 1,405KTotal 2,210K Total 2,059K
Include only Trillium beneficiaries with at least one claim paid for by the drug plan.
16
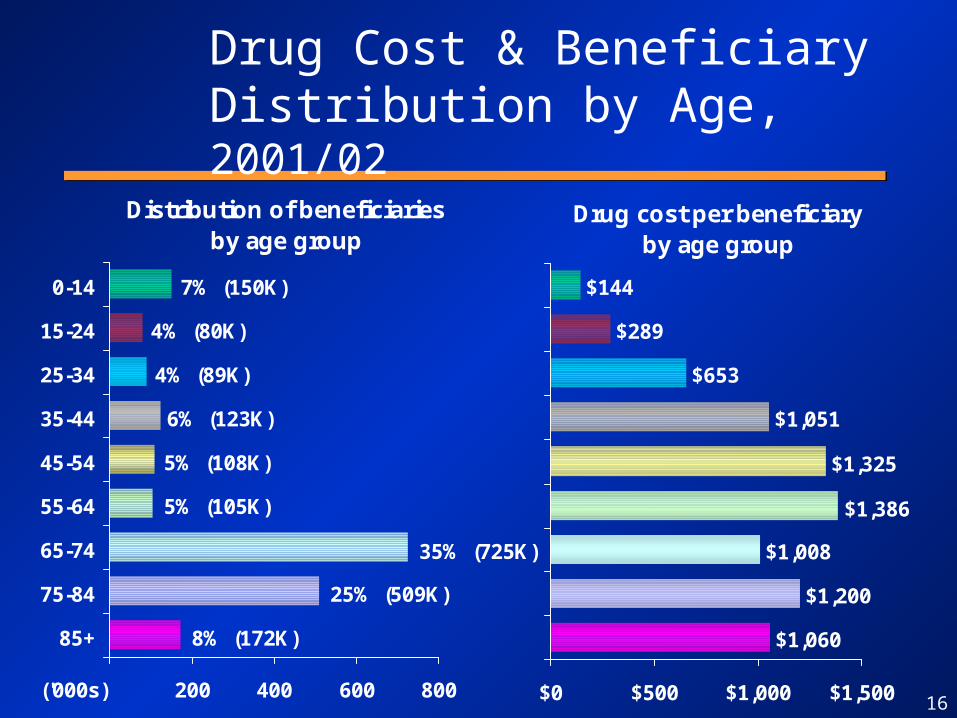
Drug Cost & Beneficiary Distribution by Age, 2001/02
Distribution of beneficiariesby age group
7% (150K)
4% (80K)
4% (89K)
6% (123K)
5% (108K)
5% (105K)
35% (725K)
25% (509K)
8% (172K)
200 400 600 800
0-14
15-24
25-34
35-44
45-54
55-64
65-74
75-84
85+
('000s)
Drug cost per beneficiaryby age group
$144
$289
$653
$1,051
$1,325
$1,008
$1,200
$1,060
$1,386
$0 $500 $1,000 $1,500

17
Change in Drug Cost & Beneficiariesby Age, 2000/01-2001/02
Change in beneficiariesby age group
5K (3%)
18K (4%)
9K (1%)
4K (4%)
-10K (-7%)
-10K (-10%)
-8K (-9%)
-1K (-1%)
-22K (-13%)
-40K -20K K 20K 40K
0-14
15-24
25-34
35-44
45-54
55-64
65-74
75-84
85+
('000s)
Change in drug cost per beneficiaryby age group
$135 (15%)
$127 (12%)
$91 (10%)
$185 (16%)
$165 (19%)
$101 (18%)
$48 (20%)
$25 (21%)
$160 (13%)
$0 $50 $100 $150 $200

18
Drug Cost & Beneficiary Distribution by Program, 2001/02
Distribution of beneficiariesby program
44% (923K)
20% (407K)
12% (242K)
16% (323K)
3% (61K)
3% (61K)
2% (43K)
500 1,000
Higher Inc. Sen.
Lower Inc. Sen.
Disab. Support
Ontario Works
Home Care
Trillium
Other Institut.
('000s)
Drug cost per beneficiaryby program
$988
$1,206
$1,303
$220
$1,771
$1,432
$1,374
$0 $1,000 $2,000
Note : Other Institutions stands for Special Care and Long-Term Care.
Could be age-related
19
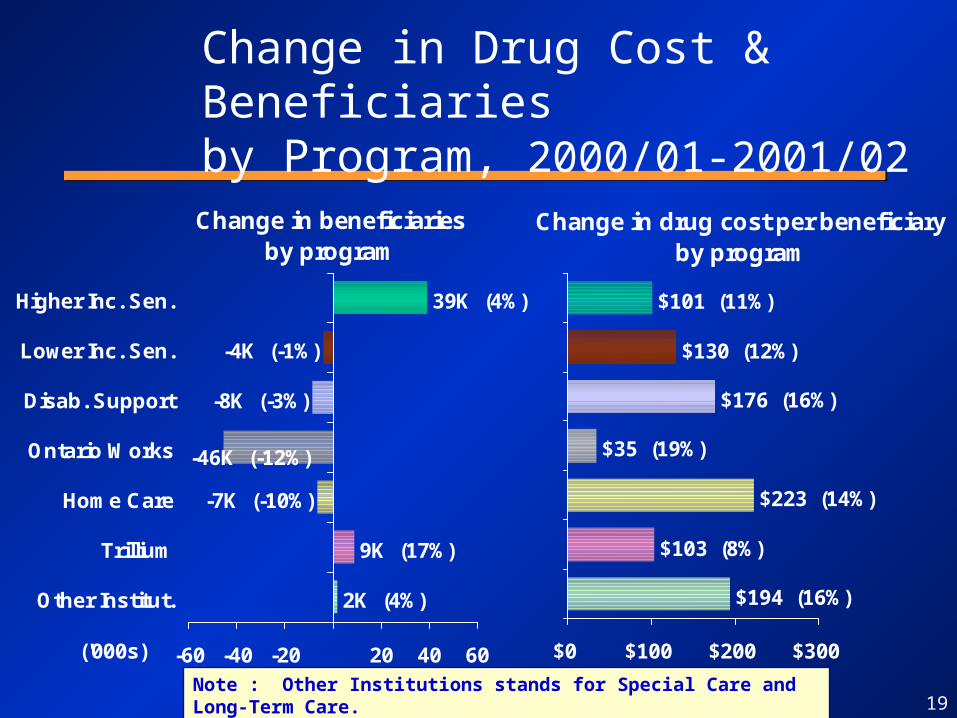
Change in Drug Cost & Beneficiariesby Program, 2000/01-2001/02
Change in beneficiariesby program
2K (4%)
9K (17%)
-7K (-10%)
-8K (-3%)
-4K (-1%)
39K (4%)
-46K (-12%)
-60 -40 -20 20 40 60
Higher Inc. Sen.
Lower Inc. Sen.
Disab. Support
Ontario Works
Home Care
Trillium
Other Institut.
('000s)
Change in drug cost per beneficiaryby program
$194 (16%)
$103 (8%)
$223 (14%)
$35 (19%)
$176 (16%)
$130 (12%)
$101 (11%)
$0 $100 $200 $300
Note : Other Institutions stands for Special Care and Long-Term Care.

20
1,239K (78%)
432K (85%)
730K (47%)
93K (68%)
123K (63%)
331K (77%)
119K (69%)200
400
600
800
1,000
1,200
1,400
OtherInstit.
TrilliumHomecare
OntarioWorks
Disab.Support
Lower Inc.Sen.
HigherInc. Sen.
('000s) Eligible Recipients ('000s) & Utilizing Recipients (% of eligible)
by Program, 2001/02
200
400
600
800
1,000
1,200
1,400
OtherInstit.
TrilliumHomecare
OntarioWorks
Disab.Support
Lower Inc.Sen.
HigherInc. Sen.
('000s)
Eligible Recipients and Utilizing Percentage by Program, 2002

21
5%5%6%
7%9%
11%
14%
27%
4% 3% 3% 2% 2% 1% 1%
0%
5%
10%
15%
20%
25%
30%
100%95
%90
%85
%80
%75
%70
%65
%60
%55
%50
%45
%40
%35
%30
%25
%20
%15
%10
%5%
Pro
po
rtio
n o
f T
ota
l
Percent Drug Cost
Percent Beneficiaries
Drug Cost Concentration5% Intervals, 2001/02
Top-5% Drug cost per beneficiary:
$5,416

22
Trend in Drug Cost Concentration5% Intervals, 2001/02
0%
5%
10%
15%
20%
25%
30%
35%
40%
45%
Top 5% Second 5% Third 5% Fourth 5% Bottom 80%
1993/94 1995/96 1997/98 1999/00 2001/02
23
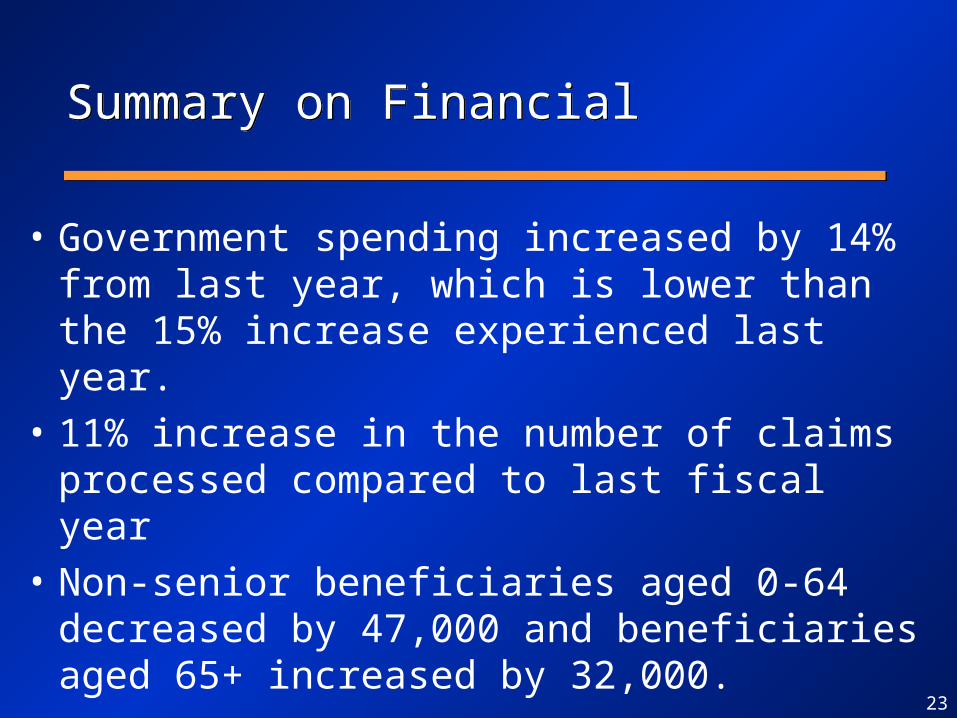
Summary on FinancialSummary on Financial
• Government spending increased by 14% from last year, which is lower than the 15% increase experienced last year.
• 11% increase in the number of claims processed compared to last fiscal year
• Non-senior beneficiaries aged 0-64 decreased by 47,000 and beneficiaries aged 65+ increased by 32,000.

24
Summary on FinancialSummary on Financial
• Concentration of costs: Top 5% heaviest drug users account for 27% of the total drug cost (same as last year). Their average cost per claimant is $5,416.

II. Clinical/Evidence II. Clinical/Evidence Based IndicatorsBased Indicators
II. Clinical/Evidence II. Clinical/Evidence Based IndicatorsBased Indicators
•Top Therapeutic Classes & Fastest Growing•Top Drugs & Fastest Growing•Section 8•Special Drugs Program
•Top Therapeutic Classes & Fastest Growing•Top Drugs & Fastest Growing•Section 8•Special Drugs Program

26
$463M
$252M
$229M
$228M
$143M
$101M
$90M
$75M
$51M
$45M
$0M $100M $200M $300M $400M $500M
Cardiovascular
Antilipemic
Central Nervous System
Gastrointestinal
Analgesics
Respiratory Inhalers
Anti-infectives
Antineoplastic
Diagnostic Agents
Anti-diabetic
Top-10 Therapeutic Classesby Drug Cost 2001/02
Total drug cost: $2.04BTotal drug cost: $2.04B
1/3 of total cost

27
$4M (10%)
$6M (14%)
$9M (13%)
$9M (10%)
$12M (48%)
$26M (12%)
$26M (23%)
$28M (14%)
$30M (15%)
$40M (10%)
$0M $10M $20M $30M $40M $50M
Cardiovascular
Central Nervous system
Gastrointestinal
Analgesics
Antilipemic
Autonomic (incl. Alzheimer)
Respiratory Inhalers
Antineoplastic
Diagnostic Agents
Anti-diabetic
Fastest Growing Classesby Drug Cost, 2000/01-2001/02
2001/02 increase: $245M2001/02 increase: $245M

28
$28M
$47M
$30M
$46M
$36M$26M
$26M
$9M
$12M
$30M
$40M
$10M
$7M
$14M
$0M $10M $20M $30M $40M $50M
Cardiovascular
Central Nervous system
Gastrointestinal
Analgesics
Antilipemic
Autonomic (incl. Alzheimer)
Respiratory Inhalers
00/01-01/02
99/00-00/01
Fastest Growing Classes by Drug Cost, 1999/00-2000/01 vs. 2000/01-2001/02
2001/02 increase: $245M2001/02 increase: $245M2000/01 increase: $248M2000/01 increase: $248M

29
Top-10 ChemicalsTop-10 Chemicalsby Drug Cost, by Drug Cost, 2001/022001/02
Rk Drug Name Class LaunchYear
DrugCost
% TotalDrug Cost
1 Atorvastatin (Lipitor) Lipid-Lowering 1997 $123M 6.0%
2 Omeprazole (Losec) - LU Gastrointestinal Bef. 93 $100M 4.9%
3 Amlodipine besylate (Norvasc) Cardiovascular Bef. 93 $75M 3.6%
4 Simvastatin (Zocor) Lipid-Lowering Bef. 93 $66M 3.2%
5 Ramipril (Altace) Cardiovascular 1994 $56M 2.7%
6 Olanzapine (Zyprexa) Anti-psychotic 1996 $55M 2.7%
7 Enalapril Maleate (Vasotec) Cardiovascular 1994 $53M 2.6%
8 Diagnostic Agent – Diabetes Diagnostic Agents $52M 2.5%
9 Fluticasone (Flovent) - LU Respiratory 1995 $41M 2.0%
10 Diltiazem HCl Cardiovascular Bef. 93 $41M 2.0%
TOTAL Top 10 $660M 32.3%
30
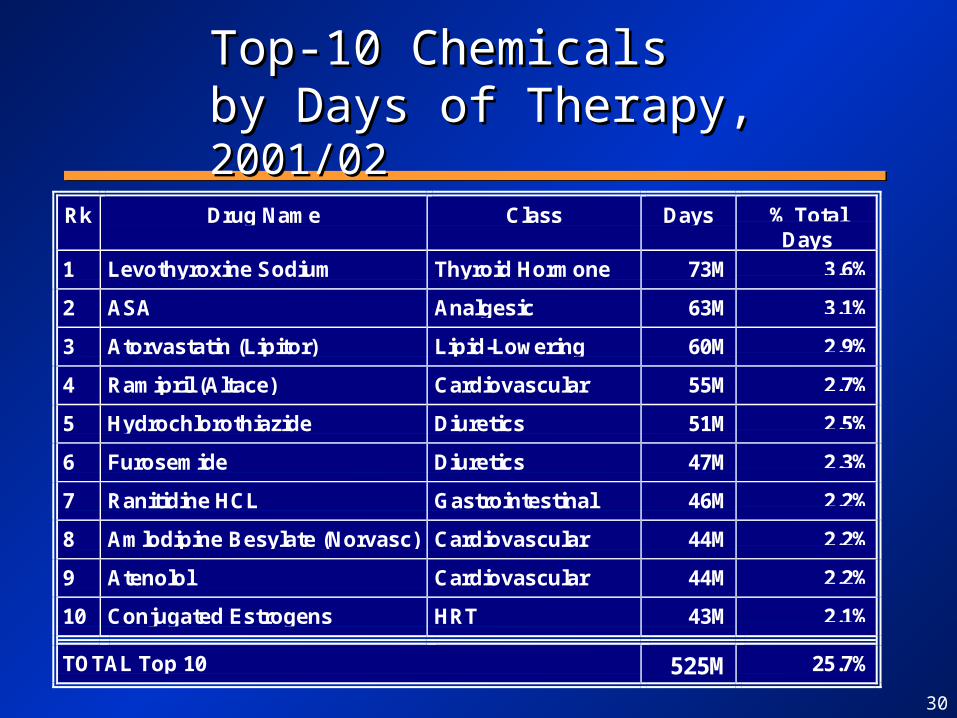
Top-10 ChemicalsTop-10 Chemicalsby Days of Therapy, by Days of Therapy, 2001/022001/02
Rk Drug Name Class Days % TotalDays
1 Levothyroxine Sodium Thyroid Hormone 73M 3.6%
2 ASA Analgesic 63M 3.1%
3 Atorvastatin (Lipitor) Lipid-Lowering 60M 2.9%
4 Ramipril (Altace) Cardiovascular 55M 2.7%
5 Hydrochlorothiazide Diuretics 51M 2.5%
6 Furosemide Diuretics 47M 2.3%
7 Ranitidine HCL Gastrointestinal 46M 2.2%
8 Amlodipine Besylate (Norvasc) Cardiovascular 44M 2.2%
9 Atenolol Cardiovascular 44M 2.2%
10 Conjugated Estrogens HRT 43M 2.1%
TOTAL Top 10 525M 25.7%

31
$8.3M (17%)
$8.8M (332%)
$9.2M (71%)
$9.5M (17%)
$10.6M (16%)
$12.0M (64%)
$13.0M (--)
$16.3M (18%)
$21.4M (58%)
$34.7M (41%)
$0M $5M $10M $15M $20M $25M $30M $35M $40M
Lipitor (Lipid-Lowering)
Altace (Cardiovascular)
Losec (Gastrointestinal)
Mobicox (Anti-Arthritic)
Aricept (Alzheimer)
Norvasc (Cardiovascular)
Zocor (Lipid-Lowering)
Pantoloc (Gastrointestinal)
Advair Diskus (Respiratory)
Zyprexa (Anti-Psychotic)
Drug cost increase
Fastest Growing ProductsFastest Growing Products2000/01-2001/022000/01-2001/02
10 products = 56% of total increase (vs. 70% in 2000/01)10 products = 56% of total increase (vs. 70% in 2000/01)
Total increase: $245MTotal increase: $245M
Celebrex and Vioxx not in fastest growing products this year

32
Rk Drug Requests Approved % Approved Cost
1 Plavix 20552 19971 97% $7,623,111
2 Avandia 6521 5542 85% $1,232,341
3 Actos 2552 2229 87% $475,626
4 Flomax 2150 2089 97% $355,900
5 Neurontin 1644 1352 82% $516,090
6 Neupogen 1596 1358 85% $4,813,259
7 Miacalcin 1494 1194 80% $120,371
8 Rebetron 1051 854 81% $5,362,091
9 Eprex 1019 550 54% $2,170,358
10 Singulair 981 794 81% $252,310
Top-10 Total 39,560 35,933 83% $22.9M
Section 8, Top-10 Section 8, Top-10 Requested Drugs, Requested Drugs, 20012001

33
Rk Drug Claimants Rx Gvt Cost
1 Plavix 16,127 88,244 $10.5M2 Rebetron 565 3,628 $5.6M3 Rebif 348 2,937 $5.0M4 Neupogen 702 2,724 $5.0M5 Betaseron 299 2,479 $4.1M6 Eprex 272 1,442 $3.0M7 Copaxone 275 1,986 $2.4M8 Kaletra 450 2,600 $2.3M9 Intron A 253 1,346 $2.0M
10 Sandostatin LAR 111 865 $1.9M
Total Top 10 Section 8 19,324 108,251 $41.7M
% Top 10 Section 8 / TotalSection 8 FY 2001/02
51.8% 50.7% 64.0%
Section 8, Top-10 Section 8, Top-10 by Government Cost, by Government Cost, 20012001

34
$0M
$20M
$40M
$60M
$80M
$100M
$120M
$140M
Cost ($M) 74.5M 82.6M 84.0M 91.5M 90.2M 107.3M 114.6M
Change 10.9% 1.7% 9.0% -1.4% 18.8% 6.8%
95/96 96/97 97/98 98/99 99/00 00/01 01/02$0M
$20M
$40M
$60M
$80M
$100M
$120M
$140M
Cost ($M) 74.5M 82.6M 84.0M 91.5M 90.2M 107.3M 114.6M
Change 10.9% 1.7% 9.0% -1.4% 18.8% 6.8%
95/96 96/97 97/98 98/99 99/00 00/01 01/02
Special Drugs Program, Special Drugs Program, 1995/96 to 2001/021995/96 to 2001/02

35
12%
11%
10%
10%
7%
7%
6%5%4%4%4%
0%
10%
20%
30%
40%
50%
60%
70%
80%
90%
100%
Anti-Asthmatics
Endocrine Therapy (for Cancer)
Analgesics
Calcium Channel Blockers (Cardiovascular)
Drugs for Bone Diseases (Bisphosphonates)
Psycholeptics (Anti-psychotics, sedatives...)
Anti-Inflammatory and Anti-Rheumatic
Psychoanaleptics (Antidepressants…)
Agents for Renin-Angiotensin (Ace Inhibitors...)
Antacids, Peptic Ulcer (Gastrointestinal)
Serum Lipid Reducing Agents (Lipid-Lowering)
Contribution to Drug Cost Increaseby ATC Subclass, 2000-2001
11 (of 90) Subclasses11 (of 90) Subclasses
81%81%
11 (of 90) Subclasses11 (of 90) Subclasses
81%81%

36
Prescribing GuidelinesPrescribing Guidelines
• OPOT published 7 sets of guidelines – Musculoskeletal – Peptic ulcer GERD– Stable ischemic heart disease – Chronic heart failure – Diabetes mellitus– Osteoporosis– Anxiety disorders
• OPOT published 7 sets of guidelines – Musculoskeletal – Peptic ulcer GERD– Stable ischemic heart disease – Chronic heart failure – Diabetes mellitus– Osteoporosis– Anxiety disorders

37
Drug Utilization ReviewsDrug Utilization Reviews
• Comprehensive approach to ensure drugs are being used appropriately and that program costs are managed effectively
• moving toward an evidence based approach:– manufacturers are being asked to do DUR as
part of therapeutic class reviews– MOH is funding class reviews of drugs (e.g
antibiotics) one year post formulary changes
38
Drug Utilization Advisory CommitteeDrug Utilization Advisory Committee
• Joint committee of government and industry representatives to look at optimizing utilization– DUR’s in partnership with manufacturers
• Joint committee of government and industry representatives to look at optimizing utilization– DUR’s in partnership with manufacturers
39
Clinical Criteria and ReimbursementClinical Criteria and Reimbursement
• Limited Use Criteria:– reimbursement for certain drugs within a
class is dependent on specific clinical criteria
• Section 8:– individual requests for drug therapy are
approved based on case by case basis using clinical criteria
• Limited Use Criteria:– reimbursement for certain drugs within a
class is dependent on specific clinical criteria
• Section 8:– individual requests for drug therapy are
approved based on case by case basis using clinical criteria
40
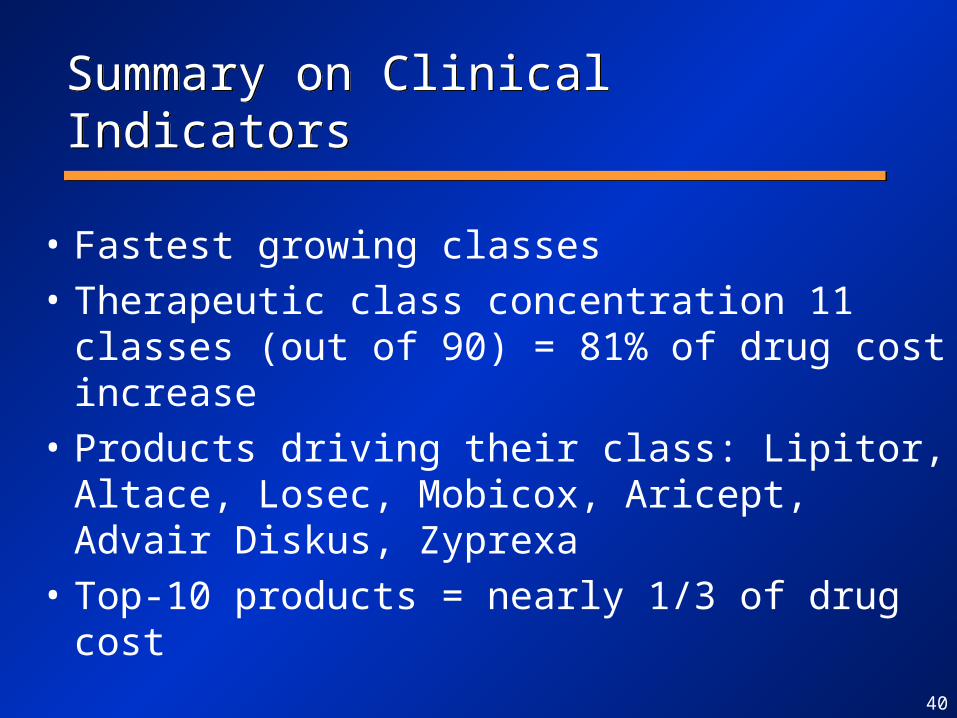
Summary on Clinical IndicatorsSummary on Clinical Indicators
• Fastest growing classes
• Therapeutic class concentration 11 classes (out of 90) = 81% of drug cost increase
• Products driving their class: Lipitor, Altace, Losec, Mobicox, Aricept, Advair Diskus, Zyprexa
• Top-10 products = nearly 1/3 of drug cost

III. Customer III. Customer Satisfaction IndicatorsSatisfaction Indicators
III. Customer III. Customer Satisfaction IndicatorsSatisfaction Indicators
• Section 8 Claims• Product Review Timeline• Trillium Drug Program• Limited Use
• Section 8 Claims• Product Review Timeline• Trillium Drug Program• Limited Use

42
Monthly Section 8 Requests January 1997 - January 2002Monthly Section 8 Requests January 1997 - January 2002
0
1,000
2,000
3,000
4,000
5,000
6,000
7,000
8,000
9,000
Jan-97 Jan-98 Jan-99 Jan-00 Jan-01 Jan-02
0
1,000
2,000
3,000
4,000
5,000
6,000
7,000
8,000
9,000
Jan-97 Jan-98 Jan-99 Jan-00 Jan-01 Jan-02
2001 vs. 2000+59% more requests
43
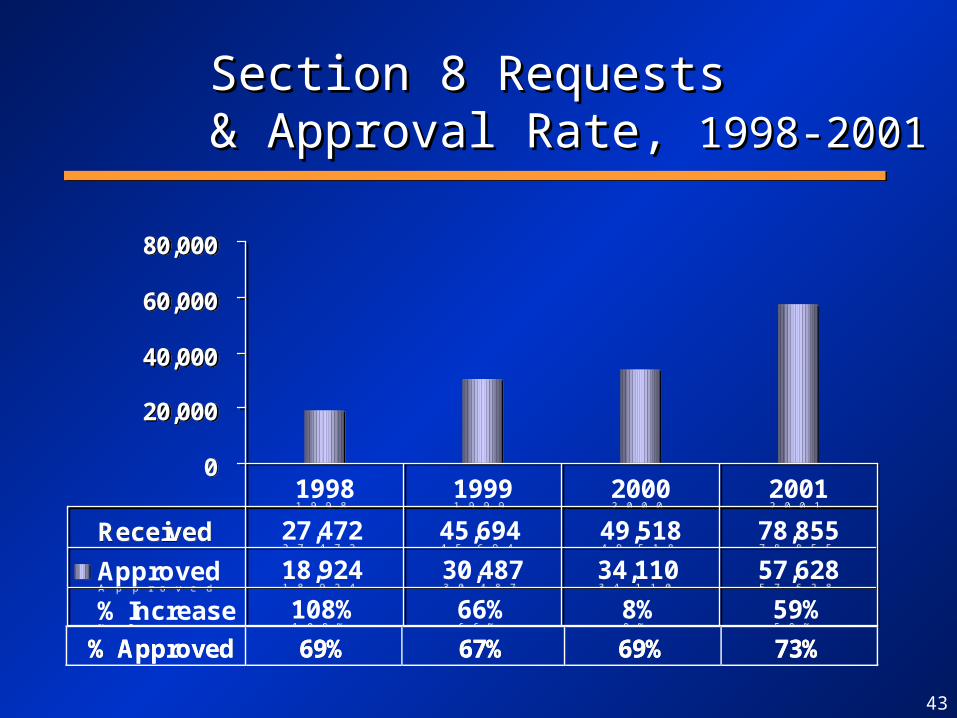
Section 8 Requests Section 8 Requests & Approval Rate, & Approval Rate, 1998-20011998-2001
0
20,000
40,000
60,000
80,000
Received 27,472 45,694 49,518 78,855
Approved 18,924 30,487 34,110 57,628
% Increase 108% 66% 8% 59%
1998 1999 2000 20010
20,000
40,000
60,000
80,000
Received 27,472 45,694 49,518 78,855
Approved 18,924 30,487 34,110 57,628
% Increase 108% 66% 8% 59%
1998 1999 2000 2001
%%% AAApppppprrrooovvveeeddd 666999%%% 666777%%% 666999%%% 777333%%%

44
Section 8Requests and Response Time
199913%
87%
Response Time 2001
Over 3 weeks33%
Within 3 weeks67%
200013%
87%

45
Individual Clinical Review (Section 8), 2001
1243 drug products Average Turnaround: 15.3 days
Over 10,000 physicians
109 physicians make greater than 50 requests
51,453 patients

46
0
50
100
150
200
250
1997 1998 1999 2000 2001 1997 1998 1999 2000 2001
Section 8/NegativeLimited UseGeneral Benefit
DQTC RecommendationsDQTC RecommendationsFirst Review,First Review, 1997-20001997-2000
Single Source Multiple Source
58 products approved without DQTC review - Phase 3 streamlining implemented September 2000

47
DPB Review TimelineProducts Listed in 2000 & 2001DPB Review TimelineProducts Listed in 2000 & 2001
156
39
278
145137
50
121
159
0
50
100
150
200
250
300
NOC to Receipt Receipt to DeemedComplete
Deemed Completeto Positive
Recommendation
PositiveRecommendation to
Listing
2000 2001
N=42 Single Source DINs Listed in 2001 (Edition 37 + 2 updates)
48
0
10,000
20,000
30,000
40,000
50,000
60,000
1996 1997 1998 1999 2000 2001
# A
pp
lica
tio
ns
New Renewal
0
10,000
20,000
30,000
40,000
50,000
60,000
1996 1997 1998 1999 2000 2001
# A
pp
lica
tio
ns
New Renewal
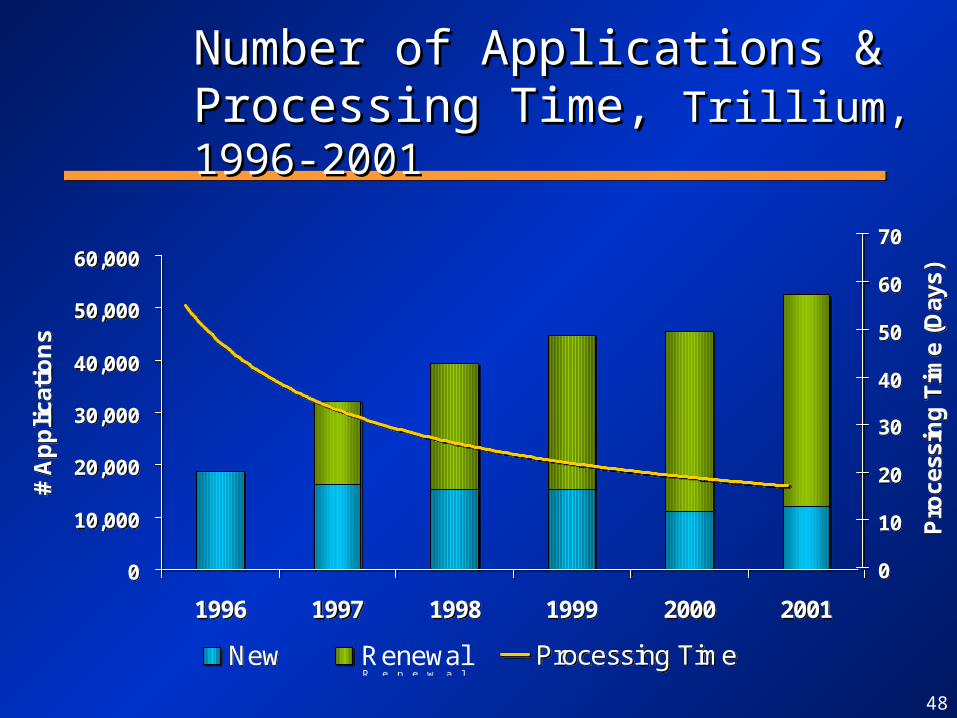
Number of Applications & Number of Applications & Processing Time, Processing Time, Trillium, 1996-2001Trillium, 1996-2001
0
10
20
30
40
50
60
70
Pro
cess
ing
Tim
e (D
ays)
Processing Time
0
10
20
30
40
50
60
70
Pro
cess
ing
Tim
e (D
ays)
Processing Time

49
Limited Use Tripartite CommitteeLimited Use Tripartite Committee
• Formed to promote discussion on how to improve the Limited Use mechanism between physicians, pharmacists and the MOHLTC– streamlined prescription pads– published LU code wall charts– held international policy conference, Fall 2001
• Formed to promote discussion on how to improve the Limited Use mechanism between physicians, pharmacists and the MOHLTC– streamlined prescription pads– published LU code wall charts– held international policy conference, Fall 2001
50
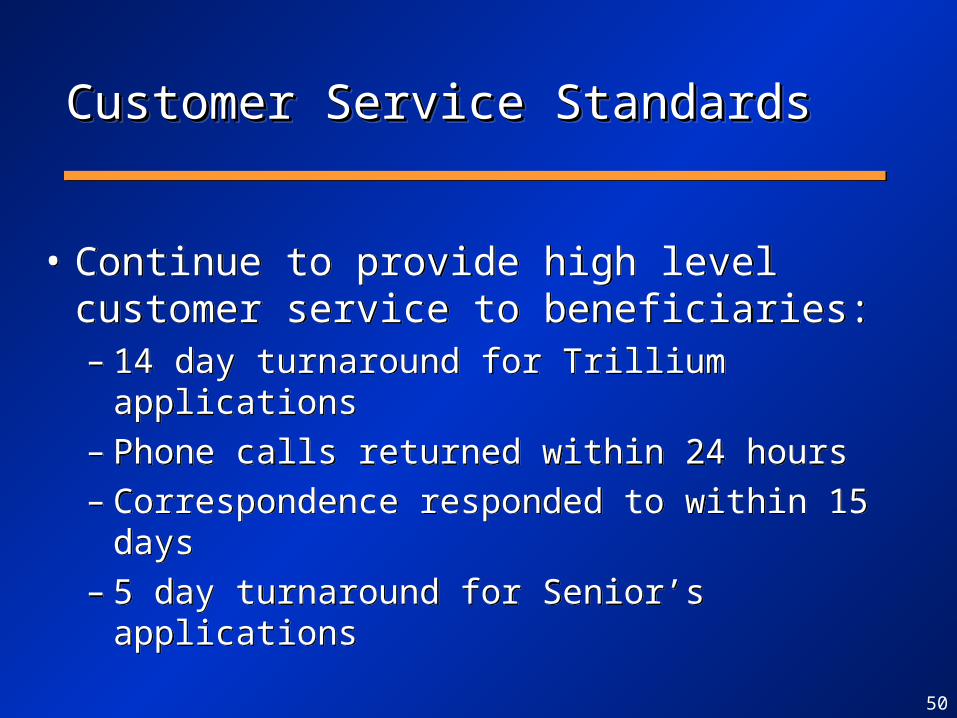
Customer Service StandardsCustomer Service StandardsCustomer Service StandardsCustomer Service Standards
• Continue to provide high level customer service to beneficiaries:– 14 day turnaround for Trillium applications– Phone calls returned within 24 hours– Correspondence responded to within 15 days– 5 day turnaround for Senior’s applications
• Continue to provide high level customer service to beneficiaries:– 14 day turnaround for Trillium applications– Phone calls returned within 24 hours– Correspondence responded to within 15 days– 5 day turnaround for Senior’s applications

51
Summary Customer SatisfactionSummary Customer Satisfaction
• Significant improvements have been made over past 5 years
• Section 8 customer service challenged by large growth (59%) and limited resources
• Will continue to be challenged given defined resources for program administration
• Important to measure over time to monitor impact of program changes and identify opportunities for improvement
IV. Operational Policy IV. Operational Policy Indicators/InitiativesIndicators/Initiatives
IV. Operational Policy IV. Operational Policy Indicators/InitiativesIndicators/Initiatives
53
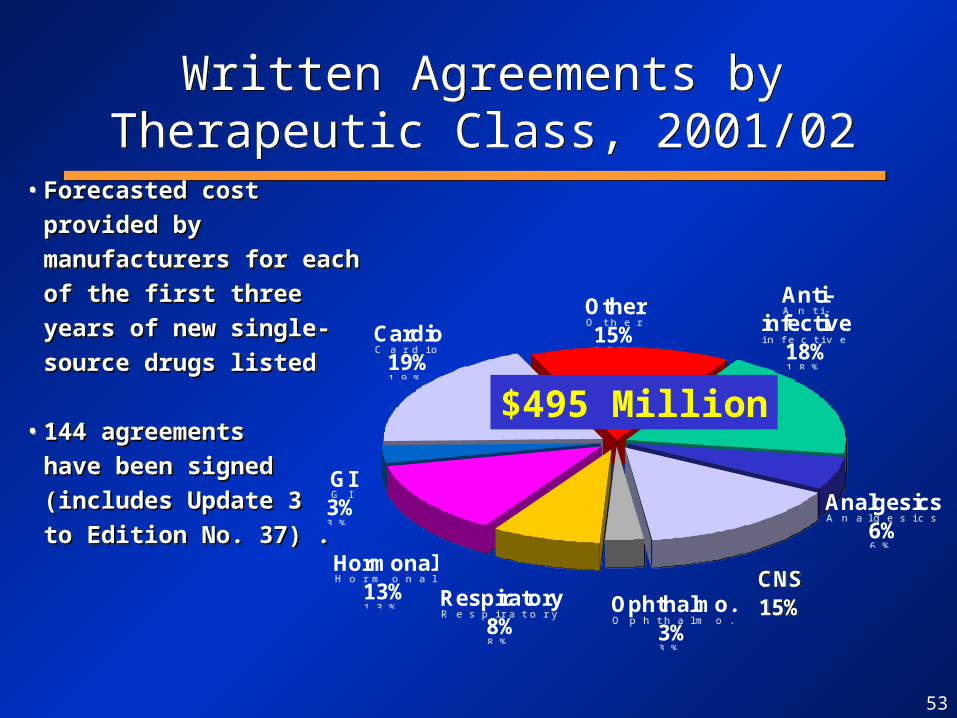
• Forecasted cost provided by Forecasted cost provided by
manufacturers for each of the manufacturers for each of the
first three years of new first three years of new
single-source drugs listedsingle-source drugs listed
• 144 agreements 144 agreements
have been signed have been signed
(includes Update 3 (includes Update 3
to Edition No. 37) .to Edition No. 37) .
Written Agreements by Therapeutic Class, 2001/02
Written Agreements by Therapeutic Class, 2001/02
CNS15%Ophthalmo.
3%
Respiratory8%
Hormonal13%
GI3%
Cardio19%
Other15%
Anti-infective
18%
Analgesics6%
CNS15%Ophthalmo.
3%
Respiratory8%
Hormonal13%
GI3%
Cardio19%
Other15%
Anti-infective
18%
Analgesics6%
$495 Million

54
Written AgreementsExperience to DateWritten AgreementsExperience to Date
Written Agreement Level Number Percentage
Over written agreement amount
Tracking over written agreementamount
8
30
6%
22%
Tracking at or slightly below writtenagreement level (i.e., >80% to <=100%)
25 19%
Tracking below written agreementlevel (i.e., <=80%)
72 53%
TOTAL 135
(Agreements up to and including Update 2 to Formulary No. 37)
55
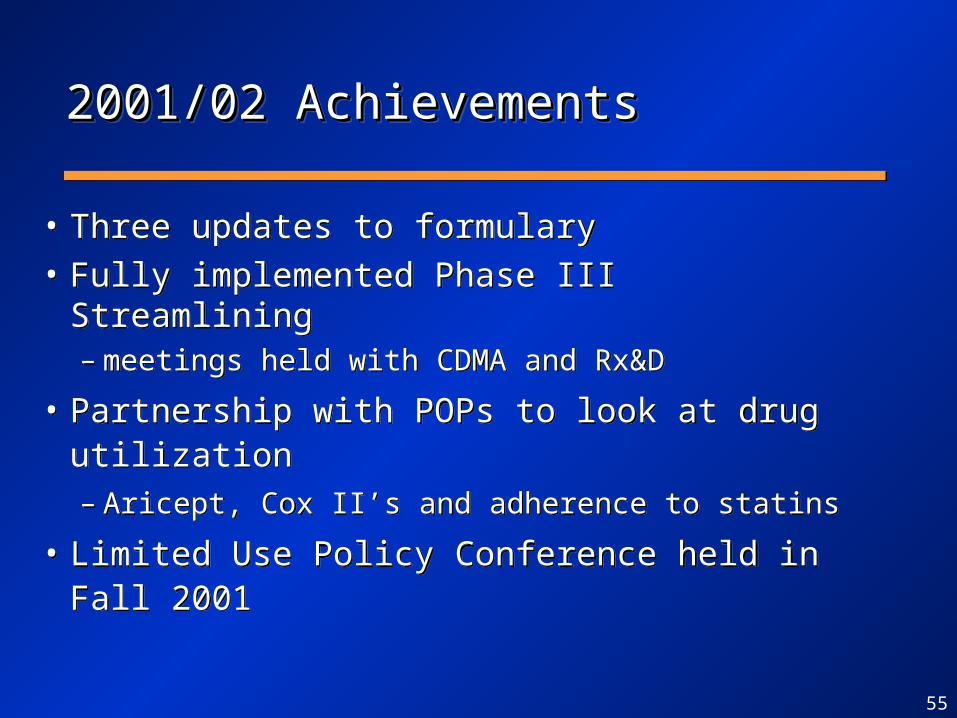
2001/02 Achievements2001/02 Achievements2001/02 Achievements2001/02 Achievements
• Three updates to formulary • Fully implemented Phase III Streamlining
– meetings held with CDMA and Rx&D
• Partnership with POPs to look at drug utilization– Aricept, Cox II’s and adherence to statins
• Limited Use Policy Conference held in Fall 2001
• Three updates to formulary • Fully implemented Phase III Streamlining
– meetings held with CDMA and Rx&D
• Partnership with POPs to look at drug utilization– Aricept, Cox II’s and adherence to statins
• Limited Use Policy Conference held in Fall 2001

56
2001/02 Achievements2001/02 Achievements2001/02 Achievements2001/02 Achievements
• Three modernization review of formulary completed:– nutritional products– nasal steriods– HIV/AIDS Drugs
• DQTC published bulletins with formulary updates to key stakeholders
• Operational review of Section 8 initiated
• Three modernization review of formulary completed:– nutritional products– nasal steriods– HIV/AIDS Drugs
• DQTC published bulletins with formulary updates to key stakeholders
• Operational review of Section 8 initiated

V. Impact of Limited V. Impact of Limited Use PolicyUse Policy
V. Impact of Limited V. Impact of Limited Use PolicyUse Policy
58
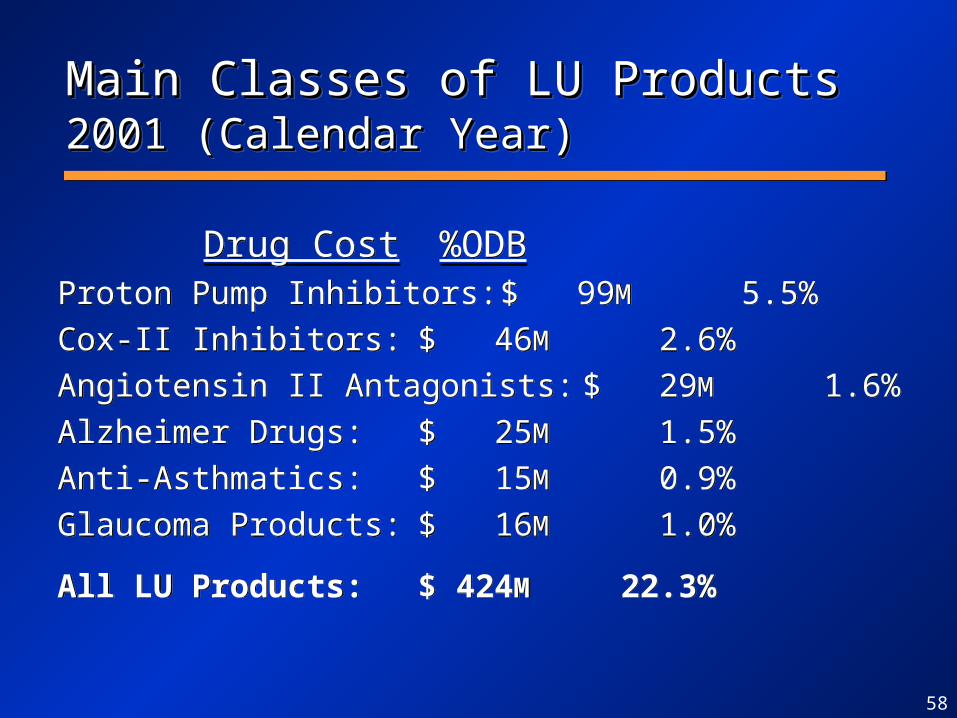
Main Classes of LU ProductsMain Classes of LU Products 2001 2001 (Calendar Year)(Calendar Year)Main Classes of LU ProductsMain Classes of LU Products 2001 2001 (Calendar Year)(Calendar Year)
Drug Cost %ODBProton Pump Inhibitors: $ 99M 5.5%
Cox-II Inhibitors: $ 46M 2.6%
Angiotensin II Antagonists: $ 29M 1.6%
Alzheimer Drugs: $ 25M 1.5%
Anti-Asthmatics: $ 15M 0.9%
Glaucoma Products: $ 16M 1.0%
All LU Products: $ 424M 22.3%
Drug Cost %ODBProton Pump Inhibitors: $ 99M 5.5%
Cox-II Inhibitors: $ 46M 2.6%
Angiotensin II Antagonists: $ 29M 1.6%
Alzheimer Drugs: $ 25M 1.5%
Anti-Asthmatics: $ 15M 0.9%
Glaucoma Products: $ 16M 1.0%
All LU Products: $ 424M 22.3%
59
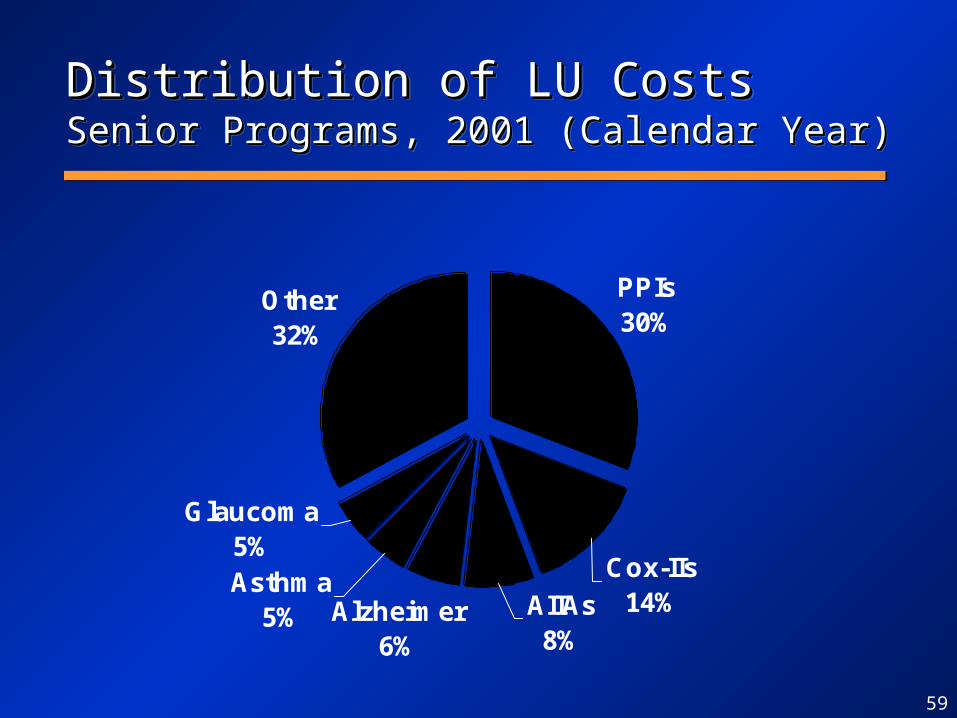
Distribution of LU CostsDistribution of LU CostsSenior Programs, 2001 (Calendar Year)Senior Programs, 2001 (Calendar Year)Distribution of LU CostsDistribution of LU CostsSenior Programs, 2001 (Calendar Year)Senior Programs, 2001 (Calendar Year)
PPIs30%
Other32%
Glaucoma5%
Cox-IIs14%AIIAs
8%
Asthma5% Alzheimer
6%
60
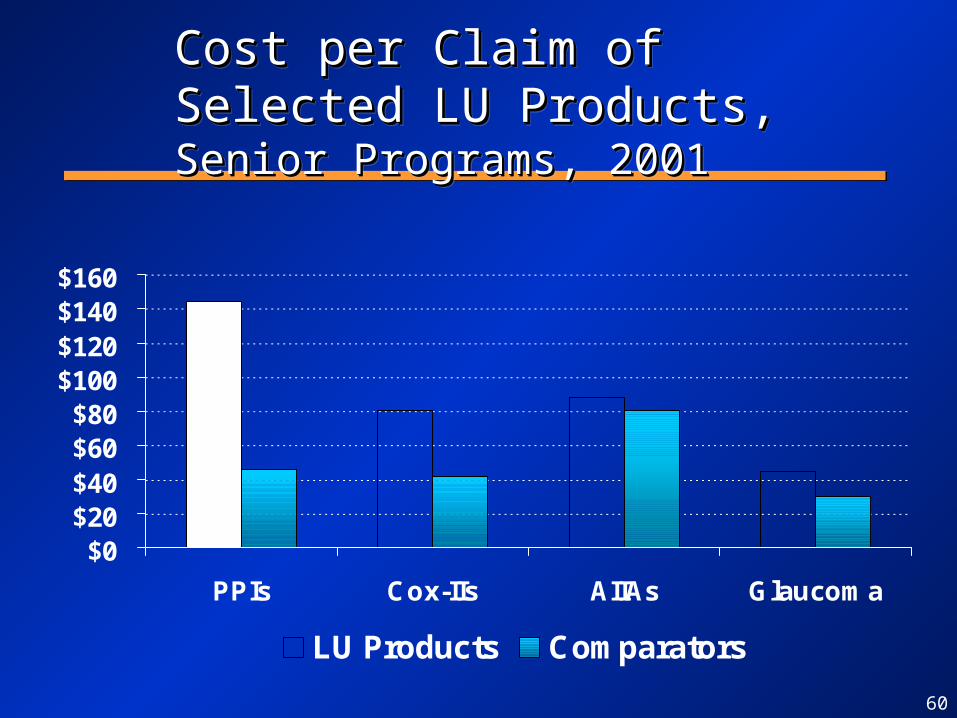
Cost per Claim of Selected LU Cost per Claim of Selected LU Products,Products, Senior Programs, 2001 Senior Programs, 2001Cost per Claim of Selected LU Cost per Claim of Selected LU Products,Products, Senior Programs, 2001 Senior Programs, 2001
$0$20$40$60$80
$100$120$140$160
PPIs Cox-IIs AIIAs Glaucoma
LU Products Comparators

61
Market Share (Claims) of LU Market Share (Claims) of LU Products, Products, by Province,by Province, Senior Senior Programs, 2001 (Calendar Year)Programs, 2001 (Calendar Year)
Market Share (Claims) of LU Market Share (Claims) of LU Products, Products, by Province,by Province, Senior Senior Programs, 2001 (Calendar Year)Programs, 2001 (Calendar Year)
0%10%20%30%40%50%60%70%80%90%
PPIs Cox-IIs AIIAs Glaucoma
Ontario Québec Alberta BC
Market shares in provinces other than Ontario are shown only if the drugs are listed as full benefit.

62
Cost Avoidance with LUCost Avoidance with LUSelected Classes, Senior Programs, Selected Classes, Senior Programs, 2001 (Calendar Year)2001 (Calendar Year)
Cost Avoidance with LUCost Avoidance with LUSelected Classes, Senior Programs, Selected Classes, Senior Programs, 2001 (Calendar Year)2001 (Calendar Year)
$0M $20M $40M $60M $80M
Glaucoma
AIIAs
Asthma
Quinolones
Cox-IIs
Bisphosphonates
PPIs

63
Total Cost with and without Limited Total Cost with and without Limited Use, 2001 Use, 2001 (Calendar Year)(Calendar Year)Total Cost with and without Limited Total Cost with and without Limited Use, 2001 Use, 2001 (Calendar Year)(Calendar Year)
$2,468M$2,237M
$231M
$0M
$500M
$1,000M
$1,500M
$2,000M
$2,500M
Without LU With LU Cost Avoidance
9.4% Cost Avoidancefrom Limited Use
VI. Case Study VI. Case Study Alzheimer DiseaseAlzheimer Disease
VI. Case Study VI. Case Study Alzheimer DiseaseAlzheimer Disease

65
0M
1M
1M
2M
2M
3M
3M
4M
4M
5M
65-74 75-84 85+
2001 2011 2021
Canadian Population Projection,Canadian Population Projection, 2001- 2001-20212021Canadian Population Projection,Canadian Population Projection, 2001- 2001-20212021
Source: Statistics Canada
2001-2021: +2.7 million seniors (+70%)
66
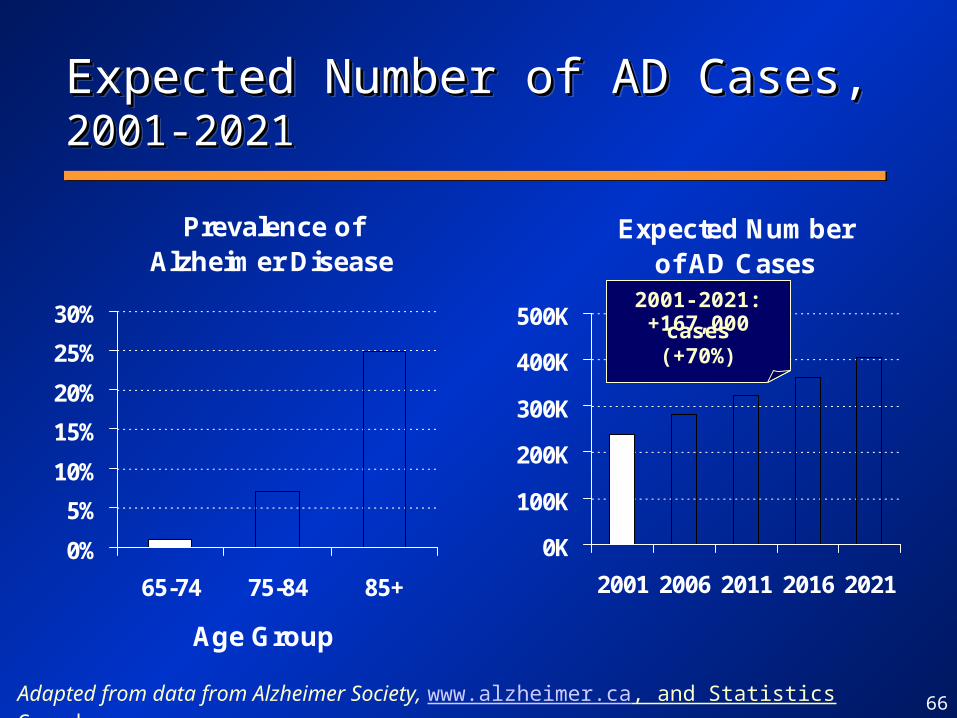
Expected Number of AD Cases,Expected Number of AD Cases, 2001- 2001-20212021Expected Number of AD Cases,Expected Number of AD Cases, 2001- 2001-20212021
Adapted from data from Alzheimer Society, www.alzheimer.ca, and Statistics Canada
Prevalence of Alzheimer Disease
0%
5%
10%
15%
20%
25%
30%
65-74 75-84 85+
Age Group
Expected Numberof AD Cases
0K
100K
200K
300K
400K
500K
2001 2006 2011 2016 2021
2001-2021:+167,000 cases
(+70%)
67
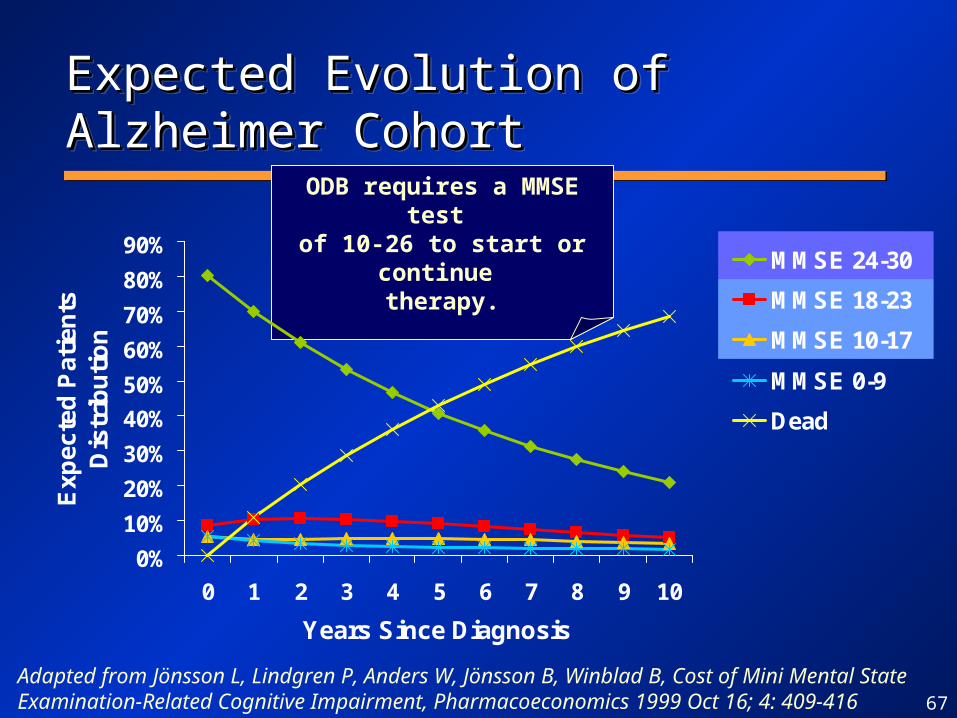
ODB requires a MMSE test of 10-26 to start or continue
therapy.
Expected Evolution of Alzheimer Expected Evolution of Alzheimer CohortCohortExpected Evolution of Alzheimer Expected Evolution of Alzheimer CohortCohort
0%
10%
20%
30%
40%
50%
60%
70%
80%
90%
0 1 2 3 4 5 6 7 8 9 10
Years Since Diagnosis
Ex
pe
cte
d P
ati
en
ts
Dis
trib
uti
on
MMSE 24-30
MMSE 18-23
MMSE 10-17
MMSE 0-9
Dead
Adapted from Jönsson L, Lindgren P, Anders W, Jönsson B, Winblad B, Cost of Mini Mental State Examination-Related Cognitive Impairment, Pharmacoeconomics 1999 Oct 16; 4: 409-416

68
Annual Cost of Caring for Annual Cost of Caring for Alzheimer Patients,Alzheimer Patients, (1996 dollars) (1996 dollars)Annual Cost of Caring for Annual Cost of Caring for Alzheimer Patients,Alzheimer Patients, (1996 dollars) (1996 dollars)
4,859
16,322
30,958
5,655
7,047
5,379
3,506
1,227
1,973
568
2,315 230
226
260
310
1,603
1,597
1,452
2,525
$0
$5,000
$10,000
$15,000
$20,000
$25,000
$30,000
$35,000
$40,000
Mild (21-26) Mild toModerate (15-20)
Moderate (10-14) Severe (0-10)
Unpaid direct care time
Unpaid net supervision time
Medication, physician fees
Community services
Nursing home stay
Source: Hux MJ, O’Brien BJ, Iskedjian M, Goeree R, Gagnon M, Gauthier S, Relation between severity of Alzheimer’s disease and cost of caring, Can Med Assoc J 1998 Sep 8; 159: 457-465

69
Cost of Alzheimer DrugsCost of Alzheimer DrugsODB, 1999/00-2001/02ODB, 1999/00-2001/02Cost of Alzheimer DrugsCost of Alzheimer DrugsODB, 1999/00-2001/02ODB, 1999/00-2001/02
$7.3M
$16.7M
$27.3M
$0.1M
$1.6M
$0M
$5M
$10M
$15M
$20M
$25M
$30M
$35M
1999/00 2000/01 2001/02
Galantamine (Reminyl)
Rivastigmine (Exelon)
Donepezil (Aricept)
+131% +73%

70
Expected Age-Related Increase, Expected Age-Related Increase, Alzheimer Drug Cost, 2001-2026Alzheimer Drug Cost, 2001-2026Expected Age-Related Increase, Expected Age-Related Increase, Alzheimer Drug Cost, 2001-2026Alzheimer Drug Cost, 2001-2026
3.1%2.8%
2.4%2.9%
3.7%
0%
1%
2%
3%
4%
5%
2001-2006 2006-2011 2011-2016 2016-2021 2021-2026
Avg Annual % Growth in
Cost
3.1%2.8%
2.4%2.9%
3.7%
0%
1%
2%
3%
4%
5%
2001-2006 2006-2011 2011-2016 2016-2021 2021-2026
Avg Annual % Growth in
Cost
Assumptions: Based on StatsCan population projection; cost/claimant, prevalence of Alzheimer and utilization rates remain constant.

71
% Claimants vs. Estimated
Alzheimer Cases, Ontario, 2001Alzheimer Cases, Ontario, 2001 % Claimants vs. Estimated
Alzheimer Cases, Ontario, 2001Alzheimer Cases, Ontario, 2001
17%
35%
50%
0%
10%
20%
30%
40%
50%
60%
65-74 75-84 85+
% Claimants / Estimated AD
cases
17%
35%
50%
0%
10%
20%
30%
40%
50%
60%
65-74 75-84 85+
% Claimants / Estimated AD
cases
Assumptions:Actual ODB Claimants vs.Population Projection by Statistics Canada & Prevalence Rates from Alzheimer Society
72
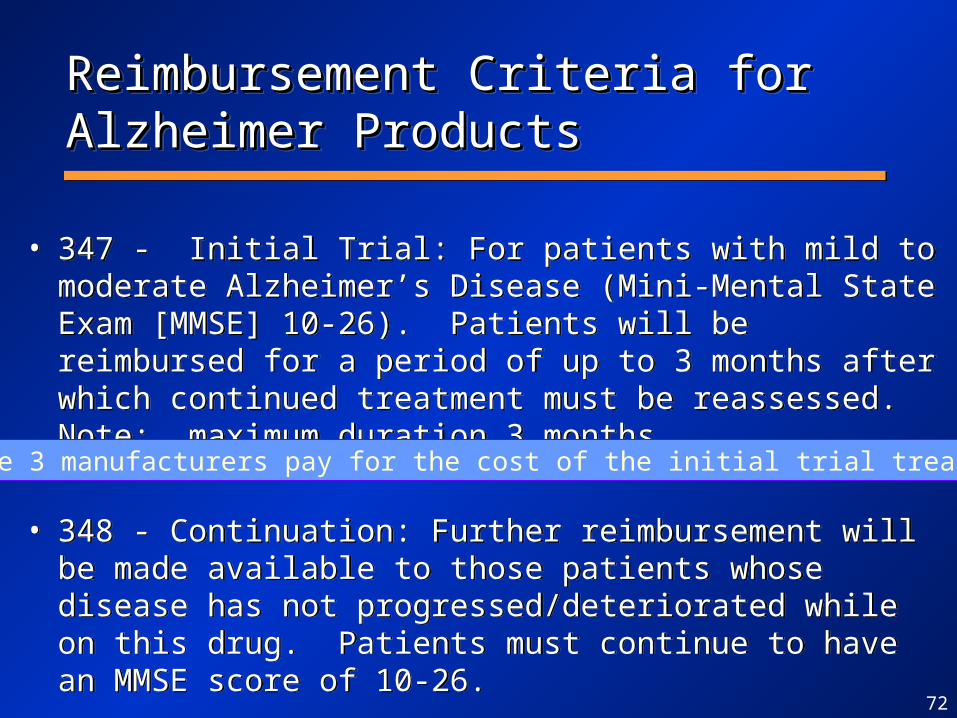
Reimbursement Criteria for Alzheimer Reimbursement Criteria for Alzheimer ProductsProductsReimbursement Criteria for Alzheimer Reimbursement Criteria for Alzheimer ProductsProducts
• 347 - Initial Trial: For patients with mild to moderate Alzheimer’s Disease (Mini-Mental State Exam [MMSE] 10-26). Patients will be reimbursed for a period of up to 3 months after which continued treatment must be reassessed. Note: maximum duration 3 months.
• 348 - Continuation: Further reimbursement will be made available to those patients whose disease has not progressed/deteriorated while on this drug. Patients must continue to have an MMSE score of 10-26.
2 of the 3 manufacturers pay for the cost of the initial trial treatment

73
Alzheimer PersistencyAlzheimer PersistencyAll Alzheimer Drugs, ODBAll Alzheimer Drugs, ODBAlzheimer PersistencyAlzheimer PersistencyAll Alzheimer Drugs, ODBAll Alzheimer Drugs, ODB
25%33%
45%
61%76%
18%
37%43%
50%
61%
76%85%
0%10%20%30%40%50%60%70%80%90%
100%
0 2 4 6 8 10 12 14 16 18 20 22 24
Months of Therapy
% P
atie
nts
Rem
ain
ing Alzheimer
Lipid Lowering
Note: 55% stop therapy after 12 months, 82% stop after 24 months. Selected patients had at least one claim between December 1st, 1999 and March 31st, 2000

74
Alzheimer ComplianceAlzheimer ComplianceAll Alzheimer Drugs, ODBAll Alzheimer Drugs, ODBAlzheimer ComplianceAlzheimer ComplianceAll Alzheimer Drugs, ODBAll Alzheimer Drugs, ODB
0%5%
10%15%20%25%30%35%40%45%
0.00-0.24
0.25-0.49
0.50-0.74
0.75-0.89
0.90-0.94
0.95-0.99
1.00-1.04
1.05-1.09
1.10-1.24
1.25-1.49
1.50-1.74
1.75-over
Note: Selected patients had at least one claim between December 1st, 1999 and March 31st, 2000.
• 79% of patients are compliant (±10%) vs. 80% for Lipid Lowering patients• 10% of patients are under-compliant (less than -10%)• 11% of patients are over-compliant (over +10%)
75
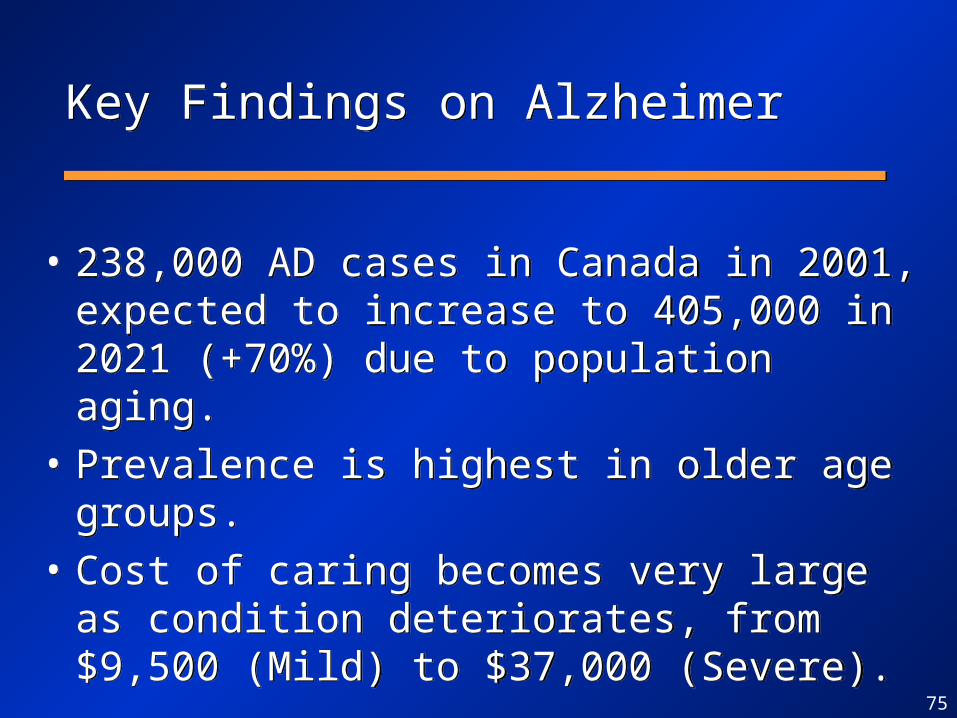
Key Findings on AlzheimerKey Findings on Alzheimer
• 238,000 AD cases in Canada in 2001, expected to increase to 405,000 in 2021 (+70%) due to population aging.
• Prevalence is highest in older age groups.
• Cost of caring becomes very large as condition deteriorates, from $9,500 (Mild) to $37,000 (Severe).
• 238,000 AD cases in Canada in 2001, expected to increase to 405,000 in 2021 (+70%) due to population aging.
• Prevalence is highest in older age groups.
• Cost of caring becomes very large as condition deteriorates, from $9,500 (Mild) to $37,000 (Severe).

76
Key Findings on AlzheimerKey Findings on Alzheimer
• Annual cost of Alzheimer drugs is $2,000.– Coverage beyond three months conditional on
assessment;– Most beneficiaries use Alzheimer drugs for less
than one year;– Persistency data shows 55% drop within 12
months, and 82% drop within 24 months;– Good compliance with therapy;
• Good management of cost vs. benefit