2001 special primary us congress district 3 … special primary us congress district 3 - republican...
TRANSCRIPT

State of ArkansasCertification Report2001 Special Primary US Congress District 3September 25, 2001
Summary Reports
Vote totals - Republican
Vote totals - Democrat
Vote totals by county - Republican
Vote totals by county - Democrat
Vote totals by polling location - Republican
Vote totals by polling location - Democrat
State of ArkansasCertification Report
2001 Special Primary US Congress District 3September 25, 2001
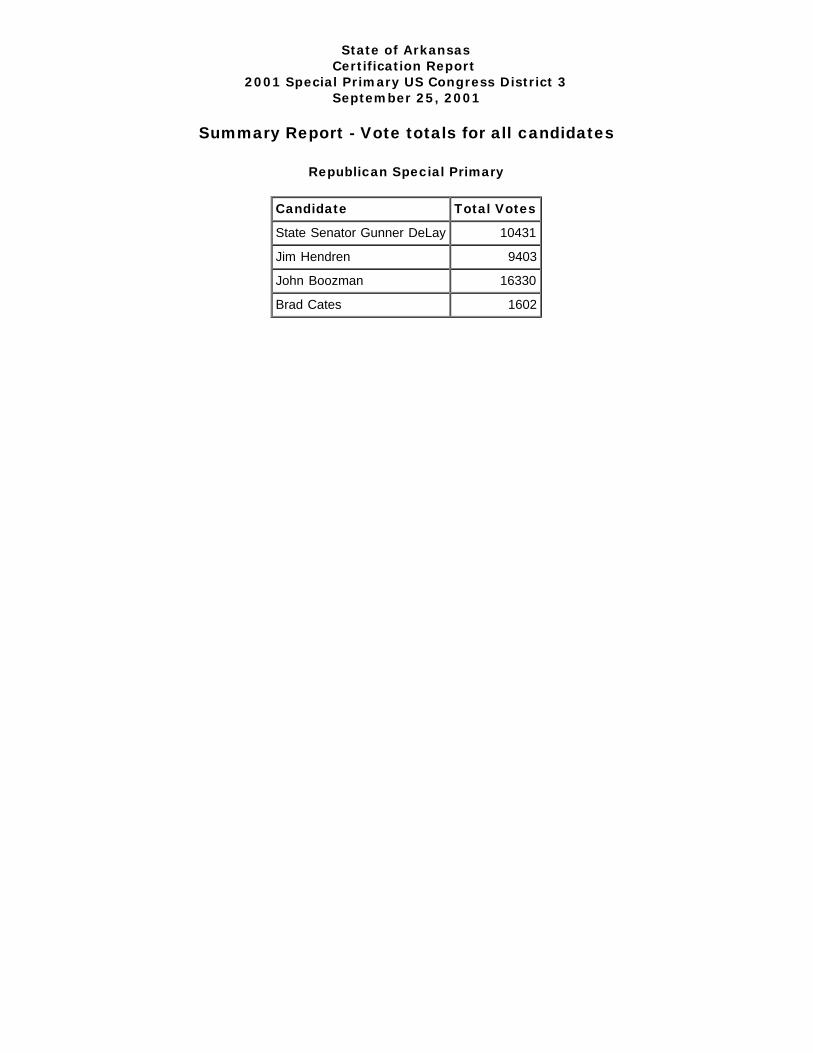
Summary Report - Vote totals for all candidates
Republican Special Primary
Candidate Total Votes
State Senator Gunner DeLay 10431
Jim Hendren 9403
John Boozman 16330
Brad Cates 1602

State of ArkansasCertification Report
2001 Special Primary US Congress District 3September 25, 2001
Summary Report - Vote totals for all candidates
Democrat Special Primary
Candidate Total Votes
State Representative Mike Hathorn 13282
Norman "Bill" Williams, Jr. 1813
State Representative Jo Carson 13087

State of ArkansasCertification Report
2001 Special Primary US Congress District 3September 25, 2001
Vote totals by county
Republican Special Primary
County Boozman Cates DeLay Hendren
Baxter County 503 21 325 730
Benton County 8991 543 2203 3156
Boone County 446 40 274 208
Carroll County 185 55 110 337
Crawford County 469 107 1048 442
Franklin County 94 24 223 145
Johnson County 209 19 200 229
Logan County 123 25 205 168
Madison County 181 16 164 192
Marion County 129 18 96 223
Newton County 100 4 58 120
Polk County 126 20 110 194
Pope County 517 24 223 533
Scott County 44 15 130 90
Sebastian County 1535 217 3396 944
Washington County 2678 454 1666 1692
Total 16330 1602 10431 9403

State of ArkansasCertification Report
2001 Special Primary US Congress District 3September 25, 2001
Summary Report - Vote totals by county
Democrat Special Primary
County Carson Hathorn Williams
Baxter County 412 321 85
Benton County 1682 1306 528
Boone County 294 623 53
Carroll County 357 683 33
Crawford County 1161 581 140
Franklin County 327 586 94
Johnson County 315 921 89
Logan County 346 876 44
Madison County 97 1700 32
Marion County 92 290 41
Newton County 16 649 4
Polk County 237 407 53
Pope County 286 829 112
Scott County 247 400 58
Sebastian County 4224 601 190
Washington County 2994 2509 257
Total 13087 13282 1813

State of ArkansasCertification Report
2001 Special Primary US Congress District 3 - RepublicanSeptember 25, 2001
Vote totals by polling location
Baxter County
U.S. Congress District 03 - Republican
LEGEND# 1 represents John Boozman - Republican [503 total votes]# 2 represents Brad Cates - Republican [21 total votes]# 3 represents Jim Hendren - Republican [730 total votes]# 4 represents State Senator Gunner DeLay - Republican [325 total votes]# 5 represents Total over votes [0 total votes]# 6 represents Total under votes [25 total votes]
1 2 3 4 5 61-1 Three Brothers Community Church 14 1 16 9 0 11-2, 1-3 Lakeview Community Center 35 0 77 37 0 1
2-1 Clarkridge Fire Station 18 0 7 11 0 02-2, 4-2, 6-3 Village Mall 53 3 45 43 0 2
2-3, 6-2, 7-2 Church of Christ 35 5 64 19 0 43-1 Gamaliel Fire Station 6 1 17 3 0 1
3-2 Henderson Fire Station 7 1 9 2 0 03-3, 3-4 NE Lakeside Fire Station 36 0 37 32 0 1
4-1 Midway Fire Station 11 1 34 9 0 05-1 Eastside Baptist Church 47 1 49 17 0 1
5-2, 6-1, 7-3, 8-1, 8-2 Baxter County Fair Grounds 70 1 109 37 0 37-1, 8-2 First Baptist Church 11-5 Table Rock Community Cent 50 2 75 17 0 2
9-1 Hand Cove Fire Station 0 0 5 9 0 09-2, 9-6 Tracy Fire Station 18 2 28 16 0 2
9-3, 9-4 Norfork VFW 17 1 19 7 0 39-5, 11-1 Salesville City Hall 1 0 12 3 0 0
10-1 Cotter City Hall 7 1 12 7 0 110-2, 10-3, 11-3 Gassville City Hall 28 0 61 16 0 1
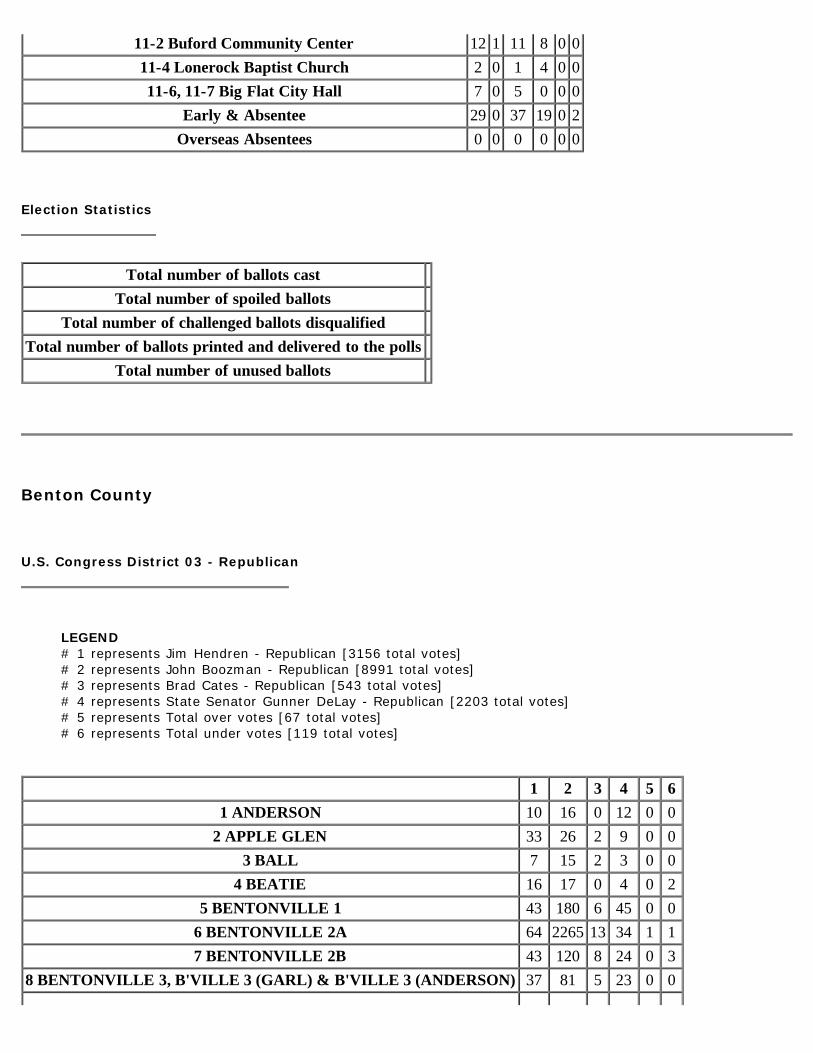
11-2 Buford Community Center 12 1 11 8 0 011-4 Lonerock Baptist Church 2 0 1 4 0 011-6, 11-7 Big Flat City Hall 7 0 5 0 0 0
Early & Absentee 29 0 37 19 0 2Overseas Absentees 0 0 0 0 0 0
Election Statistics
Total number of ballots castTotal number of spoiled ballots
Total number of challenged ballots disqualifiedTotal number of ballots printed and delivered to the polls
Total number of unused ballots
Benton County
U.S. Congress District 03 - Republican
LEGEND# 1 represents Jim Hendren - Republican [3156 total votes]# 2 represents John Boozman - Republican [8991 total votes]# 3 represents Brad Cates - Republican [543 total votes]# 4 represents State Senator Gunner DeLay - Republican [2203 total votes]# 5 represents Total over votes [67 total votes]# 6 represents Total under votes [119 total votes]
1 2 3 4 5 61 ANDERSON 10 16 0 12 0 0
2 APPLE GLEN 33 26 2 9 0 03 BALL 7 15 2 3 0 0
4 BEATIE 16 17 0 4 0 25 BENTONVILLE 1 43 180 6 45 0 0
6 BENTONVILLE 2A 64 2265 13 34 1 17 BENTONVILLE 2B 43 120 8 24 0 3
8 BENTONVILLE 3, B'VILLE 3 (GARL) & B'VILLE 3 (ANDERSON) 37 81 5 23 0 0

9 BENTONVILLE 4A & BENTONVILLE 4C 52 110 7 48 0 010 BENTONVILLE 4B 35 85 8 26 0 3
11 BETHEL HEIGHTS & SPRINGDALE 25 68 3 31 1 112 BRIGHTWATER & BRIGHTWATER CITY 43 98 18 50 1 1
13 CHEROKEE 12 8 3 3 0 014 COLVILLE, COLVILLE CITY, & COLVILLE CITY B 53 101 6 48 1 0
15 DECATUR & DECATUR CITY 48 70 10 20 1 216 DICKSON A & DICKSON C 66 72 6 22 0 4
17 DICKSON B-1 (A-K) 214 295 24 92 2 118 DICKSON B-2 (L-Z) 227 212 18 80 8 4
19 ESCULAPIA A 55 213 9 91 0 120 ESCULAPIA B 23 125 8 34 0 121 ESCULAPIA C 26 79 4 38 1 0
22 FELKER 12 3 3 2 0 223 FLINT & FLINT CITY 22 9 6 3 0 1
24 GARFIELD & GARFIELD CITY & GARFIELD CITY RR 64 121 17 40 1 225 GARLAND & GARLAND CITY & GARLAND CITY B 48 130 3 25 0 1
26 GENTRY & GENTRY CITY 86 82 8 16 1 227 HICO B 23 52 18 11 0 2
28 HOOVER & HOOVER CITY & HOOVER CITY A & B & C 16 16 1 10 0 129 LITTLE FLOCK O, LITTLE FLOCK E, & OSAGE D 22 102 6 44 0 1
30 LOGAN 5 18 2 2 0 031 MASON VALLEY 14 26 1 10 0 0
32 MT. VERNON & MT. VERNON CITY & SUGAR CREEK 70 165 5 89 0 433 BELLA VISTA 1 27 154 8 50 2 634 BELLA VISTA 2 96 145 20 53 1 435 BELLA VISTA 3 181 335 32 89 11 536 BELLA VISTA 4 156 355 27 133 11 11
37 OSAGE A, OSAGE B & OSAGE C 34 82 6 20 1 338 ROGERS 1A 18 79 3 30 1 2
39 ROGERS 1B & ROGERS 1B-2 & ROGERS 1B-3 31 80 5 28 2 140 ROGERS 1C 9 43 4 13 0 141 ROGERS 1D 7 23 4 18 0 042 ROGERS 1E 12 37 0 20 0 543 ROGERS 2A 42 154 11 39 0 044 ROGERS 2B 30 133 3 32 1 145 ROGERS 2C 13 66 2 14 0 146 ROGERS 2D 39 101 1 28 1 2
47 ROGERS 2E & ROGERS 3F 7 47 4 22 1 148 ROGERS 3A, ROGERS 3E, ROGERS 3G 32 160 5 47 1 0

49 ROGERS 3B 55 272 13 57 3 550 ROGERS 3C 37 175 8 60 3 2
51 ROGERS 3D, ROGERS 3D (COLV) & ROGERS 3D(COLV2) 36 209 11 16 2 252 ROGERS 4A, ROGERS 4B, & ROGERS 4F 22 189 5 62 0 2
53 ROGERS 4C 5 20 3 6 0 054 ROGERS 4D 5 36 2 12 1 055 ROGERS 4E 25 124 4 33 1 1
56 ROLLER RIDGE & ROLLER RIDGE CITY 14 27 0 21 0 357 ROUND PRAIRIE 12 15 2 8 0 1
58 SILOAM 1, SILOAM 1A, & HICO A 65 144 29 23 1 259 SILOAM 2 & SILOAM 2A 29 92 15 23 1 360 SILOAM 3 & SILOAM 3B 29 81 10 6 0 161 SILOAM 4 & SILOAM 4B 47 94 11 18 0 4
62 SULPHUR SPGS & SULPHUR SPGS CITY 67 16 1 13 1 063 SULPHUR SPRINGS BVV 62 81 5 16 0 1
64 WAGER 4 8 3 7 0 065 WALLACE & WALLACE CITY 243 118 10 33 1 4
66 WALNUT 40 82 19 50 0 067 WAR EAGLE 20 32 5 29 1 0
68 WASHINGTON A 1 12 0 8 0 069 WASHINGTON B 19 32 4 17 0 2
70 LOWELL 1, 1B,& LOWELL 2, 2B 19 45 2 12 0 071 LOWELL 3, 3A, & LOWELL 4, 4A 28 83 8 21 0 2
72 WASHINGTON D 16 29 5 19 1 173 YELL 8 1 3 8 0 0
Election Statistics
Total number of ballots cast 13085Total number of spoiled ballots 11
Total number of challenged ballots disqualified 8Total number of ballots printed and delivered to the polls 28050
Total number of unused ballots 14946
Boone County

U.S. Congress District 03 - Republican
LEGEND# 1 represents State Senator Gunner DeLay - Republican [274 total votes]# 2 represents John Boozman - Republican [443 total votes]# 3 represents Brad Cates - Republican [40 total votes]# 4 represents Jim Hendren - Republican [208 total votes]# 5 represents Total over votes [0 total votes]# 6 represents Total under votes [0 total votes]
1 2 3 4 5 6Early & Absentee 23 56 3 15 0 0
Overseas Absentees 0 0 0 0 0 0Batavia 12 3 1 3 0 0
Bellefonte 17 29 0 13 0 0Blythe 8 7 0 1 0 0Bryan 5 22 2 9 0 0
Carrollton 7 7 4 2 0 0Elixir 14 21 4 9 0 0Ewing 4 7 0 2 0 0
Gaither 5 15 0 2 0 0Jackson 15 11 2 5 0 0Jefferson 10 12 3 6 0 0
Lee 11 16 0 21 0 0Long Creek 5 1 1 5 0 0
Olvey 8 4 0 1 0 0Omaha 9 7 2 3 0 0Prairie 1 0 0 4 0 0
Sugarloaf-Diamond City 14 13 3 4 0 0Sugarloaf-Lead Hill 5 13 0 4 0 0
Summit 3 7 1 5 0 0Zinc 5 1 0 3 0 0
N Harrison 39 77 6 56 0 0S Harrison 54 114 8 35 0 0
Election Statistics
Total number of ballots cast 965

Total number of spoiled ballots 0Total number of challenged ballots disqualified 0
Total number of ballots printed and delivered to the pollsTotal number of unused ballots
Carroll County
U.S. Congress District 03 - Republican
LEGEND# 1 represents Jim Hendren - Republican [337 total votes]# 2 represents State Senator Gunner DeLay - Republican [110 total votes]# 3 represents John Boozman - Republican [185 total votes]# 4 represents Brad Cates - Republican [55 total votes]# 5 represents Total over votes [1 total votes]# 6 represents Total under votes [1 total votes]
1 2 3 4 5 6BERRYVILLE 88 25 45 12 0 0
EUREKA SPRINGS 163 48 90 32 1 0GREEN FOREST 60 18 42 7 0 1
Early 25 9 8 4 0 0Absentee 1 10 0 0 0 0
Election Statistics
Total number of ballots cast 689Total number of spoiled ballots 12
Total number of challenged ballots disqualified 0Total number of ballots printed and delivered to the polls 3000
Total number of unused ballots 2323

Crawford County
U.S. Congress District 03 - Republican
LEGEND# 1 represents State Senator Gunner DeLay - Republican [1048 total votes]# 2 represents John Boozman - Republican [469 total votes]# 3 represents Jim Hendren - Republican [442 total votes]# 4 represents Brad Cates - Republican [107 total votes]# 5 represents Total over votes [2 total votes]# 6 represents Total under votes [0 total votes]
1 2 3 4 5 6Early 91 21 22 3 0 0
Absentee 0 1 0 0 0 0001 Alma 1 24 11 9 4 1 0002 Alma 2 19 11 11 1 0 0003 Alma 3 46 43 23 4 0 0004 Bidville 8 3 5 0 0 0
005 Cedar Creek 10 0 1 0 0 0006 Cedarville 30 13 7 7 0 0
007 Chester 11 5 12 1 0 0008 Cove City 5 2 1 2 0 0
009 Dean Springs 29 16 17 4 0 0010 Dora 11 4 0 0 0 0011 Dyer 12 9 11 3 0 0
012 Jasper 44 17 21 6 0 0013 Kibler 37 24 12 4 0 0
014 Lancaster 18 8 5 2 0 0015 Lee Creek 25 5 14 3 0 0
016 Locke 4 7 5 2 0 0017 Mulberry 1 7 4 3 0 0 0019 Mulberry 3 10 7 11 0 0 0
020 Mountainburg 46 19 21 3 0 0021 Oliver Springs 32 8 16 0 0 0
022 Porter 2 5 4 0 0 0023 Rudy 36 13 12 5 1 0
024 Uniontown 20 5 11 5 0 0025 Upper 5 0 1 1 0 0026 VB 1-1 23 14 14 2 0 0

027 VB 1-2 89 51 21 9 0 0028 VB 2-1 10 3 4 0 0 0029 VB 2-2 23 8 8 3 0 0030 VB 3-1 52 10 16 2 0 0031 VB 3-2 31 13 12 0 0 0032 VB 3-3 39 23 16 6 0 0033 VB 3-4 35 14 16 2 0 0034 VB 3-6 50 18 19 3 0 0035 VB 3-5 43 15 26 3 0 0
036 Vine Prairie 8 2 6 2 0 0037 Whitley 12 8 4 4 0 0038 Winfrey 2 0 2 1 0 0039 VB 1-3 49 29 23 10 0 0
Election Statistics
Total number of ballots cast 2068Total number of spoiled ballots 14
Total number of challenged ballots disqualified 0Total number of ballots printed and delivered to the polls 13435
Total number of unused ballots 11353
Franklin County
U.S. Congress District 03 - Republican
LEGEND# 1 represents State Senator Gunner DeLay - Republican [223 total votes]# 2 represents Brad Cates - Republican [24 total votes]# 3 represents Jim Hendren - Republican [145 total votes]# 4 represents John Boozman - Republican [94 total votes]# 5 represents Total over votes [2 total votes]# 6 represents Total under votes [0 total votes]
1 2 3 4 5 6
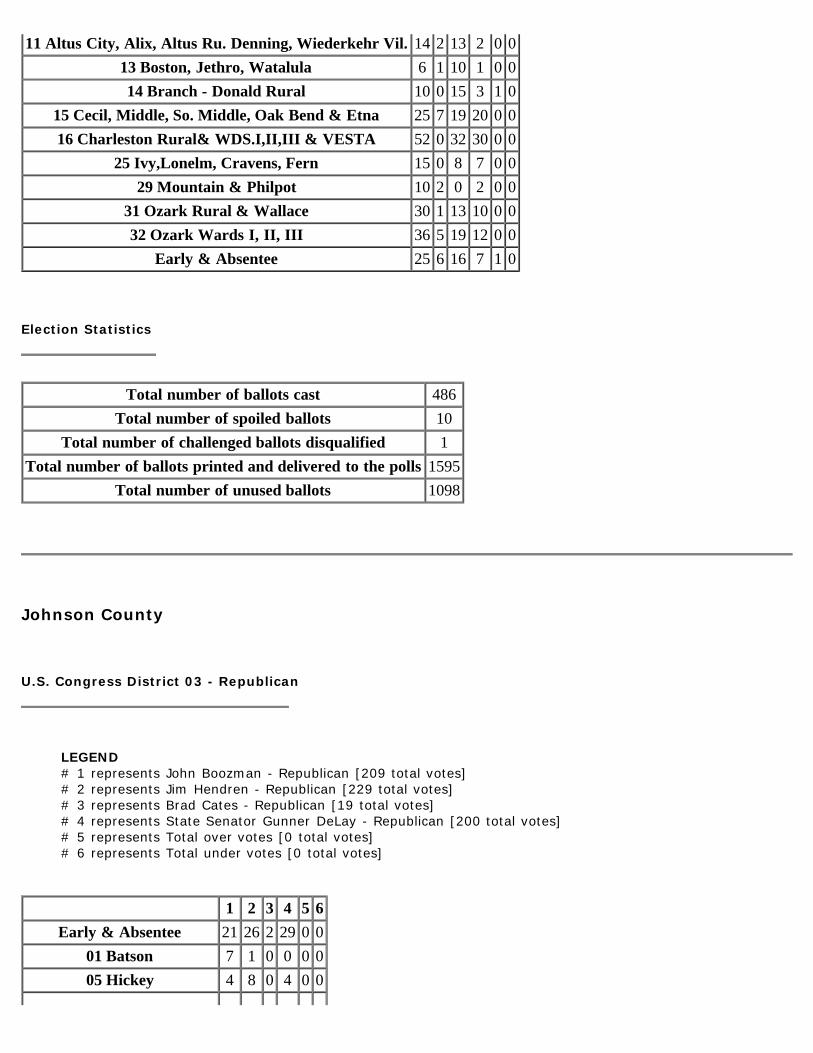
11 Altus City, Alix, Altus Ru. Denning, Wiederkehr Vil. 14 2 13 2 0 013 Boston, Jethro, Watalula 6 1 10 1 0 014 Branch - Donald Rural 10 0 15 3 1 0
15 Cecil, Middle, So. Middle, Oak Bend & Etna 25 7 19 20 0 016 Charleston Rural& WDS.I,II,III & VESTA 52 0 32 30 0 0
25 Ivy,Lonelm, Cravens, Fern 15 0 8 7 0 029 Mountain & Philpot 10 2 0 2 0 0
31 Ozark Rural & Wallace 30 1 13 10 0 032 Ozark Wards I, II, III 36 5 19 12 0 0
Early & Absentee 25 6 16 7 1 0
Election Statistics
Total number of ballots cast 486Total number of spoiled ballots 10
Total number of challenged ballots disqualified 1Total number of ballots printed and delivered to the polls 1595
Total number of unused ballots 1098
Johnson County
U.S. Congress District 03 - Republican
LEGEND# 1 represents John Boozman - Republican [209 total votes]# 2 represents Jim Hendren - Republican [229 total votes]# 3 represents Brad Cates - Republican [19 total votes]# 4 represents State Senator Gunner DeLay - Republican [200 total votes]# 5 represents Total over votes [0 total votes]# 6 represents Total under votes [0 total votes]
1 2 3 4 5 6Early & Absentee 21 26 2 29 0 0
01 Batson 7 1 0 0 0 005 Hickey 4 8 0 4 0 0

07 Horsehead 8 6 0 6 0 012 Lee 0 0 0 4 0 0
14 McKennon 6 3 0 5 0 021 Prairie 3 5 0 1 0 0
40 Stonewall 3 1 0 2 0 043 Spadra Ward 1 35 36 6 38 0 044 Spadra Ward 2 24 23 3 21 0 045 Spadra Ward 3 26 21 2 18 0 046 Spadra Ward 4 19 13 1 16 0 0
48 Grant 4 7 0 4 0 049 Howell 15 9 0 4 0 050 King 5 6 0 8 0 051 Perry 6 22 2 6 0 0
52 Pitt. 3 & 56 Pitt. 7 6 10 0 10 0 054 Redlick 6 10 2 7 0 055 Ward 1 9 0 5 0 0
Lowgap/Sherman 9 7 1 6 0 058 Dickerson/Hill Mulberry 1 6 0 6 0 0
Overseas Absentees 0 0 0 0 0 0
Election Statistics
Total number of ballots cast 657Total number of spoiled ballots 0
Total number of challenged ballots disqualified 0Total number of ballots printed and delivered to the polls 2500
Total number of unused ballots 1843
Logan County
U.S. Congress District 03 - Republican
LEGEND# 1 represents John Boozman - Republican [123 total votes]

# 2 represents Brad Cates - Republican [25 total votes]# 3 represents State Senator Gunner DeLay - Republican [205 total votes]# 4 represents Jim Hendren - Republican [168 total votes]# 5 represents Total over votes [0 total votes]# 6 represents Total under votes [0 total votes]
1 2 3 4 5 6Absentee & Early 7 1 12 3 0 0100 Cane Creek 3 0 5 7 0 0
101 Clark Crossroads 0 2 13 6 0 0102 Clark Subiaco City & Rural 5 0 7 5 0 0
104 Delaware 2 2 6 6 0 0105 Driggs 2 0 10 3 0 0
106 Ellsworth 5 3 11 11 0 0107 Johnson 2 1 0 5 0 0108 Logan 8 0 6 3 0 0
109 Mountain 1 0 7 3 0 0110 River City & Rural 10 1 6 3 0 0
112 Roseville 2 1 0 7 0 0113 Shoal Creek 4 0 8 5 0 0
114 Sht Mtn Wd 1 7 0 12 9 0 0115 Sht Mtn Wd 2 8 0 5 10 0 0116 Sht Mtn Wd 3 2 1 8 17 0 0117 Sht Mtn Wd 4 6 0 3 6 0 0
132 Blue Mountain City & Rural 2 1 2 0 0 0139 Petit Jean 1 1 3 2 0 0
140 Reveille City & Rural 2 0 14 7 0 0118 Caulksville City & Rural 7 1 10 7 0 0
119 Ratcliff City & Rural 0 3 2 2 0 0134 Boone Wd 1 0 2 2 7 0 0135 Boone Wd 2 6 0 5 6 0 0136 Boone Wd 3 3 0 5 7 0 0137 Boone Wd 4 16 3 13 11 0 0138 Cauthron 2 0 4 3 0 0
144 Sugar Creek 2 2 2 1 0 0145 Washburn 4 0 20 3 0 0
146 Barber 3 0 4 0 0 0147 Tomlinson 1 0 0 3 0 0
Overseas Absentee 0 0 0 0 0 0

Election Statistics
Total number of ballots castTotal number of spoiled ballots
Total number of challenged ballots disqualifiedTotal number of ballots printed and delivered to the polls
Total number of unused ballots
Madison County
U.S. Congress District 03 - Republican
LEGEND# 1 represents Brad Cates - Republican [16 total votes]# 2 represents State Senator Gunner DeLay - Republican [164 total votes]# 3 represents John Boozman - Republican [181 total votes]# 4 represents Jim Hendren - Republican [192 total votes]# 5 represents Total over votes [0 total votes]# 6 represents Total under votes [0 total votes]
1 2 3 4 5 6Early & Absentee 0 8 8 9 0 0
01 Alabam 0 6 12 10 0 002 Bohannan 0 9 6 7 0 0
03 Boston 0 1 0 3 0 004 Bowen 1 7 14 6 0 0
05 California 1 19 17 12 0 006 Hilburn 0 16 4 2 0 007 Japton 0 4 11 3 0 0
08 Kentucky 1 11 2 7 0 009 Kings River 2 1 8 3 0 0
10 Lamar 0 16 7 18 0 011 Lincoln 0 0 7 6 0 012 Marble 0 2 5 2 0 0
13 Mill Creek 0 1 2 1 0 014 Prairie 5 13 13 28 0 0

15 Purdy 0 0 2 0 0 016 Richland 2 6 5 13 0 0
17 Valley 0 2 8 11 0 018 Venus 0 9 8 4 0 0
19 War Eagle 1 0 6 5 9 0 020 War Eagle 2 1 8 7 10 0 0
21 Ward 1 0 1 7 4 0 022 Ward 2 2 2 5 7 0 023 Ward 3 1 4 3 2 0 024 Ward 4 0 7 6 3 0 0
25 Wharton 0 3 7 6 0 026 White River 0 2 2 6 0 0
Overseas Absentees 0 0 0 0 0 0
Election Statistics
Total number of ballots cast 553Total number of spoiled ballots 0
Total number of challenged ballots disqualified 1Total number of ballots printed and delivered to the polls 5770
Total number of unused ballots 5216
Marion County
U.S. Congress District 03 - Republican
LEGEND# 1 represents John Boozman - Republican [129 total votes]# 2 represents State Senator Gunner DeLay - Republican [96 total votes]# 3 represents Jim Hendren - Republican [223 total votes]# 4 represents Brad Cates - Republican [18 total votes]# 5 represents Total over votes [0 total votes]# 6 represents Total under votes [0 total votes]
1 2 3 4 5 6

Absentee and Early Voting 6 8 12 0 0 0American Legion Hut, Yellville 2 4 4 0 0 0
Bruno Fire House 7 1 9 0 0 0Bull Shoals Community Bldg 24 17 33 1 0 0
Eros School 8 4 4 0 0 0Fairview Fire House 9 11 22 1 0 0
Flippin City Hall 3 5 7 4 0 0Flippin School 21 12 26 2 0 0
Lakeway Fire House 7 7 20 1 0 0Lazy Acres Fire Dept 0 0 5 0 0 0
Oakland Community Bldg 2 5 8 0 0 0Peel Fire House 6 8 9 3 0 0
Promiseland Bible Church 3 3 8 0 0 0Pyatt Community Bldg 5 2 12 4 0 0
Ralph Fire House 11 5 25 1 0 0Rea Valley Fire House 4 1 5 0 0 0Yellville Nursing Home 11 3 14 1 0 0
Election Statistics
Total number of ballots cast 466Total number of spoiled ballots 0
Total number of challenged ballots disqualified 0Total number of ballots printed and delivered to the polls 500
Total number of unused ballots 474
Newton County
U.S. Congress District 03 - Republican
LEGEND# 1 represents State Senator Gunner DeLay - Republican [58 total votes]# 2 represents Jim Hendren - Republican [120 total votes]# 3 represents John Boozman - Republican [100 total votes]# 4 represents Brad Cates - Republican [4 total votes]

# 5 represents Total over votes [0 total votes]# 6 represents Total under votes [0 total votes]
1 2 3 4 5 601 Big Creek 9 2 2 0 0 0
02 Boston 7 1 2 0 0 004 Dogpatch 3 8 4 0 0 0
05 Grove/Hasty/Prairie 4 16 7 2 0 007 Hickory Grove 0 15 3 0 0 0
08 Hudson 1 2 7 0 0 009 Jackson 10 22 24 0 0 0
10 Jefferson & Walnut 1 6 4 0 0 011 Richland 4 4 6 1 0 013 Lincoln 0 7 6 0 0 0
14 Low Gap 0 9 3 0 0 016 Murray 0 1 0 0 0 0
22 Polk 0 1 1 0 0 023 Ponca 0 2 2 0 0 0
24 Pleasant Hll 6 11 5 0 0 028 Plumlee/Osage 5 3 2 0 0 0
29 Van Buren & Kentucky 0 3 5 0 0 030 White 1 4 6 0 0 0
Early & Absentee 7 3 11 1 0 0Overseas Absentees 0 0 0 0 0 0
Election Statistics
Total number of ballots castTotal number of spoiled ballots
Total number of challenged ballots disqualifiedTotal number of ballots printed and delivered to the polls
Total number of unused ballots
Polk County

U.S. Congress District 03 - Republican
LEGEND# 1 represents Brad Cates - Republican [20 total votes]# 2 represents State Senator Gunner DeLay - Republican [110 total votes]# 3 represents Jim Hendren - Republican [194 total votes]# 4 represents John Boozman - Republican [126 total votes]# 5 represents Total over votes [2 total votes]# 6 represents Total under votes [0 total votes]
1 2 3 4 5 6Early 0 9 2 2 0 0
Absentee 0 0 0 0 0 001-JP#1 1 16 27 16 0 002 - JP#2 2 8 19 14 0 003 - JP#3 3 14 21 17 1 0
04 - Acorn 0 13 11 13 0 005 - Ink 0 14 5 3 0 0
06 - Board Camp 0 2 11 6 0 007 - Cherry Hill 0 1 10 6 0 0
08 - Big Fork 0 2 3 2 0 009 - Shady 0 0 0 1 0 0
10 - Shady Grove 1 3 6 2 0 011- Rocky 0 4 6 7 0 012 - Potter 3 1 14 12 0 0
13 - Alder Springs 2 2 7 3 0 014 - Hatfield 1 6 9 6 0 0
15 - Cove 3 6 24 7 1 016 - Vandervoort 1 5 8 3 0 0
17 - Wickes 3 3 8 6 0 018 - Grannis 0 1 3 0 0 0
Overseas Absentees 0 0 0 0 0 0
Election Statistics
Total number of ballots cast 452Total number of spoiled ballots 0
Total number of challenged ballots disqualified 0Total number of ballots printed and delivered to the polls 715

Total number of unused ballots 263
Pope County
U.S. Congress District 03 - Republican
LEGEND# 1 represents Jim Hendren - Republican [533 total votes]# 2 represents State Senator Gunner DeLay - Republican [223 total votes]# 3 represents John Boozman - Republican [517 total votes]# 4 represents Brad Cates - Republican [24 total votes]# 5 represents Total over votes [7 total votes]# 6 represents Total under votes [3 total votes]
1 2 3 4 5 601 Bayliss 13 8 16 2 0 002 Burnett 3 0 1 0 0 003 Center 6 1 7 0 0 0
04 Clark In & Clark Out 28 17 35 1 0 005 Convenience 6 0 10 1 0 0
06 Dover In & Dover Out 79 24 77 3 0 107 Freeman & Martin 10 7 7 1 0 0
08 Galla 1-2-3 & Galla Out 21 10 26 0 0 009 Griffin 5 0 6 0 0 010 Gumlog 7 14 10 1 0 0
11 ILL Box 1- 2L & Norristown 62 21 49 2 3 012 ILL Box 2-2A,3G,3H,2M,SOE,NOE,NOWE,NOWW 28 18 38 0 0 0
13 ILL Box 3- 3A,3B,3C 19 8 18 0 0 014 ILL Box 4-2G,2I,2J,2K,3D,3E,3F 39 22 37 2 1 0
15 ILL Box 5- 2B,2C,2D,2E,2F 58 10 64 3 0 016 ILL Box 6- 1B,1C,1D,1G,1H,1I,1J 25 14 13 0 0 0
17 Jackson In & Jackson Out 8 3 7 1 1 018 Liberty 8 1 0 0 0 0
19 Moreland 5 0 6 0 0 020 Phoenix 5 3 3 0 0 021 Smyrna 2 0 2 0 0 0
22 Valley North &Valley South 9 7 14 1 0 0

23 Valley 2 12 4 11 0 0 024 Wilson 1-2-3 - Wilson Out E & Wilson Out W 13 7 16 4 0 0
Absentee 1 2 1 0 0 2Early 61 22 43 2 2 0
Election Statistics
Total number of ballots cast 1307Total number of spoiled ballots 0
Total number of challenged ballots disqualified 0Total number of ballots printed and delivered to the polls 7500
Total number of unused ballots 6193
Scott County
U.S. Congress District 03 - Republican
LEGEND# 1 represents John Boozman - Republican [44 total votes]# 2 represents Brad Cates - Republican [15 total votes]# 3 represents State Senator Gunner DeLay - Republican [130 total votes]# 4 represents Jim Hendren - Republican [90 total votes]# 5 represents Total over votes [0 total votes]# 6 represents Total under votes [0 total votes]
1 2 3 4 5 601 Blackfork 0 0 3 3 0 002 Blansett 0 2 2 2 0 003 Brawley 1 0 1 0 0 0
04 Cauthron/Oliver 0 0 1 3 0 005 Cedar Creek 2 0 0 2 0 0
07 Denton 1/Denton 2 0 2 3 3 0 008 Hickman Rural West 1 2 6 7 0 009 Hickman Rural East 4 0 9 7 0 0
10 Hickman Ward 1 6 0 16 6 0 0

11 Hickman Ward 2 1 0 10 4 0 012 Hickman Ward 3 5 0 8 6 0 0
13 Hon 0 1 7 8 0 014 Hunt 1 0 2 5 0 015 James 1 0 1 0 0 0
16 Jones/Little Texas 0 0 0 0 0 017 Keener 0 0 6 3 0 018 LaFave 1 0 1 0 0 020 Lamb 0 0 5 0 0 0
21 Lewis 1 3 0 5 4 0 022 Lewis 2 1 2 7 3 0 0
23 Mill Creek 1 3 11 3 0 024 Mountain 2 0 4 6 0 0
25 Mt. Pleasant 6 1 3 5 0 026 Parks 2 0 4 2 0 0
Coal & Lafayette 3 2 5 0 0 0Early & Absentee 1 0 6 1 0 0
Overseas Absentees 0 0 0 0 0 0Tate & Tomlinson 2 0 4 7 0 0
Election Statistics
Total number of ballots cast 279Total number of spoiled ballots 0
Total number of challenged ballots disqualified 0Total number of ballots printed and delivered to the polls 2275
Total number of unused ballots 1996
Sebastian County
U.S. Congress District 03 - Republican
LEGEND# 1 represents Jim Hendren - Republican [944 total votes]

# 2 represents State Senator Gunner DeLay - Republican [3396 total votes]# 3 represents Brad Cates - Republican [217 total votes]# 4 represents John Boozman - Republican [1535 total votes]# 5 represents Total over votes [3 total votes]# 6 represents Total under votes [1 total votes]
1 2 3 4 5 61-A, 1-B 6 54 4 8 0 11-C, 1-D 10 47 2 8 0 0
1-E, 2-G, 2-H 11 43 3 20 0 01-F, 1-G 43 122 3 44 0 01-H, 1-I 21 81 1 32 0 01-J, 1-K 9 25 2 9 0 0
1-L 12 47 2 30 0 01-M, 1-N, 4-B, 4-I 46 124 13 102 0 0
1-O, 1-P, 4-E 48 137 11 92 3 02-A, 2-B 4 28 0 2 0 02-C, 2-I 13 53 0 9 0 02-D, 2-E 16 129 4 37 0 0
2-F 2 8 0 0 0 03-A, 3-B 11 43 2 5 0 03-C, 3-D 17 122 8 70 0 0
3-E 19 98 6 50 0 03-F, 4-A 18 45 2 19 0 0
3-G, 3-K, 9-L 31 98 2 36 0 03-H 13 113 1 24 0 03-I 73 163 18 142 0 0
3-L, 3-O, 9-M, 9-N 26 113 5 59 0 04-C, 4-D 16 80 9 48 0 0
4-F 67 231 12 125 0 04-G 20 54 3 26 0 04-H 30 49 2 69 0 04-J 12 38 6 15 0 0
4-M 35 100 8 76 0 09-A 7 43 7 13 0 09-B 5 25 1 6 0 0
9-C, 9-C1 22 116 5 26 0 09-D 7 50 1 9 0 0
9-E, 9-E2, 9-E3 32 104 8 51 0 09-E1 9 28 3 10 0 0
9-F, 9-F1 14 36 5 7 0 0

9-G 11 13 0 11 0 09-H, 9-H1 10 12 0 6 0 09-I1, 9-I2 5 21 1 6 0 0
9-J 2 22 5 1 0 09-K, 9-K1 1 13 5 1 0 0
9-N1, 9-N2, 9-N3, 9-N4 0 17 0 3 0 09-O 2 10 1 3 0 0
9-P1, 9-P3 14 66 0 19 0 09-P2, 9-P4 22 71 3 11 0 0
9-Q 4 20 2 9 0 09-R 2 25 3 4 0 0
9-S, 9-S1 13 33 1 5 0 09-T 3 14 2 1 0 09-U 6 22 2 9 0 0
9-V1, 9-V2, 9-V3 5 30 3 2 0 0Absentee Ft. Smith 22 34 3 16 0 0
Absentee Greenwood 1 6 0 5 0 0Early Ft. Smith 53 186 17 108 0 0
Early Greenwood 43 134 10 36 0 0Overseas Absentees 0 0 0 0 0 0
Election Statistics
Total number of ballots cast 6096Total number of spoiled ballots 17
Total number of challenged ballots disqualified 0Total number of ballots printed and delivered to the polls 30000
Total number of unused ballots 23904
Washington County
U.S. Congress District 03 - Republican
LEGEND

# 1 represents Jim Hendren - Republican [1692 total votes]# 2 represents John Boozman - Republican [2678 total votes]# 3 represents Brad Cates - Republican [454 total votes]# 4 represents State Senator Gunner DeLay - Republican [1666 total votes]# 5 represents Total over votes [29 total votes]# 6 represents Total under votes [3 total votes]
1 2 3 4 5 6Absentee 8 8 2 3 0 0Boston 3 0 3 7 0 0
Boston-S 0 0 0 3 0 0Brush Creek 24 32 7 45 0 0
Cane Hill 21 11 2 12 1 0Center North 24 37 8 29 0 0
Center North - S&H 6 7 1 1 0 0Center South 5 16 2 12 0 0
Center South - H 1 2 0 2 0 0Cove Creek 10 3 0 17 0 0
Cove Creek - S 0 0 0 0 0 0Crawford 9 5 1 11 0 0
Crawford - S 4 1 0 3 0 0Durham 4 13 2 3 0 0
Durham - H 0 0 2 1 0 0Dutch Mills 3 1 3 8 0 0
Dutch Mills - S 1 3 2 0 0 0Early 102 148 27 76 1 1Elkins 13 12 4 13 0 0
Elm Springs City 19 49 0 13 1 0Elm Springs Township 11 9 0 7 0 0
Farmington 31 44 8 25 0 0Fayetteville P-01 7 13 0 11 0 0Fayetteville P-02 6 16 2 11 0 0Fayetteville P-03 11 27 7 23 1 0Fayetteville P-04 2 8 1 2 1 0Fayetteville P-05 11 17 8 18 0 0Fayetteville P-06 75 112 11 43 0 0Fayetteville P-07 22 46 5 22 0 0Fayetteville P-08 20 18 9 10 0 0Fayetteville P-09 2 4 3 2 0 0Fayetteville P-10 19 35 8 27 2 0Fayetteville P-11 7 5 2 2 0 0Fayetteville P-12 28 71 11 29 0 0

Fayetteville P-13 3 6 2 3 1 0Fayetteville P-14 3 2 0 4 0 0Fayetteville P-15 0 0 0 0 0 0Fayetteville P-16 4 2 0 0 0 0Fayetteville P-17 38 72 5 29 0 0Fayetteville P-18 24 45 12 12 2 0Fayetteville P-19 22 44 3 14 0 0Fayetteville P-20 2 9 2 6 0 0Fayetteville P-21 5 4 3 2 0 0Fayetteville P-22 18 27 8 18 0 0Fayetteville P-23 7 20 6 22 0 1Fayetteville P-24 0 0 0 0 0 0Fayetteville P-25 9 6 0 6 0 0Fayetteville P-26 3 6 0 5 0 0Fayetteville P-27 0 0 0 0 0 0Fayetteville P-28 29 68 4 23 0 0Fayetteville P-29 9 19 3 1 0 0Fayetteville P-30 4 8 1 2 0 0Fayetteville P-31 8 11 3 8 1 0Fayetteville P-32 0 1 0 0 0 0Fayetteville P-33 2 12 2 3 0 0Fayetteville P-34 11 12 2 4 0 0Fayetteville P-35 4 3 1 0 0 0Fayetteville P-36 11 9 0 8 0 0
Goshen City 8 35 1 17 0 0Goshen Township 4 1 2 11 0 0
Goshen Township - H 3 5 1 11 0 0Goshen Township - S 2 0 0 0 0 0
Greenland city 21 18 2 9 0 0Greenland Township 21 5 2 14 0 0
Harmon 20 42 5 18 0 0Illinois 11 5 3 10 0 0
Illinois - S 4 1 0 0 0 0Johnson City 28 47 4 16 0 0
Johnson Township 15 24 3 15 0 0Lees Creek 3 3 4 7 0 0
Lincoln 27 19 3 9 0 0Litteral 18 26 6 17 0 1
Marrs Hill 5 8 4 23 1 0Marrs Hill - S&H 0 0 0 0 0 0

Morrow 8 2 0 3 0 0Morrow - S 0 2 0 0 0 0
Overseas Absentees 0 0 0 0 0 0Prairie Grove City 38 28 13 18 0 0
Prairie Grove Township 16 10 3 15 0 0Prairie Grove TWP - S&H 0 0 0 2 0 0
Prairie Township 1 44 76 18 35 2 0Prairie Township 2 10 9 0 12 0 0Prairie Township 3 0 0 0 0 0 0Prairie Township 4 0 8 1 3 0 0
Price 7 6 0 2 0 0Price - H 0 0 0 0 0 0
Reed 3 3 0 7 0 0Reed - H 1 0 0 0 0 0
Rheas Mill 13 11 3 16 0 0Richland 20 9 2 7 0 0
Springdale P-01 5 19 2 10 0 0Springdale P-02 59 76 16 57 0 0Springdale P-03 18 58 6 22 0 0
Springdale P-03-H 0 0 0 0 0 0Springdale P-04 20 43 1 22 0 0Springdale P-05 48 93 11 56 0 0Springdale P-06 32 44 3 26 1 0Springdale P-07 49 150 16 73 5 0Springdale P-09 11 19 1 20 0 0Springdale P-10 38 101 11 30 0 0Springdale P-11 6 20 3 6 0 0
Springdale P-11-H 3 3 0 2 0 0Springdale P-12 34 80 9 29 1 0Springdale P-13 12 16 1 7 2 0Springdale P-14 5 16 0 9 0 0Springdale P-15 0 3 0 1 0 0Springdale P-16 18 31 10 32 0 0Springdale P-17 28 32 8 24 1 0Springdale P-18 16 51 3 22 0 0Springdale P-19 24 46 3 18 0 0Springdale P-20 5 30 2 14 1 0
Springdale Township 1 36 59 13 37 0 0Starr Hill 12 2 2 14 0 0
Starr Hill - H 0 1 0 0 0 0

Tontitown City 5 15 2 16 0 0Tontitown Township 3 8 1 1 0 0
Valley 17 10 5 18 1 0Valley - S 0 0 0 0 0 0Vineyard 11 3 0 10 0 0
Wedington 2 4 2 11 1 0West Fork City 16 13 16 23 0 0
West Fork Township 19 4 8 16 0 0Wheeler 16 26 8 20 0 0
White River 5 15 2 17 0 0White River - H 0 0 0 0 0 0
Winslow City 4 2 0 6 2 0Winslow Township 16 9 8 19 0 0Winslow TWP - S 2 0 0 1 0 0
Wyman 21 14 3 18 0 0Wyman - S 1 0 0 1 0 0
Election Statistics
Total number of ballots cast 6526Total number of spoiled ballots 19
Total number of challenged ballots disqualified 0Total number of ballots printed and delivered to the polls 12245
Total number of unused ballots 5700

State of ArkansasCertification Report
2001 Special Primary US Congress District 3 - DemocratSeptember 25, 2001
Vote totals by polling location
Baxter County
U.S. Congress District 03 - Democrat
LEGEND# 1 represents State Representative Jo Carson - Democrat [412 total votes]# 2 represents Norman "Bill" Williams, Jr. - Democrat [85 total votes]# 3 represents State Representative Mike Hathorn - Democrat [321 total votes]# 4 represents Total over votes [0 total votes]# 5 represents Total under votes [17 total votes]
1 2 3 4 51-1 Three Brothers Community Church 16 2 6 0 01-2, 1-3 Lakeview Community Center 29 4 17 0 1
2-1 Clarkridge Fire Station 5 1 6 0 02-2, 4-2, 6-3 Village Mall 28 5 21 0 2
2-3, 6-2, 7-2 Church of Christ 44 8 14 0 03-1 Gamaliel Fire Station 12 3 5 0 0
3-2 Henderson Fire Station 8 2 4 0 03-3, 3-4 NE Lakeside Fire Station 25 2 16 0 1
4-1 Midway Fire Station 17 4 7 0 05-1 Eastside Baptist Church 19 9 15 0 0
5-2, 6-1, 7-3, 8-1, 8-2 Baxter County Fair Grounds 62 10 51 0 47-1, 8-2 First Baptist Church 11-5 Table Rock Community Cent 31 7 44 0 1
9-1 Hand Cove Fire Station 6 1 5 0 19-2, 9-6 Tracy Fire Station 16 0 3 0 0
9-3, 9-4 Norfork VFW 14 6 18 0 09-5, 11-1 Salesville City Hall 13 4 9 0 1
10-1 Cotter City Hall 15 2 9 0 210-2, 10-3, 11-3 Gassville City Hall 23 3 17 0 2
11-2 Buford Community Center 8 2 5 0 0

11-4 Lonerock Baptist Church 1 3 8 0 011-6, 11-7 Big Flat City Hall 3 3 5 0 1
Early & Absentee 17 4 36 0 1Overseas Absentees 0 0 0 0 0
Election Statistics
Total number of ballots castTotal number of spoiled ballots
Total number of challenged ballots disqualifiedTotal number of ballots printed and delivered to the polls
Total number of unused ballots
Benton County
U.S. Congress District 03 - Democrat
LEGEND# 1 represents State Representative Mike Hathorn - Democrat [1306 total votes]# 2 represents State Representative Jo Carson - Democrat [1682 total votes]# 3 represents Norman "Bill" Williams, Jr. - Democrat [528 total votes]# 4 represents Total over votes [54 total votes]# 5 represents Total under votes [37 total votes]
1 2 3 4 51 ANDERSON 2 5 3 0 0
2 APPLE GLEN 4 3 4 0 03 BALL 4 4 0 0 0
4 BEATIE 0 3 0 0 05 BENTONVILLE 1 36 19 9 0 2
6 BENTONVILLE 2A 39 31 11 1 27 BENTONVILLE 2B 50 48 18 3 2
8 BENTONVILLE 3, B'VILLE 3 (GARL) & B'VILLE 3 (ANDERSON) 17 36 5 1 19 BENTONVILLE 4A & BENTONVILLE 4C 20 24 6 2 2
10 BENTONVILLE 4B 15 18 8 3 0
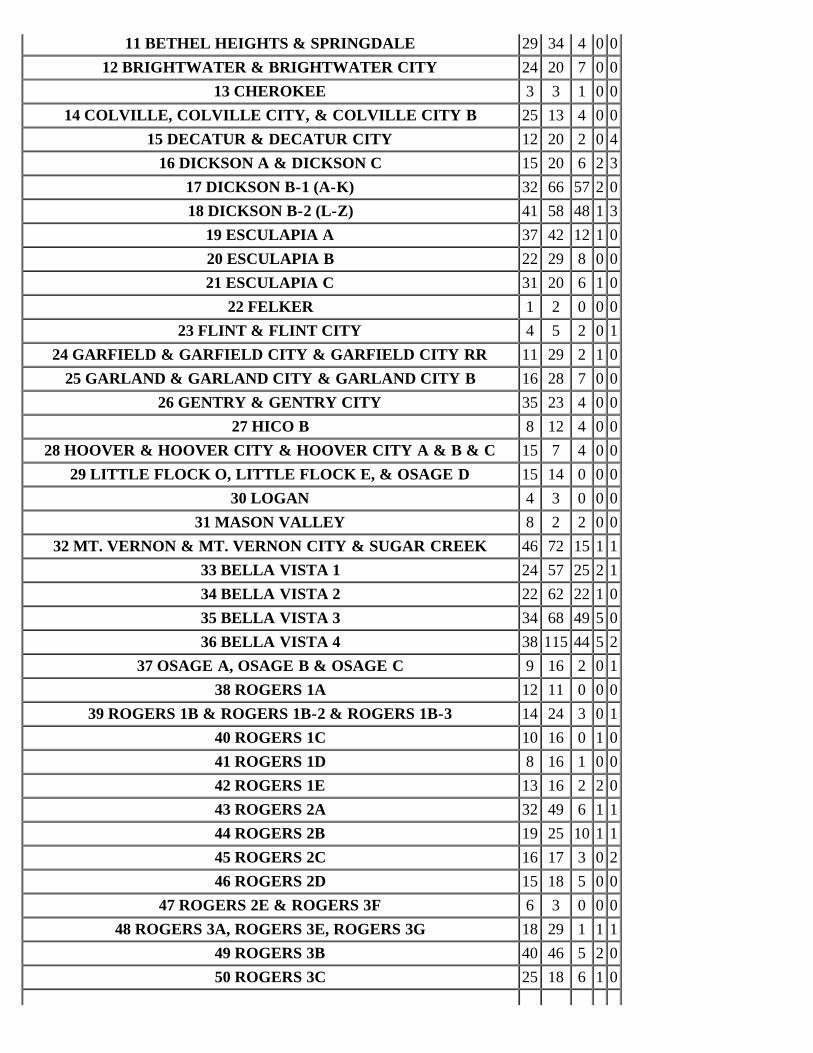
11 BETHEL HEIGHTS & SPRINGDALE 29 34 4 0 012 BRIGHTWATER & BRIGHTWATER CITY 24 20 7 0 0
13 CHEROKEE 3 3 1 0 014 COLVILLE, COLVILLE CITY, & COLVILLE CITY B 25 13 4 0 0
15 DECATUR & DECATUR CITY 12 20 2 0 416 DICKSON A & DICKSON C 15 20 6 2 3
17 DICKSON B-1 (A-K) 32 66 57 2 018 DICKSON B-2 (L-Z) 41 58 48 1 3
19 ESCULAPIA A 37 42 12 1 020 ESCULAPIA B 22 29 8 0 021 ESCULAPIA C 31 20 6 1 0
22 FELKER 1 2 0 0 023 FLINT & FLINT CITY 4 5 2 0 1
24 GARFIELD & GARFIELD CITY & GARFIELD CITY RR 11 29 2 1 025 GARLAND & GARLAND CITY & GARLAND CITY B 16 28 7 0 0
26 GENTRY & GENTRY CITY 35 23 4 0 027 HICO B 8 12 4 0 0
28 HOOVER & HOOVER CITY & HOOVER CITY A & B & C 15 7 4 0 029 LITTLE FLOCK O, LITTLE FLOCK E, & OSAGE D 15 14 0 0 0
30 LOGAN 4 3 0 0 031 MASON VALLEY 8 2 2 0 0
32 MT. VERNON & MT. VERNON CITY & SUGAR CREEK 46 72 15 1 133 BELLA VISTA 1 24 57 25 2 134 BELLA VISTA 2 22 62 22 1 035 BELLA VISTA 3 34 68 49 5 036 BELLA VISTA 4 38 115 44 5 2
37 OSAGE A, OSAGE B & OSAGE C 9 16 2 0 138 ROGERS 1A 12 11 0 0 0
39 ROGERS 1B & ROGERS 1B-2 & ROGERS 1B-3 14 24 3 0 140 ROGERS 1C 10 16 0 1 041 ROGERS 1D 8 16 1 0 042 ROGERS 1E 13 16 2 2 043 ROGERS 2A 32 49 6 1 144 ROGERS 2B 19 25 10 1 145 ROGERS 2C 16 17 3 0 246 ROGERS 2D 15 18 5 0 0
47 ROGERS 2E & ROGERS 3F 6 3 0 0 048 ROGERS 3A, ROGERS 3E, ROGERS 3G 18 29 1 1 1
49 ROGERS 3B 40 46 5 2 050 ROGERS 3C 25 18 6 1 0

51 ROGERS 3D, ROGERS 3D (COLV) & ROGERS 3D(COLV2) 8 7 0 0 052 ROGERS 4A, ROGERS 4B, & ROGERS 4F 31 29 8 0 0
53 ROGERS 4C 13 3 3 0 054 ROGERS 4D 12 8 0 0 055 ROGERS 4E 25 42 1 1 0
56 ROLLER RIDGE & ROLLER RIDGE CITY 0 1 0 0 057 ROUND PRAIRIE 5 10 1 0 0
58 SILOAM 1, SILOAM 1A, & HICO A 12 34 2 1 059 SILOAM 2 & SILOAM 2A 10 31 4 0 060 SILOAM 3 & SILOAM 3B 12 17 5 1 061 SILOAM 4 & SILOAM 4B 16 22 2 3 1
62 SULPHUR SPGS & SULPHUR SPGS CITY 9 14 4 0 163 SULPHUR SPRINGS BVV 13 20 19 1 0
64 WAGER 1 2 2 0 065 WALLACE & WALLACE CITY 23 33 14 0 0
66 WALNUT 30 27 1 5 167 WAR EAGLE 34 13 8 0 0
68 WASHINGTON A 1 0 0 0 069 WASHINGTON B 22 9 1 1 0
70 LOWELL 1, 1B,& LOWELL 2, 2B 11 12 2 0 071 LOWELL 3, 3A, & LOWELL 4, 4A 19 8 2 0 0
72 WASHINGTON D 21 18 5 0 373 YELL 2 3 1 0 0
Election Statistics
Total number of ballots cast 3607Total number of spoiled ballots 9
Total number of challenged ballots disqualified 11Total number of ballots printed and delivered to the polls 19200
Total number of unused ballots 15573
Boone County
U.S. Congress District 03 - Democrat

LEGEND# 1 represents State Representative Mike Hathorn - Democrat [623 total votes]# 2 represents Norman "Bill" Williams, Jr. - Democrat [53 total votes]# 3 represents State Representative Jo Carson - Democrat [294 total votes]# 4 represents Total over votes [0 total votes]# 5 represents Total under votes [0 total votes]
1 2 3 4 5Early & Absentee 64 7 19 0 0
Overseas Absentees 0 0 0 0 0Batavia 6 1 5 0 0
Bellefonte 22 4 21 0 0Blythe 8 0 3 0 0Bryan 14 1 12 0 0
Carrollton 27 1 8 0 0Elixir 11 4 11 0 0Ewing 15 4 2 0 0
Gaither 23 0 8 0 0Jackson 9 0 6 0 0Jefferson 21 4 10 0 0
Lee 22 2 10 0 0Long Creek 14 0 4 0 0
Olvey 19 0 1 0 0Omaha 23 0 7 0 0Prairie 12 0 3 0 0
Sugarloaf-Diamond City 8 1 3 0 0Sugarloaf-Lead Hill 30 4 11 0 0
Summit 18 3 18 0 0Zinc 9 1 9 0 0
N Harrison 95 9 60 0 0S Harrison 153 7 63 0 0
Election Statistics
Total number of ballots cast 970Total number of spoiled ballots 0
Total number of challenged ballots disqualified 0Total number of ballots printed and delivered to the polls

Total number of unused ballots
Carroll County
U.S. Congress District 03 - Democrat
LEGEND# 1 represents State Representative Mike Hathorn - Democrat [683 total votes]# 2 represents Norman "Bill" Williams, Jr. - Democrat [33 total votes]# 3 represents State Representative Jo Carson - Democrat [357 total votes]# 4 represents Total over votes [8 total votes]# 5 represents Total under votes [3 total votes]
1 2 3 4 5BERRYVILLE 345 7 51 6 1
EUREKA SPRINGS 51 13 252 0 0GREEN FOREST 184 10 20 0 2
Early 81 3 30 0 0Absentee 22 0 4 2 0
Election Statistics
Total number of ballots cast 1084Total number of spoiled ballots 5
Total number of challenged ballots disqualified 0Total number of ballots printed and delivered to the polls 3000
Total number of unused ballots 1921
Crawford County
U.S. Congress District 03 - Democrat

LEGEND# 1 represents State Representative Mike Hathorn - Democrat [581 total votes]# 2 represents Norman "Bill" Williams, Jr. - Democrat [140 total votes]# 3 represents State Representative Jo Carson - Democrat [1161 total votes]# 4 represents Total over votes [54 total votes]# 5 represents Total under votes [3 total votes]
1 2 3 4 5Early 58 9 89 3 0
Absentee 11 1 6 0 0001 Alma 1 20 4 30 3 0002 Alma 2 22 2 20 2 0003 Alma 3 17 4 50 3 0004 Bidville 1 2 2 0 0
005 Cedar Creek 6 2 10 0 1006 Cedarville 18 8 35 0 0
007 Chester 4 4 11 1 0008 Cove City 2 0 1 0 0
009 Dean Springs 18 3 47 1 0010 Dora 7 3 15 2 0011 Dyer 20 7 34 4 0
012 Jasper 26 5 27 1 2013 Kibler 13 1 21 5 0
014 Lancaster 14 3 10 0 0015 Lee Creek 9 0 13 0 0
016 Locke 1 0 8 1 0017 Mulberry 1 9 3 16 0 0019 Mulberry 3 36 4 29 3 0
020 Mountainburg 17 1 41 1 0021 Oliver Springs 9 3 22 0 0
022 Porter 5 2 7 0 0023 Rudy 7 2 25 1 0
024 Uniontown 7 3 15 0 0025 Upper 4 0 9 0 0026 VB 1-1 11 0 31 0 0027 VB 1-2 40 17 91 1 0028 VB 2-1 5 1 28 1 0029 VB 2-2 27 0 39 2 0030 VB 3-1 13 0 45 1 0031 VB 3-2 15 6 70 5 0

032 VB 3-3 7 6 42 4 0033 VB 3-4 22 5 37 2 0034 VB 3-6 21 13 64 3 0035 VB 3-5 12 5 38 2 0
036 Vine Prairie 17 3 17 0 0037 Whitley 9 2 14 0 0038 Winfrey 8 0 2 0 0039 VB 1-3 13 6 50 2 0
Election Statistics
Total number of ballots cast 1939Total number of spoiled ballots 14
Total number of challenged ballots disqualified 0Total number of ballots printed and delivered to the polls 9066
Total number of unused ballots 7127
Franklin County
U.S. Congress District 03 - Democrat
LEGEND# 1 represents State Representative Mike Hathorn - Democrat [586 total votes]# 2 represents Norman "Bill" Williams, Jr. - Democrat [94 total votes]# 3 represents State Representative Jo Carson - Democrat [327 total votes]# 4 represents Total over votes [3 total votes]# 5 represents Total under votes [0 total votes]
1 2 3 4 511 Altus City, Alix, Altus Ru. Denning, Wiederkehr Vil. 67 9 32 0 0
13 Boston, Jethro, Watalula 23 5 23 0 014 Branch - Donald Rural 20 5 28 1 0
15 Cecil, Middle, So. Middle, Oak Bend & Etna 73 6 31 0 016 Charleston Rural& WDS.I,II,III & VESTA 78 26 67 0 0
25 Ivy,Lonelm, Cravens, Fern 36 1 26 0 0

29 Mountain & Philpot 20 6 8 0 031 Ozark Rural & Wallace 72 2 19 0 032 Ozark Wards I, II, III 109 17 43 0 0
Early & Absentee 88 17 50 2 0
Election Statistics
Total number of ballots cast 1007Total number of spoiled ballots 25
Total number of challenged ballots disqualified 2Total number of ballots printed and delivered to the polls 3092
Total number of unused ballots 2058
Johnson County
U.S. Congress District 03 - Democrat
LEGEND# 1 represents State Representative Jo Carson - Democrat [315 total votes]# 2 represents Norman "Bill" Williams, Jr. - Democrat [89 total votes]# 3 represents State Representative Mike Hathorn - Democrat [921 total votes]# 4 represents Total over votes [0 total votes]# 5 represents Total under votes [0 total votes]
1 2 3 4 5Early & Absentee 66 18 183 0 0
01 Batson 3 1 3 0 005 Hickey 5 0 17 0 0
07 Horsehead 4 0 20 0 012 Lee 3 3 3 0 0
14 McKennon 6 0 14 0 021 Prairie 4 2 17 0 0
40 Stonewall 2 2 20 0 043 Spadra Ward 1 52 22 158 0 044 Spadra Ward 2 33 6 94 0 0

45 Spadra Ward 3 42 12 113 0 046 Spadra Ward 4 14 4 48 0 0
48 Grant 12 2 49 0 049 Howell 11 2 23 0 050 King 7 3 27 0 051 Perry 8 1 22 0 0
52 Pitt. 3 & 56 Pitt. 7 14 6 36 0 054 Redlick 7 1 33 0 055 Ward 13 4 22 0 0
Lowgap/Sherman 4 0 7 0 058 Dickerson/Hill Mulberry 5 0 12 0 0
Overseas Absentees 0 0 0 0 0
Election Statistics
Total number of ballots cast 1325Total number of spoiled ballots 0
Total number of challenged ballots disqualified 0Total number of ballots printed and delivered to the polls 6500
Total number of unused ballots 5175
Logan County
U.S. Congress District 03 - Democrat
LEGEND# 1 represents State Representative Jo Carson - Democrat [346 total votes]# 2 represents State Representative Mike Hathorn - Democrat [876 total votes]# 3 represents Norman "Bill" Williams, Jr. - Democrat [44 total votes]# 4 represents Total over votes [0 total votes]# 5 represents Total under votes [0 total votes]
1 2 3 4 5Absentee & Early 16 50 1 0 0100 Cane Creek 7 24 5 0 0

101 Clark Crossroads 6 15 2 0 0102 Clark Subiaco City & Rural 18 43 0 0 0
104 Delaware 3 15 0 0 0105 Driggs 4 16 1 0 0
106 Ellsworth 4 18 1 0 0107 Johnson 4 4 0 0 0108 Logan 5 21 0 0 0
109 Mountain 3 14 0 0 0110 River City & Rural 18 46 3 0 0
112 Roseville 3 2 0 0 0113 Shoal Creek 15 31 5 0 0
114 Sht Mtn Wd 1 25 64 1 0 0115 Sht Mtn Wd 2 19 43 0 0 0116 Sht Mtn Wd 3 13 44 1 0 0117 Sht Mtn Wd 4 18 46 0 0 0
132 Blue Mountain City & Rural 0 7 0 0 0139 Petit Jean 5 20 3 0 0
140 Reveille City & Rural 20 64 4 0 0118 Caulksville City & Rural 2 44 0 0 0
119 Ratcliff City & Rural 10 23 3 0 0134 Boone Wd 1 16 33 1 0 0135 Boone Wd 2 22 42 2 0 0136 Boone Wd 3 23 42 2 0 0137 Boone Wd 4 23 32 4 0 0138 Cauthron 5 10 2 0 0
144 Sugar Creek 10 10 0 0 0145 Washburn 10 14 1 0 0
146 Barber 8 20 1 0 0147 Tomlinson 11 19 1 0 0
Overseas Absentee 0 0 0 0 0
Election Statistics
Total number of ballots castTotal number of spoiled ballots
Total number of challenged ballots disqualifiedTotal number of ballots printed and delivered to the polls
Total number of unused ballots
Madison County
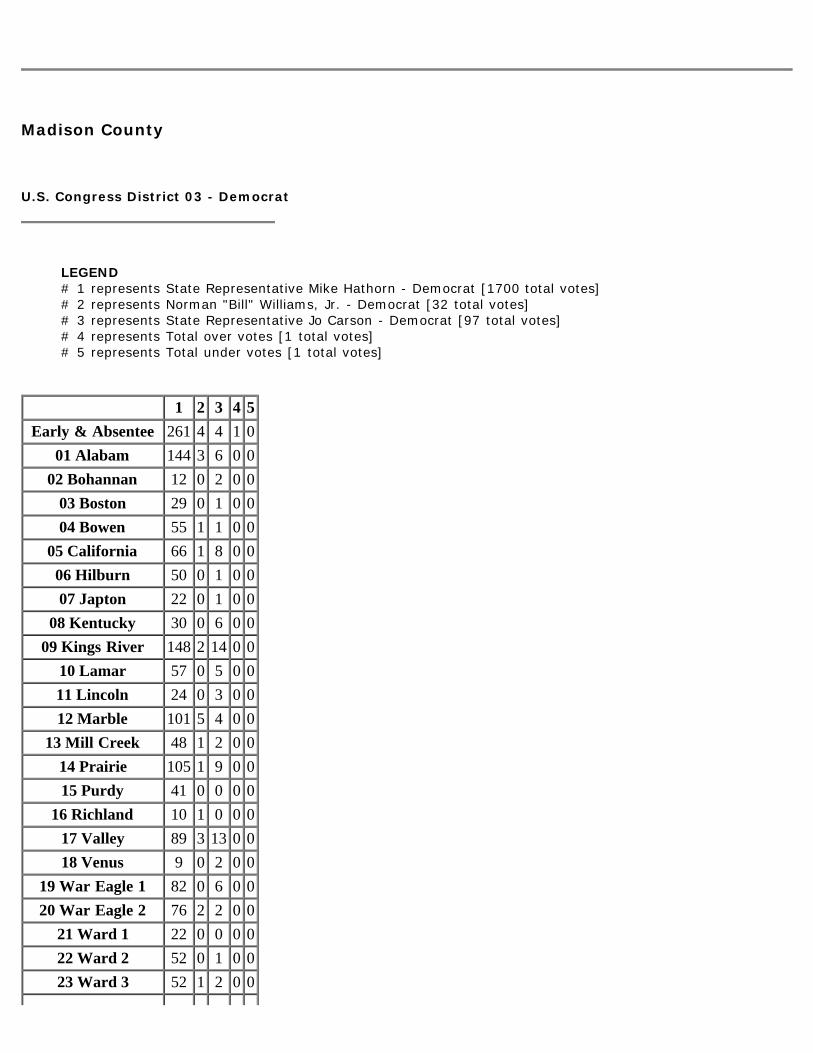
U.S. Congress District 03 - Democrat
LEGEND# 1 represents State Representative Mike Hathorn - Democrat [1700 total votes]# 2 represents Norman "Bill" Williams, Jr. - Democrat [32 total votes]# 3 represents State Representative Jo Carson - Democrat [97 total votes]# 4 represents Total over votes [1 total votes]# 5 represents Total under votes [1 total votes]
1 2 3 4 5Early & Absentee 261 4 4 1 0
01 Alabam 144 3 6 0 002 Bohannan 12 0 2 0 0
03 Boston 29 0 1 0 004 Bowen 55 1 1 0 0
05 California 66 1 8 0 006 Hilburn 50 0 1 0 007 Japton 22 0 1 0 0
08 Kentucky 30 0 6 0 009 Kings River 148 2 14 0 0
10 Lamar 57 0 5 0 011 Lincoln 24 0 3 0 012 Marble 101 5 4 0 0
13 Mill Creek 48 1 2 0 014 Prairie 105 1 9 0 015 Purdy 41 0 0 0 0
16 Richland 10 1 0 0 017 Valley 89 3 13 0 018 Venus 9 0 2 0 0
19 War Eagle 1 82 0 6 0 020 War Eagle 2 76 2 2 0 0
21 Ward 1 22 0 0 0 022 Ward 2 52 0 1 0 023 Ward 3 52 1 2 0 0

24 Ward 4 51 0 2 0 125 Wharton 43 5 1 0 0
26 White River 21 2 1 0 0Overseas Absentees 0 0 0 0 0
Election Statistics
Total number of ballots cast 1834Total number of spoiled ballots 2
Total number of challenged ballots disqualified 0Total number of ballots printed and delivered to the polls 6200
Total number of unused ballots 4364
Marion County
U.S. Congress District 03 - Democrat
LEGEND# 1 represents State Representative Jo Carson - Democrat [92 total votes]# 2 represents Norman "Bill" Williams, Jr. - Democrat [41 total votes]# 3 represents State Representative Mike Hathorn - Democrat [290 total votes]# 4 represents Total over votes [0 total votes]# 5 represents Total under votes [0 total votes]
1 2 3 4 5Absentee and Early Voting 3 3 48 0 0
American Legion Hut, Yellville 8 2 22 0 0Bruno Fire House 6 0 22 0 0
Bull Shoals Community Bldg 9 4 19 0 0Eros School 2 0 8 0 0
Fairview Fire House 1 1 5 0 0Flippin City Hall 10 4 17 0 0
Flippin School 4 1 16 0 0Lakeway Fire House 10 4 9 0 0Lazy Acres Fire Dept 3 2 1 0 0

Oakland Community Bldg 4 0 4 0 0Peel Fire House 9 6 12 0 0
Promiseland Bible Church 3 0 1 0 0Pyatt Community Bldg 7 1 17 0 0
Ralph Fire House 2 5 41 0 0Rea Valley Fire House 2 1 16 0 0Yellville Nursing Home 9 7 32 0 0
Election Statistics
Total number of ballots cast 424Total number of spoiled ballots 3
Total number of challenged ballots disqualified 0Total number of ballots printed and delivered to the polls 500
Total number of unused ballots 443
Newton County
U.S. Congress District 03 - Democrat
LEGEND# 1 represents State Representative Mike Hathorn - Democrat [649 total votes]# 2 represents Norman "Bill" Williams, Jr. - Democrat [4 total votes]# 3 represents State Representative Jo Carson - Democrat [16 total votes]# 4 represents Total over votes [0 total votes]# 5 represents Total under votes [0 total votes]
1 2 3 4 501 Big Creek 37 0 0 0 0
02 Boston 6 0 2 0 004 Dogpatch 10 0 1 0 0
05 Grove/Hasty/Prairie 32 0 0 0 007 Hickory Grove 9 0 2 0 0
08 Hudson 32 0 0 0 009 Jackson 113 0 0 0 0

10 Jefferson & Walnut 22 0 2 0 011 Richland 29 0 0 0 013 Lincoln 28 0 0 0 0
14 Low Gap 35 0 2 0 016 Murray 22 0 1 0 0
22 Polk 19 1 2 0 023 Ponca 14 0 0 0 0
24 Pleasant Hll 56 2 0 0 028 Plumlee/Osage 20 1 2 0 0
29 Van Buren & Kentucky 17 0 0 0 030 White 35 0 0 0 0
Early & Absentee 113 0 2 0 0Overseas Absentees 0 0 0 0 0
Election Statistics
Total number of ballots castTotal number of spoiled ballots
Total number of challenged ballots disqualifiedTotal number of ballots printed and delivered to the polls
Total number of unused ballots
Polk County
U.S. Congress District 03 - Democrat
LEGEND# 1 represents Norman "Bill" Williams, Jr. - Democrat [53 total votes]# 2 represents State Representative Jo Carson - Democrat [237 total votes]# 3 represents State Representative Mike Hathorn - Democrat [407 total votes]# 4 represents Total over votes [6 total votes]# 5 represents Total under votes [7 total votes]
1 2 3 4 5Early 6 27 48 1 2

Absentee 0 0 0 0 001-JP#1 7 22 51 1 002 - JP#2 2 24 28 0 003 - JP#3 3 34 43 0 2
04 - Acorn 3 16 35 0 005 - Ink 4 0 5 0 0
06 - Board Camp 1 13 26 0 107 - Cherry Hill 1 13 12 1 0
08 - Big Fork 0 5 8 1 009 - Shady 0 3 8 0 0
10 - Shady Grove 0 19 17 0 111- Rocky 3 1 6 0 112 - Potter 5 12 18 0 0
13 - Alder Springs 3 3 10 0 014 - Hatfield 3 12 29 0 0
15 - Cove 4 15 26 2 016 - Vandervoort 3 7 12 0 0
17 - Wickes 3 9 19 0 018 - Grannis 2 2 6 0 0
Overseas Absentees 0 0 0 0 0
Election Statistics
Total number of ballots cast 710Total number of spoiled ballots 2
Total number of challenged ballots disqualified 0Total number of ballots printed and delivered to the polls 5835
Total number of unused ballots 5123
Pope County
U.S. Congress District 03 - Democrat
LEGEND

# 1 represents Norman "Bill" Williams, Jr. - Democrat [112 total votes]# 2 represents State Representative Jo Carson - Democrat [286 total votes]# 3 represents State Representative Mike Hathorn - Democrat [829 total votes]# 4 represents Total over votes [6 total votes]# 5 represents Total under votes [10 total votes]
1 2 3 4 501 Bayliss 3 8 12 0 002 Burnett 0 3 7 0 003 Center 6 2 13 0 0
04 Clark In & Clark Out 7 20 34 0 005 Convenience 2 7 10 0 0
06 Dover In & Dover Out 6 22 79 0 007 Freeman & Martin 2 7 26 0 0
08 Galla 1-2-3 & Galla Out 5 13 30 0 009 Griffin 2 4 28 0 010 Gumlog 0 3 9 0 1
11 ILL Box 1- 2L & Norristown 9 22 58 2 012 ILL Box 2-2A,3G,3H,2M,SOE,NOE,NOWE,NOWW 7 15 38 0 0
13 ILL Box 3- 3A,3B,3C 6 8 32 0 314 ILL Box 4-2G,2I,2J,2K,3D,3E,3F 3 21 60 0 0
15 ILL Box 5- 2B,2C,2D,2E,2F 19 20 90 0 016 ILL Box 6- 1B,1C,1D,1G,1H,1I,1J 3 15 29 0 1
17 Jackson In & Jackson Out 2 5 23 0 018 Liberty 3 5 14 0 0
19 Moreland 1 1 17 0 020 Phoenix 2 3 4 0 021 Smyrna 0 1 14 0 0
22 Valley North &Valley South 1 7 15 0 023 Valley 2 2 3 20 0 0
24 Wilson 1-2-3 - Wilson Out E & Wilson Out W 6 37 53 0 0Absentee 0 1 5 0 5
Early 15 33 109 4 0
Election Statistics
Total number of ballots cast 1235Total number of spoiled ballots 0
Total number of challenged ballots disqualified 5Total number of ballots printed and delivered to the polls 7500

Total number of unused ballots 6260
Scott County
U.S. Congress District 03 - Democrat
LEGEND# 1 represents State Representative Jo Carson - Democrat [247 total votes]# 2 represents State Representative Mike Hathorn - Democrat [400 total votes]# 3 represents Norman "Bill" Williams, Jr. - Democrat [58 total votes]# 4 represents Total over votes [0 total votes]# 5 represents Total under votes [0 total votes]
1 2 3 4 501 Blackfork 4 4 2 0 002 Blansett 4 3 3 0 003 Brawley 4 8 2 0 0
04 Cauthron/Oliver 2 12 1 0 005 Cedar Creek 11 7 0 0 0
07 Denton 1/Denton 2 6 5 0 0 008 Hickman Rural West 9 13 4 0 009 Hickman Rural East 11 17 3 0 0
10 Hickman Ward 1 17 32 8 0 011 Hickman Ward 2 15 11 2 0 012 Hickman Ward 3 21 45 5 0 0
13 Hon 7 10 1 0 014 Hunt 4 15 0 0 015 James 1 7 4 0 0
16 Jones/Little Texas 5 8 1 0 017 Keener 4 16 0 0 018 LaFave 6 16 1 0 020 Lamb 5 21 3 0 0
21 Lewis 1 22 20 0 0 022 Lewis 2 8 6 0 0 0
23 Mill Creek 9 6 5 0 024 Mountain 7 16 2 0 0

25 Mt. Pleasant 7 8 1 0 026 Parks 14 11 5 0 0
Coal & Lafayette 5 12 0 0 0Early & Absentee 31 62 4 0 0
Overseas Absentees 0 0 0 0 0Tate & Tomlinson 8 9 1 0 0
Election Statistics
Total number of ballots cast 705Total number of spoiled ballots 0
Total number of challenged ballots disqualified 0Total number of ballots printed and delivered to the polls 4000
Total number of unused ballots 3295
Sebastian County
U.S. Congress District 03 - Democrat
LEGEND# 1 represents State Representative Jo Carson - Democrat [4224 total votes]# 2 represents State Representative Mike Hathorn - Democrat [601 total votes]# 3 represents Norman "Bill" Williams, Jr. - Democrat [190 total votes]# 4 represents Total over votes [0 total votes]# 5 represents Total under votes [3 total votes]
1 2 3 4 51-A, 1-B 67 3 3 0 01-C, 1-D 80 6 0 0 0
1-E, 2-G, 2-H 53 12 0 0 01-F, 1-G 128 13 2 0 01-H, 1-I 110 8 2 0 01-J, 1-K 42 2 0 0 0
1-L 57 6 0 0 01-M, 1-N, 4-B, 4-I 230 23 11 0 0

1-O, 1-P, 4-E 216 17 7 0 02-A, 2-B 109 9 8 0 02-C, 2-I 85 14 3 0 02-D, 2-E 170 18 5 0 0
2-F 60 3 1 0 03-A, 3-B 53 6 2 0 03-C, 3-D 138 13 8 0 0
3-E 113 6 9 0 03-F, 4-A 74 10 5 0 0
3-G, 3-K, 9-L 99 11 2 0 03-H 95 9 9 0 03-I 173 21 3 0 0
3-L, 3-O, 9-M, 9-N 89 22 7 0 04-C, 4-D 125 9 4 0 0
4-F 230 19 5 0 04-G 59 7 4 0 04-H 106 10 2 0 04-J 24 5 1 0 0
4-M 128 4 6 0 09-A 33 7 4 0 19-B 21 7 2 0 0
9-C, 9-C1 65 23 5 0 09-D 39 9 4 0 0
9-E, 9-E2, 9-E3 115 33 9 0 09-E1 21 6 0 0 0
9-F, 9-F1 37 13 2 0 09-G 28 8 2 0 0
9-H, 9-H1 31 16 0 0 09-I1, 9-I2 32 21 6 0 0
9-J 9 6 0 0 09-K, 9-K1 22 6 2 0 0
9-N1, 9-N2, 9-N3, 9-N4 20 13 0 0 09-O 29 4 0 0 0
9-P1, 9-P3 45 5 6 0 09-P2, 9-P4 43 17 2 0 0
9-Q 16 12 0 0 09-R 41 2 4 0 0
9-S, 9-S1 27 15 2 0 09-T 18 0 1 0 09-U 23 4 0 0 0

9-V1, 9-V2, 9-V3 25 5 0 0 0Absentee Ft. Smith 111 11 12 0 0
Absentee Greenwood 16 4 2 0 1Early Ft. Smith 308 31 9 0 0
Early Greenwood 136 37 7 0 1Overseas Absentees 0 0 0 0 0
Election Statistics
Total number of ballots cast 5018Total number of spoiled ballots 14
Total number of challenged ballots disqualified 0Total number of ballots printed and delivered to the polls 30000
Total number of unused ballots 24982
Washington County
U.S. Congress District 03 - Democrat
LEGEND# 1 represents Norman "Bill" Williams, Jr. - Democrat [257 total votes]# 2 represents State Representative Jo Carson - Democrat [2994 total votes]# 3 represents State Representative Mike Hathorn - Democrat [2509 total votes]# 4 represents Total over votes [30 total votes]# 5 represents Total under votes [1 total votes]
1 2 3 4 5Absentee 1 8 26 0 0Boston 0 4 8 0 0
Boston-S 0 0 0 0 0Brush Creek 4 16 44 0 0
Cane Hill 0 28 19 0 0Center North 7 36 25 1 0
Center North - S&H 0 7 6 0 0Center South 0 1 1 0 0

Center South - H 1 0 3 1 0Cove Creek 1 16 18 0 0
Cove Creek - S 0 0 0 0 0Crawford 1 8 10 2 0
Crawford - S 0 0 1 0 0Durham 0 6 14 1 0
Durham - H 1 1 1 0 0Dutch Mills 0 0 4 0 0
Dutch Mills - S 0 1 1 0 0Early 21 270 267 2 1Elkins 1 19 29 0 0
Elm Springs City 3 13 23 0 0Elm Springs Township 1 8 7 0 0
Farmington 11 45 47 0 0Fayetteville P-01 1 45 22 0 0Fayetteville P-02 9 79 34 0 0Fayetteville P-03 10 81 54 1 0Fayetteville P-04 5 59 37 0 0Fayetteville P-05 6 101 34 0 0Fayetteville P-06 10 148 93 1 0Fayetteville P-07 2 124 60 0 0Fayetteville P-08 6 95 35 0 0Fayetteville P-09 0 9 5 0 0Fayetteville P-10 4 65 37 3 0Fayetteville P-11 1 6 10 0 0Fayetteville P-12 1 56 37 0 0Fayetteville P-13 0 7 7 0 0Fayetteville P-14 1 22 15 0 0Fayetteville P-15 0 0 1 0 0Fayetteville P-16 0 2 2 0 0Fayetteville P-17 7 78 54 1 0Fayetteville P-18 5 107 42 0 0Fayetteville P-19 1 50 24 0 0Fayetteville P-20 2 34 17 0 0Fayetteville P-21 1 7 6 0 0Fayetteville P-22 3 23 20 0 0Fayetteville P-23 0 23 12 0 0Fayetteville P-24 0 0 0 0 0Fayetteville P-25 2 84 24 0 0Fayetteville P-26 0 0 6 0 0

Fayetteville P-27 0 0 0 0 0Fayetteville P-28 1 47 27 1 0Fayetteville P-29 0 6 2 0 0Fayetteville P-30 5 18 12 0 0Fayetteville P-31 2 6 6 0 0Fayetteville P-32 0 3 1 0 0Fayetteville P-33 1 6 8 0 0Fayetteville P-34 1 30 23 0 0Fayetteville P-35 1 33 12 0 0Fayetteville P-36 0 7 2 0 0
Goshen City 2 8 13 0 0Goshen Township 0 3 6 0 0
Goshen Township - H 0 3 9 0 0Goshen Township - S 0 2 0 0 0
Greenland city 6 19 14 1 0Greenland Township 2 19 6 0 0
Harmon 0 16 16 0 0Illinois 2 13 6 0 0
Illinois - S 0 2 0 0 0Johnson City 1 31 17 0 0
Johnson Township 3 9 7 0 0Lees Creek 2 10 8 0 0
Lincoln 5 33 38 0 0Litteral 5 17 20 1 0
Marrs Hill 3 24 11 0 0Marrs Hill - S&H 0 2 1 0 0
Morrow 0 3 3 0 0Morrow - S 0 2 2 0 0
Overseas Absentees 0 0 0 0 0Prairie Grove City 9 56 70 2 0
Prairie Grove Township 1 18 8 0 0Prairie Grove TWP - S&H 0 0 0 0 0
Prairie Township 1 3 66 52 0 0Prairie Township 2 0 16 15 0 0Prairie Township 3 0 1 0 0 0Prairie Township 4 1 14 3 0 0
Price 1 11 3 0 0Price - H 0 0 0 0 0
Reed 0 6 13 1 0Reed - H 0 0 0 0 0
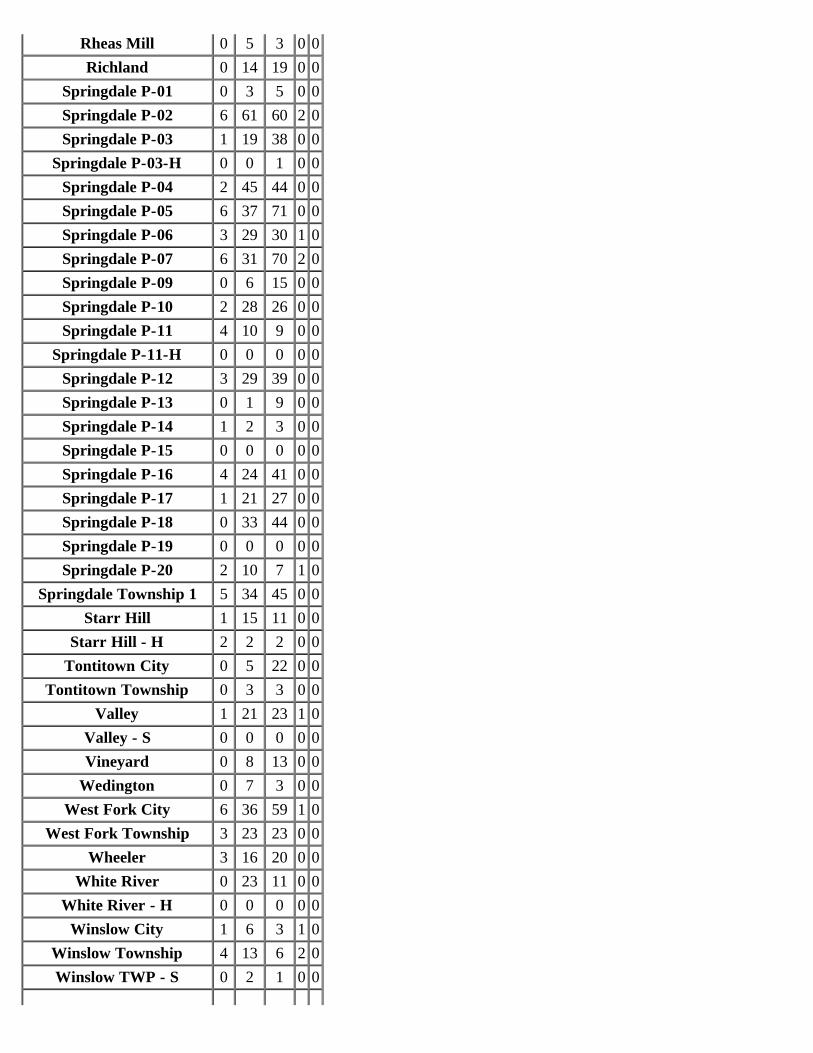
Rheas Mill 0 5 3 0 0Richland 0 14 19 0 0
Springdale P-01 0 3 5 0 0Springdale P-02 6 61 60 2 0Springdale P-03 1 19 38 0 0
Springdale P-03-H 0 0 1 0 0Springdale P-04 2 45 44 0 0Springdale P-05 6 37 71 0 0Springdale P-06 3 29 30 1 0Springdale P-07 6 31 70 2 0Springdale P-09 0 6 15 0 0Springdale P-10 2 28 26 0 0Springdale P-11 4 10 9 0 0
Springdale P-11-H 0 0 0 0 0Springdale P-12 3 29 39 0 0Springdale P-13 0 1 9 0 0Springdale P-14 1 2 3 0 0Springdale P-15 0 0 0 0 0Springdale P-16 4 24 41 0 0Springdale P-17 1 21 27 0 0Springdale P-18 0 33 44 0 0Springdale P-19 0 0 0 0 0Springdale P-20 2 10 7 1 0
Springdale Township 1 5 34 45 0 0Starr Hill 1 15 11 0 0
Starr Hill - H 2 2 2 0 0Tontitown City 0 5 22 0 0
Tontitown Township 0 3 3 0 0Valley 1 21 23 1 0
Valley - S 0 0 0 0 0Vineyard 0 8 13 0 0
Wedington 0 7 3 0 0West Fork City 6 36 59 1 0
West Fork Township 3 23 23 0 0Wheeler 3 16 20 0 0
White River 0 23 11 0 0White River - H 0 0 0 0 0
Winslow City 1 6 3 1 0Winslow Township 4 13 6 2 0Winslow TWP - S 0 2 1 0 0

Wyman 3 20 26 0 0Wyman - S 0 0 1 0 0
Election Statistics
Total number of ballots cast 5791Total number of spoiled ballots 22
Total number of challenged ballots disqualified 0Total number of ballots printed and delivered to the polls 16685
Total number of unused ballots 10872