2001 fraser institute critical issues
TRANSCRIPT

CRITICAL2001 FRASER INSTITUTE
bulletinISSUES
Flat TaxPrinciples and Issues
Joel Emes and Jason Clemenswith Patrick Basham and Dexter Samida

FRASER INSTITUTE CRITICAL ISSUES BULLETIN
Critical Issues Bulletins
Critical Issues Bulletins are published from time to time byThe Fraser Institute (Vancouver, British Columbia, Canada)as supplements to Fraser Forum, the Institute’s monthly pe-riodical. Critical Issues Bulletins are comprehensive stud-ies of single issues of critical importance for public policy.
The authors have worked independently and opinions ex-pressed by them are, therefore, their own, and do not nec-essarily reflect the opinions of the members or thetrustees of The Fraser Institute.
To order additional copies of Critical Issues Bulletins, any ofour other publications, or a catalogue of the Institute’spublications, please contact the book sales coordinator:via our toll-free order line: 1.800.665.3558, ext. 580via telephone: 604.688.0221, ext. 580via fax: 604.688.8539via e-mail: [email protected].
For media enquires, please contact Suzanne Walters, Director of Communications:via telephone: 604.714.4582 or, from Toronto, 416.363.6575, ext. 582
via e-mail: [email protected]
To learn more about the Institute, please visit our web siteat www.fraserinstitute.ca.
Copyright© 2001 by The Fraser InstituteDate of Issue: April 2001
Printed in Canada
Canadian Publications Mail Sales Product Agreement #0087246
ISSN 1480-3666
Editing and design: Kristin McCahon and Lindsey Thomas Martin
The Fraser Institute
The Fraser Institute is an independent Canadian economicand social research and educational organization. It has asits objective the redirection of public attention to the roleof competitive markets in providing for the well-being ofCanadians. Where markets work, the Institute’s interestlies in trying to discover prospects for improvement.Where markets do not work, its interest lies in finding thereasons. Where competitive markets have been replacedby government control, the interest of the Institute lies indocumenting objectively the nature of the improvement ordeterioration resulting from government intervention. Thework of the Institute is assisted by an Editorial AdvisoryBoard of internationally renowned economists. The FraserInstitute is a national, federally chartered, non-profit orga-nization financed by the sale of its publications and the tax-deductible contributions of its members, foundations, andother supporters; it receives no government funding.
For information about membership in The Fraser Institute,please contact the Development Department via mail to: The Fraser Institute, 4th Floor,
1770 Burrard Street, Vancouver, BC, V6J 3G7via telephone: 604.688.0221 ext. 586via fax: 604.688.8539via e-mail: [email protected].
In Calgary, please contact us via telephone: 403.216.7175via fax: 403.234.9010via e-mail: [email protected].
In Toronto, please contact us via telephone: 416.363.6575via fax: 416.601.7322.
The work of The Fraser Institute is assisted by an Editorial Advisory Board that includes:
Prof. Armen Alchian, Prof. Jean-Pierre Centi, Professor Herbert G. GrubelProf. Friedrich Schneider, Sir Alan Walters, Prof. J.M. Buchanan, Prof. Michael Parkin, Prof. L.B. Smith, and Prof. Edwin G. West.

The Fraser Institute Flat Tax 1
ContentsAbout the authors / 2
Acknowledgments / 3
Executive summary / 4
Introduction / 8Flat tax versus single-rate tax / 8Outline of the study / 8
1 Average taxes, marginal taxes and progressivity / 10Marginal and average taxes / 10Progressivity / 12Conclusion / 14
2 Hall-Rabushka flat-tax reform / 15Differentiating the flat tax from the single-rate tax / 15Conclusion / 17
3 The flat-tax applied: nine cases / 18Methodology / 19Case 1 / 20Case 2 / 24Case 3 / 27Case 4 / 30Case 5 / 33Case 6 / 36Case 7 / 39Case 8 / 42Case 9 / 45
4 Income dynamics and mobility / 48Nature of income mobility / 48Life-cycle analysis / 50Other considerations / 52Conclusion / 52
5 International evidence / 53Hong Kong / 53The Channel Islands / 54Conclusion / 55
Notes / 56
References / 58

2 Critical Issues Bulletin The Fraser Institute
About the authors
PATRICK BASHAM is a Senior Fellow at The Cato Institute in Washington, DC. Formerly Director of the Social Affairs Centreat The Fraser Institute, he has written and edited books, studies, papers, and articles on a variety of policy topics forboth general and academic audiences. Following Bachelor’s and Master’s degrees from Carleton University and the Uni-versity of Houston, respectively, he completed a doctoral dissertation in Political Science and shortly will receive hisPh.D. from Cambridge University.
JASON CLEMENS is the Director of Fiscal and Non-Profit Studies and co-ordinator of the Survey of Investment Managersfor The Fraser Institute. He has an Honours BA in Commerce and an MA in Business Administration from the Universityof Windsor as well as a post-Baccalaureate Degree in Economics from Simon Fraser University. His publications and co-publications for The Fraser Institute include Canada’s All Government Debt (1996), Bank Mergers: The Rational Consolidationof Banking in Canada (1998), the Non-Profit Performance Report for 1998, 1999, and 2000, The 20% Foreign Property Rule:Decreasing Returns and Increasing Risk for RRSPs and RPPs (1999), and Preserving Independence (1999). His articles have ap-peared in The Wall Street Journal, The National Post, The Globe & Mail, The Vancouver Sun, The Calgary Herald, The WinnipegFree Press, The Ottawa Citizen, The Montreal Gazette, La Presse and other newspapers. Mr. Clemens has been a guest onnumerous radio programs across the country and has appeared on the CBC National News, CBC Business Newsworld, Glo-bal TV, BCTV, and Report on Business TV as an expert commentator and has appeared before committees of both theHouse of Commons and the Senate as an expert witness.
JOEL EMES is a senior research economist at The Fraser Institute. He is a regular contributor to Fraser Forum, the FraserInstitute’s monthly magazine, and co-author of Tax Facts 10, Tax Facts 11, and Canada’s All Government Debt (1996, 1998,and 1999 editions). His articles have appeared in the National Post, Globe and Mail, the Calgary Herald, the Vancouver Sunand the London Free Press. Mr. Emes is also the primary researcher for Tax Freedom Day and the Institute’s Provincialand State-Provincial fiscal comparisons, the Budget Performance Index, and the Fiscal Performance Index. He received hisM.A. in Economics from Simon Fraser University in 1995.
DEXTER SAMIDA majored in economics at the University of Saskatchewan, from which he received his B.Comm. (highhonours) with Great Distinction in 1997. He obtained his M.A. in Economics from the University of Toronto in 1998. Inthe summer of 1997, he worked as an intern at The Fraser Institute, where he did research on taxation in Canada and,from 1998 to 2000, held a position as Research Economist at the Institute. While there, he published A Hand Out Insteadof a Hand Up: Where Foreign Aid Fails (Public Policy Sources 30) and was co-author of Provincial Economic Freedom in Canada1981–1998 (Critical Issues Bulletin) and the 1999 Private Charitable Generosity Index (Public Policy Sources 34). He haswritten articles on economic freedom and poverty, child labour, foreign aid, the environment, international trade, andconsumerism. He has published articles in both national newspapers as well as in regional papers such as the VancouverProvince. Mr Samida, a native of rural Saskatchewan, is currently living and working in South Korea.

The Fraser Institute Flat Tax 3
Acknowledgments
The authors wish to thank Dr. Martin Zelder of The Fraser Institute, Dr. Kenneth McKenzie of the Department of Eco-nomics, University of Calgary, David Perry of the Canadian Tax Foundation, and Brian Murphy of Statistics Canada fortheir comments, suggestions, and criticisms. We would also like to express our appreciation to Liv Fredricksen for herpost-production assistance. The authors, of course, take full and complete responsibility for any remaining errors oromissions and, as they have worked independently, their views do not necessarily represent the views of the trusteesor members of The Fraser Institute.

Executive summary
The issue of tax cuts has overwhelmed the equally im-portant issue of tax reform in the national debate. Fur-ther, any discussion of tax reform during the 2000federal election was riddled with misinformation that ef-fectively prevented an open and rational debate abouttax reform. The study outlines many of the issues raisedduring the recent federal election and provides informa-tion on tax reform in order to provide a foundation forrational debate.
Flat tax versus single-rate tax
It is important to differentiate between reform based ona flat tax and the replacement of multiple tax rates with asingle tax rate. The later constitutes the type of tax re-form implemented in the Province of Alberta in 2001 andproposed by the Canadian Alliance in the 2000 federalelection. The replacement of multiple tax rates with a sin-gle rate is but one step in the process of broad-based flattax reform.
Hall-Rabushka flat-tax reform
There are a number of well-known flat-tax proposals butthe most discussed is that developed by Robert E. Halland Alvin Rabushka of the Hoover Institution. It taxes alltypes of income once and at one rate. In their most recentanalysis of the United States, Hall-Rabushka (1995) rec-ommended replacing the five personal federal rates (15%,28%, 31%, 36%, and 39.6%) and the various business taxrates with a 19 percent federal tax rate for both individu-als and businesses.
SimplicityHall-Rabushka contains no tax credits, deductions, or ex-emptions except for the personal, spousal, and child ex-emptions. In other words, the myriad of tax credits and
4
deductions present in the current system and the atten-dant complicated and time-consuming paperwork areeliminated. Further, flat-tax reform significantly simplifiesthe determination of income, which constitutes much ofthe complexity associated with the current tax system.Hall-Rabushka clearly achieves one of the core criteria oftax policy, namely simplicity.
EquityHall-Rabushka is an integrated approach to taxationwherein both business income and personal income aretaxed once and only once. This type of integrated ap-proach to taxation achieves horizontal equity, the princi-ple that people with similar incomes should bear similartax burdens. The personal exemption ensures vertical eq-uity is achieved; that is, as people earn more, they paymore. Thus, Hall-Rabushka achieves both measures of eq-uity, the second criteria of tax policy.
EfficiencyAnother benefit of Hall-Rabushka is that it effectivelymoves the income-tax system away from taxation of in-come towards taxation of consumption. A consumptiontax is levied on any income that is consumed, i.e., spentrather than saved. Economists generally agree that thetaxation of consumption is one of the most efficient man-ners in which to raise tax revenue.1 The exclusion of sav-ings (investments) under Hall-Rabushka effectively cre-ates a tax system based on taxing consumption ratherthan income2 and, thus, achieves the third of the tax cri-teria, efficiency.
Other gainsThere are a number of other important economic im-provements to be gained by implementing Hall-Rabushka.The net economic effect of the reforms proposed by Hall-Rabushka include improved incentives for work, in-creased entrepreneurial activity, and greater capital for-mation, all leading to a higher level of national output andstandard of living.

The Fraser Institute Flat Tax 5
Progessivity—why we have multiple rates
We have more than one tax rate in the current system toachieve progressivity, the principle that taxpayers shouldpay more income tax as a percentage of their income asthey earn more. This has been achieved, traditionally, us-ing progressively higher income-tax rates applied on pro-gressively higher incomes.
Evidence regarding the negative effects of high andincreasing marginal taxes is strong and growing. For in-stance, Marsden (1983), Koester and Kormendi (1989),Easterly and Rebelo (1993), Mullen and Williams (1996),Becsi (1996), and Engen and Skinner (1996) all concludethat high and increasing marginal tax rates have negativeeffects on rates of economic growth. Further, Carroll,Holtz-Eakin, Rider, and Rosen (1998) found that highermarginal tax rates reduce capital formation, a key ingredi-ent in long-term economic growth. This literature, over-all, concludes that high and increasing marginal tax ratescontribute to lower rates of economic growth, reducedrates of personal income growth, lower rates of capitalformation, aggregate labour supply that is lower than ex-pected, and reduced social welfare. In short, high and in-creasing marginal tax rates reduce economic growth bycreating strong disincentives to hard work, savings, andinvestment.
Progressivity without increasing rates
One of the many benefits associated with a flat tax is thatit is able to achieve progressivity in the tax system—those earning more pay more in taxes as a percentage ofincome—while at the same time eliminating the damag-ing effects of high and increasing marginal tax rates. Thisis achieved by including a personal exemption in the taxsystem. In other words, by allowing individuals to earn acertain amount of money tax-free each year, the systemincorporates progressivity without incurring the cost ofincreasing marginal tax rates.3
Flat-tax case calculations
Nine separate flat taxes scenarios were calculated usingon Statistics Canada’s Social Policy Simulation Databaseand Model (SPSD/M) with 2000 as a base year.4 The flat-tax calculations in table ExSum1 range from a simple sys-tem with no exemptions or deductions to a system withgenerous individual and spousal exemptions, child ex-emptions, full RRSP and RPP exemptions, and charitabledonation deductibility.
As one would expect, the value of the personal ex-emption has an enormous influence on the applicable
Table ExSum1: Flat-tax rates for Canada and the Provinces
Case Personal & Spousal
Exemption
Child Exemption
Change in Revenue Collected1
Deduction for RRSP & RPP2
Deduction for
Charitable Donations2
Federal Flat-Tax
Rate
Average Provincial Flat-Tax
Rate
Ontario Provincial Flat-Tax Rate3
1 $0 $0 $0 12.7 7.0 5.8
2 $7,231 $0 $0 16.7 9.4 7.5
3 $8,766 $0 $0 17.8 10.0 7.9
4 $17,532 $0 $0 26.1 14.8 11.2
5 $8,766 $2,000 $0 18.3 10.3 8.1
6 $8,766 $2,000 $0 3 19.9 11.1 8.8
7 $8,766 $2,000 $0 3 3 20.1 11.2 8.9
8 $11,834 $2,000 –$13.4 3 19.0 12.9 10.0
9 $11,834 $2,000 –$22.3 3 16.5 12.9 10.0
1 Refers to the Federal Government only. Any change in the amount of revenue collected implies an expenditure and tax reduction at the federal level only. Stated in billions of dollars.
2 RRSP/RPP contributions and charitable donations, if present, are treated as they currently exist in the federal tax system.
3 Presented for illustrative purposes only.

6 Critical Issues Bulletin The Fraser Institute
flat-tax rates. The larger the personal exemption, thehigher the required flat-tax rates. There is, therefore, apowerful trade-off between the value of the personal (andspousal) exemption and the applicable flat tax rates.
Five households were also analyzed in order to de-termine the tax effects of the various flat-tax proposalson specific households. The one major trend present ineach of the nine flat-tax cases is the equalization of taxtreatment for households with similar incomes, regard-less of the employment status of the parents. In otherwords, the implementation of any of the nine flat-tax sce-narios presented eliminates the current discriminationfaced by two-parent households in which only one parentworks outside the home relative to other householdswith similar incomes but in which both parents work out-side the home.
Income dynamics and mobility
The main criticism levied against flat taxes is that theydramatically shift the burden of taxation from high-income earners to low-income and middle-income earn-ers. To a certain extent, this shift in the tax burden is in-evitable given the extremely progressive nature of Cana-da’s current tax system. For instance, in 1997, the top 13percent of tax-filers—those earning in excess of $50,000per year—earned 40.7 percent of all the income declaredto Revenue Canada for tax purposes but contributed59 percent of all income taxes paid.
This shifting of the tax burden, however, is exag-gerated by tax analysis based on a single year, an inappro-priate tool for the task. The ability of individuals andhouseholds to move up and down the income spectrumdemands that longer time horizons be incorporated intotax analysis in order to determine the real, long-term ef-fect of tax changes.
A recent Canadian study found that, over a two-year period, 13.8 percent of households moved up onequintile in the income distribution and an additional 3.2percent moved up more than one quintile. Put anotherway, of those households initially in the bottom twoquintiles in 1995, 24 percent found themselves at leastone quintile higher by 1996. This depicts a fairly dynam-ic picture of the ability of Canadians to move up the in-come scale.
The rates of upward income mobility increase sig-nificantly when the analysis is extended to cover a five-year period. Twenty-one percent of households moved up
one quintile in the income distribution over a five-yearperiod and an additional 8.2 percent moved up more thanone income quintile. In other words, a total of 45 percentof those in the bottom two quintiles moved up at leastone quintile over the five-year period of the study.
Research into income mobility in the United King-dom and the United States corroborates the Canadian re-sults. One American study covering a 15-year period from1975 to 1991 concluded that only one-half of one percent(0.05 percent) was in the bottom quintile for every year ofthe study. In fact, only 5.1 percent of those in the bottomquintile in 1975 were still in the bottom quintile in 1991.
Another study, covering the period from 1979 to1998, found that 86 percent of households in the lowestincome bracket moved to a higher grouping over the pe-riod. Similarly, Census Bureau data for the 1980s consis-tently shows roughly 20 percent of the people in thebottom quintile moving up a minimum of one quintilewithin a one-year period. Finally, a 1992 study from theUrban Institute concluded that approximately one-half ofthose in the bottom quintile during the 1967-1976 periodhad moved up by the 1977-1986 period.
Such long-term analyses strongly suggest that indi-viduals would gain under any of the nine flat-tax propos-als presented above as any initial tax increase would morethan be offset by later tax reductions during the individu-al’s peak earning period.
International evidence
Tax systems based on a flat-tax model are not just theo-retical abstractions discussed by tax practitioners. Severalcountries and jurisdictions maintain tax systems based ona flat-tax model. Section 4 presents the flat-tax systemsoperating in Hong Kong and the Channel Islands.
Hong KongHong Kong has a 16-percent flat-rate tax on corporateprofits and a property tax. It does not tax dividends, cap-ital gains, wealth, or gifts. There is also no value-addedtax, general sales tax, or payroll tax.
Hong Kong has a Salaries Tax on all employment in-come. The maximum tax on salaries and wages is a flatrate of 15 percent on gross income, less personal exemp-tions, expenses, and charitable donations. The SalariesTax operates according to a sliding scale. The effectiverates of income tax are: 10.2 percent for a single person;5.7 percent for a single person with two dependent par-

The Fraser Institute Flat Tax 7
ents; 3.5 percent for a married person with no children;1.4 percent for a married person with two children; and0.14 percent for a married person with two children andtwo dependent parents.
In Hong Kong, personal and child allowances are sohigh (including a maximum deduction of 10 percent oftaxable income for charitable donations) that 70 percentof the population pay no income tax at all; a further 28percent of the population pay at below the 15-percent flatrate. Consequently, the 15-percent flat rate is paid by onlythe most affluent two percent of Hong Kong residents.
The Channel IslandsThe tax systems employed in the Channel Islands ofGuernsey and Jersey are quite similar. Both islands em-ploy a 20-percent standard rate of income tax for individ-uals and corporations. Neither island imposes a capitalgains tax, a capital transfer tax, or a withholding tax, andrefrain from taxing bank deposit interest. Nor does eitherGuernsey or Jersey collect a value-added tax.
Although the Channel Islands’ 20-percent standardrate of income tax is very low by international standards,the 20 percent flat tax is reduced further by generous per-sonal allowances and reliefs, which include both singleand married person’s allowances, as well as allowancesfor children and dependent relatives.
Conclusion
The fairest, most efficient, and simplest tax system uponwhich to base reform of the Canadian tax system is a flattax based on the work of Hall-Rabushka. Such a systemwould provide enormous positive incentives for hardwork, savings, and investment. The evidence suggests
that the economic benefits of implementing a flat-tax sys-tem would include greater rates of economic and incomegrowth, higher levels of capital formation and invest-ment, and greater social welfare.
The flat-tax system would not, as many argue itwould, eliminate the principle of progressivity. Rather, aflat-tax system that includes a personal exemption wouldenable Canada to maintain progressivity while by-passingthe costs of high and increasing marginal tax rates.
Viewing such reform over the course of one’s liferather than within a single year shows that nearly all tax-payers would gain from such a reform. In short, a flat-taxsystem of taxation presents enormous economic benefitswith very few economic costs. The Hall-Rabushka flat taxshould be the model upon which Canada begins to dis-cuss and design real tax reform.
Notes
1 For a discussion of the marginal efficiency of differ-ent taxes see Jorgenson and Kun-Young 1991 andKesselman 1997.
2 If RRSP or RPP contributions were included as eligibledeductions from taxable income, then the tax systemwould approach a nearly pure consumption tax.
3 In a technical sense, the average tax rate increases asindividuals earn more while the marginal tax rate re-mains flat, achieving progressivity without incurringincreasing marginal tax rates.
4 The application of a flat tax within the tax cases pre-sented is restricted to personal income due to limi-tations in the SPSD/M. It does not, therefore, includeother major sources of tax revenue such as corpo-rate income.

Introduction
During a period of balanced budgets accompanied by sol-id, if unspectacular, economic growth, public attention isincreasingly turning again to a critical element of macro-economic policy, namely taxation. A growing number ofanalysts and commentators currently advocate reformingthe Canadian tax system. Agreement, however, ceases atthis point as there are a myriad of specific proposals fortweaking, refining, even significantly altering our currentmechanisms for collecting taxes.
This study offers a reassessment of the appropriaterole of taxation in the contemporary Canadian economicenvironment. Consequently, our analysis is more defini-tive, comprehensive, and, most importantly, empiricallyrigorous than other fiscal remedies circulating through-out the Canadian body politic.
The authors of this study contend that the goal oftax policy should be to finance the desired level of govern-ment spending in the least distortionary manner. Unfortu-nately, governments of all political persuasions through-out Western nations have, over the course of the last half-century, implemented interventionist tax policies aimedat influencing the behaviour of individuals, families, andbusinesses. These tax policies distort the economy.
Distortion is created by the tax system through theuse of exemptions, deductions, and tax credits, which ef-fectively increase the costs of certain types of behaviourand decrease the costs of other types of behaviour. Thesetax-based distortions reduce economic efficiency andcomplicate the tax system beyond what is necessary.
In Flat Tax: Principles and Issues, we aim to clarifymany of the issues and principles related to tax reformbased on a flat tax as presented in section 2 and modelledin section 3. The study will examine a number of issues re-lated to these types of tax reform, such as progressivity,marginal and average tax rates, income mobility, and in-ternational experience with the flat tax. In addition, anumber of possible implementations of the flat tax arepresented and analyzed.
This study should be viewed as a first step in thedevelopment of a comprehensive plan for the implemen-tation of a broad-based, integrated flat tax on personal
8
and business income. It discusses the principles and es-tablishes a solid foundation upon which to build futureresearch into the viability of implementing a flat tax.
Flat tax versus single-rate tax
There is a major difference between a reform of the tax sys-tem that would introduce a broad-based, integrated flat taxand the replacement of multiple rates of taxation with a sin-gle tax rate, as planned by the Province of Alberta for 2001and as proposed by the federal Canadian Alliance Party.
Tax reform based on a flat tax involves broad-basedchange wherein all types of income, both personal andbusiness are uniformly taxed once at one rate. In otherwords, every source of income is taxed once and at thesame rate. The introduction of a flat tax also encompass-es the elimination of all or most tax credits, deductions,and exemptions.
Tax reform based on a single-rate tax, on the otherhand, simply involves replacing multiple rates of taxationwith a single rate of tax. The reforms proposed by the Ca-nadian Alliance affect only personal income and thereforeretain differential rates of taxation on different types ofincome. They also retain all of the tax credits, exemp-tions, and deductions contained in the current system.The single-rate tax base is, therefore, less broad than aflat-tax base.
Outline of the study
The study contains five main sections that are complemen-tary although not dependent upon one another. That is,each section can be read and understood independently ofthe other sections. Section 1 describes the basic differenc-es between average and marginal rates of tax, explains theprinciple of progressivity and how it can be achieved witha flat tax or a single-rate tax, and summarizes the economicresearch on the negative effects of high and increasing mar-ginal tax rates. It clarifies many of the issues that inevitably

The Fraser Institute Flat Tax 9
arise when discussing tax reform in general and particularlytax reform based on either a flat tax or single-rate tax.
Section 2 summarizes one of the earliest and mostprominent American proposals of a flat tax. ProfessorsRobert E. Hall and Alvin Rabushka of the Hoover Institu-tion were two of the earliest scholars formally to presentplans for broad-based tax reform founded on the princi-ples of a flat tax. Although the analysis studies tax reformin the United States, the principles that underlie the pro-posal are equally applicable to Canada.
Section 3 presents the results of a taxation modelcreated by the authors based on Statistics Canada’s SocialPolicy Simulation Database and Model (SPSD/M); it ishighly quantitative in nature. The section presents ninepossible cases ranging from a basic flat tax with no ex-emptions or tax credits to a flat tax with a personal ex-emption, an exemption of $2,000 per child, a deductionfor RRSP/RPP contributions, and a deduction for charita-ble donations.
Two cases are also presented that combine a flattax with reductions in taxes and expenditures implement-ed at the federal level. The section is meant to presentpossible options for the implementation of a flat tax andto illustrate the trade-offs, tax rates, and distribution oftaxation given the particulars of each case.
It should be noted that Section 3 only investigatesthe effect of tax changes on personal income. Due to the
design of the SPSD/M and related technical complexities,the flat-tax cases presented in this section, like the single-rate tax enacted in Alberta and proposed by the CanadianAlliance, do not include reform of business taxes. None-theless, the cases in this section provide an importantstep forward in the discussion of the possibilities avail-able for tax reform and the various trade-offs present inthe reform process.
Section 4 places the issue of tax reform based on aflat tax in the context of a lifetime tax liability analysis.That is, it explains why and how we should think abouttax liabilities in terms of an individual’s life rather than inthe context of a particular year. The section demonstrateshow specific tax reforms are affected by age and the life-time pattern of earnings. The section further highlightsthe highly transitory nature of income and the flawspresent in much of the tax analysis that are based on sin-gle-year analyses.
Finally, Section 5 discusses the flat tax as presentlyused by Hong Kong and the Channel Islands. The sectionis presented to establish that the flat tax is a viable possi-bility that is already in use and not some theoretical con-struct that has yet to be concretely tested.
It is our hope that this study will establish a foun-dation for a rational discussion of tax reform based on aflat tax as well as creating a platform from which to under-take further research.

1 Average taxes, marginal taxes and progressivity
Section 1 of the study explains differences between aver-age and marginal tax rates, shows how progressivity canbe achieved with a flat tax (the analysis is equally applica-ble to a single-rate tax systems), and describes the nega-tive effects of high and increasing marginal tax rates.
Marginal and average taxes
The terms “marginal tax rate” and “average tax rate” areoften confused in discussions of tax policy. The averagetax rate for an individual, family, or business is simply thetotal amount of taxes paid relative to the total amount ofincome earned. For instance, the average tax rate for anindividual who earned $40,000 and paid $10,000 in taxeswould be 25%.
Marginal tax rates, as the name indicates, apply atthe margin. That is, marginal tax rates are relevant on anincremental basis. In other words, the marginal tax rate isthe rate that applies to the next dollar of income earned.For example, if an individual who earned $40,000 receiveda raise of $5,000, raising her income to $45,000, the taxrate applicable to the last dollar of the raise of $5,000would be the marginal tax rate. If $2,000 of the $5,000raise were taxed away, the marginal tax rate would be 40%.
Illustrated exampleLet us assume, for illustrative purposes, that only the four2000 federal statutory rates (0%, 17%, 25%, and 29%)1 of in-come tax exist, that the personal exemption ($7,231) alsoexists and that no deductions from income are permitted.Table 1 summarizes the 2000 income brackets withinwhich each rate applies.
Let us further assume that an individual currentlyearns $30,004. The individual would pay $3,871 in federalincome tax given his income.2 This represents an averagetax rate of 12.9%. Recall that average taxes are simply theratio of taxes paid ($3,871) to total income ($30,004).
Let us now assume that the individual receives araise of $1,000. His income would, therefore, increase to
1
$31,004. We are interested in the marginal rate of taxa-tion faced by the individual given his raise. Recall thatmarginal taxes are applied at the margin, that is, on addi-tional income.
The additional income gained from the raise willplace the individual in a higher tax bracket. He will nowface a tax rate of 25% on the income above $30,004. Inother words, his current marginal tax rate is 25%; his mar-ginal tax rate will remain at 25% until his income exceeds$60,009, when the next tax rate will apply. This individualwill, therefore, pay $250 in federal income tax on his raiserather than $170, which he would have been assessed us-ing the lower tax rate. The individual has, therefore in-curred an additional tax liability of $80 due to the higherrate of taxation.
The individual’s average tax rate would alsochange. The individual’s total tax bill for the year wouldnow be $4,121, an average federal tax rate of 13.3%.
It is important to distinguish these two concepts oftaxation. Average tax rates, on the one hand, representthe total tax burden on individuals, families, and busi-nesses relative to their total income. Marginal tax rates,on the other hand, indicate the rate of income tax paid onmarginal or incremental income.
Influence of high and increasing marginal tax ratesWhen deciding whether to work an additional hour, to in-crease one’s human capital through education, or to in-
Table 1: Federal statutory rates (2000)
Source: The Budget Plan 2000, Department of Finance, 2000.
* Rate reduction to 23% will be fully implemented by 2001.
Tax Rate Income Level
No Tax (0%) $0 – $7,231
17% $7,232 – $30,004
25%* $30,005 – $60,009
29% $60,010 – and above
0

The Fraser Institute Flat Tax 11
vest one’s savings, the tax rate most important to anindividual or business is the marginal tax rate. It mattersmost because it directly affects the proportion of in-creased income that can be kept. The higher the marginaltax rate, the lower the return to productive activity and,thus, the lower the level of incentives for the individual,family, or business.
The folly of demanding higher and higher marginaltax rates for those in the upper income brackets is thatthis effectively provides disincentives for the most pro-ductive members of society to be productive. In so muchas this reduces economic growth that benefits all mem-bers of society, increases in tax rates can eventually resultin each of us being worse off than we might otherwisehave been, even if our own marginal tax rate is much low-er than that of the wealthiest individuals.
Marginal tax rates and maximizing social welfareA particularly interesting study of the connection be-tween social welfare and marginal tax rates is found inGruber and Saez (2000). In this paper, the authors deriveoptimal tax rates based on different assumptions of howthe government values3 the incomes of citizens in differ-ent tax brackets and the responsiveness of individuals inthese different brackets to increases in their marginal taxrate. The task for the government is to raise the revenuenecessary for its functioning (provision of goods and ser-vices, income redistribution, and debt servicing) whilemaximizing social welfare, given how individual behav-iour will change as tax rates are modified.
Gruber and Saez present a number of different sit-uations, including an example where the government val-ues revenue from each income bracket equally, one wherethe government does not value the income of the topbracket at all (labelled “progressive”), and one where al-most everyone is treated equally, except for the very poor,whose welfare the government is more concerned about.Their finding is that for each of these cases the optimalstructure of marginal tax rates should be declining as youmove up from lower to higher income brackets ratherthan increasing. In other words, the marginal rates of tax-ation should be decreasing not increasing as one’s in-come increases.
This result holds even in the case where the gov-ernment is “progressive.” 4 Given the behavioural re-sponses of individuals, the authors conclude that in orderto maximize social welfare “the optimal tax system
should feature declining (or at least not increasing) mar-ginal rates, although perhaps increasing average rates”(Gruber and Saez 2000: 34).
High marginal tax rates and formation of capitalMost commentators would agree that investment is im-portant for the future well-being of a nation. High margin-al tax rates lower the returns to investment and the incen-tives for the entrepreneur. Carroll, Holtz-Eakin, Rider, andRosen (1998) find that “a 5 percentage point rise in mar-ginal tax rates would reduce the proportion of entrepre-neurs who make new capital investment by 10.4%. Fur-ther, such a tax increase would lower mean capital outlaysby 9.9%” (1998: 2).
In a recent paper, Gustavo Ventura (1999) modelledthe effects of a broad-based flat tax reform initiative suchas that proposed by Hall and Rabushka (see Section 2).Ventura concluded that the elimination of taxes on capitaldid indeed have a positive effect on capital accumulation.He also concluded that aggregate labour supply, mea-sured in efficiency units, would also increase.
High marginal tax rates and economic growthIn a statistical sense, both average and marginal tax ratescan influence economic well-being. A larger size of gov-ernment and larger corresponding average tax burden(s)can translate into lower economic performance, especial-ly as an expanding government tends to get involved inactivities not consistent with furthering economic growth(Gwartney, Halcombe, and Lawson 1998). Marginal taxrates, however, can have a separate influence on the in-centives facing the factors of production and, thus, ulti-mately on economic well-being. Several papers have triedto disentangle these two effects.
For example, Koester and Kormendi (1989) findthat after controlling for average tax rates, increases inmarginal tax rates have negative effects on the level ofeconomic activity. In other words, reducing the “progres-sivity” of the tax system while allowing the governmentthe same tax revenue as a percent of GDP leads to higherlevels of national income. Since the tax base increaseswhile the average tax rate remains unchanged, this sug-gests that governments can actually increase their reve-nues by moving to “flatter” tax systems.
Mullen and Williams (1996) derive marginal taxrates for the American states using a method similar to

12 Critical Issues Bulletin The Fraser Institute
that of Koester and Kormendi (1989). Their model con-trols for initial income, the growth rate of the capitalstock, and the growth in the labour force. After looking ata number of different estimates they conclude that “low-ering marginal tax rates can have a considerable positiveimpact on growth . . . creating a less confiscatory taxstructure, while maintaining the same average level oftaxation, enabling sub-national governments to spur eco-nomic growth” (Mullen and Williams 1996: 703).
Becsi (1996) uses a method similar to that ofKoester and Kormendi (1989) to derive marginal tax ratesfor the American states. He finds that differences in mar-ginal tax rates across states have a statistically significanteffect on relative growth rates. For the time period exam-ined, Becsi finds that “state and local taxes have tempo-rary growth effects that are stronger over shorterintervals and a permanent growth effect that does not dieout over time” (Becsi 1996: 34).
Finally, Engen and Skinner (1996) examine a num-ber of studies looking at evidence from the United Statesand abroad. They conclude that “a major tax reform reduc-ing all marginal rates by 5 percentage points, and averagetax rates by 2.5 percentage points, is predicted to increaselong term growth rates by between 0.2 and 0.3 percentagepoints” (Engen and Skinner 1996: 34). While this may ap-pear small, the cumulative effective can be enormous.They speculate that if an inefficient tax structure had beenin place in the United States from 1960 to 1996, theamount of output currently lost would have totalled morethan $500 billion annually or 6.4% of 1996 GDP.
Figure 1: 2000 Federal Statutory Tax Rates
0 10,000 20,000 30,000 400
5
10
15
20
25
30
35
17%
Personal Inco
Tax
Rat
es (
%)
$7,231
$30,00
Progressivity
The evidence is already quite strong and still growing thathigh and increasing marginal taxes have negative eco-nomic consequences. One of the main benefits of a flattax is that it is able to achieve progressivity in the tax sys-tem—those earning more, pay more in taxes—while atthe same time eliminating the damaging effects of highand increasing marginal tax rates.
One of the most fundamentally misunderstood as-pects of the flat tax and, for that matter, of the single-ratetax is their effect upon progressivity and marginal taxa-tion. Progressivity refers to the amount of taxation con-tributed by each income group. The traditional conceptof progressivity, often referred to as vertical equity, hasbeen that individuals earning more should contributemore in taxes in an absolute sense. That is, as individualsand families earn more, they should pay proportionatelymore in taxes.
Progressivity has traditionally been achieved byprogressively higher statutory tax rates. Figure 1 illus-trates the progressivity present in the 2000 basic federaltax system. There are four statutory rates: 0%, 17%, 25%,and 29%. Income earned below the level of $7,231 is ex-empt from federal taxation. Income earned between$7,231 and $30,005 is taxed at a rate of 17%. Incomeearned above $30,004 but below $60,010 is taxed at thehigher rate of 25% and finally, income earned above$60,009 is taxed at 29% (see table 1 for a summary of thisinformation).
,000 50,000 75,000 100,000 200,000
25%
29%
me (CDN$ per year)
4$60,009

The Fraser Institute Flat Tax 13
In addition to the four federal statutory rates,there is a federal surcharge, federal payroll taxes, provin-cial taxes (including surcharges), and provincial and feder-al tax credits to consider. For simplicity, only the federalstatutory rates are presented to illustrate the concepts ofprogressivity and marginal taxes.
Progressivity is currently achieved through pro-gressively higher statutory tax rates. However, increasingmarginal tax rates also introduce the negative effects dis-cussed previously. Specifically, achieving progressivitythrough high and increasing marginal tax rates createsdisincentives for entrepreneurial activities, innovation,savings, and investment.
The flat tax can eliminate the negative effects ofhigh and increasing marginal tax rates while maintainingprogressivity. Individuals, families, and businesses contin-ue to contribute an increasing amount of their income asthey earn more but no longer face increasing marginal taxrates. Progressivity within a system based on a flat tax ora single-rate tax is achieved through an exemption. Thus,progressivity is achieved while at the same time avoidingthe disincentives associated with high and increasingmarginal tax rates.
Illustrated exampleProgressivity is introduced in a flat-tax system through apersonal exemption. A personal exemption allows individ-uals, families, or businesses to earn a certain level of in-come before they are assessed income taxes. Figures 2and 3 and table 2 illustrate the effect the introduction of
0 10,000 20,000 30,000 400
5
10
15
20
25
30
35
Tax
Rat
es (%
)
Personal Incom
Marg
Figure 2: Marginal and Effective Tax Rates ($10,000
a personal exemption has on both the proportion of in-come paid in taxes and the average rate of taxation. Themarginal rate of taxation beyond the personal exemptionremains constant at 20% and 30%, respectively. The firstdollar, and every subsequent dollar earned beyond thepersonal exemption is taxed at the same uniform rate.Thus, there is only one point at which the marginal taxrate changes based on the federal statutory tax rates: mov-ing from the exempted income with zero taxation to thenon-exempt income with some positive rate of taxation.
Figures 2 and 3 also show that the proportion of in-come paid (average or effective tax rate) in tax increasesas one’s income increases. As the level of personal incomeincreases, the amount of income or average rate of taxa-tion approaches the actual flat rate of taxation althoughit never actually equals the flat rate due to the presenceof the exemption.
This, in fact, is one of the trade-offs that must beconsidered when developing a flat tax. The larger the ex-emption, the larger the rate of tax that must be applied toall income above the exemption in order to achieve suffi-cient revenue. The larger the exemption and, thus, thehigher the rate of the flat tax, the larger the marginal disin-centive effect present at the point of taxation. That is, thestrength of the disincentive present at the point at whichindividuals begin to pay taxes will increase as the exemp-tion and tax rate increase. A crucial step in the developmentof a tax system based on a flat tax is the determination ofthe exemption level and its corresponding tax rate. Section3 presents nine cases to illustrate this and other trade-offs.
,000 50,000 75,000 100,000 200,000e (CDN$ per year)
inal Tax Rate (20%)
Average Tax Rate
exemption with 20% tax rate)

14 Critical Issues Bulletin The Fraser Institute
0 10,000 20,000 30,000 40,000 50,000 75,000 100,000 200,0000
5
10
15
20
25
30
35Tax
Rat
es (%
)
Personal Income ($CDN per year)
Marginal Tax Rate (30%)
Average Tax Rate
Conclusion
It is important to note when reading this study and otheranalyses of tax reform the basic differences between aver-age and marginal tax rates when assessing tax policy. Fur-ther, it is vital to acknowledge the growing body of re-
search confirming the rather large negative effectsassociated with high and increasing marginal tax rates. Fi-nally, one should acknowledge that progressivity can beachieved through a flat tax or a single-rate tax without in-curring the costs associated with the negative incentivesarising from high and increasing marginal tax rates.
Figure 3: Marginal and Effective Tax Rates ($20,000 exemption with 30% tax rate)
Table 2: Two scenarios of the flat tax
Notes: Scenario 1—$10,000 exemption with a 20% single tax rate. Scenario 2—$20,000 exemption with a 30% single tax rate. Data
and calculations are for illustrative purposes only and do not represent modelled tax calculations.
Scenario 1 Scenario 2
Income Level Taxes Paid Average Tax Rate Taxes Paid Average Tax Rate
10,000 — 0.0% — 0.0%
20,000 2,000 10.0% — 0.0%
30,000 4,000 13.3% 3,000 10.0%
40,000 6,000 15.0% 6,000 15.0%
50,000 8,000 16.0% 9,000 18.0%
75,000 13,000 17.3% 16,500 22.0%
100,000 18,000 18.0% 24,000 24.0%
200,000 38,000 19.0% 54,000 27.0%

2 Hall-Rabushka flat-tax reform
This section provides a brief overview of the flat-tax re-form proposed by Professors Robert E. Hall and AlvinRabushka, both of the Hoover Institution. The tax re-form developed by Hall and Rabushka is based on a sin-gle rate of taxation for all sources of income andrepresents a fundamental change in the way govern-ments would collect tax revenue. The proposal achievessimplicity, economic efficiency, and fairness, the tradi-tional measures of effective taxation, while collectingthe necessary revenues required to finance government.One could think of their proposal as the ideal tax systemtowards which we should strive. Those wishing to pur-sue the proposals of Hall and Rabushka in greaterbreadth and detail will find their works on the Internetat the Hoover Institution (www.hoover.org) and theAmerican Enterprise Institute (www.aei.org) as well as inmost major bookstores and libraries.
Differentiating the flat tax from the single-rate tax
In discussing tax reform, it is again important to recog-nize the stark difference between reform based on a flattax and the replacement of multiple tax rates with a sin-gle tax rate. The reforms to personal income tax an-nounced in the Province of Alberta in 1999 will replacethe multiple tax rates applied to personal income with asingle tax rate. Similarly, the tax reform recently pro-posed by the Canadian Alliance would replace the multi-ple federal statutory personal income tax rates with tworates initially, and, near the end of their first mandate,with one rate. However, the replacement of multiple taxrates with a single rate is but one step in the process ofbroad-based tax reform based on a flat tax model. Infact, the replacement of multiple tax rates with a singlerate can be viewed as a tax reform separate and distinctfrom reforms based on a flat tax.
1
Hall-Rabushka flat tax
A number of tax reforms have been proposed in the Unit-ed States including a national sales tax and the replace-ment of the current graduated system of income tax witha flat tax. Prominent American political leaders, includingthe Majority Leader of the House of Representatives, DickArmey, have formulated comprehensive programs for taxreform based on a flat tax. The foremost proposal for aflat tax, however, is also one of the earliest: Hall andRabushka first proposed a comprehensive flat tax in 1985and their proposal has subsequently formed the basis fora host of others.5
The principles upon which Hall and Rabushka’sflat-tax proposal (hereafter Hall-Rabushka) rest are sim-plicity, efficiency, and fairness. That is, in formulatingtheir reformed tax system, Hall and Rabushka attemptedto fashion a system that would increase simplicity, effi-ciency, and fairness.
One of the essential aspects of a flat-tax system isthe taxing of all types of income once and only once. Un-der the current system, in both the United States and Can-ada, certain types of income, such as some fringebenefits, are not taxed at all, while other sources of in-come such as dividends and capital gains are taxed morethan once or at differing rates.
The other essential aspect of a flat tax is that in-come should be taxed uniformly, with no rate differentialsbetween different types of income. In other words, in-come from dividends, or wages, or pensions should betaxed at the same single rate. In the case of the UnitedStates, Hall-Rabushka recommended replacing the cur-rent 5 personal federal rates (15%, 28%, 31%, 36%, and39.6%) and the various business tax rates with one single,19% federal tax rate.
Individual income taxOne frequently overlooked aspect of Hall-Rabushka is itsrejection of alternative taxes such as a national sales tax or
5

16 Critical Issues Bulletin The Fraser Institute
value-added tax. Both scholars reject the alternatives be-cause of the difficulty of exempting lower-income individ-uals and families from taxation. Under Hall-Rabushka asignificant number of lower-income families pay absolutelyno income tax. In fact, under Hall-Rabushka the exemptionfor a family of four in 1995 was $25,500 (CDN$32,986). Inother words, a family of four with total income less thanUS$25,500 would pay no income tax and families with in-come above the exemption would pay 19% tax on theamount in excess of the exemption.
While the most significant reforms under Hall-Rabushka occur in taxation of corporate or business in-come, reforms are nonetheless present for personal in-come tax. Under Hall-Rabushka, only wages, salaries, andpension benefits are deemed personal income and subjectto personal income tax. Income from dividends, capitalgains, interest, or fringe benefits are not subject to person-al income tax because they are already taxed at the corpo-rate or business level. Recall that, under Hall-Rabushka,whether income is taxed at the personal or business levelis irrelevant since all income is taxed at the same rate.
The phrase “postcard-size tax returns” was coinedpartially in connection with the Hall-Rabushka plan. Indi-viduals and families would simply sum their income fromwages, salaries, and retirement benefits and subtract thepersonal exemption to calculate their taxable income.This amount is then multiplied by one rate (19%) to deter-mine the individual or family tax bill for the year. Theamount withheld is then compared to the amount owedto calculate whether a refund is owing from, or a paymentis owing to, the federal government.
This system has no tax credits, deductions, or ad-ditional exemptions. In other words, the myriad of taxcredits and deductions present in the current systems andthe attendant complicated and time-consuming paper-work are eliminated under Hall-Rabushka.
Business income taxAnother important aspect of Hall-Rabushka and, indeed,most flat-tax proposals is that they offer an integrated ap-proach to tax reform. That is, they aim to reform not onlypersonal income tax but also corporate or business in-come tax. Hall-Rabushka assesses tax on all business in-come after deducting the cost of inputs, salaries, wages,pensions, and investment in plant and equipment.
Although the corporate tax rate is lowered in orderto satisfy the requirement for one rate of taxation, morerevenue is generated by broadening the tax base through
the elimination of tax-based incentives for business, tax-ing certain benefits that currently escape taxation, and re-moving interest deductibility.
Hall-Rabushka precludes businesses from deduct-ing the cost of interest, dividends, fringe benefits, andany other payments to owners as expenses. The rationalefor excluding these types of deductions and, thus, forcingthe business to pay tax on them is to ensure that they aretaxed only once. The income individuals and families re-ceive from business is exempt from personal taxation be-cause it has already been taxed at the corporate orbusiness level. Hall-Rabushka is, therefore, a comprehen-sive tax system that assesses all types of income equallyand singularly.
Interest deductibility and depreciation expensesTwo of the major reforms in Hall-Rabushka are the exclu-sion of interest costs and depreciation expenses as de-ductible expenses. Interest income is no longer deemedto be taxable income for individuals or families underHall-Rabushka because it is taxed as business income.This fundamental change in the way businesses are taxedeliminates the preferential treatment accorded debt rela-tive to equity financing. Currently, payments based ondebt instruments, such as bonds, are tax deductible whilepayments based on equity investments, such as divi-dends, are not. By eliminating interest payments as taxdeductions, Hall-Rabushka eliminates preferential treat-ment of debt.6 This is one of the many economic efficien-cies gained under Hall-Rabushka.
Perhaps the largest single reform under Hall-Rabushka is the elimination of depreciation expenses.Businesses are currently able to write-off, or deduct, thecost of investing in new plants and equipment on an in-cremental basis. That is, each year over a period deter-mined by government, business is permitted to deduct apercentage of the total cost of purchasing plants andequipment. Under Hall-Rabushka, the entire cost of in-vestment (plant and equipment) is deducted as an ex-pense in the year of purchase. Thus, depreciationschedules and the bureaucracy necessary to interpretthem (accountants and lawyers) and to enforce them (gov-ernment revenue officials) are eliminated or, at least, re-duced in number. There would be no conflict overwhether the purchase of certain types of equipment areinvestments or expenses since Hall-Rabushka considersall such expenditures as expenses.

The Fraser Institute Flat Tax 17
Focus on consumptionOne of the main, though often overlooked, benefits ofHall-Rabushka is that it effectively moves income tax awayfrom a tax system based on income towards one based onconsumption. Economists generally agree that the taxa-tion of consumption is the most efficient manner in whichto raise tax revenue (Jorgensen Yun 1991; Kesselman1997; and Kneller, Bleaney, and Gemmell 1999). Hall-Rabushka creates a tax system based on consumption byexcluding all investment activities. In essence, a con-sumption tax is levied on any income that is consumed,that is, spent rather than saved. The exclusion of savings(investments) under Hall-Rabushka also enables it also toeliminate the heavy taxation of returns to savings. Thus,not only are efficiencies gained by moving towards amore effective base of taxation (i.e., consumption) butconsiderable incentives are created for increased savingsand the formation of capital.
Economic considerationsThere are a number of important economic consider-ations associated with the implementation of Hall-Rabushka beyond achieving simplification in the tax sys-tem. The net economic effect of the reforms proposed byHall-Rabushka include improved incentives for work, in-creased entrepreneurial activity, and greater formation ofcapital, leading to a substantially higher level of nationaloutput and standard of living.
Various aspects of the proposals included in Hall-Rabushka would lead to increases in the efficiency of cap-ital formation. Although the current system sustains a rel-atively high level of capital formation, it does so byproviding a number of tax-based incentives in the form oftax credits and subsidies that tend to redirect capital toless efficient uses. Specifically, the current system pro-motes debt-financed investment by permitting interestdeductibility while penalizing equity-financed investmentthrough double taxation of dividends and capital gains.The net result is less entrepreneurial activity and greaterdebt-financed (lower risk) investment. Auerbach and Kot-likoff (1987; cited in Hall-Rabushka) estimate that a flattax would increase the ratio of capital formation to GDPfrom 5.0% to 6.2% and, as a consequence, increase GDP bybetween 2% and 4% within seven years.
There are also strong incentives for individuals toincrease their work effort. Hall-Rabushka completelyeliminates the effect of increasing marginal taxes exceptfor the initial level at which taxation begins. That is, as in-dividuals attain skills and begin to advance in the labourforce, they do not face increasing rates of taxation. Thereis, therefore, no marginal disincentive to work harder andsucceed as exists in the current system. Hall and Rabush-ka estimate that GDP will increase by approximately 3%simply due to the elimination of disincentives for work.
Finally, Hall and Rabushka conclude that therewould be downward pressure on interest rates within aflat-tax regime. They specifically cite the 1⁄6 (17%) interest-rate differential present between tax-exempt municipalbonds and comparable taxable bonds. Evidence derivedfrom their analysis suggests that interest rates would belowered by roughly 25%. The reduction in interest rateswould have a significant effect on the housing and invest-ment market.
Conclusion
We have not, by any means, given a full description and as-sessment of Hall-Rabushka. However, it is important tonote the comprehensive nature of this proposal and thefar-reaching economic improvement that it offers. Hall andRabushka present a clear, concise, and effective proposalfor reform of taxation on personal income and on businessincome. They offer a road map for tax reform that increas-es simplicity, efficiency, and fairness in the tax system.
There are major differences between the broad-based and far-reaching tax reform that results from a flat-tax model of taxation such as Hall-Rabushka and the incre-mental reform that results from replacing multiple rates oftaxation with a single rate. The replacement of multiplerates of taxation with a single rate, although an importanttax reform, does not change the tax system in the funda-mental way that a flat tax does. For instance, the replace-ment of multiple rates of taxation with a single rate doesnot eliminate the great number of deductions and taxcredits present in the system nor does it eliminate thepreferential treatment of certain types of income relativeto others or the double taxation of other types of income.

3 The flat tax applied: nine cases
This section contains nine quantitative analyses based onStatistics Canada’s Social Policy Simulation Database andModel (SPSD/M) of various implementations of a flat taxat the federal and provincial levels. The reforms includedin each of the nine cases considered show the flat tax im-plemented to the extent possible within the SPSD/M. Theapplication of the flat tax is, thus, restricted to personalincome and does not include other major sources of taxrevenue such as corporate income.
Cases 1 through 4 present the simplest scenarios.The first eliminates all tax credits, exemptions, and de-ductions in order to present the simplest, most straight-forward case possible. The remaining three add apersonal exemption of varying value, illustrating the rath-er large trade-off that exists between the value of the per-sonal exemption and the corresponding tax rate.
Case 1• no tax credits, exemptions or deductions
Case 2• personal exemption ($7,231)• no other deductions or exemptions
Case 3• personal exemption ($8,766)• no other deductions or exemptions
Case 4• personal exemption ($17,532)• no other deductions or exemptions
Cases 5, 6, and 7 introduce an exemption of $2,000per child, and deductions for both contributions to retire-ment plans (RRSP/RPP) and donations to registered chari-ties, illustrating the effects associated with the introduc-tion of a variety of tax deductions and exemptions.
Case 5• personal exemption ($8,766)• exemption of $2,000 per child
Case 6• personal exemption ($8,766)
1
• exemption of $2,000 per child• current RRSP/RPP deduction
Case 7• personal exemption ($8,766)• exemption of $2,000 per child• current RRSP/RPP deduction• current deduction for charitable donations
Cases 8 and 9 introduce a reduction in spending bythe federal government and a corresponding reduction intaxes. In the the previous seven cases, federal govern-ment spending was held neutral (constant).
Case 8• $13.4 billion spending and tax reduction• personal exemption ($11,834)• exemption of $2,000 per child• current RRSP/RPP deduction
Case 9• $22.3 billion spending and tax reduction• personal exemption ($11,834)• exemption of $2,000 per child• current RRSP/RPP deduction
Each case contains the respective tax rates chargedby the federal and provincial governments. The combinedor total flat-tax rate for each jurisdiction is also shown.
Analysis of tax distribution, which provides infor-mation on which income groups actually pay the incometax bill, is presented for all nine cases.
The study also presents relative measures of thetax distribution, specifically, the combined federal-provin-cial flat tax as well as the federal-only rate of flat tax rela-tive to total income for each income group. The relativemeasures are presented in a separate table following theabsolute measures of the tax distribution. In both cases,a brief discussion of the results contained in the tables ispresented.
In addition to the overall distribution of taxation,analyses of five sample households from Ontario are pre-sented. The five households were selected in order to
8

The Fraser Institute Flat Tax 19
highlight specific experiences with tax reform. Household1 is a single individual aged 31, with no children, and earn-ing $37,635, roughly the average industrial wage.
The second and third examples are family house-holds with proximate incomes, both with two parents andtwo children. Household 2 is a family of two working par-ents aged 34 and 32, with two children aged 14 and 11,and earning a combined income of $55,840. Household 3is a family of two parents aged 37 and 33, with two chil-dren aged 5 and 8, and earning a combined income of$56,783. The difference between these two households isthat household 3 has one predominant income earnerwhile household 2 has two people earning nearly equalincomes. In other words, one of the parents in household3 essentially works in the home.
These two households are presented in order to il-lustrate the different effects the nine cases would have onhouseholds where incomes are similar but the work sta-tus of the parents differ. Thus, rather than viewing eachhousehold in isolation the two should be viewed simulta-neously in order to compare the effect of the flat tax on afamily of dual earners with the effect on a family support-ed by a single earner.
Households 4 and 5 are presented to illustrate theeffects of the various tax cases on different levels ofhousehold income. Household 4 has two parents, aged 43and 39, with two children aged 18 and 8 and earning acombined income of $24,849. Like household 3 (single in-come-earner), this family’s income is predominantlyearned by one of the parents. Household 5 is meant to il-lustrate the effects of the various tax scenarios on a rela-tively affluent household. This household has twoparents, aged 49 and 39, with two children aged 19 and14 and earning a combined income of $98,585. Althoughboth parents in this particular household work, the in-come of one of the earners is significantly higher than theother parent’s income.
These examples are just five of approximately65,000 families included in the SPSD/M. These particularexamples were chosen in order to highlight specific ef-fects of the flat tax upon the personal income tax of typi-cal Canadian households. The households were chosen byinserting the general family specifications into the RecordSelection Facility of the SPSD/M.
It is important to note that, in all of the cases ex-cept 8 and 9, there is no effect upon government reve-nue. That is, Cases 1 through 7 provide the samerevenue to the federal and provincial governments asthe status quo. Any reduction in spending that results in
the need for less tax revenue necessarily reduces therates of the flat tax.
Also, there is no federal tax abatement allowed forQuebec in this study. Therefore, the value of the abate-ment is removed from the provincial revenue that a flattax in Quebec would generate. While the federal and pro-vincial tax rates presented below would differ if theabatement were allowed, the total tax rate faced by tax-payers in Quebec would remain the same.
Methodology
The model used to analyze all cases was built using aglass-box application of the Social Policy Simulation Data-base and Model.7 A new executable SPSD/M was createdby copying the relevant SPSD/M files, changing existing oradding new C++ code segments, and compiling thechanged files using Microsoft Visual C++.
Net income is equal to the Canada Customs andRevenue Agency’s definition of total income for tax pur-poses except for Cases 6 through 9 where RRSP/RPP con-tributions are deducted from total income.
The only exemptions and deductions from incomeallowed are those discussed in the various cases; all otherpersonal income tax credits, exemptions, and deductionshave been eliminated. All spending programs (includingprograms such as GST rebates and child-tax benefits thatdepend on income as determined by the annual tax re-turn) remain in place.
The federal tax abatements to Quebec as they cur-rently exist were not modelled as this arrangement be-tween the federal and Quebec governments is one of theunnecessary complications in the current tax system thattax reform should eliminate. In all relevant cases, morefederal and less provincial revenue is collected from Que-bec’s taxpayers than would be the case if the abatementswere included in the calculations. A note to the tablesshowing the flat-tax rates (tables 3.x.1) provide the taxrates that would exist if the abatement were included inthe model. For example, Case 6 shows Quebec with a fed-eral tax rate of 19.9% and a provincial rate of 15.7%. If theabatements were included, the federal rate for Quebecwould be 16.2% (resulting in less federal revenue fromQuebec taxpayers) and the provincial rate would be 19.4%(resulting in more provincial revenue from Quebec tax-payers). The overall rate remains unchanged at 35.6%.
The various cases presented in this section do notincorporate any behavioural responses to the changes in

20 Critical Issues Bulletin The Fraser Institute
the tax system. That is, the analysis does not account forthe possibility that the various changes proposed ineach case might facilitate or encourage particular chang-es in the behaviour of taxpayers. For instance, the re-placement of high and increasing marginal taxes withone single-rate of taxation is expected to encourage
greater work effort and higher levels of savings that leadto higher rates of economic growth but such benefitsare not included in the analysis. Thus, our analysis isconservative in estimating the total effect the proposedtax changes would have on government revenue andpersonal income levels.
Case 1No tax credits, exemptions or deductions (base case)
Case 1 eliminates all tax credits, deductions, and exemp-tions, including the personal exemption. Put another way,this case represents a basic tax system for personal in-come that excludes all types of incentive-based exemp-tions and tax credits. For instance, in addition to the elim-ination of the personal exemption, other popularexemptions such as those for Registered Retirement Sav-ing Plans (RRSP) and Registered Pension Plans (RPP), thechild expense deduction, and the tax credit for charitabledonations are also eliminated. Eliminating the myriad ex-emptions, tax credits, and deductions presents a nearlyflat rate of taxation for personal income. The system isnot completely flat because it does not include othertypes of income such as corporate income. It is, however,to the fullest extent possible within the structure of theSPSD/M, a flat system of taxation on personal income.
Case 1 is presented not because the authors donot believe a personal exemption should be present butrather to present a base-case to which other cases can becompared. One of the important insights gained frompresenting a base case is the effect the introduction of ex-emptions and deductions have on the applicable rates offlat tax.
The pattern present in Table 3.1.1 will persist: Que-bec maintains the highest provincial flat-tax rate, fol-lowed by the prairie and Atlantic provinces clusteredclosely together, with Ontario consistently having thelowest provincial rate of flat tax. Eliminating all tax cred-its, exemptions, and deductions results in a base federalflat tax rate of 12.7%, 4.3 percentage points lower thanthe current lowest federal statutory rate of 17%.
The elimination of the personal exemption thatshields a large portion of lower-income Canadians’ in-come from income tax causes a pronounced shift in thedistribution of tax from upper-income Canadians to low-er-income and middle-income Canadians. For instance,Canadians earning between $1 and $10,000 experience,on average, an increase in personal income tax of $614.
The largest absolute, per-capita increase, $1,614, oc-curs for individuals earning between $10,000 and$20,000 annually.
The first income group to experience a net reduc-tion in personal income tax are those earning between$40,001 and $50,000, who receive a decrease of $303 percapita (table 3.1.2). Income groups below this level all ex-perience a net increase in personal income taxes. Thelargest absolute, per capita tax reduction occurs in thehighest income bracket, those earning in excess of
Table 3.1.1: Flat tax rates (Case 1)
Based on calculations by the authors using Statistics Canada’s
SPSD/M.
* Calculated using the weighted provincial average of 7.0%.
† Does not account for the current opting out arrangement
(CHST and youth allowance abatements) that Quebec has with
the federal government. Accounting for this agreement yields
an adjusted federal flat tax rate of 10.5% for Quebec only and
an adjusted Quebec provincial flat tax of 11.7%. Note that the
adjustment does not affect Quebec’s combined federal-pro-
vincial flat tax rate.
Rate of Jurisdiction
Combined Federal/ Provincial Rate
Federal 12.7 19.7*
Newfoundland 7.2 19.9
Prince Edward Island 6.5 19.2
Nova Scotia 6.4 19.1
New Brunswick 7.0 19.7
Quebec† 9.5 22.2
Ontario 5.8 18.5
Manitoba 8.0 20.7
Saskatchewan 7.8 20.5
Alberta 6.5 19.2
British Columbia 7.0 19.7

The Fraser Institute Flat Tax 21
$250,000, who receive a net reduction of personal in-come tax of $105,882. It is interesting to note that thoseearning in excess of $250,000 annually represent roughly2% of all those filing tax returns (Emes and Walker 1998).
Table 3.1.3 supports the findings contained in theprevious tax distribution table (table 3.1.2). Specifically,the gains from eliminating all exemptions, deductions,and tax credits is largely concentrated at upper-incomelevels. The reason for this is that the value of the personalexemption eliminated in this base case is more valuablefor lower-income Canadians because it shields a greaterportion of their income from income tax than it does formiddle- and upper-income Canadians. For instance, an in-dividual earning $10,000 annually has almost three-quar-ters of her entire income shielded by the personalexemption while someone earning $35,000 only has ap-proximately one-fifth of his income shielded by the per-sonal exemption.
It is important also to recognize that the personalexemption is one of only a few exemptions from which alltaxpayers benefit. Increasing or decreasing the personalexemption can, therefore, have significant effects on thetax rates. This trade-off between the value of the exemp-tion and the rate of tax required will be a recurring themethroughout this section of the study as different exemp-tions and deductions are re-introduced into the personalincome tax system.
Table 3.1.4 shows the effects upon the personal in-come tax of the five sample households when deductionsand the personal exemption are eliminated. The single in-dividual (household 1) enjoys an $896 reduction in her in-come tax, representing an 11.3% reduction from thestatus quo.
Income tax for the dual-earner family (household2) increases by $1,248, an increase of 14.0% from the sta-tus quo. On the other hand, income tax for the single-
Table 3.1.2: Tax distribution (Case 1)
Based on calculations by the authors using Statistics Canada’s SPSD/M.
Income Group Total Flat Tax Revenue
Total Current Tax Revenue
Change in Tax Revenue
Net Income Number of Individuals
Per-capita Tax Difference
($millions) ($millions) ($millions) ($millions) (thousands) ($)
Minimum — (10,000) 0 0 0 0 12 0
(9,999) — 0 0 0 0 0 7,385 0
1 — 10,000 3,485 67 3,417 17,578 5,563 614
10,001 — 20,000 13,024 3,795 9,229 65,443 5,717 1,614
20,001 — 30,000 16,942 10,781 6,160 85,172 3,835 1,606
30,001 — 40,000 18,672 15,702 2,969 94,506 2,838 1,046
40,001 — 50,000 16,802 17,393 (590) 85,171 1,947 (303)
50,001 — 60,000 14,876 17,261 (2,384) 75,371 1,397 (1,707)
60,001 — 70,000 9,735 12,062 (2,327) 49,512 772 (3,011)
70,001 — 80,000 6,742 9,039 (2,296) 34,889 472 (4,860)
80,001 — 90,000 4,252 6,078 (1,826) 21,838 259 (7,049)
90,001 — 100,000 2,854 4,286 (1,432) 14,640 155 (9,196)
100,001 — 110,000 2,034 3,151 (1,116) 10,350 100 (11,152)
110,001 — 120,000 1,639 2,664 (1,025) 8,495 75 (13,555)
120,001 — 130,000 1,271 2,063 (792) 6,551 53 (14,930)
130,001 — 140,000 1,014 1,650 (636) 5,243 39 (16,158)
140,001 — 150,000 603 988 (385) 3,077 21 (17,938)
150,001 — 200,000 2,564 4,424 (1,860) 13,157 78 (23,576)
200,001 — 250,000 1,599 2,986 (1,386) 8,153 36 (37,723)
250,001 — Maximum 5,992 12,648 (6,656) 30,686 62 (105,882)

22 Critical Issues Bulletin The Fraser Institute
earner family (household 3) decreases by $2,187, repre-senting a decline of 17.5% compared with their currentincome tax bill.
The divergent experiences of the two householdswith similar incomes is worth discussing.8 The imple-mentation of a flat tax with no exemptions or deduc-tions effectively equalizes the percentage of totalfamily income allocated to personal income tax at 18.2%of total income. In other words, under the reformedsystem, the two families with approximately equal in-come are assessed approximately equal tax bills relativeto their income.
The equalization of the income-tax liability underthe new system is a change from the current system. Un-der the current system, due, in part, to different exemp-tions and income brackets, two-income families will paytax bills much different from those of one-income, two-parent families. For instance, the two-income family(household 2) splits the income of the two working par-ents and thus has its income taxed at lower tax rates. Re-call that the first positive statutory rate applies to incomebetween $7,231 and $30,005 while the next rate appliesto income above $30,004 and below $60,010. Thus, the
one-income family (household 3) will incur a larger tax billsimply because they are not able to split their family in-come as the two-income family can. When this discrimi-natory effect of the tax code is removed, both families payapproximately the same amount of income tax relative totheir total household income.
The most striking result occurs with respect to thelow-income family (household 4). By removing the per-sonal exemption and all deductions, the income tax bur-den for the low-income household increases 237.5% whencompared to the amount of income taxes paid currently.The bulk of the income tax increase is due to the elimina-tion of the personal exemption that previously wouldhave shielded more than half of the household’s incomefrom income tax.9
On the other hand, the high-income household(household 5) experiences a reduction of $8,415 in its in-come tax, a 31.7% decrease relative to the amount of in-come taxes paid under the status quo. The reason for thedramatic decrease in the high-income household’s in-come tax bill is that the removal of the personal exemp-tion and various deductions had much less effect relativeto the substantial decrease in the tax rates.

The Fraser Institute Flat Tax 23
Table 3.1.3: Relative measures of tax changes (Case 1)
Based on calculations by the authors using Statistics Canada’s SPSD/M.
Table 3.1.4: Effect on sample households (Case 1)
Based on calculations by the authors using Statistics Canada’s SPSD/M.
Income Group Total Flat Tax Paid to Total Income (%)
Current PIT to Total
Income (%)
Percentage Point Change
Federal Flat Tax Only to Total Income
(%)
Federal PIT Only to Total Income (%)
Percentage Point Change
Minimum — (10,000) 0.0 0.0 0.0 0.0 0.0 0.0
(9,999) — 0 0.0 0.0 0.0 0.0 0.0 0.0
1 — 10,000 14.0 0.3 13.7 8.9 0.2 8.7
10,001 — 20,000 15.4 4.5 10.9 9.8 3.0 6.8
20,001 — 30,000 17.8 11.4 6.4 11.5 7.0 4.5
30,001 — 40,000 18.9 15.9 3.0 12.1 9.9 2.2
40,001 — 50,000 19.3 20.0 (0.7) 12.4 12.5 (0.1)
50,001 — 60,000 19.5 22.7 (3.2) 12.5 14.3 (1.8 )
60,001 — 70,000 19.4 24.1 (4.7) 12.5 15.2 (2.7)
70,001 — 80,000 19.2 25.8 (6.6) 12.6 16.8 (4.2)
80,001 — 90,000 19.4 27.8 (8.4) 12.6 17.7 (5.1)
90,001 — 100,000 19.4 29.1 (9.7) 12.6 18.4 (5.8)
100,001 — 110,000 19.4 30.1 (10.7) 12.5 18.7 (6.2)
110,001 — 120,000 19.0 30.8 (11.8) 12.5 19.8 (7.3)
120,001 — 130,000 19.3 31.3 (12.0) 12.6 19.9 (7.3)
130,001 — 140,000 19.2 31.2 (12.0) 12.6 20.0 (7.4)
140,001 — 150,000 19.4 31.8 (12.4) 12.5 19.4 (6.9)
150,001 — 200,000 19.0 32.8 (13.8) 12.3 20.3 (8.0)
200,001 — 250,000 19.5 36.4 (16.9) 12.6 22.3 (9.7)
250,001 — Maximum 19.4 40.9 (21.5) 12.6 24.8 (12.2)
Household 1 (Individual)
Household 2 (Two Earners)
Household 3 (One Earner)
Household 4 (Low Income)
Household 5 (High Income)
Base PIT 7,920 8,932 12,496 1,213 26,581
Combined flat tax 7,023 10,180 10,309 4,094 18,166
Nominal Difference (896) 1,248 (2,187) 2,881 (8,415)
Percent Change (11.3%) 14.0% (17.5%) 237.5% (31.7%)

24 Critical Issues Bulletin The Fraser Institute
Case 2Personal exemption of $7,231
Case 2 re-introduces the personal exemption that waseliminated in the Case 1. The exemption is introduced atthe 2000 level of $7,231. The rationale for the re-intro-duction of an exemption from taxation up to a certain lev-el of income is based on fairness.10 The policy objective isto ensure that a low-income individual does not pay in-come tax until (at least) most of her basic requirementshave been met. That is, an exemption allows taxpayers toearn a certain amount of money without paying tax.
Table 3.2.1 summarizes the various rates of taxa-tion applicable when a flat tax is coupled with the 2000personal exemption of $7,231. The re-introduction of thepersonal exemption increases the overall rates of taxationfor each jurisdiction by nearly a third. For instance, thefederal rate increases 4.0 percentage points, from 12.7%to 16.7%. Similarly, the provincial rate for Ontario increas-
Table 3.2.1: Flat tax rates (Case 2)
Based on calculations by the authors using Statistics Canada’s
SPSD/M.
* Calculated using the weighted provincial average of 9.4%.
† Does not account for the current opting out arrangement
(CHST and youth allowance abatements) that Quebec has with
the federal government. Accounting for this agreement yields
an adjusted federal flat tax rate of 13.7% for Quebec only and
an adjusted Quebec provincial flat tax of 16.1%. Note that the
adjustment does not affect Quebec’s combined federal-pro-
vincial flat-tax rate.
Rate of Jurisdiction
Combined Federal/ Provincial Rate
Federal 16.7 26.1*
Newfoundland 10.8 27.5
Prince Edward Island 9.4 26.1
Nova Scotia 9.2 25.9
New Brunswick 9.9 26.6
Quebec† 13.1 29.8
Ontario 7.5 24.2
Manitoba 10.6 27.3
Saskatchewan 10.8 27.5
Alberta 8.4 25.1
British Columbia 9.2 25.9
es 1.7 percentage points, from 5.8% to 7.5% while the pro-vincial rate for Quebec increases 3.6 percentage points,from 9.5% to 13.1%.
The combined rates for all provinces increase. Ontar-io, the jurisdiction with the lowest rate of taxation, experi-ences an overall increase of 5.7 percentage points, from18.5% to 24.2%. Similarly, the rate for Quebec, the jurisdic-tion with the highest rate of taxation, increases 7.6 percent-age points, from 22.2% to 29.8%. The reason for the large in-crease in the rate across all jurisdictions is that the re-introduction of the personal exemption affects all taxpayers.
The re-introduction of the personal exemption notonly increases the respective provincial and federal taxrates but also alters the distribution of taxation. Table3.2.2 includes the distribution of income taxes based onCase 2. The shift in the tax burden from higher incomesto lower- and middle-incomes seen in Case 1 is mitigatedby the re-introduction of a personal exemption. For in-stance, the increased tax burden placed on incomes be-tween $10,001 and $20,000 is reduced from $1,614 to$575 with the re-introduction of the exemption, a de-crease of 64.4%. Similarly, for those in the lowest positiveearnings bracket ($1 to $10,000), the increased tax bur-den is reduced from $614 to $30.
Conversely, the reduction in the tax burden forthose with high income is less than it was in Case 1. Forinstance, those earning in excess of $250,000, the highestincome group, experience a reduction in personal incometax of $77,424, $28,458 less than the tax reduction of$105,882 experienced without an exemption.
One of the interesting effects of the re-introduc-tion of the personal exemption is that it raises the incomegroup in which individuals receive a net reduction in per-sonal income tax from the range of $40,001 to $50,000 tothe next range of $50,001 to $60,000. Thus, in order toreceive a net reduction in personal income tax from theflat tax in this case, individuals must earn in excess of$50,000. Interestingly though, in 1997, a full 57% of in-come tax was paid by the top 12% of tax-filers, those earn-ing in excess of $50,000 annually (Emes and Walker 1999).It is, therefore, not unexpected that the shift in the taxburden would benefit those who now bear the greatestproportion of income tax.

The Fraser Institute Flat Tax 25
Table 3.2.3 supports the general findings of thedata contained in the tax-distribution table (3.2.2). Sincetaxpayers in the income group earning $50,001 to$60,000 are the lowest income group to show a reductionin their income tax bill relative to their income, the intro-duction of a personal exemption to a flat-tax system sig-nificantly mitigates the shift in the tax burden fromupper-income groups to lower-income and middle-in-come groups.
Table 3.2.4 presents the income tax for our house-hold examples. The individual’s income tax, although re-duced by 5.9%, is reduced much less than it was under theprevious case. Again, we notice the diverging experiencesof the two households with similar incomes. The two-in-come family (household 2) experiences a marked increasein income tax while the single-income family (household
3) experiences a marked decrease in income tax. It is againimportant to recognize that both family households payapproximately the same percentage of their total house-hold income (17.6%) in income taxes under the flat tax.
The re-introduction of a personal exemption has anoticeable effect on the tax paid by the low-income andhigh-income families. The tax increase experienced bythe low-income household (household 4) is significantlyless than it was in Case 1, where any personal exemptionwas excluded. Household 4 experiences a 53.6% increasein its total income tax bill compared to the status quo.
The introduction of a personal exemption also de-creases the size of the tax reduction experienced by thehigh-income household (household 5), which has a reduc-tion in income tax of $6,267 or 23.6% relative to the statusquo, whereas they have a 31.7% decrease in case 1.
Table 3.2.2: Tax distribution (Case 2)
Based on calculations by the authors using Statistics Canada’s SPSD/M.
Income Group Total Flat Tax Revenue
Total Current Tax Revenue
Change in Tax Revenue
Net Income Number of Individuals
Per-capita Tax Difference
($millions) ($millions) ($millions) ($millions) (thousands) ($)
Minimum — (10,000) 0 0 0 0 12 0
(9,999) — 0 0 0 0 0 7,385 0
1 — 10,000 234 67 166 17,578 5,563 30
10,001 — 20,000 7,085 3,795 3,289 65,443 5,717 575
20,001 — 30,000 14,770 10,781 3,988 85,172 3,835 1,040
30,001 — 40,000 18,744 15,702 3,041 94,506 2,838 1,072
40,001 — 50,000 18,060 17,393 667 85,171 1,947 343
50,001 — 60,000 16,665 17,261 (596) 75,371 1,397 (427)
60,001 — 70,000 11,160 12,062 (902) 49,512 772 (1,167)
70,001 — 80,000 7,881 9,039 (1,157) 34,889 472 (2,449)
80,001 — 90,000 5,031 6,078 (1,047) 21,838 259 (4,043)
90,001 — 100,000 3,427 4,286 (859) 14,640 155 (5,516)
100,001 — 110,000 2,468 3,151 (682) 10,350 100 (6,812)
110,001 — 120,000 1,995 2,664 (669) 8,495 75 (8,844)
120,001 — 130,000 1,563 2,063 (500) 6,551 53 (9,425)
130,001 — 140,000 1,249 1,650 (401) 5,243 39 (10,185)
140,001 — 150,000 749 988 (239) 3,077 21 (11,128)
150,001 — 200,000 3,207 4,424 (1,217) 13,157 78 (15,426)
200,001 — 250,000 2,031 2,986 (955) 8,153 36 (25,995)
250,001 — Maximum 7,781 12,648 (4,867) 30,686 62 (77,424)

26 Critical Issues Bulletin The Fraser Institute
Table 3.2.3: Relative measures of tax changes (Case 2)
Based on calculations by the authors using Statistics Canada’s SPSD/M.
Table 3.2.4: Effect on sample households (Case 2)
Based on calculations by the authors using Statistics Canada’s SPSD/M.
Income Group Total Flat Tax Paid to Total Income (%)
Current PIT to Total
Income (%)
Percentage Point Change
Federal Flat Tax Only to Total Income
(%)
Federal PIT Only to Total Income (%)
Percentage Point Change
Minimum — (10,000) 0.0 0.0 0.0 0.0 0.0 0.0
(9,999) — 0 0.0 0.0 0.0 0.0 0.0 0.0
1 — 10,000 1.0 0.3 0.7 0.6 0.2 0.4
10,001 — 20,000 8.4 4.5 3.9 5.3 3.0 2.3
20,001 — 30,000 15.5 11.3 4.2 9.9 7.0 2.9
30,001 — 40,000 19.0 15.9 3.1 12.2 9.9 2.3
40,001 — 50,000 20.8 20.0 0.8 13.3 12.5 0.8
50,001 — 60,000 21.9 22.7 (0.8) 14.0 14.3 (0.3)
60,001 — 70,000 22.3 24.1 (1.8) 14.3 15.2 (0.9)
70,001 — 80,000 22.5 25.8 (3.3) 14.8 16.8 (2.0)
80,001 — 90,000 23.0 27.8 (4.8) 15.0 17.7 (2.7)
90,001 — 100,000 23.2 29.1 (5.9) 15.1 18.4 (3.3)
100,001 — 110,000 23.6 30.1 (6.5) 15.2 18.7 (3.5)
110,001 — 120,000 23.1 30.9 (7.8) 15.2 19.8 (4.6)
120,001 — 130,000 23.7 31.3 (7.6) 15.5 19.9 (4.4)
130,001 — 140,000 23.6 31.2 (7.6) 15.5 20.0 (4.5)
140,001 — 150,000 24.1 31.8 (7.7) 15.6 19.4 (3.8)
150,001 — 200,000 23.8 32.8 (9.0) 15.4 20.3 (4.9)
200,001 — 250,000 24.8 36.4 (11.6) 16.0 22.3 (6.3)
250,001 — Maximum 25.1 40.9 (15.8) 16.3 24.8 (8.5)
Household 1 (Individual)
Household 2 (Two Earners)
Household 3 (One Earner)
Household 4 (Low Income)
Household 5 (High Income)
Base PIT 7,920 8,932 12,496 1,213 26,581
Combined flat tax 7,455 9,842 10,010 1,863 20,314
Nominal Difference (465) 910 (2,486) 650 (6,267)
Percent Change (5.9%) 10.2% (19.9%) 53.6% (23.6%)

The Fraser Institute Flat Tax 27
Case 3Personal exemption of $8,766
Case 3 includes an important addition to the value of thepersonal exemption. As discussed previously, the inclu-sion of a personal exemption is based on fairness. The taxsystem should allow individuals and families to earn acertain amount of money before they begin contributingto income tax revenues. However, the personal exemp-tion in the present income tax system is not based on anobjective criterion of how much money individuals andfamilies need to cover basic necessities. It is, rather, quitearbitrary.
The calculation and subsequent inclusion of an ex-emption valued at $8,766 is based on the pioneeringwork of Professor Christopher A. Sarlo, Senior Fellow ofthe Fraser Institute (Sarlo 1996; Sarlo 1998; and a seriesof articles printed in Fraser Forum over the last threeyears all dealing with poverty. Professor Sarlo has revolu-tionized the way Canadians think about poverty by calcu-lating an absolute, as opposed to the conventionally usedrelative, estimate of poverty. Professor Sarlo’s work utiliz-es a “basic needs” definition of poverty. This basic-needspoverty line determines the cost of a list of necessities re-quired for physical maintenance and good health on anongoing basis. The list includes items such as nutritiousfood, adequate shelter, appropriate clothing, necessaryhealth care, required transportation, and basic telecom-munications.
The personal exemption of $8,766 is calculated bytaking the highest provincial line (British Columbia) andadjusting it by the Consumer Price index (CPI) to reflect a2000 value. It would, therefore, afford citizens in anyprovince the ability to earn a sufficient amount of moneyto provide basic needs for themselves and their families.In Case 3, then, the personal exemption increases $1,535,from $7,231 to $8,766, an increase of 21.2%.
If government revenues are to remain unchanged,this increase of 21.2% in the value of the personal exemp-tion requires that the rates of taxation for the provincesand federal government also increase. The federal flat-taxrate increases from 16.7% with an exemption of $7,231 to17.8% with an exemption of $8,766, an increase of 1.1percentage points (table 3.3.1). Similarly, Quebec’s pro-vincial flat-tax rate increases 0.9 percentage point, from
13.1% to 14.0% and the provincial rate for Ontario increas-es 0.4 percentage point, from 7.5% to 7.9%.
Quebec maintains the highest combined federal-provincial flat-tax rate. Its combined tax increases 2.0 per-centage points, increasing from 29.8% with a $7,231 ex-emption to 31.8% with an $8,766 exemption. Similarly,Ontario, with the lowest flat-tax incurs rate a 1.5 percent-age point increase in its combined flat tax, increasingfrom 24.2% to 25.7%.
The effect of increasing the personal exemption isthe same as the re-introduction of the exemption present-ed in Case 2. Increasing the personal exemption furtherdecreases the shift in the tax burden from those withhigh-incomes to those with lower- and middle-incomes.
Table 3.3.1: Flat tax rates (Case 3)
Based on calculations by the authors using Statistics Canada’s
SPSD/M.
* Calculated using the weighted provincial average of 10.0%.
† Does not account for the current opting out arrangement
(CHST and youth allowance abatements) that Quebec has with
the federal government. Accounting for this agreement yields
an adjusted federal flat tax rate of 14.5% for Quebec only and
an adjusted Quebec provincial flat tax of 17.3%. Note that the
adjustment does not affect Quebec’s combined federal-pro-
vincial flat-tax rate.
Rate of Jurisdiction
Combined Federal/ Provincial Rate
Federal 17.8 27.8*
Newfoundland 11.9 27.7
Prince Edward Island 10.3 28.1
Nova Scotia 10.0 27.8
New Brunswick 10.7 28.5
Quebec† 14.0 31.8
Ontario 7.9 25.7
Manitoba 11.4 29.2
Saskatchewan 11.6 29.4
Alberta 8.9 26.7
British Columbia 9.8 27.6

28 Critical Issues Bulletin The Fraser Institute
The increased burden or personal income tax for thoseearning less than $40,000 is reduced relative to Case 2.For instance, the increase in income tax for those earningbetween $10,001 and $20,000 is reduced from $575 withan exemption of $7,231 to an increase of $317 with an ex-emption of $8,766 (table 3.3.2).
Similarly, the tax reduction for those earning high-income is also lessened. For instance, incomes above$250,000 show a 9.8% decrease in the value of their taxreduction, from $77,424 with a $7,231 exemption to$69,871 with an exemption of $8,766. The income groupat which taxpayers receive a decrease in their personal in-come tax burden remains the same as in Case 2 ($50,001to $60,000).
Table 3.3.3 reiterates the findings contained in theprevious tax distribution table (table 3.3.2): it shows thatthe increase in the value of the personal exemption less-
ens further the shift of the tax burden from upper-incomegroups to lower-income and middle-income groups.
Table 3.3.4 presents the effects of increasing thepersonal exemption on our representative households.Like Case 2, the individual earner (household 1) continuesto experience a tax reduction but it is less than it is inCase 1 or 2: a decrease of $389, representing a reductionof 4.9% compared to the status quo.
As it did in the previous two cases, the experienceof the two households with similar incomes differs. Thedual-income household (household 2) again incurs an in-crease in its income tax, although to a much lesser extentthan in previous cases: $741, an increase of 8.3% relativeto the amount of income tax paid under the status quo.The single-income household (household 3), on the otherhand, shows a $2,644 decline in its income tax, a declineof 21.2% relative to the amount of income taxes paid un-
Table 3.3.2: Tax distribution (Case 3)
Based on calculations by the authors using Statistics Canada’s SPSD/M.
Income Group Total Flat Tax Revenue
Total Current Tax Revenue
Change in Tax Revenue
Net Income Number of Individuals
Per-capita Tax Difference
($millions) ($millions) ($millions) ($millions) (thousands) ($)
Minimum — (10,000) 0 0 0 0 12 0
(9,999) — 0 0 0 0 0 7,385 0
1 — 10,000 42 67 (25) 17,578 5,563 (5)
10,001 — 20,000 5,608 3,795 1,813 65,443 5,717 317
20,001 — 30,000 13,975 10,781 3,194 85,172 3,835 833
30,001 — 40,000 18,574 15,702 2,872 94,506 2,838 1,012
40,001 — 50,000 18,262 17,393 869 85,171 1,947 446
50,001 — 60,000 17,044 17,261 (216) 75,371 1,397 (155)
60,001 — 70,000 11,484 12,062 (578) 49,512 772 (748)
70,001 — 80,000 8,153 9,039 (886) 34,889 472 (1,875)
80,001 — 90,000 5,219 6,078 (859) 21,838 259 (3,316)
90,001 — 100,000 3,569 4,286 (716) 14,640 155 (4,603)
100,001 — 110,000 2,578 3,151 (572) 10,350 100 (5,719)
110,001 — 120,000 2,085 2,664 (579) 8,495 75 (7,657)
120,001 — 130,000 1,637 2,063 (425) 6,551 53 (8,022)
130,001 — 140,000 1,309 1,650 (341) 5,243 39 (8,662)
140,001 — 150,000 787 988 (201) 3,077 21 (9,367)
150,001 — 200,000 3,374 4,424 (1,050) 13,157 78 (13,318)
200,001 — 250,000 2,143 2,986 (843) 8,153 36 (22,930)
250,001 — Maximum 8,256 12,648 (4,392) 30,686 62 (69,871)

The Fraser Institute Flat Tax 29
der the status quo. Again, it is important to note that bothfamily households pay approximately the same percent-age of total household income in income taxes (17.4%) un-der the flat tax.
The increase in the amount of the personal exemp-tion causes the low-income household (household 4) to
experience a minor reduction of $23 in the amount of in-come taxes paid, a 1.9% reduction relative to the tax cur-rently assessed. The affluent household (household 5)also experiences a reduction in income tax, $5,775, whichis less than in previous cases.
Table 3.3.3: Relative measures of tax changes (Case 3)
Based on calculations by the authors using Statistics Canada’s SPSD/M.
Table 3.3.4: Effect on sample households (Case 3)
Based on calculations by the authors using Statistics Canada’s SPSD/M.
Income Group Total Flat Tax Paid to Total Income (%)
Current PIT to Total
Income (%)
Percentage Point Change
Federal Flat Tax Only to Total Income
(%)
Federal PIT Only to Total Income (%)
Percentage Point Change
Minimum — (10,000) 0.0 0.0 0.0 0.0 0.0 0.0
(9,999) — 0 0.0 0.0 0.0 0.0 0.0 0.0
1 — 10,000 0.2 0.3 0.1 0.1 0.2 0.1
10,001 — 20,000 6.6 4.5 2.1 4.2 3.0 1.2
20,001 — 30,000 14.7 11.3 3.4 9.3 7.0 2.3
30,001 — 40,000 18.8 15.9 2.9 12.0 9.9 2.1
40,001 — 50,000 21.0 20.0 1.0 13.4 12.5 0.9
50,001 — 60,000 22.4 22.7 (0.3) 14.3 14.3 0.0
60,001 — 70,000 22.9 24.1 (1.2) 14.7 15.2 (0.5)
70,001 — 80,000 23.3 25.8 (2.5) 15.3 16.8 (1.5)
80,001 — 90,000 23.9 27.8 (3.9) 15.5 17.7 (2.2)
90,001 — 100,000 24.2 29.1 (4.9) 15.7 18.4 (2.7)
100,001 — 110,000 24.6 30.1 (5.5) 15.9 18.7 (2.8)
110,001 — 120,000 24.1 30.8 (6.7) 15.9 19.8 (3.9)
120,001 — 130,000 24.8 31.3 (6.5) 16.2 19.9 (3.7)
130,001 — 140,000 24.8 31.2 (6.4) 16.2 20.0 (3.8)
140,001 — 150,000 25.3 31.8 (6.5) 16.3 19.4 (3.1)
150,001 — 200,000 25.0 32.8 (7.8) 16.2 20.3 (4.1)
200,001 — 250,000 26.1 36.4 (10.3) 16.9 22.3 (5.4)
250,001 — Maximum 26.7 40.9 (14.2) 17.3 24.8 (7.5)
Household 1 (Individual)
Household 2 (Two Earners)
Household 3 (One Earner)
Household 4 (Low Income)
Household 5 (High Income)
Base PIT 7,920 8,932 12,496 1,213 26,581
Combined flat tax 7,531 9,673 9,852 1,190 20,806
Nominal Difference (389) 741 (2,644) (23) (5,775)
Percent Change (4.9%) 8.3% (21.2%) (1.9%) (21.7%)

30 Critical Issues Bulletin The Fraser Institute
Case 4Personal exemption of $17,532
Case 4 is an extension of the previous case: the personalexemption is doubled to $17,532, about the level atwhich many social-welfare groups suggest that an individ-ual has sufficient income to enjoy what they consider tobe a satisfactory degree of physical and emotional com-fort relative to other Canadians.
These relative “poverty lines” that are promulgatedby social-welfare groups have no official status as povertylines. Indeed, Statistics Canada’s Low Income Cut-Off(LICO), often referred to as “Canada’s poverty line,” is al-ways accompanied by a disclaimer that LICOs should notbe used as poverty lines (Sarlo 1996). Case 4 is includedto show what the effect on the tax rates would be if a flattax with a very high personal exemption were adopted.
The rates for the federal and provincial govern-ments significantly increase as the value of the personalexemption doubles from Case 3 ($8,766) and increases by142.5% from Case 2 ($7,231). The doubling of the value ofthe personal exemption increases the applicable flat-taxrate. For instance, the federal flat tax increases 8.3 per-centage points, from 17.8% in Case 3 to 26.1% in this case.Quebec, the jurisdiction that consistently maintains thehighest rate of taxation shows a 7.7 percentage point in-crease in its provincial rate, from 14.0% with an $8,766 ex-emption to 21.7% with an exemption of $17,532.Similarly, Ontario, the jurisdiction with the lowest flat-taxrate, shows an increase of 3.3 percentage points in itsprovincial rate, from 7.9% to 11.2%.
Ontario incurs one of the smaller combined per-centage-point increases in its combined flat-tax rate, 11.6percentage points, from 25.7% to 37.3%. Quebec incursone of the larger percentage-point increases of 16.0 per-centage points, from 31.8% to 47.8%. Newfoundland showsthe largest percentage-point increase in its combined fed-eral-provincial rate, increasing from 27.7% in Case 3 to46.2% in Case 4, an increase of 18.5 percentage points.
The substantial increase in the personal exemptionhas a peculiar affect on the distribution of taxation. Theeffect of the increase is to restrict tax reductions to verylow and extremely high levels of income. In this case, in-comes between $0 and $40,000 and above $200,001show a net decrease in personal income taxes, while in-
comes between $40,001 and $200,000 show a net in-crease in personal income taxes (table 3.4.2).
The relative indicators of the change in the distri-bution of income tax echo the findings above: by dou-bling the personal exemption those at the very low andhigh ends of the income spectrum gain while the majorityof taxpayers in the middle-income group experience anincrease in their income tax bill (table 3.4.3).
Table 3.4.4 shows the effects that doubling the per-sonal exemption has on the personal income tax of thesample households. Case 4, which is characterized by asignificant increase in the personal exemption, is the firstcase in which all five households show a reduction in theirincome tax.
Table 3.4.1: Flat tax rates (Case 4)
Based on calculations by the authors using Statistics Canada’s
SPSD/M.
* Calculated using the weighted provincial average of 14.8%.
† Does not account for the current opting out arrangement
(CHST and youth allowance abatements) that Quebec has with
the federal government. Accounting for this agreement yields
an adjusted federal flat tax rate of 21.0% for Quebec only and
an adjusted Quebec provincial flat tax of 26.8%. Note that the
adjustment does not affect Quebec’s combined federal-pro-
vincial flat-tax rate.
Rate of Jurisdiction
Combined Federal/ Provincial Rate
Federal 26.1 40.9*
Newfoundland 20.1 46.2
Prince Edward Island 17.5 43.6
Nova Scotia 16.9 43.0
New Brunswick 17.3 43.4
Quebec† 21.7 47.8
Ontario 11.2 37.3
Manitoba 16.9 43.0
Saskatchewan 17.9 44.0
Alberta 12.7 38.8
British Columbia 14.1 40.2

The Fraser Institute Flat Tax 31
The individual household (household 1) experienc-es a tax reduction smaller than in previous examples:$303, a 3.8% reduction relative to the household’s currentincome tax.
Unlike the situation in previous cases, in Case 4both households with similar incomes experience a re-duction in their income tax bills. However, the size of thereduction differs substantially: the two-income house-hold (household 2) shows a $1,483 reduction in incometax, a 16.6% reduction relative to the status quo. The sin-gle-income household (household 3) shows a reduction of$4,788, a 38.3% reduction in its income tax compared toits current income-tax liability.
In Case 4 we first notice a very small difference inthe percentage of household income paid to income taxesby households 2 and 3. Household 2, the dual-incomehousehold, pays 13.3% of its total household income to in-come tax while the single-earner household (household 3)pays 13.6%. As one would expect, the low-income house-hold (household 4) pays absolutely no income tax since thetotal household income is well below the value of the com-bined exemption. Interestingly, the high-income house-hold (household 5) also shows a reduction in its incometax: $3,047, a reduction of 11.5% relative to the status quo.
Please note that Cases 5 through 9 will be com-pared with Cases 1 through 3 only; Case 4 will be ignored.
Table 3.4.2: Tax distribution (Case 4)
Income Group Total Flat Tax Revenue
Total Current Tax Revenue
Change in Tax Revenue
Net Income Number of Individuals
Per-capita Tax Difference
($millions) ($millions) ($millions) ($millions) (thousands) ($)
Minimum — (10,000) 0 0 0 0 12 0
(9,999) — 0 0 0 0 0 7,385 0
1 — 10,000 0 67 (67) 17,578 5,563 (12)
10,001 — 20,000 233 3,795 (3,562) 65,443 5,717 (623)
20,001 — 30,000 7,390 10,781 (3,391) 85,172 3,835 (884)
30,001 — 40,000 15,319 15,702 (383) 94,506 2,838 (135)
40,001 — 50,000 18,188 17,393 795 85,171 1,947 409
50,001 — 60,000 18,684 17,261 1,423 75,371 1,397 1,019
60,001 — 70,000 13,267 12,062 1,205 49,512 772 1,559
70,001 — 80,000 9,806 9,039 766 34,889 472 1,623
80,001 — 90,000 6,416 6,078 337 21,838 259 1,304
90,001 — 100,000 4,520 4,286 233 14,640 155 1,500
100,001 — 110,000 3,324 3,151 173 10,350 100 1,734
110,001 — 120,000 2,700 2,664 36 8,495 75 480
120,001 — 130,000 2,156 2,063 93 6,551 53 1,756
130,001 — 140,000 1,725 1,650 75 5,243 39 1,914
140,001 — 150,000 1,056 988 67 3,077 21 3,129
150,001 — 200,000 4,564 4,424 140 13,157 78 1,775
200,001 — 250,000 2,962 2,986 (23) 8,153 36 (646)
250,001 — Maximum 11,790 12,648 (858) 30,686 62 (13,659)

32 Critical Issues Bulletin The Fraser Institute
Table 3.4.3: Relative measures of tax changes (Case 4)
Based on calculations by the authors using Statistics Canada’s SPSD/M.
Table 3.4.4: Effect on sample households (Case 4)
Based on calculations by the authors using Statistics Canada’s SPSD/M.
Income Group Total Flat Tax Paid to Total Income (%)
Current PIT to Total
Income (%)
Percentage Point Change
Federal Flat Tax Only to Total Income
(%)
Federal PIT Only to Total Income (%)
Percentage Point Change
Minimum — (10,000) 0.0 0.0 0.0 0.0 0.0 0.0
(9,999) — 0 0.0 0.0 0.0 0.0 0.0 0.0
1 — 10,000 0.0 0.3 (0.3) 0.0 0.0 0.0
10,001 — 20,000 0.3 4.5 (4.2) 0.2 3.0 (2.8)
20,001 — 30,000 7.8 11.3 (3.5) 4.9 7.0 (2.1)
30,001 — 40,000 15.5 15.9 (0.4) 9.9 9.9 0.0
40,001 — 50,000 20.9 20.0 0.9 13.3 12.5 0.8
50,001 — 60,000 24.5 22.7 1.8 15.6 14.3 1.3
60,001 — 70,000 26.5 24.1 2.4 17.0 15.2 1.8
70,001 — 80,000 28.0 25.8 2.2 18.4 16.8 1.6
80,001 — 90,000 29.3 27.8 1.5 19.1 17.7 1.4
90,001 — 100,000 30.7 29.1 1.6 19.9 18.4 1.5
100,001 — 110,000 31.7 30.1 1.6 20.4 18.7 1.7
110,001 — 120,000 31.3 30.8 0.5 20.6 19.8 0.8
120,001 — 130,000 32.7 31.3 1.4 21.4 19.9 1.5
130,001 — 140,000 32.6 31.2 1.4 21.4 20.0 1.4
140,001 — 150,000 33.9 31.8 2.1 21.8 19.4 2.4
150,001 — 200,000 33.8 32.8 1.0 22.0 20.3 1.7
200,001 — 250,000 36.1 36.4 (0.3) 23.2 22.3 0.9
250,001 — Maximum 38.1 40.9 (2.8) 24.7 24.8 (0.1)
Household 1 (Individual)
Household 2 (Two Earners)
Household 3 (One Earner)
Household 4 (Low Income)
Household 5 (High Income)
Base PIT 7,920 8,932 12,496 1,213 26,581
Combined flat tax 7,617 7,449 7,708 0 23,534
Nominal Difference (303) (1,483) (4,788) (1,213) (3,047)
Percent Change (3.8%) (16.6%) (38.3%) (100.0%) (11.5%)

The Fraser Institute Flat Tax 33
Case 5Personal exemption of $8,766 + exemption of $2,000 per child
Case 5 is the first to include an exemption of $2,000 perchild under the age of 18. Case 5 is the same as Case 3 ex-cept for the inclusion of an exemption for children. Thenature of the exemption for children, however, is differentfrom the personal exemption in that it is available only tohouseholds with children: while the personal exemptionapplies equally to all taxpayers, the exemption for chil-dren does not.
This exemption of $2000 per child demonstrates aconsistent approach to calculating exemptions for basicneeds. It acknowledges the additional cost of acquiringbasic needs that are borne by families in the raising ofchildren. It also stands in contrast to the current tax sys-tem, which effectively rewards parents that choose tohave other people care for their children part of the timewhile penalizing parents that choose to look after theirchildren full-time. In other words, the current system dis-criminates in favour of one group of parents at the ex-pense of all others.
Unsurprisingly, the rate of the flat tax increases forall jurisdictions. For instance, the federal rate for the flattax increases 0.5 percentage points, from 17.8% with apersonal exemption of $8,766 (Case 3) to 18.3% with boththe personal exemption of $8,766 and the exemption of$2,000 per child (Case 5) (table 3.5.1).
Quebec has the highest combined federal-provin-cial tax rate of 32.8%, an increase of 1.0 percentage pointfrom its level of 31.8% in Case 3. Ontario possesses thelowest combined rate of flat tax, 26.4%. It showed a 0.7percentage point increase in the combined federal-pro-vincial tax rate from its rate in Case 3.
As in the previous cases (excluding Case 4), theaddition of an exemption—an exemption for children, inthis case—reduces the shift in the tax burden fromthose earning high incomes to those earning low andmiddle incomes. Put another way, the amount of tax re-duction for those earning high incomes is reduced whilethe increase in the tax burden for those earning low andmiddle incomes is lessened. For instance, the tax reduc-tion for those earning in excess of $250,000, the highestincome bracket, is reduced from $69,871 with a person-al exemption of $8,766 to $66,632 when both the per-
sonal exemption ($8,766) and the exemption forchildren ($2,000 per child) are included (table 3.5.2).Those earning between $40,001 and $50,000 show a re-duction in their tax increase from $446 in Case 3 to $372in Case 5.
Table 3.5.4 presents the effects that the introduc-tion of the exemption of $2000 per child has on our rep-resentative households. Like the previous cases, theindividual (household 1) continues to experience a taxreduction. The reduction is less than it was in previouscases, however, due to the interaction between the ex-emption for children, which the single individual can-not claim, and the subsequent increase in the rate ofthe flat tax.
Table 3.5.1: Flat tax rates (Case 5)
Based on calculations by the authors using Statistics Canada’s
SPSD/M.
* Calculated using the weighted provincial average of 10.3%.
† Does not account for the current opting out arrangement
(CHST and youth allowance abatements) that Quebec has with
the federal government. Accounting for this agreement yields
an adjusted federal flat tax rate of 15.0% for Quebec only and
an adjusted Quebec provincial flat tax of 17.8%. Note that the
adjustment does not affect Quebec’s combined federal-pro-
vincial flat-tax rate.
Rate of Jurisdiction
Combined Federal/ Provincial Rate
Federal 18.3 28.6*
Newfoundland 12.4 30.7
Prince Edward Island 10.7 29.0
Nova Scotia 10.4 28.7
New Brunswick 11.1 29.4
Quebec† 14.5 32.8
Ontario 8.1 26.4
Manitoba 11.7 30.0
Saskatchewan 12.0 30.3
Alberta 9.2 27.5
British Columbia 10.0 28.3

34 Critical Issues Bulletin The Fraser Institute
Both households with similar incomes (households2 and 3) receive a reduction in their income tax, althoughonce again these reductions differ considerably. The dual-income household (household 2) shows a minor reduc-tion of $54 in its income tax, a decrease of 0.6% relativeto the status quo.
The single-income household (household 3) showsa much larger reduction of $3,434, a 27.5% reduction in itsincome tax compared to the status quo. As in most of theprevious cases, both households bear nearly the same
burden of income tax: 15.9% (household 2) and 16.0%(household 3) as a percentage of total household income.
The low-income household (household 4) experi-ences a significant reduction of 86.5% from its current in-come tax when the needs-based personal exemption of$8,766 is coupled with the moderately valued exemptionof $2,000 per child. The high-income household (house-hold 5) also receives a reduction in its income tax bill,$5,737, a 21.6% reduction relative to the status quo.
Table 3.5.2: Tax distribution (Case 5)
Based on calculations by the authors using Statistics Canada’s SPSD/M.
Income Group Total Flat Tax Revenue
Total Current Tax Revenue
Change in Tax Revenue
Net Income Number of Individuals
Per-capita Tax Difference
($millions) ($millions) ($millions) ($millions) (thousands) ($)
Minimum — (10,000) 0 0 0 0 12 0
(9,999) — 0 0 0 0 0 7,385 0
1 — 10,000 43 67 (24) 17,578 5,563 (4)
10,001 — 20,000 5,643 3,795 1,847 65,443 5,717 323
20,001 — 30,000 13,825 10,781 3,043 85,172 3,835 794
30,001 — 40,000 18,402 15,702 2,699 94,506 2,838 951
40,001 — 50,000 18,117 17,393 724 85,171 1,947 372
50,001 — 60,000 16,982 17,261 (278) 75,371 1,397 (199)
60,001 — 70,000 11,472 12,062 (590) 49,512 772 (764)
70,001 — 80,000 8,179 9,039 (859) 34,889 472 (1,819)
80,001 — 90,000 5,248 6,078 (830) 21,838 259 (3,204)
90,001 — 100,000 3,599 4,286 (687) 14,640 155 (4,414)
100,001 — 110,000 2,611 3,151 (539) 10,350 100 (5,383)
110,001 — 120,000 2,113 2,664 (550) 8,495 75 (7,282)
120,001 — 130,000 1,660 2,063 (402) 6,551 53 (7,581)
130,001 — 140,000 1,329 1,650 (321) 5,243 39 (8,155)
140,001 — 150,000 797 988 (191) 3,077 21 (8,894)
150,001 — 200,000 3,431 4,424 (993) 13,157 78 (12,592)
200,001 — 250,000 2,189 2,986 (797) 8,153 36 (21,686)
250,001 — Maximum 8,460 12,648 (4,188) 30,686 62 (66,632)

The Fraser Institute Flat Tax 35
Table 3.5.3: Relative measures of tax changes (Case 5)
Based on calculations by the authors using Statistics Canada’s SPSD/M.
Table 3.5.4: Effect on sample households (Case 5)
Based on calculations by the authors using Statistics Canada’s SPSD/M.
Income Group Total Flat Tax Paid to Total Income (%)
Current PIT to Total
Income (%)
Percentage Point Change
Federal Flat Tax Only to Total Income
(%)
Federal PIT Only to Total Income (%)
Percentage Point Change
Minimum — (10,000) 0.0 0.0 0.0 0.0 0.0 0.0
(9,999) — 0 0.0 0.0 0.0 0.0 0.0 0.0
1 — 10,000 0.2 0.3 (0.1) 0.1 0.2 (0.1)
10,001 — 20,000 6.7 4.5 2.2 4.2 3.0 1.2
20,001 — 30,000 14.6 11.3 3.3 9.2 7.0 2.2
30,001 — 40,000 18.7 15.9 2.8 11.9 9.9 2.0
40,001 — 50,000 20.8 20.0 0.8 13.3 12.5 0.8
50,001 — 60,000 22.3 22.7 (0.4) 14.3 14.3 0.0
60,001 — 70,000 22.9 24.1 (1.2) 14.7 15.2 (0.5)
70,001 — 80,000 23.3 25.8 (2.5) 15.3 16.8 (1.5)
80,001 — 90,000 24.0 27.8 (3.8) 15.6 17.7 (2.1)
90,001 — 100,000 24.4 29.1 (4.7) 15.9 18.4 (2.5)
100,001 — 110,000 24.9 30.1 (5.2) 16.1 18.7 (2.6)
110,001 — 120,000 24.5 30.8 (6.3) 16.1 19.8 (3.7)
120,001 — 130,000 25.2 31.3 (6.1) 16.5 19.9 (3.4)
130,001 — 140,000 25.1 31.2 (6.1) 16.5 20.0 (3.5)
140,001 — 150,000 25.6 31.8 (6.2) 16.5 19.4 (2.9)
150,001 — 200,000 25.4 32.8 (7.4) 16.5 20.3 (3.8)
200,001 — 250,000 26.7 36.4 (9.7) 17.2 22.3 (5.1)
250,001 — Maximum 27.3 40.9 (13.6) 17.7 24.8 (7.1)
Household 1 (Individual)
Household 2 (Two Earners)
Household 3 (One Earner)
Household 4 (Low Income)
Household 5 (High Income)
Base PIT 7,920 8,932 12,496 1,213 26,581
Combined flat tax 7,736 8,878 9,062 164 20,844
Nominal Difference (184) (54) (3,434) (1,049) (5,737)
Percent Change (2.3%) (0.6%) (27.5%) (86.5%) (21.6%)

36 Critical Issues Bulletin The Fraser Institute
Case 6Personal exemption of $8,766 + exemption of $2,000 per child + current RRSP/RPP deduction
Case 6 introduces deductions from taxable income forcontributions made to Registered Retirement SavingsPlans (RRSP) and Registered Pension Plans (RPP). Current-ly, individuals are able to contribute up to 18% of eligiblewages to either an RRSP or an RPP, up to a limit of $13,500per year. These deductions for RRSP/RPP contributionsare added to the personal exemption of $8,766 and theexemption of $2,000 for children used in the calculationsin Case 5.
There are three important considerations regard-ing the inclusion of RRSP and RPP contributions. First,contributions are made to savings earmarked for retire-ment exclusively. Since current government programs forretirement savings do not provide sufficient income forretirement, individuals must save independently of gov-ernment plans for retirement (Income Security Programs
Table 3.6.1: Flat tax rates (Case 6)
Based on calculations by the authors using Statistics Canada’s
SPSD/M.
* Calculated using the weighted provincial average of 11.1%.
† Does not account for the current opting out arrangement
(CHST and youth allowance abatements) that Quebec has with
the federal government. Accounting for this agreement yields
an adjusted federal flat tax rate of 16.2% for Quebec only and
an adjusted Quebec provincial flat tax of 19.4%. Note that the
adjustment does not affect Quebec’s combined federal-pro-
vincial flat-tax rate.
Rate of Jurisdiction
Combined Federal/ Provincial Rate
Federal 19.9 31.0*
Newfoundland 13.6 33.5
Prince Edward Island 11.6 31.5
Nova Scotia 11.3 31.2
New Brunswick 12.0 31.9
Quebec† 15.7 35.6
Ontario 8.8 28.7
Manitoba 12.6 32.5
Saskatchewan 13.2 33.1
Alberta 9.9 29.8
British Columbia 10.9 30.8
Branch, Human Resources Development Canada 2000; Of-fice of the Superintendent of Financial Institutions 1997a,1997b; Canadian Institute of Actuaries 1995; Associationof Canadian Pension Management 1995, 2000; James1997; and Peterson1999). For this reason, some tax defer-ral is offered to those saving for retirement through pri-vate retirement savings programs.
The second consideration is much more importantand concerns the nature of tax systems. Allowing tax-sheltered contributions to RRSPs and RPPs moves the flattax closer to a tax on consumption and away from a taxon income. A variety of studies, most notably Jorgensenand Kun-Young 1991, have concluded that a tax on con-sumption is a much more efficient form of taxation thatcan reduce economic distortions and increase economicefficiency (Jorgensen and Kun-Young 1991; Kesselman1997, 1999; Kneller, Bleaney, and Gemmell 1999). Sincean overwhelming majority of Canadians save almost ex-clusively through RRSPs and RPPs,11 a tax system thatshelters the contributions made to RRSPs and RPPs fromcurrent taxation will be taxing consumption rather thanincome for the vast majority of Canadians.12 There is,therefore, an argument from economic efficiency to sup-port the inclusion of deductions for retirement savingsprograms like RRSPs and RPPs in a proposed flat tax.
Third, deductions from income for RRSP and RPPcontributions are not tax reductions or even what are of-ten referred to as tax expenditures. These deductions aretax deferrals (Association of Canadian Pension Manage-ment 2000.): contributors delay the requisite tax paymentuntil they have retired and use these savings to financetheir retirement. When the original contributions and theaccrued investment returns are removed from the RRSP orRPP to fund retirement, they are fully taxable.
Table 3.6.1 contains the rates for the flat tax in-cluding deductions from income for RRSP and RPP con-tributions.
The federal rate of flat tax increases 1.6 percentagepoints from its level in Case 5, from 18.3% to 19.9%. Que-bec continues to show the highest rate of flat tax of anyprovince; it has a 1.2 percentage point increase in its pro-vincial rate, from 14.5% to 15.7%. Quebec’s combined taxrate increases 2.8 percentage points, from 32.8% to 35.6%.Ontario, which continues to show the lowest provincial
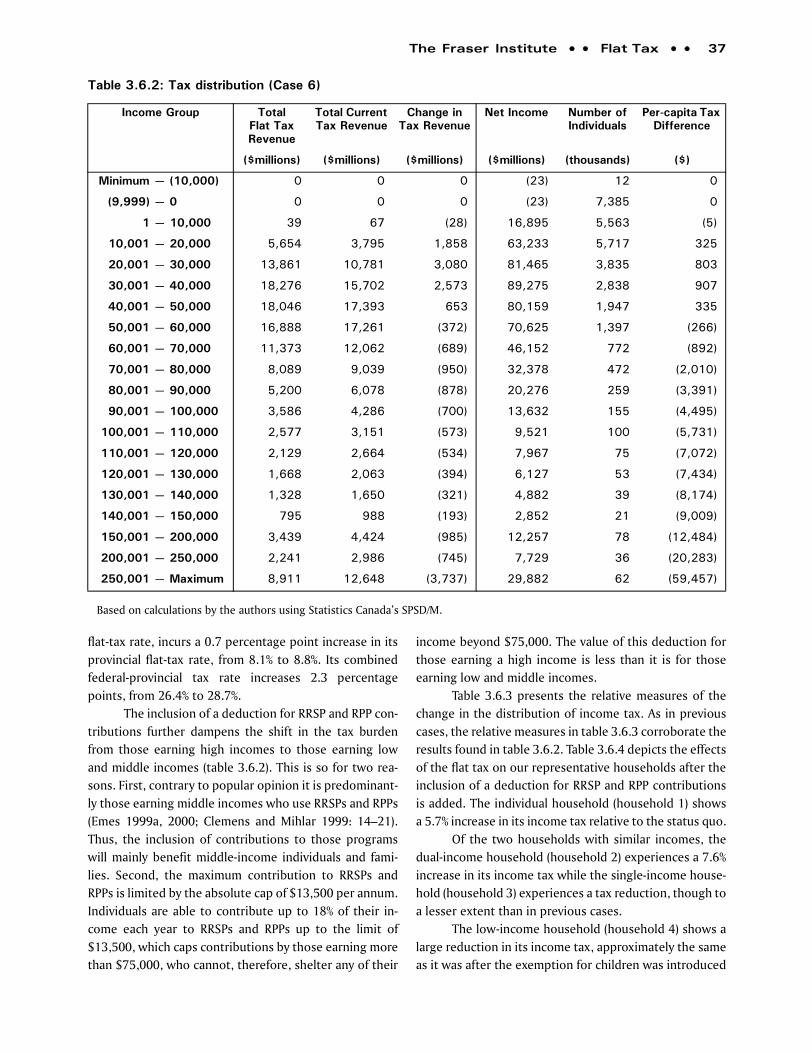
The Fraser Institute Flat Tax 37
flat-tax rate, incurs a 0.7 percentage point increase in itsprovincial flat-tax rate, from 8.1% to 8.8%. Its combinedfederal-provincial tax rate increases 2.3 percentagepoints, from 26.4% to 28.7%.
The inclusion of a deduction for RRSP and RPP con-tributions further dampens the shift in the tax burdenfrom those earning high incomes to those earning lowand middle incomes (table 3.6.2). This is so for two rea-sons. First, contrary to popular opinion it is predominant-ly those earning middle incomes who use RRSPs and RPPs(Emes 1999a, 2000; Clemens and Mihlar 1999: 14–21).Thus, the inclusion of contributions to those programswill mainly benefit middle-income individuals and fami-lies. Second, the maximum contribution to RRSPs andRPPs is limited by the absolute cap of $13,500 per annum.Individuals are able to contribute up to 18% of their in-come each year to RRSPs and RPPs up to the limit of$13,500, which caps contributions by those earning morethan $75,000, who cannot, therefore, shelter any of their
income beyond $75,000. The value of this deduction forthose earning a high income is less than it is for thoseearning low and middle incomes.
Table 3.6.3 presents the relative measures of thechange in the distribution of income tax. As in previouscases, the relative measures in table 3.6.3 corroborate theresults found in table 3.6.2. Table 3.6.4 depicts the effectsof the flat tax on our representative households after theinclusion of a deduction for RRSP and RPP contributionsis added. The individual household (household 1) showsa 5.7% increase in its income tax relative to the status quo.
Of the two households with similar incomes, thedual-income household (household 2) experiences a 7.6%increase in its income tax while the single-income house-hold (household 3) experiences a tax reduction, though toa lesser extent than in previous cases.
The low-income household (household 4) shows alarge reduction in its income tax, approximately the sameas it was after the exemption for children was introduced
Table 3.6.2: Tax distribution (Case 6)
Based on calculations by the authors using Statistics Canada’s SPSD/M.
Income Group Total Flat Tax Revenue
Total Current Tax Revenue
Change in Tax Revenue
Net Income Number of Individuals
Per-capita Tax Difference
($millions) ($millions) ($millions) ($millions) (thousands) ($)
Minimum — (10,000) 0 0 0 (23) 12 0
(9,999) — 0 0 0 0 (23) 7,385 0
1 — 10,000 39 67 (28) 16,895 5,563 (5)
10,001 — 20,000 5,654 3,795 1,858 63,233 5,717 325
20,001 — 30,000 13,861 10,781 3,080 81,465 3,835 803
30,001 — 40,000 18,276 15,702 2,573 89,275 2,838 907
40,001 — 50,000 18,046 17,393 653 80,159 1,947 335
50,001 — 60,000 16,888 17,261 (372) 70,625 1,397 (266)
60,001 — 70,000 11,373 12,062 (689) 46,152 772 (892)
70,001 — 80,000 8,089 9,039 (950) 32,378 472 (2,010)
80,001 — 90,000 5,200 6,078 (878) 20,276 259 (3,391)
90,001 — 100,000 3,586 4,286 (700) 13,632 155 (4,495)
100,001 — 110,000 2,577 3,151 (573) 9,521 100 (5,731)
110,001 — 120,000 2,129 2,664 (534) 7,967 75 (7,072)
120,001 — 130,000 1,668 2,063 (394) 6,127 53 (7,434)
130,001 — 140,000 1,328 1,650 (321) 4,882 39 (8,174)
140,001 — 150,000 795 988 (193) 2,852 21 (9,009)
150,001 — 200,000 3,439 4,424 (985) 12,257 78 (12,484)
200,001 — 250,000 2,241 2,986 (745) 7,729 36 (20,283)
250,001 — Maximum 8,911 12,648 (3,737) 29,882 62 (59,457)

38 Critical Issues Bulletin The Fraser Institute
in Case 5. Household 4 receives an 85.4% reduction intheir income tax relative to the status quo.
The high-income household (household 5) also re-ceives a reduction in its income tax, showing a 17.0% re-duction in income tax compared with its current income-tax liability.
The reason for the increase in income tax for thesingle individual (household 1) and the dual-income fam-ily household (household 2) and the relative reduction in
the decrease in the tax for households 3, 4, and 5 is thatnone of the households contributed to an RRSP or RPP forthe year in question. Thus, the increased rate of the flattax associated with the inclusion of RRSP and RPP contri-butions is not offset by a reduced amount of taxable in-come for any of these households. Incorporating differenthousehold profiles that had contributed to RRSPs or RPPswould result in a different effect depending on the mag-nitude of contributions to RRSPs and RPPs.
Table 3.6.3: Relative measures of tax changes (Case 6)
Based on calculations by the authors using Statistics Canada’s SPSD/M.
Table 3.6.4: Effect on sample households (Case 6)
Based on calculations by the authors using Statistics Canada’s SPSD/M.
Income Group Total Flat Tax Paid to Total Income (%)
Current PIT to Total
Income (%)
Percentage Point Change
Federal Flat Tax Only to Total Income
(%)
Federal PIT Only to Total Income (%)
Percentage Point Change
Minimum — (10,000) 0.0 0.0 0.0 0.0 0.0 0.0
(9,999) — 0 0.0 (0.0 0.0 0.0 0.0 0.0
1 — 10,000 0.1 0.3 (0.2) 0.1 0.2 (0.1)
10,001 — 20,000 6.7 4.5 2.2 4.2 3.0 1.2
20,001 — 30,000 14.6 11.3 3.3 9.2 7.0 2.2
30,001 — 40,000 18.5 15.9 2.6 11.9 9.9 2.0
40,001 — 50,000 20.7 20.0 0.7 13.3 12.5 0.8
50,001 — 60,000 22.2 22.7 (0.5) 14.2 14.3 (0.1)
60,001 — 70,000 22.7 24.1 (1.4) 14.6 15.2 (0.6)
70,001 — 80,000 23.1 25.8 (2.7) 15.2 16.8 (1.6)
80,001 — 90,000 23.8 27.8 (4.0) 15.5 17.7 (2.2)
90,001 — 100,000 24.3 29.1 (4.8) 15.8 18.4 (2.6)
100,001 — 110,000 24.6 30.1 (5.5) 15.9 18.7 (2.8)
110,001 — 120,000 24.7 30.8 (6.1) 16.2 19.8 (3.6)
120,001 — 130,000 25.3 31.3 (6.0) 16.5 19.9 (3.4)
130,001 — 140,000 25.1 31.2 (6.1) 16.5 20.0 (3.5)
140,001 — 150,000 25.5 31.8 (6.3) 16.5 19.4 (2.9)
150,001 — 200,000 25.5 32.8 (7.3) 16.6 20.3 (3.7)
200,001 — 250,000 27.3 36.4 (9.1) 17.6 22.3 (4.7)
250,001 — Maximum 28.8 40.9 (12.1) 18.7 24.8 (6.1)
Household 1 (Individual)
Household 2 (Two Earners)
Household 3 (One Earner)
Household 4 (Low Income)
Household 5 (High Income)
Base PIT 7,920 8,932 12,496 1,213 26,581
Combined flat tax 8,373 9,608 9,807 177 22,064
Nominal Difference 453 676 (2,689) (1,036) (4,517)
Percent Change 5.7% 7.6% (21.5%) (85.4%) (17.0%)

The Fraser Institute Flat Tax 39
Case 7Personal exemption of $8,766 + exemption of $2,000 per child + current RRSP/RPP deduction + current deduction for charitable donations
Case 7 adds a deduction for charitable donations to thethe exemptions and deductions for RRSP/RPP contribu-tions used in calculating Case 6. Currently, individuals arepermitted to claim donations made to registered charita-ble organizations, a tax credit of 17% of the first $200 and29% of the amount in excess of $200.
There is considerable debate among economistsand tax experts about the strength of tax incentives inmotivating individuals to donate to registered charities(Francis and Clemens 1999; Reynolds 1997). A number ofscholars have suggested that other factors, such as in-volvement with a charitable organization, disposable in-come, and religious activity are more important infostering charitable giving than is the level of tax credit af-forded charitable donations.13 Of Canadians surveyed inthe latest Statistics Canada survey of non-profit and vol-unteering activity, 89% indicated they were not motivatedby tax considerations when making charitable donations(Statistics Canada 1998). There are other factors in addi-tion to tax considerations that at least partially explaincharitable giving.
Implementing a simple tax system that encourageseconomic growth may accomplish much more in terms offostering increased charitable giving than including taxdeductibility for charitable giving (Chao and Grubel 1998;Emes and Samida, unpublished; Barro 1990; Peden 1989,1991; Mackness 1998; Grossman 1998; Scully 1991; Tanziand Schuknecht 1995, 1997).
The inclusion of charitable donations as a possibleexemption increases the rate of the flat tax for all jurisdic-tions by roughly 0.1 to 0.2 percentage point over those inCase 6 (table 3.7.1). The federal rate increases by 0.2 per-centage point, from 19.9% to 20.1%. Similarly, the rates forQuebec and Ontario increase by 0.1 percentage point.
Although the increases are relatively small, inclu-sion of charitable donations as a deduction is a concernbecause it could be the first step down a slippery-slope:if charitable donations are included in a proposed flat tax,then why not include other worthy tax-based incentives?The long-term effect of including a targeted tax reductionmay lead, as it has historically, to the inclusion of othertax-based incentive programs. The function of the tax sys-
tem, however, should be to collect sufficient revenues tofinance programs provided by the government in the leastdistortionary manner and the addition of tax incentivesmoves a tax system away from such neutrality.
Like the previous additions, the inclusion of thededuction for charitable donations reduces, though onlyto the slightest degree, the transfer of the tax burdenfrom those earning high incomes to those earning lowand middle incomes. Both table 3.7.2 (absolute analysis)and table 3.7.3 (relative analysis) illustrate how the intro-duction of the deduction for charitable donations less-ens, although only slightly, the shift in the tax distribu-tion from upper-income to lower-income and middle-income groups.
Table 3.7.1: Flat tax rates (Case 7)
Based on calculations by the authors using Statistics Canada’s
SPSD/M.
* Calculated using the weighted provincial average of 11.2%.
† Does not account for the current opting out arrangement
(CHST and youth allowance abatements) that Quebec has with
the federal government. Accounting for this agreement yields
an adjusted federal flat tax rate of 16.4% for Quebec only and
an adjusted Quebec provincial flat tax of 19.5%. Note that the
adjustment does not affect Quebec’s combined federal-pro-
vincial flat-tax rate.
Rate of Jurisdiction
Combined Federal/ Provincial Rate
Federal 20.1 31.3*
Newfoundland 13.7 33.8
Prince Edward Island 11.8 31.9
Nova Scotia 11.4 31.5
New Brunswick 12.2 32.3
Quebec† 15.8 35.9
Ontario 8.9 29.0
Manitoba 12.8 32.9
Saskatchewan 13.5 33.6
Alberta 10.0 30.1
British Columbia 11.0 31.1

40 Critical Issues Bulletin The Fraser Institute
As in Case 6, an interesting result occurs for ourrepresentative households when the deduction for chari-table donations is included (table 3.7.4). The individualhousehold (household 1) experiences a 6.7% increase inits income tax relative to the status quo. The dual-incomehousehold (household 2) incurs a 8.7% increase in incometax from the status quo while the single-income house-hold (household 3) experiences a 20.7% reduction in in-come tax relative to the status quo.
Both the low-income household (household 4) andthe high-income household (household 5) show a tax re-duction, although to a slightly lesser degree than in Case
6: 85.2% for household 5 and and 16.6% for household 6compared with the status quo.
The households show either an increase in incometax or a reduction in the decrease in income tax becausenone of the households claimed charitable deductions ontheir income-tax returns. Thus, the increased rate of theflat tax associated with the inclusion of charitable dona-tions as a deduction is not offset by a reduced income taxbill through a deduction for charitable donations. Analyz-ing different household profiles that claimed donations toa registered charity would result in a different effect, de-pending on the value of the donation.
Table 3.7.2: Tax distribution (Case 7)
Based on calculations by the authors using Statistics Canada’s SPSD/M.
Income Group Total Flat Tax Revenue
Total Current Tax Revenue
Change in Tax Revenue
Net Income Number of Individuals
Per-capita Tax Difference
($millions) ($millions) ($millions) ($millions) (thousands) ($)
Minimum — (10,000) 0 0 0 (23) 12 0
(9,999) — 0 0 0 0 (23) 7,385 0
1 — 10,000 39 67 (28) 16,895 5,563 (5)
10,001 — 20,000 5,588 3,795 1,792 63,233 5,717 314
20,001 — 30,000 13,843 10,781 3,061 81,465 3,835 798
30,001 — 40,000 18,277 15,702 2,574 89,275 2,838 907
40,001 — 50,000 18,064 17,393 671 80,159 1,947 345
50,001 — 60,000 16,925 17,261 (335) 70,625 1,397 (240)
60,001 — 70,000 11,370 12,062 (692) 46,152 772 (896)
70,001 — 80,000 8,095 9,039 (943) 32,378 472 (1,997)
80,001 — 90,000 5,208 6,078 (870) 20,276 259 (3,359)
90,001 — 100,000 3,595 4,286 (691) 13,632 155 (4,439)
100,001 — 110,000 2,585 3,151 (565) 9,521 100 (5,645)
110,001 — 120,000 2,140 2,664 (523) 7,967 75 (6,925)
120,001 — 130,000 1,673 2,063 (389) 6,127 53 (7,336)
130,001 — 140,000 1,328 1,650 (321) 4,882 39 (8,170)
140,001 — 150,000 792 988 (196) 2,852 21 (9,117)
150,001 — 200,000 3,440 4,424 (984) 12,257 78 (12,472)
200,001 — 250,000 2,241 2,986 (745) 7,729 36 (20,272)
250,001 — Maximum 8,896 12,648 (3,752) 29,882 62 (59,688)

The Fraser Institute Flat Tax 41
Table 3.7.3: Relative measures of tax changes (Case 7)
Based on calculations by the authors using Statistics Canada’s SPSD/M.
Table 3.7.4: Effect on sample households (Case 7)
Based on calculations by the authors using Statistics Canada’s SPSD/M.
Income Group Total Flat Tax Paid to Total Income (%)
Current PIT to Total
Income (%)
Percentage Point Change
Federal Flat Tax Only to Total Income
(%)
Federal PIT Only to Total Income (%)
Percentage Point Change
Minimum — (10,000) 0.0 0.0 0.0 0.0 0.0 0.0
(9,999) — 0 0.0 0.0 0.0 0.0 0.0 0.0
1 — 10,000 0.2 0.3 0.1 0.1 0.2 (0.1)
10,001 — 20,000 6.6 4.5 2.1 4.2 3.0 1.2
20,001 — 30,000 14.6 11.3 3.3 9.2 7.0 2.2
30,001 — 40,000 18.5 15.9 2.6 11.9 9.9 2.0
40,001 — 50,000 20.8 20.0 0.8 13.3 12.5 0.8
50,001 — 60,000 22.2 22.7 (0.5) 14.2 14.3 (0.1)
60,001 — 70,000 22.7 24.1 (1.4) 14.6 15.2 (0.6)
70,001 — 80,000 23.1 25.8 (2.7) 15.2 16.8 (1.6)
80,001 — 90,000 23.8 27.8 (4.0) 15.5 17.7 (2.2)
90,001 — 100,000 24.4 29.1 (4.7) 15.9 18.4 (2.5)
100,001 — 110,000 24.7 30.1 (5.4) 15.9 18.7 (2.8)
110,001 — 120,000 24.8 30.8 (6.0) 16.3 19.8 (3.5)
120,001 — 130,000 25.4 31.3 (5.9) 16.6 19.9 (3.3)
130,001 — 140,000 25.1 31.2 (6.1) 16.5 20.0 (3.5)
140,001 — 150,000 25.5 31.8 (6.3) 16.4 19.4 (3.0)
150,001 — 200,000 25.5 32.8 (7.3) 16.6 20.3 (3.7)
200,001 — 250,000 27.3 36.4 (9.1) 17.6 22.3 (4.7)
250,001 — Maximum 28.7 40.9 (12.2) 18.6 24.8 (6.2)
Household 1 (Individual)
Household 2 (Two Earners)
Household 3 (One Earner)
Household 4 (Low Income)
Household 5 (High Income)
Base PIT 7,920 8,932 12,496 1,213 26,581
Combined flat tax 8,447 9,712 9,914 179 22,157
Nominal Difference 527 780 (2,582) (1,034) (4,424)
Percent Change 6.7 8.7% (20.7%) (85.2%) (16.6%)

42 Critical Issues Bulletin The Fraser Institute
Case 8Personal exemption of $11,834 + exemption of $2,000 per child + current RRSP/RPP deduction + $13.4 billion reduction in spending and taxes
Case 8 is the first case that does not keep tax revenue un-changed. The amount of federal taxes collected under Case8 is $13.4 billion lower than it is in previous cases and theexisting tax system. Case 8 includes a $13.4 billion spend-ing reduction at the federal level coupled with a tax cut.14
This amount is based on the amount required to provide allincome groups a reduction in their income tax bill.15
Over the long term, taxes are a function of spend-ing. That is, the amount of tax revenue raised is directlyrelated to the amount expended by government. A reduc-tion in spending will, therefore, necessarily lead to a re-duction in the level of taxes required to generatesufficient revenue.
There are two other material differences betweenCase 7 and Case 8: the increase in the value of the person-
Table 3.8.1: Flat tax rates (Case 8)
Based on calculations by the authors using Statistics Canada’s
SPSD/M.
* Calculated using the weighted provincial average of 12.9%.
† Does not account for the current opting out arrangement
(CHST and youth allowance abatements) that Quebec has with
the federal government. Accounting for this agreement yields
an adjusted federal flat tax rate of 14.7% for Quebec only and
an adjusted Quebec provincial flat tax of 22.8%. Note that the
adjustment does not affect Quebec’s combined federal-pro-
vincial flat-tax rate.
Rate of Jurisdiction
Combined Federal/ Provincial Rate
Federal 19.0 31.9*
Newfoundland 16.8 35.8
Prince Edward Island 14.1 33.1
Nova Scotia 13.7 32.7
New Brunswick 14.3 33.3
Quebec† 18.5 37.5
Ontario 10.0 29.0
Manitoba 14.6 33.6
Saskatchewan 15.6 34.6
Alberta 11.3 30.3
British Columbia 12.5 31.5
al exemption and the absence of a deduction for charita-ble donations. The value of the personal exemptionincluded in Case 8 is 1.35 times the value of the personalexemption in Case 7. This means that Canadians would beable to earn at least 35% more than is necessary to sustaina minimum standard of living as calculated by our infla-tion-adjusted Basic Needs Line. Further, as illustrated intable 3.8.2, the increased personal exemption ensuresthat the tax reduction flows to all groups of taxpayers sothat every income group receives a reduction in com-bined federal-provincial personal income taxes.
Case 8 provides a balanced approach to the imple-mentation of a flat tax. The proposal includes a sizable ex-emption for individuals and a large exemption forchildren. Further, it retains the deductibility of RRSP andRPP contributions in order to stimulate retirement sav-ings and to move the tax system towards a system basedmore on consumption than on income.
In assessing the effect of increasing the personalexemption and implementing a spending reduction, wecompare Case 8 with Case 6 rather than Case 7, since thededuction for charitable donations has been eliminated.The federal rate of flat tax decreases by 0.9 percentagepoint, from 19.9% to 19.0% while at the same time the per-sonal exemption increases by 35% (table 3.8.1).
One of the interesting effects of reducing spendingexclusively at the federal level while increasing the per-sonal exemption at both the federal and provincial levelsis that every one of the provinces shows an increase inprovincial rates of flat tax. In other words, to compensatefor the increased value of the personal exemption whilestill generating sufficient revenue in a static model, eachprovince’s tax rate in Case 8 has increased from what itwas in Case 6. For instance, Quebec, with the highest taxrate of any province, shows an increase of 2.8 percentagepoints in its provincial rate. Similarly, Ontario, with thelowest rate incurs an increase in its provincial rate of 1.2percentage points from 8.8% to 10.0%.
Each of the provinces shows a net increase in itscombined federal-provincial tax rate due to the fact that in-creases in the provincial tax rates exceed the reduction of0.9 percentage point in the federal tax rate.16 For instance,Newfoundland shows the largest increase of all the prov-

The Fraser Institute Flat Tax 43
inces in its combined federal-provincial tax rate, increasing2.3 percentage points, from 33.5% to 35.8%. Ontario, onthe other hand, shows the smallest net increase of 0.3 per-centage point, with an increase from 28.7% to 29.0%.
When compared with Case 6, the most noticeablechange in table 3.8.2 and table 3.8.3 is that all incomegroups receive a reduction in their combined federal-pro-vincial personal income tax. The large personal exemp-tion and the exemption for children coupled withreductions in spending and taxes result in an across-the-board reduction in personal income taxes for all taxpayergroups regardless of income level.
All five representative households experience a re-duction in their personal income taxes. The individualhousehold (household 1) experiences a reduction of $338in its income tax, a reduction of 4.3% compared to itscurrent tax.
The dual-income household (household 2) receivesan 11.1% reduction in its income tax relative to the status
quo. The value of the tax reduction is $990. The single-in-come household (household 3) shows a 34.8% decline inits income tax compared to the status quo. This reduc-tion, $4,352, is substantially larger than that of the dual-income household. It is interesting to note that, as in theprevious seven cases, the two family households withsimilar incomes (households 2 and 3) pay approximatelythe same percentage of their household income (14.3%) inincome taxes under the flat tax.
Household 4 pays no income tax in this case sinceincreasing the personal exemption, allowing for an ex-emption of $2,000 per child and reducing federal spend-ing and taxes, eliminates completely the burden ofincome taxes for this low-income family. The high-incomehousehold (household 5) also receives a reduction in itsincome taxes, $6,038, a decrease in income taxes of 22.7%relative to the status quo. Although this case permitsRRSP and RPP contributions, it does not affect thesehouseholds since they do not make such contributions.
Table 3.8.2: Tax distribution (Case 8)
Based on calculations by the authors using Statistics Canada’s SPSD/M.
Income Group Total Flat Tax Revenue
Total Current Tax Revenue
Change in Tax Revenue
Net Income Number of Individuals
Per-capita Tax Difference
($millions) ($millions) ($millions) ($millions) (thousands) ($)
Minimum — (10,000) 0 0 0 (23) 12 0
(9,999) — 0 0 0 0 (23) 7,385 0
1 — 10,000 0 67 (67) 16,895 5,563 (12)
10,001 — 20,000 2,598 3,795 (1,197) 63,233 5,717 (209)
20,001 — 30,000 10,534 10,781 (247) 81,465 3,835 (65)
30,001 — 40,000 15,575 15,702 (127) 89,275 2,838 (45)
40,001 — 50,000 16,252 17,393 (1,140) 80,159 1,947 (586)
50,001 — 60,000 15,675 17,261 (1,585) 70,625 1,397 (1,135)
60,001 — 70,000 10,728 12,062 (1,334) 46,152 772 (1,726)
70,001 — 80,000 7,710 9,039 (1,328) 32,378 472 (2,811)
80,001 — 90,000 5,001 6,078 (1,076) 20,276 259 (4,157)
90,001 — 100,000 3,486 4,286 (800) 13,632 155 (5,137)
100,001 — 110,000 2,525 3,151 (625) 9,521 100 (6,241)
110,001 — 120,000 2,085 2,664 (579) 7,967 75 (7,657)
120,001 — 130,000 1,644 2,063 (418) 6,127 53 (7,886)
130,001 — 140,000 1,309 1,650 (340) 4,882 39 (8,652)
140,001 — 150,000 790 988 (198) 2,852 21 (9,228)
150,001 — 200,000 3,426 4,424 (998) 12,257 78 (12,652)
200,001 — 250,000 2,253 2,986 (733) 7,729 36 (19,942)
250,001 — Maximum 9,062 12,648 (3,586) 29,882 62 (57,055)

44 Critical Issues Bulletin The Fraser Institute
Table 3.8.3: Relative measures of tax changes (Case 8)
Based on calculations by the authors using Statistics Canada’s SPSD/M.
Table 3.8.4: Effect on sample households (Case 8)
Based on calculations by the authors using Statistics Canada’s SPSD/M.
Income Group Total Flat Tax Paid to Total Income (%)
Current PIT to Total
Income (%)
Percentage Point Change
Federal Flat Tax Only to Total Income
(%)
Federal PIT Only to Total Income (%)
Percentage Point Change
Minimum — (10,000) 0.0 0.0 0.0 0.0 0.0 0.0
(9,999) — 0 0.0 0.0 0.0 0.0 0.0 0.0
1 — 10,000 0.0 0.3 (0.3) 0.0 0.2 (0.2)
10,001 — 20,000 3.1 4.5 (1.4) 1.8 3.0 (1.2)
20,001 — 30,000 11.1 11.3 (0.2) 6.5 7.0 (0.5)
30,001 — 40,000 15.8 15.9 (0.1) 9.4 9.9 (0.5)
40,001 — 50,000 18.7 20.0 (1.3) 11.1 12.5 (1.1)
50,001 — 60,000 20.6 22.7 (2.1) 12.3 14.3 (2.0)
60,001 — 70,000 21.4 24.1 (2.7) 12.8 15.2 (2.4)
70,001 — 80,000 22.0 25.8 (3.8) 13.5 16.8 (3.3)
80,001 — 90,000 22.9 27.8 (4.9) 13.9 17.7 (3.8)
90,001 — 100,000 23.6 29.1 (5.5) 14.4 18.4 (4.0)
100,001 — 110,000 24.1 30.1 (6.0) 14.5 18.7 (4.2)
110,001 — 120,000 24.1 30.8 (6.7) 14.9 19.8 (4.9)
120,001 — 130,000 24.9 31.3 (6.4) 15.3 19.9 (4.6)
130,001 — 140,000 24.8 31.2 (6.4) 15.2 20.0 (4.8)
140,001 — 150,000 25.4 31.8 (6.4) 15.3 19.4 (4.1)
150,001 — 200,000 25.4 32.8 (7.4) 15.4 20.3 (4.9)
200,001 — 250,000 27.5 36.4 (8.9) 16.5 22.3 (5.8)
250,001 — Maximum 29.3 40.9 (11.6) 17.7 24.8 (7.1)
Household 1 (Individual)
Household 2 (Two Earners)
Household 3 (One Earner)
Household 4 (Low Income)
Household 5 (High Income)
Base PIT 7,920 8,932 12,496 1,213 26,581
Combined flat tax 7,582 7,942 8,144 0 20,543
Nominal Difference (338) (990) (4,352) (1,213) (6,038)
Percent Change (4.3%) (11.1%) (34.8%) (100.0%) (22.7%)

The Fraser Institute Flat Tax 45
Case 9Personal exemption of $11,834 + exemption of $2,000 per child + current RRSP/RPP deductions + $22.3 billion reduction in spending and taxes
Given past research on the effect of governments that arelarger or smaller than optimal on economic growth andsocial outcomes (Zelder and Basham 2000) and thepresent large amount of non-core spending by both thefederal and provincial governments, we thought it usefulto include a case that eliminated peripheral governmentspending at the federal level. Case 9 presents a tax profilein which spending by the federal government is limited toprograms deemed to be core areas of its responsibility:national defence, provision of civil and criminal court sys-tems, protection of property and person, and the financ-ing of core education and health care.
This reduction in spending and subsequent tax re-lief are considered only at the federal level and the pro-vincial rates remain unchanged from Case 8 (table 3.9.1).
Table 3.9.1: Flat tax rates (Case 9)
Based on calculations by the authors using Statistics Canada’s
SPSD/M.
* Calculated using the weighted provincial average of 12.9%.
† Does not account for the current opting out arrangement
(CHST and youth allowance abatements) that Quebec has with
the federal government. Accounting for this agreement yields
an adjusted federal flat tax rate of 12.2% for Quebec only and
an adjusted Quebec provincial flat tax of 22.8%. Note that the
adjustment does not affect Quebec’s combined federal-pro-
vincial flat-tax rate.
Rate of Jurisdiction
Combined Federal/ Provincial Rate
Federal 16.5 29.4*
Newfoundland 16.8 33.3
Prince Edward Island 14.1 30.6
Nova Scotia 13.7 30.2
New Brunswick 14.3 30.8
Quebec† 18.5 35.0
Ontario 10.0 26.5
Manitoba 14.6 31.1
Saskatchewan 15.6 32.1
Alberta 11.3 27.8
British Columbia 12.5 29.0
The federal rate of flat tax decreases from 19.0% to 16.5%,a reduction of 2.5 percentage points. Quebec once againhas both the highest provincial and highest combinedfederal-provincial rate of taxation. Its combined rate de-clines from 37.5% to 35.0%. Ontario has the lowest pro-vincial and lowest combined federal-provincial rate. Itshows a reduction of 2.5 percentage points in its com-bined federal-provincial tax rate, which decreases from29.0% to 26.5%.
As in Case 8, focusing spending by the federal gov-ernment on priority areas and eliminating peripheralspending affords reductions in personal income tax for allgroups of taxpayers, regardless of income. In some in-come groups, the increased tax relief from reducedspending and taxes is quite substantial. For instance,those earning between $20,001 and $30,000 receive a taxreduction 4.3 times the size of the reduction received un-der Case 8 (tables 3.9.2 and 3.9.3). Further, tax relief ismore than double the reduction in Case 8 for those earn-ing between $40,001 and $50,000. The reductions for ev-ery income group are greater in Case 9 than in Case 8,highlighting what can be achieved when governmentspending is reduced based on a prioritizing of functionsand a more efficient tax system.
The effects of the large reductions in spending andassociated taxes on our representative households arehighlighted in table 3.9.4. The individual household(household 1) shows a 12.6% reduction in its income taxrelative to current income tax.
Both of the households with similar incomes alsoexperience a reduction in income tax, although to differ-ent degrees. The dual-income household (household 2)receives an 18.9% reduction in its income tax relative tothe status quo while the single-income household (house-hold 3) receives a 40.5% reduction in income tax relativeto the status quo.
As in Case 8, the low-income household (house-hold 4) pays no income tax because of the reductions inspending and taxes, the personal exemption, and the ex-emption for children. The high-income household (house-hold 5) also receives a reduction in its income tax, 29.5%relative to the status quo.

46 Critical Issues Bulletin The Fraser Institute
Table 3.9.2: Tax distribution (Case 9)
Based on calculations by the authors using Statistics Canada’s SPSD/M.
Income Group Total Flat Tax Revenue
Total Current Tax Revenue
Change in Tax Revenue
Net Income Number of Individuals
Per-capita Tax Difference
($millions) ($millions) ($millions) ($millions) (thousands) ($)
Minimum — (10,000) 0 0 0 (23) 12 0
(9,999) — 0 0 0 0 (23) 7,385 0
1 — 10,000 0 67 (67) 16,895 5,563 (12)
10,001 — 20,000 2,393 3,795 (1,402) 63,233 5,717 (245)
20,001 — 30,000 9,707 10,781 (1,074) 81,465 3,835 (280)
30,001 — 40,000 14,339 15,702 (1,363) 89,275 2,838 (480)
40,001 — 50,000 14,962 17,393 (2,430) 80,159 1,947 (1,248)
50,001 — 60,000 14,429 17,261 (2,831) 70,625 1,397 (2,027)
60,001 — 70,000 9,871 12,062 (2,191) 46,152 772 (2,835)
70,001 — 80,000 7,078 9,039 (1,960) 32,378 472 (4,148)
80,001 — 90,000 4,595 6,078 (1,482) 20,276 259 (5,724)
90,001 — 100,000 3,204 4,286 (1,082) 13,632 155 (6,950)
100,001 — 110,000 2,323 3,151 (827) 9,521 100 (8,264)
110,001 — 120,000 1,913 2,664 (750) 7,967 75 (9,922)
120,001 — 130,000 1,510 2,063 (552) 6,127 53 (10,415)
130,001 — 140,000 1,202 1,650 (447) 4,882 39 (11,374)
140,001 — 150,000 727 988 (261) 2,852 21 (12,173)
150,001 — 200,000 3,149 4,424 (1,275) 12,257 78 (16,166)
200,001 — 250,000 2,072 2,986 (913) 7,729 36 (24,854)
250,001 — Maximum 8,331 12,648 (4,317) 29,882 62 (68,684)

The Fraser Institute Flat Tax 47
Table 3.9.3: Relative measures of tax changes (Case 9)
Based on calculations by the authors using Statistics Canada’s SPSD/M.
Table 3.9.4: Effect on sample households (Case 9)
Based on calculations by the authors using Statistics Canada’s SPSD/M.
Income Group Total Flat Tax Paid to Total Income (%)
Current PIT to Total
Income (%)
Percentage Point Change
Federal Flat Tax Only to Total Income
(%)
Federal PIT Only to Total Income (%)
Percentage Point Change
Minimum — (10,000) 0.0 0.0 0.0 0.0 0.0 0.0
(9,999) — 0 0.0 0.0 0.0 0.0 0.0 0.0
1 — 10,000 0.0 0.3 (0.3) 0.0 0.2 (0.2)
10,001 — 20,000 2.8 4.5 (1.7) 1.6 3.0 (1.4)
20,001 — 30,000 10.2 11.3 (1.1) 5.7 7.0 (1.3)
30,001 — 40,000 14.5 15.9 (1.0) 8.1 9.9 (1.8)
40,001 — 50,000 17.2 20.0 (2.8) 9.6 12.5 (2.9)
50,001 — 60,000 18.9 22.7 (3.8) 10.6 14.3 (3.7)
60,001 — 70,000 19.7 24.1 (4.4) 11.1 15.2 (4.1)
70,001 — 80,000 20.2 25.8 (5.6) 11.7 16.8 (5.1)
80,001 — 90,000 21.0 27.8 (6.8) 12.1 17.7 (5.6)
90,001 — 100,000 21.7 29.1 (7.4) 12.4 18.4 (6.0)
100,001 — 110,000 22.2 30.1 (7.9) 12.6 18.7 (6.1)
110,001 — 120,000 22.2 30.8 (8.6) 12.9 19.8 (6.9)
120,001 — 130,000 22.9 31.3 (8.4) 13.2 19.9 (6.7)
130,001 — 140,000 22.7 31.2 (8.5) 13.2 20.0 (6.8)
140,001 — 150,000 23.4 31.8 (8.4) 13.2 19.4 (6.2)
150,001 — 200,000 23.3 32.8 (9.5) 13.3 20.3 (7.0)
200,001 — 250,000 25.3 36.4 (11.1) 14.3 22.3 (8.0)
250,001 — Maximum 26.9 40.9 (14.0) 15.4 24.8 (9.4)
Household 1 (Individual)
Household 2 (Two Earners)
Household 3 (One Earner)
Household 4 (Low Income)
Household 5 (High Income)
Base PIT 7,920 8,932 12,496 1,213 26,581
Combined flat tax 6,919 7,248 7,432 0 18,748
Nominal Difference (1,001) (1,684) (5,064) (1,213) (7,833)
Percent Change (12.6%) (18.9%) (40.5%) (100.0%) (29.5%)

4 Income dynamics and mobility
Tax reforms are most often evaluated in terms of theireffects upon particular groups identified by factors suchas age, income, or employment status and these effectsare most often discussed in the context of a one-year pe-riod. Such an analysis leads to erroneous and quitemeaningless conclusions and is based on a simplisticview of taxation.
This type of analysis rests on the notion of “fair-ness,” traditionally referred to in public finance as “hori-zontal and vertical equity.” In fact, the question offairness, however defined, is often seen as a prerequisiteto assessing the appropriateness of a particular reform tothe tax system. Critics of the reform point to the “unfair-ness” of the change to an identifiable group. This unfair-ness then becomes an insurmountable barrier that, nomatter how large the benefits of the change, no amountof evidence can dislodge.
Argumentation based on unfairness implicitly ac-cepts the status quo as a reasonable representation of afair (or fairer) state. Those who accept this proposition of-ten incorrectly use the impact on the tax system in a sin-gle year as the basis for analysis, when a horizonencompassing several years is more appropriate. Whenlooking at a single year of data, a casual examination ofthe impact of a revenue-neutral flat-tax system or the re-placement of multiple rates of tax with a single rate leadsto one obvious conclusion: such a system leads to lowertaxes for those earning a high income and higher taxes forthose with low and middle incomes.
To see such an analysis is premature, we need onlyto look at the importance of income mobility. It is obvi-ous to most people that at different times of our lives wehave different incomes. Those first entering the workforce or enrolled in educational programs (typically theyoung), understandably have lower incomes. In fact, mostof the authors of this Critical Issues Bulletin lived belowStatistic Canada’s Low Income Cut Off line during theirtime in university. Similarly, retired persons drawingdown retirement savings would also be classified asthose with low income. Persons in this age category typ-
4
ically have paid off their debts and thus require less in-come for the same standard of living as they had duringtheir working life. Between these two extremes lies a pat-tern of first increasing, then decreasing income (Gunder-son and Riddell 1993: 175). The movement of peoplefrom one category of age and income to another makesit difficult to defend statements such as “the condition ofthose in low-income groups has deteriorated over thepast ten years” because people with a low income in yearone do not, for the most part, have a low income in lateryears.17 It is similarly difficult to make statements like“the poor are going to bear the burden of this tax reform”because those who are poor today are likely to be rela-tively well off tomorrow.
Nature of income mobility
Statistics Canada’s Survey of Labour and Income Dynamics(Webber, Cotton, Meere, Bishop, and Hewer 1999) canhelp us understand the movement between incomegroups better. This survey tracks specific persons overtime and allows us to observe and to monitor how a per-son’s income changes over time. This type of longitudinalanalysis is often carried out by grouping people into in-come quintiles18 according to their annual earnings. Thestudy then examines how the composition of each in-come group (quintile) changes over time.
Canadian ResultsWebber et al. (1999) examined Canadian panel data to in-vestigate the extent of income mobility. The followingsummarizes their findings on income mobility for a two-year period:
• 66.5% of families did not change quintile
• 13.8% moved up one quintile
• 13.1% dropped one quintile
• 3.2% moved up more than one quintile
• 3.5% dropped more than one quintile.
8

The Fraser Institute Flat Tax 49
Of those families initially in the bottom two quintiles in1995, 24% found themselves at least one quintile higherby 1996. In other words, nearly one-quarter of families inthe lowest two income groups had moved up at least oneincome group within a one-year period. This depicts Ca-nadian income mobility as fairly dynamic. In fact, after ex-amining the available Canadian data, Emes and Walker(1999) conclude that “there is not a ‘permanent under-class’ stuck in the lower income group” (1999: 54).
When a similar analysis is extended to a five-yearperiod (Webber, Cotton, Meere, Bishop, and Hewer 1999),the results show, as expected, even greater income mobil-ity. The data shows that:
• 49.1% of families did not change quintile
• 20.7% moved up one quintile
• 14.5% dropped one quintile
• 8.2% moved up more than one quintile
• 7.5% dropped more than one quintile
Of those initially in the bottom two quintiles, 45%moved up at least one quintile over the five-year periodof the study. In other words, in only 5 years nearly half ofall Canadian families in the bottom 40% moved up at leastone income group. In fact, almost as many families movedup a quintile as stayed in the same quintile. Should thedata be extended further, even greater levels of incomemobility can be expected.19
Research into British income mobility corroboratesCanadian results. The research examined the early 1990sand found “much mobility in household net income fromone year to the next” (Jarvis and Jenkins 1998: 428). Theyalso found relatively greater mobility in the low and highends of the income distribution than in the middle. Thisis, again, suggestive of a dynamic income distribution.
Research in the United StatesUnfortunately, both the Canadian and British data sets arelimited in their applicability to the current discussion be-cause they cover very few years. A more accurate sense ofincome mobility can be found in the University of Michi-gan’s Panel Survey on Income Dynamics, the results ofwhich were presented in a recent report by the FederalReserve Bank of Dallas (1995). The study, which looked atincomes during the period 1975 to 1991, found the fol-lowing key facts.
• Only one-half of one percent (0.05%) of the samplewas in the bottom quintile for every year of thestudy, suggesting that “being in the low-incomebracket isn’t, for a large majority of people, perma-nent” (1995: 8).
• Only 5.1% of those in the bottom quintile in 1975were in the bottom quintile in 1991.
• The average income in the poorest quintile grew2,196% from 1975 to 1991 while the average in-come in the richest quintile grew 8.7% in this timeperiod.
• The young and the educated were more likely tomove up the income distribution.
• The report concludes: “All through the Universityof Michigan data, there’s a consistent, powerfulthrust toward the top of the income distribution”(1995: 8).
The report cites a study from the US Treasury Departmentexamining tax returns from over 14,000 people from1979 to 1998. The study confirms many of the findings ofthe University of Michigan. For instance, “86% of those inthe lowest income bracket moved to a higher grouping.Two-thirds of them reached the middle strata or above,with almost 15% making it all the way to the top fifth ofincome earners” (Federal Reserve Bank of Dallas 1995:12). Interestingly, of those in the low income group in1979, more had made it all the way to the top of the in-come distribution in those nine years than remained inthe bottom quintile.
Census Bureau data for the 1980s consistentlyshows roughly 20% of the people in the bottom quintilemoving up a minimum of one quintile within a one-yearperiod. Interestingly, the data also showed roughly thesame percentage of people in the top quintile of earn-ings moving down a minimum of one quintile (cited inBartlett 2000).
Finally, a study from the Urban Institute (Steuerle1998) concluded that approximately one-half of those inthe bottom quintile during the period from 1967 to 1976had moved up when surveyed in the period from 1977 to1986. Similar to the findings of the Census Bureau, an al-most equal number of individuals in the top earnings quin-tile had moved down over the same two periods. The re-sults of these studies speak volumes for the importance ofconsidering income mobility when analyzing tax reforms.

50 Critical Issues Bulletin The Fraser Institute
Implications for the flat taxEven when evaluating tax reform against the status quo,static analysis is only the starting point. A blanket state-ment that this reform helps the rich or hurts the poorcannot be justified. One year’s data provides insufficientinformation to conclude that there is systematic“unfairness” given the movement of taxpayers from oneincome group to another. A rational taxpayer would beconcerned about his or her lifetime tax burden, not howa particular change will affect next year’s tax bill. Mostpeople expect to earn a greater income in their 40s and50s than they do in their 20s and 30s; most do so. A ra-tional taxpayer would be willing to trade-off a slightlylarger tax burden today for the efficiency gains, in-creased economic growth, and much larger tax savingsin the future based on tax reform. This is no differentfrom saving money today to spend tomorrow. The ef-fects of a change in the tax regime, therefore, should belooked at over a number of years.
Life-cycle analysis
A life-cycle analysis by Walker (1983) of various flat-ratetax proposals provides us with a foundation for analysis.Walker notes that, of those in the main group of incomeearners who would be paying greater taxes, a full 63%would be in periods of their lives with abnormally low lev-els of income (due to youth or old age) relative to the taxsystem that existed at the time of the analysis. For theportion of those income earners who were young, theirtax burden would decline as they aged, offsetting the ef-fects of an initial increase. Walker also finds that the bur-den of lifetime taxes for all but one of the flat-rate tax sys-tems he examined is equivalent to, or less than, theburden of lifetime taxes from the tax system in existenceat the time of analysis.
Tables 4 and 5 show the changes in income tax foreach of the cases analyzed in Section 3 compared with thecurrent tax system. All of the cases except cases 8 and 9,which include spending and tax reductions, show an in-creased tax burden during the early years of the taxpayersworking life as well as during the later years of life. Thisincreased burden is offset by a decreased burden duringmid-life, usually the years from age 30 to age 64.20 Let usexamine the experience of an average individual21 in Case3, which offers a personal exemption of $8,766 with notax credits or other deductions. Before turning 20, the av-erage individual is burdened with additional income taxes
of $12 per year above the status quo. This burden increas-es with age, peaking at an extra $214 during the yearsfrom age 25 to age 29. It then drops to $68 above the sta-tus quo during the years from age 30 to age 34. This is fol-lowed by many years (from 35 to 64) when the tax bill isless than it would have been under the current system. Insome cases, these reductions are substantial. For in-stance, during the years from age 55 to age 59, incometaxes are over $800 less in Case 3 than under the statusquo. Beyond 64 years of age, the average individual paysover $200 more in tax per year.
This example illustrates several important points.First, there is a relatively small amount of extra incometax paid during those years in which taxes paid in Case 3are higher than the status quo. In fact, before age 30 theaverage increase in taxes amounts to around 0.8% of in-come. After 65, the increase in taxes is 1.3% of total in-come. Second, the period during which taxes are lower islonger than the periods when taxes are higher and the re-ductions in taxes are typically larger than the increases.During the period from 35 years to 65 years of age, thereduction in taxes is, on average, 1.3% of income. Overthis individual’s lifetime, the biggest tax decrease is 2.4%of income, whereas the biggest increase is 1.6%. Thesenumbers indicate that the transition to a flat tax like thatanalyzed in Case 3 would be, for the average individual,relatively painless and most likely profitable.
The bottom line for an average individual in Case 3is a lifetime reduction in income taxes of $6,408 (table 6).As shown in table 6, all of the Cases presented in Section3 result in a lifetime reduction in income-tax liability foran average income earner. This is obviously due to thefact that the reductions obtained during the person’speak earning period more than offset the tax increases in-curred during periods of lower income.
If the status quo is the ultimate arbitrator of fair-ness, the evidence presented suggests that the flat tax asanalyzed in Cases 1 through 9 constitute a fairer tax sys-tem. Those with low incomes may temporarily bear theburden of the change in tax systems but when they beginto earn higher income, as research shows they almost cer-tainly will, they will enjoy lower rates of income tax thatwill more than compensate them for the relatively smallincreases incurred in their younger years.22 Other sec-tions of this study highlight the important benefits gainedthrough tax reform based on a flat tax and, to a lesser ex-tent, on a single-rate tax. This analysis shows that the life-time tax benefits do not come at the cost of fairness tothose at various points in the income distribution.

Th
eFra
se
rIn
stitu
teFla
t Ta
x5
1
55–59 60–64 65–69 Over 70
33,830 $24,512 $24,167 $21,409
7,603 4,350 3,496 2,500
6,299 4,300 4,432 3,681
6,694 4,052 3,836 3,011
6,789 4,008 3,706 2,853
7,318 3,798 3,132 2,274
6,948 4,109 3,803 2,933
6,901 4,094 4,009 3,124
6,876 4,086 3,953 3,082
6,346 3,591 3,367 2,554
5,838 3,305 3,097 2,349
55–59 60–64 65–69 Over 70
33,830 $24,512 $24,167 $21,409
(1,304) (49) 936 1,180
(909) (297) 340 511
(814) (342) 210 353
(285) (551) (364) (226)
(655) (241) 307 433
(702) (256) 513 624
(727) (263) 457 582
(1,257) (758) (129) 54
(1,765) (1,044) (399) (151)
Table 4: Income tax payable—status quo versus single-rate tax reform (Cases 1 through 9)
Table 5: Income tax payable—change from status quo (Cases 1 through 9)
Age Group of Taxpayer
Under 20 21–24 25–29 30–34 35–39 40–44 45–49 50–54
Avg. Income Earned ($) $1,381 $14,826 $24,785 $30,375 $34,272 $26,070 $37,134 $35,821 $
Tax
Pay
able
Status Quo 108 1,760 4,064 5,592 6,823 7,564 8,157 7,978
Case 1 244 2,626 4,517 5,573 6,336 6,762 7,044 6,738
Case 2 132 2,052 4,338 5,660 6,646 7,199 7,599 7,217
Case 3 119 1,939 4,277 5,661 6,704 7,288 7,721 7,328
Case 4 78 1,351 3,768 5,474 6,900 7,688 8,387 7,970
Case 5 123 1,971 4,297 5,552 6,537 7,139 7,721 7,448
Case 6 126 2,015 4,302 5,539 6,484 7,098 7,593 7,350
Case 7 126 2,019 4,324 5,566 6,501 7,117 7,604 7,346
Case 8 95 1,591 3,693 4,901 5,854 6,464 6,986 6,769
Case 9 88 1,464 3,398 4,507 5,386 5,949 6,429 6,228
Age Group of Taxpayer
Under 20 21–24 25–29 30–34 35–39 40–44 45–49 50–54
Avg. Income Earned ($) $1,381 $14,826 $24,785 $30,375 $34,272 $26,070 $37,134 $35,821 $
Cha
nge
in T
ax P
ayab
le
Case 1 136 866 453 (19) (487) (801) (1,113) (1,240)
Case 2 24 292 274 68 (177) (365) (558) (761)
Case 3 12 178 214 68 (119) (276) (436) (650)
Case 4 (30) (409) (295) (118) 77 (124) (230) (8)
Case 5 15 211 233 (41) (286) (424) (436) (530)
Case 6 18 255 238 (53) (339) (466) (564) (628)
Case 7 18 259 261 (27) (322) (447) (553) (632)
Case 8 (12) (169) (370) (691) (969) (1,100) (1,171) (1,209)
Case 9 (20) (296) (666) (1,086) (1,437) (1,615) (1,728) (1,750)

52 Critical Issues Bulletin The Fraser Institute
Other considerations
Another consideration is the impact that changing thetax system will have on income mobility. If the changesinduce greater work effort or greater investments in ed-ucation,23 the average taxpayer will be much better offunder the reformed system. Is there evidence that thiswould happen?
Samida (1998) examines the relationship betweeneconomic freedom in Canada and the percentage of peo-ple in a particular age group with incomes under $12,500(in real terms). He finds that the greater the level of eco-nomic freedom a province has, the greater the percentageof people who will surpass this level of income sevenyears later. In so much as the single-rate tax or a flat taxreduces marginal tax rates and, by implication, increases
the level of economic freedom, we might expect incomemobility to increase as well.
Conclusion
Given that income increases and decreases over an indi-vidual’s lifetime, it is clear that an entire lifetime is theproper framework in which to analyze tax reform. Weshould assess the effect of a change in the tax systemupon a person’s lifetime tax liability rather than simplisti-cally and quite incorrectly assessing its effect in a partic-ular year. Further, the data available for Canada, Britainand, in particular, the United States strongly suggest that,in all three jurisdictions, individuals move from one levelof income to another to a relatively high degree.
Table 6: Change in income tax liability over lifetime (Cases 1 through 9)
Case 1 (5,768)
Case 2 (6,232)
Case 3 (6,408)
Case 4 (7,420)
Case 5 (5,656)
Case 6 (5,440)
Case 7 (5,576)
Case 8 (31,124)
Case 9 (47,828)

5 International evidence
There is a void in the debate about the applicability of aflat tax on income to Canada: the debate is exclusivelytheoretical. Opponents of the flat tax foretell fiscal doom-and-gloom should the allegedly untested flat tax ever beintroduced as an instrument of public policy. The demon-strated successes of the flat tax, however, are usually ig-nored and this section attempts to fill the void.
For several decades, various jurisdictions have op-erated their highly successful fiscal policies on the basisof a flat tax. Both Hong Kong and the Channel Islandshave largely insulated themselves from the mediocre, fre-quently poor, performance of most Western economies,in no small measure, by implementing tax systems char-acterized by fairness, simplicity, and efficiency.
Hong Kong
On July 1, 1997, following 150 years of British administra-tion, the city-state of Hong Kong became a Special Admin-istrative Region of the People’s Republic of China (PRC).Under the constitutional terms of the transfer, known asthe Basic Law, the existing economic, legal, and social sys-tems will be maintained for at least 50 years: “While themainland PRC will continue to practise ‘socialism withChinese characteristics’, Hong Kong is to continue thepractice of ‘capitalism with Chinese characteristics’ ”(Cullen 1994: 512). This section provides an overview ofthe central fiscal characteristics of Hong Kong.
The island of Hong Kong, on which 6.8 million peo-ple reside, contains no natural resources. Yet, Hong Kongsucceeds as the world’s eighth-largest trading economy.How is this possible? According to The Economist maga-zine: “The territory’s tradition of simple and low taxes,combined with a comparatively easy-going government. . . is widely seen as a main reason for its stunning rise toprosperity” (The Economist 2000).
According to The Fraser Institute’s publication,Economic Freedom of the World: 2000 Annual Report: “Thelatest economic freedom index stands at a level of 9.4(out of 10), maintaining Hong Kong’s primacy as the most
5
economically free place on earth” (Gwartney and Lawson2000: 49). Hong Kong’s tried and trusted non-interven-tionist economic policy is, in fact, constitutionally man-dated. For example, government spending is notpermitted to grow at a rate higher than that of the econ-omy. As Milton and Rose Friedman observed, “Thoughgovernment spending has grown as the economy hasgrown, it remains among the lowest in the world as a frac-tion of the income of the people. As a result, low taxespreserve incentives” (Friedman and Friedman 1980: 34).
In theory, Hong Kong’s tax system, “is designed tobe as neutral as possible so as to avoid any distortive ef-fects on the economy while at the same time generatingsufficient revenue to finance the government’s socio-economic policies and programmes” (Jao 1978: 253). Inpractice, therefore, a moderately narrow tax base is com-bined with very low tax rates. Hong Kong does not havea general income tax, does not tax stock dividends, capi-tal gains, wealth, or gifts, and has no value-added tax,general sales tax, or payroll tax. There is a flat-rate tax of16% on corporate profits and a property tax.
Hong Kong has had a version of the flat tax on in-come since its original tax system came into effect withthe Inland Revenue Ordinance of 1947.24 Hong Kong hasa Salaries Tax on all employment income. The original taxlaw legislated a standard rate of 10% on salaries. Current-ly, the maximum limit on salaries and wages is a flat rateof 15% on gross income, less personal exemptions (thecurrent basic allowance is HK$200,000 [US$25,641] for amarried person), expenses, and charitable donations (thecurrent standard rate of 15% came into effect in 1966). In-come tax was flattened further when the top marginalrate of 30% was eliminated in 1978. Critically, the govern-ment’s “philosophy is not only to keep each and everytaxation levy . . . simple and easy for the taxpayers, butalso productive and inexpensive for the government toadminister” (Anthony Au-Yeung, Deputy Commissioner ofInland Revenue, in Lai 1982: 199).
The Salaries Tax operates according to a slidingscale. The effective rates of income tax are: 10.2% for asingle person; 5.7% for a single person with two depen-
3

54 Critical Issues Bulletin The Fraser Institute
dent parents; 3.5% for a married person with no children;1.4% for a married person with two children; and 0.14% fora married person with two children and two dependentparents.
In Hong Kong, personal and child allowances are sohigh (including a maximum deduction of 10% of taxableincome for charitable donations) that 70% of the popula-tion pay no income tax whatsoever; a further 28% of thepopulation pay below the 15% flat rate, which, conse-quently, is paid only by the most affluent 2% of HongKong’s residents.
Commenting on the flattening of the income tax,economist Y.C. Jao observes: “Since 1976 there has beenfurther simplification and rationalization of Hong Kong’stax system, which on balance has resulted in a lower bur-den of personal taxation, higher tax yield and hence alarger fiscal surplus” (Jao 1981: 406).” He continues: “Theremarkable growth and industrialization of the economyduring the post-war period provides a recent and strikingillustration of the positive effects of a congenial tax sys-tem” (Jao 1981: 253).”
During the second-half of the twentieth century,the Hong Kong economy grew at a phenomenal pace. In-deed: “The combination of simplicity and low taxation, tothe extent that it minimizes the adverse effects of taxa-tion on work effort, saving and risk-taking, has played itspart in Hong Kong’s remarkable post-war economicgrowth and development” (Jao 1981: 401).
Impressively, Hong Kong’s flat tax “has proved it-self capable of generating a sufficiently high level of gov-ernment expenditure such that fiscal surpluses havebeen recorded in no less than 27 out of the 31 post-warfiscal years” (Jao 1981: 253). It may be observed, there-fore, that: “A comparatively low level of taxation contrib-utes significantly to economic prosperity and thusincreases revenue yields despite high tax thresholds”(Lai 1982: 199).
The Channel Islands
Situated in the English Channel off the northwest coast ofFrance, the Channel Islands are made up of two larger is-lands, Guernsey (population 59,000) and Jersey (popula-tion 75,000), three much smaller islands (Alderney, Herm,and Sark), and several tiny islets. The Channel Islands op-erate under a special constitutional status bestowed bythe British crown.
GuernseyThis section focuses primarily upon the fiscal policies ofGuernsey, while also outlining the similar policies fol-lowed, and results generated, by Jersey. Neither Guernseynor Jersey is a member of the European Union (EU), al-though both hold special status under a relationship withthe EU established when the United Kingdom joined theEuropean Economic Community. Overall, both Guernseyand Jersey have “maintained the islands’ rare combinationof low taxation, considerable economic prosperity, andpolitical stability, whilst still preserving a highly attractiveenvironment” (Deloitte Haskins & Sells 1978: 4). The taxsystems employed in Guernsey and Jersey are quite simi-lar. Both islands employ a 20% standard rate of income taxfor individuals and corporations. Neither island imposesa tax on capital gains, a tax on capital transfer, or a with-holding tax; both refrain from taxing interest on bank de-posits. Neither Guernsey nor Jersey collect a value-addedtax.
Hence, while historically Guernsey had higherrates of income tax than did Jersey, since the establish-ment of a flat tax of 20% on income in 1960, the island hasnot increased the rate of income tax. The question, how-ever, remains—to what effect? The island’s GDP has morethan trebled since 1965. Since 1996, economic growthhas outpaced a booming British economy and GDP percapita increased from £7,510 in 1970 to £16,960 in 1998.
Although Guernsey’s 20% standard rate of incometax is already very low by international standards, the 20%flat tax is complemented by generous personal allowancesand reliefs, which include allowances both for single andfor married persons, as well as allowances for children anddependent relatives. Income-tax receipts nevertheless ac-count for 74% of total general revenue.25 The significantincreases in revenue allowed for a comparable increase ingovernment expenditure on health care, social services,and education. A rising revenue stream has ensured thatGuernsey’s public finances are consistently balanced.
JerseyThe income tax was introduced into Jersey in 1928 andwas modelled, unsurprisingly, on Britain’s income taxcode. The island’s introductory standard rate was 2.5%.The standard rate was raised to 20% in 1940, the level atwhich it remains 60 years later. It is a flat tax that appliesto both individual and corporate income.
The 20% flat tax is also complemented by generouspersonal allowances and reliefs comparable to those pro-

The Fraser Institute Flat Tax 55
vided in Guernsey. Income tax provides 90% of the island’srevenue, even higher than is the case in Guernsey. Similarto the Guernsey tax system, the Jersey tax system is de-scribed as “a pure imputation system in that no income istaxed twice. For example, dividends paid by a Jersey com-pany are not deductible in the company’s computationbut are treated as taxed income in the hands of the share-holder” (Deloitte Haskins & Sells 1978: 7).
A legislative committee summarized Jersey’s eco-nomic development philosophy in the following terms:
New forms of taxation should be avoided whereverpossible, and . . . efforts should be directed more atmaximizing the tax yield with the present form oftaxation by the encouragement of profit growthwith business activities of a level and nature thatare consistent with population growth. (State ofJersey 1991: 10).
How has this policy served the largest of the Chan-nel Islands? It has been observed that Jersey suffers fromthe “problems” of affluence and low unemployment (Johns
and Le Marchant 1993: 110). GDP, a principal measure ofmacroeconomic affluence, rose 90% in real terms between1980 and 1990. Meanwhile, per-capita income stood at£8,153 in 1981; by 1990, it had risen to £14,000.
Conclusion
It is equally true of both Hong Kong and the Channel Is-lands that, “The necessary process of change and devel-opment to provide for continued economic prosperityrequires the continued ability both of individuals to startup in business, and of the successful to expand at the ex-pense of the unsuccessful” (Colin Powell, Chief EconomicAdviser to the States of Jersey; quoted in Johns and LeMarchant 1993: 112). Within these jurisdictions there ex-ist long-standing commitments to fiscal policies centredupon fairness, simplicity, and efficiency. As demonstratedby their respective post-war experiences, such fiscal pol-icies based upon the flat tax are positive influences uponeconomic growth, employment, and the overall standardof living.

Notes
1 The 2000 Federal Budget reduced the middle-in-come statutory tax rate from 26% to 23% over twoyears beginning with a reduction of 2 percentagepoints (26% to 24%) effective July 2000; the rate for2000 is, therefore, 25%.
2 Computation of federal income tax: $30,004 minus$7,231 multiplied by applicable tax rate (17%) =$3,871.
3 “Values,” in this context, means how much weightthe government places on a dollar of income for aperson in a particular income bracket in assessingthe well-being of society through a social-welfarecalculation.
4 Even if the government does not value the incomesof the rich, it should still value the revenue it cangenerate from them. This is why, even in the “pro-gressive” case, the optimal tax rate is declining, be-cause the rich have much greater behaviouralresponses to changes in the tax rate than do therest of the population. A government with thesepreferences would attempt to maximize the taxrevenue obtained from this group without concernfor their level of social welfare while collecting rev-enue as necessary from the other groups, balancingthe value of this revenue versus the cost in terms ofsocial welfare.
5 Other proposals for flat-tax reform include: Steuerle1998; Mitchell 1997a; Boessenkool, Grubel, and Si-lye 1995; American Enterprise Institute 1996; andMonte Solberg 2000 (Canadian Alliance). Note thatthe proposal from the Canadian Alliance is a single-rate tax rather than a comprehensive flat-tax reform.
6 This particular change poses significant problems forthe financial services industry that are specificallyaddressed in Hall-Rabushka but are too detailed toinclude in this summary.
7 Disclaimer This analysis is based on Statistics Cana-da’s Social Policy Simulation Database and Model.The assumptions and calculations underlying thesimulation results were prepared by The Fraser Insti-
5
tute and the responsibility for the use and interpre-tation of these data is entirely that of the authors.
8 For further information on differences in the treat-ment of single-income and dual-income families andpenalties for marriage embedded in the tax code,please see Zelder and Basham 2000 and the refer-ences included in that article.
9 Several countries, including New Zealand, do nothave personal exemptions in their tax systems.
10 The personal exemption is our model’s equivalent tothe “Basic Personal Amount” familiar from the “Non-refundable tax credits” section of the personal in-come tax form. The personal exemption in our mod-el, like the Basic Personal Amount, functions as a taxcredit. Specifically, the amount of the exemption ismultiplied by some tax rate to arrive at the value ofthe tax credit. In the current tax system, this rate is17%. In our model, the federal flat-tax rate for the rel-evant case is used.
11 Podder and English (1999) note that the present sys-tem exempts 75% of domestic savings.
12 According to the Tax Statistics on Individuals for the1997 tax year, 92.7% of tax-filers earned incomes lessthan $70,000, allowing them the opportunity tomake full use of their RRSP/RPP contributions up tothe 18% maximum without being affected by the capof $13,500.
13 In 1995, less than half the receipts issued by charita-ble organizations in Canada were actually claimed.Similarly, only 29% of Americans who filed tax state-ments choose to itemize their tax returns and claimcharitable donations. That such a small percentageuse the charitable donation tax credit further weak-ens the argument that tax incentives explain charita-ble donations.
14 In 1999/2000 alone, some $7.2 billions were spenton regional development programs and subsidies tocrown corporations; these make up 54% of the totalspending reductions proposed. No spending or taxreductions are implemented at the provincial level.
6

The Fraser Institute Flat Tax 57
The provinces will collect and spend the sameamount as under previous cases.
15 One of the limitations of the SPSD/M is that is usesdata from a single year only. It is, therefore, not de-signed to provide dynamic or multi-year analyses.Our analysis, which is based on the SPSD/M, includesreductions in expenditure and related taxes in a sin-gle year although such reductions can be enactedover a number of years.
16 Note that a corresponding spending and tax reduc-tion at the provincial level would have reduced or re-versed the single-rate tax (SRT) rate increases at theprovincial level.
17 It is interesting to note that increasing university en-rollments would tend to increase traditional mea-sures of poverty. Ironically, this may be the result ofgreater general affluence.
18 One quintile represents 20% of the population. Forexample, when looking at income quintiles, the bot-tom quintile is that 20% of the population earningthe least income.
19 Note that the data will only cover a six-year period ac-cording to current research plans since, though theSurvey of Labour Income and Dynamics (SLID) willcontinue indefinitely, any one group of families will besurveyed for six years only. The survey of the second
group, for instance, started at the mid-point in the six-year survey cycle of the first group; this process willcontinue and the survey of each new group will beginat the mid-point of the previous group’s cycle.
20 This is confirmed by a net present-value calculationusing appropriate discount rates.
21 This assumes that the average individual follows theaverage time trend of income and that there is no be-havioural response from the tax reform.
22 Those who are now retired may be adversely affect-ed by a change in the tax system as described thusfar. This effect is the result of the transition from onetax regime to another since those who are alreadyretired, unlike individuals currently working, couldnot receive the offsetting benefit of reduced taxesduring their prime working period.
23 High marginal tax rates mean lower returns to edu-cation. Since education is an investment, these low-er returns imply a smaller investment in education.One would expect that reducing the marginal taxrate at the top end would encourage more people toenroll in educational programs.
24 For a brief history of Hong Kong’s experience withthe flat tax, and a detailed examination of its currenttax system, see Reynolds 1999.
25 This is a 1999 statistic.

References
Aaron, H., and J. Pechman (eds) (1981). How Taxes AffectEconomic Behaviour. Washington, DC: Brookings Insti-tution.
Adams, Charles (1993). For Good and Evil: The Impact of Taxeson the Course of Civilization. London: Madison Books.
Altig, David, and Charles T. Carlstrom (1994). The Efficien-cy and Welfare Effects of Tax Reform: Are FewerBrackets Better Than More? Economic Review 30, 4:30–42. Federal Reserve Bank of Cleveland.
American Enterprise Institute (1996). Fairness and Efficien-cy in the Flat-tax. Washington, DC: AEI. Digital docu-ment available on the Internet at www.aei.org.
Association of Canadian Pension Management (1995). ARetirement Income Strategy for Canada: Creating theBest Retirement Income System in the World. Toronto,ON: ACPM.
Association of Canadian Pension Management (2000). De-pendence or Self-reliance: Which Way for Canada’s Retire-ment Income System? Digital document:www.acpm.com/ACPMenglish/documents/dep_self-reliance.htm.
Auerbach, Alan J. (1997). The Future of Fundamental TaxReform. AEA Papers and Proceedings 87, 2 (May 1997):143–46.
Auerbach, Alan J. and Laurence Kotlikoff (1987). DynamicFiscal Policy. Cambridge: Cambridge University Press.
Auerbach, Alan J., Laurence Kotlikoff, and Jonathan Skin-ner (1983). The Efficiency Gains from Dynamic TaxReform. International Economic Review 24, 1 (Febru-ary): 81–100.
Ballard, C., J. Shoven, and J. Whalley (1985). General Equil-birum Computations of the Marginal Welfare Costsof Taxes in the US. American Economic Review 75,1(March): 128–38.
Barro, Robert (1990) Government Spending in a SimpleModel of Endogenous Growth. Journal of PoliticalEconomy 98, 5 (pt.2): S103–S125.
Barro, Robert (1997) Determinants of Economic Growth: ACross-Country Empirical Study. Cambridge: MIT Press.
Barro, R., and Xavier Sala-i-Martin (1995). EconomicGrowth. New York: McGraw Hill.
5
Barry, John S. (1996). How a Flat Tax Would Affect CharitableContributions. Washington, DC: The Heritage Founda-tion. Digital document available at http://flat-tax.house.gov.
Bartlett, Bruce (2000). Income Mobility Belies LiberalMyth. NCPA Digest (August 23). Digital documentavailable at www.ncpa.org.
Bawly, D. (1982). The Subterranean Economy. New York:McGraw Hill.
Besci, Zsolt (1996). Do State and Local Taxes Affect Rela-tive State Growth? Economic Review 81, 2: 18–36.Federal Reserve Bank of Atlanta.
Bevilacqua, Maurizio (1999). Budget 2000, New Era . . . NewPlan. Report of the Standing Committee on Finance[House of Commons, Canada] (December). Ottawa:Standing Committee on Finance.
Boessenkool, Ken, Herb Grubel, and Jim Silye (1995). AFlat Tax for Canada. Unpublished paper presented toThe Flat Tax Conference (The Fraser Institute), Toron-to (October 31).
Boskin, M. (1975). Efficiency Aspects of the DifferentialTax Treatment of Market and Household. Journal ofPublic Economics 4: 1–26.
Boskin, M. (1978). Taxation, Saving, and the Rate ofIntereest. Journal of Political Economy 86, 2 (pt.2):S3–S28.
Bradley, Bill (1984). The Fair Tax. New York: Pocket Books.Brenner, Reuven (1998). Canada: Failure of a Promised Land.
Special Report, Polyconomics, Inc. (July 16).Broadway, Robin W., and Harry M. Kitchen (1999). Person-
al Income Tax Reform in a Broader Context. CanadianTax Journal 47, 3: 566–602.
Brown, Robert D. (1999). Tax Reform and Tax Reduction:Let’s Do the Job Right. Canadian Tax Journal 47, 2:182–205.
Browning, Edgar K. (1987). On the Marginal Welfare Costof Taxation. American Economic Review 77, 1 (March):199–219.
Browning, Edgar K., and Jacquelene M. Browning (1985).Why Not a True Flat Rate Tax? Cato Journal 5, 2 (Fall):620–50.
8

The Fraser Institute Flat Tax 59
Bruce, Doug (1999). Tax Pain, No Gain: Results of CFIB Sur-vey on Tax Principles. CFBI Research (June).
Buchanan, James M. (1993) The Political Efficiency of Gen-eral Taxation. National Tax Journal 46, 4 (December):401–10.
Canadian Institute of Actuaries (1995). Troubled Tomor-rows: The Report of the Canadian Institute of Actuaries’Task Force on Retirement Savings. Ottawa, ON: Canadi-an Institute of Actuaries.
Carroll, Robert, Dougals Holtz-Eakin, Mark Rider, and Har-vey S. Rosen (1998). Entrepreneurs, Income Taxes andInvestment. Working Paper 6374. Cambridge, MA: Na-tional Bureau of Economic Research.
Chao, Johnny C.P., and Herbert Grubel (1998). OptimalLevels of Spending and Taxation in Canada. In Her-bert Grubel (Ed.), How to Use the Fiscal Surplus: Whatis the Optimal Size of Government? (Vancouver, BC: TheFraser Institute): 53–68.
Clemens, Jason, and Fazil Mihlar, with Johanna L. Francis(1999). The 20% Foreign Property Rule: Increasing Riskand Decreasing Returns on RRSPs and RPPs. Critical Is-sues Bulletin. Vancouver, BC: The Fraser Institute.
Clemens, Jason, and Michael Walker (1999). Reducing Tax-es in Canada, Fraser Forum (December): 11–13.
Cooper, Sherry (1999). Puling Up Stakes: The Best andBrightest of Our Children and Grandchildren Are Be-ing Lured South of the Border by Higher After-Tax In-comes and More Vibrant Job Markets. FiftyPlus(October).
Courchene, Thomas J. (1999). National versus RegionalConcerns: A Provincial Perspective on the Role andOperations of the Tax Collection Agreements. Cana-dian Tax Journal 47, 4: 861–89.
Courchene, Thomas J., and D. Purvis, Eds. (1993). Produc-tivity Growth and Canada’s International Competitive-ness. Bell Papers on Economic and Public Policy.Kingston, ON: John Deutsch Institute for the Study ofEcnomic Policy (Queen’s University).
Cox, W. Michael, and Richard Alm (1999). Myths of Rich andPoor: Why We’re Better Off than We Think. New York:Basic Books.
Cullen, Richard (1994). Looking into Hong Kong’s FiscalBall. Australian Tax Forum 11, 4.
Davies, James (1998). Marginal Tax Rates in Canada: Highand Getting Higher. C.D. Howe Institute Commentary103 (March).
Deloitte Haskins & Sells, Inc. (1978). The Channel Islands:Basic Business Information. London: Deloitte Haskins& Sells.
De Long, J. Bradford, and Lawrence H. Summers (1991).Equipment Investment and Economic Growth. Quar-terly Journal of Economics 106, 2: 445–502.
Drache, Arthur (2000). This Tax Concept Deserves to FallFlat. Financial Post (February 8): D4.
Drolet, Marie, and René Morissette (1998). The UpwardMobility of Low Paid Canadians: 1993-1995. Ottawa:Statistics Canada,.
Drolet, Marie and René Morissette (1999). To What ExtentAre Canadians Exposed to Low Income? Ottawa: Statis-tics Canada.
The Economist (2000). Hong Kong: Atonement Day (Febru-ary 26): 50.
Emes, Joel (1999a). April Questions & Answers. Fraser Fo-rum (April): 4–7.
Emes, Joel (1999b). Fiscal Performance Index, 1999. Public Pol-icy Sources 20. Vancouver, BC: The Fraser Institute.
Emes, Joel (2000). May Questions & Answers. Fraser Fo-rum (May): 28–30.
Emes, Joel, and Dexter Samida (1997). Growth Tax in Can-ada. Unpublished paper, The Fraser Institute.
Emes, Joel, and Michael Walker (1999). Tax Facts 11. Van-couver: The Fraser Institute.
Engen, Eric, and Jonathan Skinner (1996). Taxation andEconomic Growth. Working Paper 5826. Cambridge:National Bureau of Economic Research.
Engen, Eric M., and William G. Gale (1997). ConsumptionTaxes and Saving: The Role of Uncertainly in Tax Re-form. AEA Papers and Proceedings 87, 2 (May).
Ernst & Young (1998). Tomorrow’s Taxes. Ernst & Young’sAnalysis of the Report of The Technical Committee onBusiness Taxation (April).
Fagerber, Jan (1994). Technology and International Differ-ences in Growth Rates. Journal of Economic Literature32, 3 (September): 1147–75.
Federal Reserve Bank of Dallas (1995). By Our Own Boot-straps: Economic Opportunity and the Dynamics of In-come Distribution. Dallas, TX: Federal Reserve Bank.
Feldstein, M., Ed. (1987). Taxes and Capital Formation. Chi-cago: University of Chicago Press.
Feldstein, Martin (1995). The Effect of Marginal Tax Rateson Taxable Income: A Panel Study of the 1986 Tax Re-form Act. Journal of Political Economy 103, 3: 551–72.
Feldstein, M., and J. Slemrod (1978). Inflation and the Ex-cess Taxation of Capital Gains on Corporate Stock.National Tax Journal 31, 2 (June):107.
Francis, Johanna, and Jason Clemens (1999). CharitableDonations and Tax Incentives. Fraser Forum (June):12–14.

60 Critical Issues Bulletin The Fraser Institute
Friedman, Milton, and Rose Friedman (1980). Free toChoose: A Personal Statement. New York: HarcourtBrace Jovanovich.
Fullerton, Don, and Diane Lim Rogers (1997). NeglectedEffects on the Uses Side: Even a Uniform Tax WouldChange Relative Goods Prices. AEA Papers and Pro-ceedings 87, 2 (May): 120–25.
Gale, William G. (1998). Don’t Buy the Sales Tax. PoliceBrief 31 (March). Digital document available atwww.brookings.edu.
Gramlich, E. (1994). Infrastructure Investment: A ReviewEssay. Journal of Economic Literature 32, 3 (Septem-ber): 1176–96.
Gravelle, J., and L. Kotlikoff (1989). The Incidence and Ef-ficiency Costs of Corporate Taxation when Corpo-rate and Noncocorporate Firms Produce the SameGood. Journal of Political Economy 97, 4 (August):749–80.
Gravelle, Jane G. (1996). Effects of Flat Taxes and Other Pro-posals on Housing: An Overview. Congressional Re-search Service: Report for Congress. Digitaldocument available at http://flattax.house.gov.
Grossman, Philip J. (1988) Government and EconomicGrowth: A Non-linear Relationship. Public Choice 56,2 (February): 193–200
Grossman, Gene M., and Elhanan Helpman (1994). Endog-enous Innovation in the Theory of Growth. Journal ofEconomic Perspectives 8, 1 (Winter): 23–44.
Grubel, Herbert (2000). The True Cost of Job CreationSchemes. National Post (March 7): C6.
Grubel, Herbert, and Michael A. Walker (1999). UsingCash Rebates for Tax Relief without Risk. Public PolicySources 19. Vancouver, BC: The Fraser Institute.
Gruber, Jon, and Emmanuel Saez (2000). The Elasticity ofTaxable Income: Evidence and Implications. Working Pa-per 7512. Cambridge: National Bureau of EconomicResearch.
Gunderson, Morely, and W. Craig Riddell (1993). LabourMarket Economics. Third Edition. Toronto: McGraw-Hill Ryerson.
Gwartney, James, and Richard Lawson, with Dexter Sami-da (2000). Economic Freedom of the World: 2000 AnnualReport, Vancouver, BC: The Fraser Institute.
Gwartney, James, and James Long (1985). Is the Flat Tax aRadical Idea? Cato Journal 5, 2 (Fall): 407–32.
Gwartney, James, Randall Holcombe, and Robert Lawson(1998). The Scope of Government and the Wealth ofNations. The Cato Journal 18, 2: 163–90.
Hall, Robert E. (1997). Potential Disruption from the Moveto a Consumption Tax. AEA Papers and Proceedings 87,2 (May): 147–50.
Hall, Robert E., and Alvin Rabushka. (1983). Low Tax, Sim-ple Tax, Flat Tax. New York: McGraw-Hill.
Hall, Robert E., and Alvin Rabushka (1995). The Flat Tax.Third Edition. Stanford, CA: Hoover InstitutionPress.
Hall, Robert E., Alvin Rabushka, Dick Armey, Robert Eis-ner, and Herbert Stein (1996). Fairness and Efficiency inthe Flat Tax. Washington, DC: American Enterprise In-stitute Press.
Hill, Roderick, and Muhammed Kabir (1996). Tax Rates,the Tax Mix, and the Growth of the UndergroundEconomy in Canada: What Can We Infer?” CanadianTax Journal 44, 6: 1552–83.
Horrigan, Brian R. (1985) The Tax Reform Controversy: AGuide for the Perplexed. Business Review (May-June):3–15. Federal Reserve Bank of Philadelphia.
Horry, Isabella, and Michael Walker (1994). GovernmentSpending Facts Two. Vancouver, BC: The Fraser Insti-tute.
Howitt, P., Ed. (1996). The Implications of Knowledge-BasedGrowth for MicroEconomic Policies. The Industry Cana-da Research Series. Calgary, AB: University of CalgaryPress.
Hubbard, R. Glenn (1997). How Different Are Income andConsumption Taxes. AEA Papers and Proceedings 87, 2(May): 138–42.
Hunter, William J., and Charles E. Scott (1987). The Impactof Income Tax Progressivity on Tax Revenue. Public Fi-nance Quarterly 15, 2 (April): 188–98.
Income Security Programs Branch, Human Resources De-velopment Canada (2000). Canada Pension Plan BenefitRates 2000. Digital document available at www.hrdc-drhc.gc.ca/isp/studies/trends/cpp-rates_e.shtml.
Iqbal, Mahmood (1994). A Corporate Tax Comparison forCanada, the US and Mexico. Canadian Business Eco-nomics 3, 1 (Fall): 54–64.
James, Steven (1997). A Public versus a Private Canada Pen-sion Plan: A Survey of the Economics. Working Papers97–04 (June). Ottawa: Department of Finance.
Jao, Y.C. (1978). Hong Kong: Tax Structure and Fiscal Poli-cy. International Bureau of Fiscal Documentation Bulletin32, 6: 251–54.
——— (1981). Tax Changes and Reforms in Hong Kong.International Bureau of Fiscal Documentation Bulle-tin 35, 8–9: 401–07.

The Fraser Institute Flat Tax 61
Jarvis, Sarah, and Stephen P. Jenkins (1998). How Much In-come Mobility Is There in Britain? The Economic Jour-nal 108 (March): 428–43.
Jestin, Warren, Randall Powley, Mary Webb, and PatriciaMohr (1999). Debt Reduction Takes Back Seat to TaxCuts and New Spending. Scotiabank Economic Direc-tions (February 16.
Johns, R.A. (1983). Tax Havens and Offshore Finance: A Studyof Transnational Economic Development. London:Frances Pinter.
Johns, R.A., and C.M. Le Marchant (1993). Finance Centres:British Isle Offshore Development since 1979. New York:St. Martin’s Press.
Jorgenson, Dale W., and Yun Kun-Young. (1991) The Ex-cess Burden of Taxation in the United States. Journalof Accounting, Auditing, and Finance 6, 4 (Fall): 487–508.
Jorgenson, Dale W., and Peter J. Wilcoxen (1997). TheLong-Run Dynamics of Fundamental Tax Reform. AEAPapers and Proceedings 87, 2 (May): 126–32.
Kaye, Barry (no date). Who Would The New Flat Tax Help?Everyone! Digital document available on the internetat www.barrykaye.com.
Kesselman, Jonathan R. (1990). Rate Structure and PersonalTaxation: Flat Rate or Dual Rate? Victoria UniversityPress for the Institute of Policy Studies.
Kesselman, Jonathan R. (1997). General Payroll Taxes: Eco-nomics, Politics, and Design. Toronto: Canadian TaxFoundation.
Kesselman, Jonathan R. (1998). Tax Cuts for Growth andFairness. Policy Options (December): 13–16.
Kesselman, Jonathan R. (1999). Rate Cuts and Base Re-forms: The Best Mix for Personal Taxes. Prepared forthe Canadian Tax Foundation Tax Policy Conference,Personal Income Tax Reform: Building a BetterMousetrap, Ottawa, Ontario (April 9/10).
Ketl, Donald F. (1997). Taxing Reforms: Assessing the Plans toTransform the IRS. Policy Brief 22 (August). Digitaldocument available on the internet at www.brook-ings.edu.
Kneller, Richard, Michael F. Bleaney, and Norman Gemmell(1999). Fiscal Policy and Growth: Evidence fromOECD Countries. Journal of Public Economics 74, 2 (No-vember: 171–90.
Koester, Reinhard, and Roger Kormendi (1989). Taxation,Aggregate Activity and Economic Growth: Cross-Country Evidence on Some Supply-Side Hypotheses.Economic Inquiry 27: 367–86.
Krauss, Melvyn (1997). How Nations Grow Rich: The Case forFree Trade. Oxford: Oxford University Press.
Lai, Mary (1982). 15 Percent Tax—and Still TaxpayersGrumble. International Bureau of Fiscal DocumentationBulletin 36, 5: 197–99.
Lemieux,Thomas, Bernard Fortin, Pierre Frechettee(1994). The Effect of Taxes on Labor Supply in theUnderground Economy. American Economic Review 84,1: 231–54.
Spiro, Peter S. (1997). Taxes, Deficits and the Under-ground Economy. In Owen Lippert and Michael Walk-er (Eds.), The Underground Economy: Global Evidence ofits Size and Impact (Vancouver, BC: The Fraser Insti-tute): 37–52.
Lipsey, Richard (1996). Economic Growth, TechnologicalChange, and Canadian Economic Policy. BenefactorsLecture, Toronto, CD Howe Institute.
Lopez-Pancheco, Alexandra (1999). Taxed to Death. Finan-cial Post Magazine (February):14–22.
Lucas, Robert E. (1990). Supply-Side Economics: An Ana-lytical Review. Oxford Economic Papers 42 (April):293–316.
Mackness, William (1998). Canadian Public Spending: TheCase for Smaller More Efficient Government. Public Pol-icy Sources 13. Vancouver, BC: The Fraser Institute.
Macnaughton, Alan, Thomas Matthews, and Jeffrey Pitt-man (1998). “Stealth Tax Rates”: Effective versusStatutory Personal Marginal Tax Rates. Canadian TaxJournal 46, 5: 1029–66.
Maddison, Angus (1991) Dynamic Forces in Capitalist Devel-opment: A Long Run Comparative Perspective. Oxford:Oxford University Press.
McCallum, John (2000). Will Canada Matter in 2020? (Basisfor remarks in Lecture Series 2020: Building the Fu-ture, University of Waterloo, February 16). CurrentAnalysis. Toronto, ON: Royal Bank of Canada . Digitaldocument available on the internet at www.royal-bank.com/economics.
McEvoy, Michael R. (1996). Clear Understanding of Flat-TaxConcept Needed. Rochester Business Journal (April 12).
Mitchell, Daniel J. (1997). Flat Tax or Sales Tax? A Win-WinChoice for America. Backgrounder 1134 (August 14).Washington, DC: The Heritage Foundation. Digitaldocument available on the internet at www.heri-tage.org.
McQuillan, Peter, and E. Cal Cochrane (1996). Capital TaxesIssues. Working Paper 96-8. Prepared for the Techni-cal Committee on Business Taxation.

62 Critical Issues Bulletin The Fraser Institute
Milroy, Robert B. (1999). The Channel Islands: Guernseyand Jersey—How They Are Different. Offshore FinanceCanada (September/October).
Mintz, Jack M. (1999). Why Canada Must Undertake BusinessTax Reform Soon. C.D. Howe Institute.
Mintz, Jack M. (2000). Competitiveness and EconomicGrowth in Ontario. Unpublished paper prepared forthe Ontario PC Party Policy Convention (February 12).
Mintz, Jack, and Finn Poschmann (1999). Economic As-pects of Personal Income Tax Co-ordination. Pre-pared for the Canadian Tax Foundation 1999 TaxPolicy Conference, Ottawa (April 9–10).
Mintz, Jack M., and Thomas A. Wilson (2000). Capitalizingon Cuts to Capital Gain Taxes. C.D Howe Institute Com-mentary (February).
Mirus, Rolf, Roger S. Smith, and Vladimir Karoleff (1994).Canada’s Underground Economy Revisited: Updateand Critique. Canadian Public Policy 20, 3: 235–52.
Mitchell, William C., and Randy T. Simmons (1994). BeyondPolitics. Oxford: Westview Press.
Mitchell, Daniel J. (1997a). Flat-tax or Sales Tax? A Win-WinChoice for America. Washington, DC: Heritage Foun-dation. Digital document available on the Internet atwww.heritage.org.
——— (1997b). A Guide to The Flax Tax: What Everyone inBusiness Should Know. Washington, DC: The HeritageFoundation. Digital document available on the inter-net at flattax.house.gov.
Mullen, John, and Martin Williams (1994). Marginal TaxRates and State Economic Growth. Regional Scienceand Urban Economics 24, 6: 687–705.
Murdock, Deroy (1995). Hong Kong’s Prosperity Is Built,in Part, on a Flat Tax. The Orange County Register (May21).
Musgrave, Richard A. (1997). Reconsidering the FiscalRole of Government. AEA Papers and Proceedings 87, 2(May): 156–59.
National Commission on Economic Growth and Tax Re-form (1996). A New Tax System For The 21ST Century.Unleashing America’s Potential: A Pro-Growth, Pro-Fami-ly Tax System for the 21st Century. Digital documentavailable on the internet at flattax.house.gov/details/.
Noreau, Nathalie, Maryanne Webber, Philip Giles, and Ali-son Hale (1997). Crossing the Low Income Line. Ottawa:Statistics Canada.
Office of the Superintendent of Financial Institutions(1997a). Canada Pension Plan: 17th Actuarial Report.Digital document available at www.osfi-bsfi.gc.ca.
Office of the Superintendent of Financial Institutions(1997b). Old Age Security Program: 4th Actuarial Report.Digital document available at www.osfi-bsfi.gc.ca.
O’Neill, Tim (2000). A Primer on the 2000 Federal Budget. Bankof Montreal Commentary (February 18). Digital docu-ment available on the internet at www.bmo.com.
Organisation for Economic Cooperation and Develop-ment [OECD] (1997). OECD Economic Surveys 1997,Canada. Paris: OECD.
Organisation for Economic Cooperation and Develop-ment [OECD] (1998). Harmful Tax Competition: AnEmerging Global Issue. Paris: OECD.
Organisation for Economic Cooperation and Develop-ment [OECD] (1998). OECD Revenue Statistics 1965–1997. Paris: OECD.
Organisation for Economic Cooperation and Develop-ment [OECD] (1999). OECD Economic Outlook (Decem-ber). Paris: OECD.
Organisation for Economic Cooperation and Develop-ment [OECD] (1999). OECD Economic Surveys 1999,Canada. Paris: OECD.
Orr, Dale, and Bob Dugan (2000). The Economic Impact ofthe Reform Party’s Proposals for Personal Income Tax Re-duction. Project completed for the Reform Party ofCanada (January).
Pack, Howard (1994). Endogenous Growth Theory: Intel-lectual Appeal and Empirical Shortcomings. Journalof Economic Perspectives 8, 1 (Winter): 55–72.
Peden, E.A., and M.D. Bradley (1989). Government Size,Productivity, and Economic Growth: The Post-WarExperience. Public Choice 61, 3 (June): 229–46.
Peden, Edgar (1991). Productivity in the United States andIts Relationship to Government Activity: An Analysisof 57 Years, 1929–1986. Public Choice 69: 153–73.
Penner, Rudolph G. (1982). The More or Less Flat Tax. TheAEI Economist (August).
Peterson, Peter G. (1999). Gray Dawn: How the Coming AgeWave Will Transform America—and the World. NewYork: Random House.
Poddar, Satyar, and Morley English (1999). Canadian Taxa-tion of Personal Investment Income. Canadian TaxJournal 47, 5: 1270–1304.
Report of the Technical Committee on Business Taxation,(December 1997). Report of the Technical Committee onBusiness Taxation (December). Ottawa: Dep’t of Fi-nance, Gov’t of Canada.
Reynolds, Alan (1997). Death, Taxes and the Charitable Sec-tor. Washington, DC: The Hudson Institute. Digitaldocument available www.hudson.org.

The Fraser Institute Flat Tax 63
Reynolds, Alan (1999). The Hong Kong Tax System. TheHudson Institute.
Robson, William B.P., Jack M. Mintz, and Finn Poschmann(2000). Budgeting for Growth: Promoting Prosperitywith Smart Fiscal Policy. C.D. Howe Institute Commen-tary 134.
Rosenberg, N., R. Landau, and David Mowery, Eds. (1992).Technology and the Wealth of Nations. Stanford, CA:Stanford University Press.
Royal Bank (2000). Canada-U.S. Outlook. Royal Bank Fore-cast revisions. Economics Department. Digital docu-ment available on the internet at www.royalbank.com/economics.
Samida, Dexter (1998). The Predictable Nature of Poverty.Fraser Forum (October): 17–18.
Sarlo, Christopher A. (1996). Poverty in Canada. 2nd Edi-tion. Vancouver, BC: The Fraser Institute.
Sarlo, Christopher A. (1998). Canadian Living Standards:1998 Report. Critical Issues Bulletin. Vancouver, BC:The Fraser Institute.
Schaefer, Rebecca S. (no date). Straight Talk about the FlatTax. Citizens for a Sound Economy Foundation. Dig-ital document available on the internet at flat-tax.house.gov.
Scully, G. (1991). Tax Rates, Tax Revenues and EconomicGrowth. NCPA Policy Report 98. Dallas, TX: NationalCenter for Policy Analysis.
Shapiro, Robert J. (1996). Why Fairness Matters: Progressiveversus Flat Taxes. Progressive Foundation (April).
Simon, Carl, and A. Witte (1982). Beating the System: TheUnderground Economy. Boston: Auburn House.
Slemrod, Joel (1997). Deconstructing the Income Tax. AEAPapers and Proceedings 87, 2 (May): 151–55.
Solberg, Monte (2000). Solution 17: The Single Rate Tax.The Canadian Alliance.
Sowell, Thomas (no date). The Vision of the Anointed. NewYork: Basic Books.
States of Jersey, Policy and Resources Committee (1991).Strategic Policy Report, 1991.
Statistics Canada (1998). Caring Canadians, Involved Cana-dians: Highlights from the 1997 National Survey of Giv-ing, Volunteering and Participating. Highlightsavailable on the Internet at www.statcan.ca.
Statistics Canada (1999). Customized data request to Sta-tistics Canada from The Fraser Institute.
Steuerle, C. Eugene (1998). The Simple Arithmetic of Flat Tax-es. Washington, DC: The Urban Institute. Digital docu-ment available on the internet at www.urban.org.
Stuart, C. (1984). Welfare Costs per Dollar of AdditionalTax Revenue in the US. American Economic Review 74(June): 352–62.
Tanzi, Vito, Ed. (1982). The Underground Economy in the USand Abroad. Lexington, MA: DC Heath.
Tanzi, Vito, and Ludger Schuknecht (1995). Growth of Gov-ernment and the Reform of the State in Industrial Coun-tries. IMF Working Paper 130. Washington, DC:International Monetary Fund.
Tanzi, Vito, and Ludger Schuknecht (1997a). Can SmallGovernments Secure Economic and Social Well-Be-ing? In Herbert Grubel (Ed.), How to Use the Fiscal Sur-plus: What is the Optimal Size of Government?(Vancouver, BC: The Fraser Institute): 69–92.
Tanzi, Vito, and Ludger Schuknecht (1997b). Reconsider-ing the Fiscal Role of Government: The InternationalPerspective. AEA Papers and Proceedings 87, 2 (May):164–68.
Tax Foundation (US) (1985). Flatter Taxes and Fatter Bases.Washington, DC: Tax Foundation.
Taylor, Peter M. (1997). Developing Policy Analysis of Fun-damental Tax Reform. AEA [American Economic Associ-ation] Papers and Proceedings 87, 2 (May): 133–37.
Ventura, Gustavo (1999). Flat Tax Reform: A QuantitativeExploration. Journal of Economic Dynamics & Control23: 1425–58.
Wagner, Richard E. (1997). Choice, Exchange, and Public Fi-nance. AEA Papers and Proceedings 87, 2 (May): 160–63.
Walker, Michael (1983). On Flat-Rate Tax Proposals. Van-couver, BC: The Fraser Institute.
Watson, William (2000). Wanted: Tax Guy with OrangeHair, Red Nose. National Post (February 16): C7.
Webber, Maryanne, and Mike Sheridan (1998). LabourMarket Dynamics: Information for New Canadian Longi-tudinal Sources. Ottawa: Statistics Canada.
Webber, Maryanne, Cathy Cotton, Mauri Meere, KevinBishop, and Peter Hewer (1999). A Comparison of theResults of the Survey of Labour and Income Dynamics(SLID) and the Survey of Consumer Finances (SCF), 1993.Ottawa: Statistics Canada.
Zelder, M. and P. Basham (2000). Does Revenue CanadaPlay Matchmaker? Fraser Forum (March): 8–10.


Th
e F
rase
r Institu
te1770 Burrard Street, Vancouver , B.C. Canada V6J 3G
7
Canadian Publications Mail Sales
Product Agreement #
0087246
Return Postage Guaranteed