2.0 factors affecting water quality in the whcl
TRANSCRIPT

2-1 WHCL Water Quality Management Plan Final December 2010
2.0 Factors Affecting Water Quality in the WHCL
Lake eutrophication is a natural process of increasing nutrient enrichment and biological productivity that can be exacerbated by anthropogenic land uses (Gill et al. 2005). The accelerated eutrophication due to human activities is termed “cultural eutrophication”. Increased nutrients associated with eutrophication can increase algal growth (algal blooms) (Smith et al. 1999), in turn increasing turbidity, particulate organic matter, and dissolved organic particulate matter in lakes.
Historic water quality impacts in the WHCL, the implications of relevant state and federal regulations for water quality restoration, and a characterization of water quality in the WHCL are presented in this section, thereby establishing the need for management projects. In addition to nutrients and chlorophyll a, several other factors may influence water quality, including: long-term hydrologic alterations, stormwater runoff, historic point source discharges (particularly phosphorus), extent of submerged aquatic vegetation (SAV) and emergent aquatic vegetation (EAV), and hydrologic connections to forested wetlands. The potential effects of these factors on water quality in the WHCL are discussed here.
2.1. Historic Water Quality Impacts
Historical drainage projects and development patterns throughout the U.S. have altered the hydrologic functions in watersheds and subsequently resulted in long-term impacts to water supply and water quality, flood regimes, and fish and wildlife habitat. The movement and storage of water for human uses such as agriculture, homes, schools, businesses, industry, and roads has relied on drainage and diversion construction projects for many years. In addition, urban development often occurs first in the highest, driest areas with the greatest potential for aquifer recharge. The last areas to be developed are usually those that were historically wet; often these are still prone to flooding.
Hydrologic alterations such as dams, control structures, and drainage canals can adversely affect volumes, locations, and timing of natural stormwater and stream flows, and natural hydrologic functions in the watershed. These changes may be anthropogenic or climate induced. Hydrologic impacts due to urbanization are reported to cause water quality problems such as sedimentation, increased temperatures, habitat changes, and the loss of fish populations and several case studies indicate that these problems are caused by increased runoff volumes and velocities from urbanization and associated increases in watershed imperviousness (EPA 2010). For example, floodplains with substantial hydrologic connection to streamflow may trap (riparian retention) large amounts of sediment and associated nutrients and other contaminants (Brinson 1988, Hupp et al. 1993, 2008, Noe and Hupp 2005, 2009). Unfortunately, these water quality functions of floodplains may not apply where there has been widespread alteration of fluvial processes by human activity, e.g. dam construction, channelization, and concentrated land use (Sharitz and Mitsch 1993). In general, these alterations typically disrupt fluvial dynamic equilibrium (Hack 1960) such that the normal floodplain to streamflow connectivity may be decreased or increased (Hupp et al. 2009).

Factors Affecting Water Quality in the WHCL
2-2 WHCL Water Quality Management Plan Final December 2010
Stormwater runoff increases pollutant loads and stormwater collection and conveyance systems. Consequently, pollutants may rapidly wash into downstream receiving waters and adversely impact water quality (Figure 2-1). Pollution from nonpoint sources accounts for most of the water quality problems in the State of Florida. Typically, nonpoint source pollution is associated with stormwater runoff from residential, urban, and agricultural activities and the associated transport of sediments, nutrients, pathogens and pesticides. Urban land uses and activities can also degrade ground water quality and contaminate wells in ground water supply aquifer areas if stormwater with high pollutant loads is directed into the soil without adequate treatment.
Prior to the enactment of Clean Water Act and amendments to the Act in the early 1970s, wastewater discharges to flowing waters were largely unregulated and streams were used to dilute and transport wastes from their sources. While environmental regulations have resulted in substantial improvements in wastewater treatment, wastewater discharges still contribute to increased stream flows and pollutant concentrations in waterbodies.
The Peace Creek watershed has also undergone substantial alteration for the purpose of agricultural and urban development. The higher, drier areas in the headwaters/ridge portion of the watershed were developed first for residential and business use. These high-recharge areas historically helped maintain water levels and water quality in the lakes, streams, and aquifer systems. Historical drainage "improvements" (as opposed to present-day stormwater treatment systems) diverted rainwater that once percolated into the surficial aquifer into the lakes. Regional water withdrawals and commensurate loss of surface water to lower aquifers, and changes in infiltration, flow, and storage have contributed to lowered lake levels and degraded water quality.
Urban development in the WHCL watershed increased the extent of impervious (e.g. pavement, rooftops) surfaces, increased stormwater runoff, decreased infiltration of water into aquifers, and increased pollutant loads to the lakes (stormwater runoff is the third largest cause of lake water quality impairment in the U.S. (EPA 2003)). Navigable canals constructed in the 1920s ultimately decreased water storage. Some lakes were lowered for agricultural or urban uses and wetlands were drained for agricultural uses. Lowering lake levels decreases hydrologic connections between some lakes and forested wetlands and can adversely impact habitat available to fish and wildlife during the wet season.
While point source discharges have been eliminated from those lakes that had them, nutrient issues from non-point and past point source discharges may persist in the lake sediments and extend the time before a lake returns to a steady state, i.e. the rates of sediment phosphorus release are in equilibrium with newly established rates of labile (available to plants) phosphorus deposition (Lewis et al. 2007).
Regional water withdrawals from the Floridan aquifer for urban, mining, and agricultural activities have decreased aquifer water levels and lowered the potentiometric surface (water levels in Floridan aquifer wells) by as much as 50 feet (SWFWMD 2007, Figure 2-2). While the center of the drawdown has shifted from Polk County during the period of predevelopment to 1975 to Hillsborough and Manatee counties in 2000, aquifer declines have greater impacts in areas with less developed confining units and leaky lakes as is the case in the Winter Haven area.

Figure 2-1. Impacts to watershed due to conversion from natural landscapes to urban development (PBS&J 2007).
Factors Affecting Water Quality in the WHCL
2-3 WHCL Water Quality Management Plan
Impacts to watershed due to conversion from natural landscapes to urban development (PBS&J 2007).
Factors Affecting Water Quality in the WHCL
WHCL Water Quality Management Plan Final December 2010
Impacts to watershed due to conversion from natural landscapes to urban development (PBS&J 2007).

Factors Affecting Water Quality in the WHCL
2-4 WHCL Water Quality Management Plan Final December 2010
Figure 2-2. Relative, long-term changes in the potentiometric surface of the Floridan aquifer (SWFWMD 2007).
In addition to anthropogenic impacts to water quality, natural, long-term seasonal rainfall patterns and associated hydrologic (ground water and surface water) changes affect water quality. Large rainfall events can increase stormwater and associated pollutant loads into lakes, while low rainfall can result in declining aquifers and low lake levels. In central Florida, the summer wet season accounts for nearly 60 percent of the 52 inches of total average annual precipitation. Streams, wetlands, and surficial ground water levels are typically at their lowest during May (end of dry season) and highest during September and October (end of wet season). Intense El Niño/Southern Oscillation (ENSO) events can result in atypical, extended periods of heavy rainfall during the typically dry season and dramatically alter the annual hydroperiod. Short term extremes of high and low flows influence the watershed budget over periods of years, while larger cyclic periods may cover a number of decades.
The City of Winter Haven is taking a long-term planning approach to addressing water resources, including water supply, water quality, flooding and natural systems, by implementing its recently approved (December 2010) Sustainable Water Resource Management Plan (SWRMP). The SWRMP points to nearly a century of drainage practices that have discharged water during times of need, low water levels in lakes, hydrologic alteration that has affected water quality, and declining aquifer recharge. The SWRMP is also consistent with the SWFWMD Southwest Water Use Caution Area (SWUCA), established in 1992, which includes ensuring sufficient water supply for existing and projected reasonable beneficial uses as one of four recovery goals. The SWRMP is primarily focused on Winter Haven, but incorporates all of

Factors Affecting Water Quality in the WHCL
2-5 WHCL Water Quality Management Plan Final December 2010
the Peace Creek Watershed, which also includes all or parts of Auburndale, Lake Alfred, Haines City, Lake Hamilton, Dundee, Lake Wales, Alturas, Wahneta, Bartow, Eagle Lake and unincorporated Polk County. The SWRMP focuses on planning principles that will ensure that adequate water is available for people, industry, agriculture, and the environment.
2.2. State and Federal Regulations and Water Quality Impairments: Total Maximum Daily Loads (TMDLs), Numeric Nutrient Criteria (NNC), Pollutant Load Reduction Goals (PLRGs)
Under section 303(d) of the Clean Water Act, Florida (like all states) is required to develop a list of impaired waters (waters that do not meet the water quality standards set by the State of Florida), establish priority rankings for listed waters, and develop TMDLs for these waters. EPA determines if a submitted TMDL fulfills the legal requirements for approval under Section 303(d) and various and affiliated EPA regulations. In 2010, EPA proposed and then adopted rules to establish NNC.
The FDEP is responsible for developing and implementing TMDLs for impaired waterbodies in Florida, and therefore in the WHCL. A TMDL represents the maximum amount of a given pollutant that a waterbody can assimilate and still meet its appropriate water quality standards, which are based on the waterbody type (i.e. lake, stream, estuary) and designated use(s) (e.g. potable water supply, recreation). The WHCL is designated by FDEP as “Class III fresh waterbodies, with a designated use of recreation, propagation, and maintenance of a healthy, well-balanced population of fish and wildlife.”
Florida’s TSI is a measure of the degree of impairment, or eutrophication, of a lake based on total phosphorus (TP), total nitrogen (TN), and chlorophyll a. Currently, FDEP uses a TSI value of 60 to establish impairment (and corresponding TMDLs) for the WHCL, consistent with the TSI established previously by the SWFWMD for the WHCL pollutant load reduction goals (PLRG) (USF 2005). However, paleolimnological data used to develop the TSI goal were based on only five of the WHCL, and may be over- or under- protective of individual lakes. In the WHCL, the lakes are managed based on levels of nutrients and chlorophyll a combined.
Sixteen lakes in the WHCL are listed as impaired for nutrients based on Florida’s TSI. Lakes in the WHCL are listed in Table 2-1 and identified as to impairment, TMDL status (TMDL required or adopted), and other information relevant to meeting a TMDL. For example, Lake Howard is designated as impaired and therefore has a TMDL that identifies load reductions necessary to meet water quality standards (declared in 2005). As part of the TMDL implementation, FDEP develops Basin Management Action Plans (BMAPs) to identify specific BMP projects to achieve the TMDLs, that is, to restore and protect impaired waters. The BMAP implemented for Lake Howard successfully reduced nutrient loading to the lake, however, Lake Howard remains impaired due to factors including legacy phosphorus released from lake sediments.

Factors Affecting Water Quality in the WHCL
2-6 WHCL Water Quality Management Plan Final December 2010
Table 2-1. WHCL lakes identified by impairment and TMDL status.
Lake WBID # Chain If Impaired,
Year Declared
If Delisted, Year of
Delisting
TMDL Developed
and Adopted
TMDL Needs to be Developed
Fannie 14882 Northern 2005 2005*
Henry 1504A Northern
Hamilton 15041 Northern
Hartridge 1521I Southern 2005 2005*
Winterset 1521A Southern 2005 2005*
Roy 1521O Southern
Summit 1521M Southern
Smart 1488A Northern 2005 X
Mariana 1521L Southern 2010 X
Little Hamilton 15001 Northern 2010 X
Eloise 1521B Southern 2005, 2010 2005* X
Spring 1521G1 Southern
Haines 1488C Northern 2005 X
Mirror 1521G Southern 2005 2010† X
Idylwild 1521J Southern 2005 2010† X
Howard 1521F Southern 2005 2010† X**
Middle Hamilton 15002 Northern
Cannon 1521H Southern 2005 2010† X
Shipp 1521D Southern 2005 2010† X
Rochelle 1488B Northern 2005 X
Lulu 1521 Southern 2005 2010† X**
May 1521E Southern 2005 2010† X**
Jessie 1521K Southern 2005 2010† X
Conine 1488U Northern 2005 X
Blue 1521Q Southern 2010 X
Based on Group 3, Cycles 1 and 2 Verified Impaired and Delist List (FDEP 2010)
Shaded cells- Not Applicable
* Delisted based on paleolimnological data supporting historic eutrophic conditions
† Delisted due to TMDL adoption requiring phosphorus load reduction
**TMDL Required phosphorus load reduction met
Factors Affecting Water Quality in the WHCL
2-7 WHCL Water Quality Management Plan Final December 2010
2.3. Nutrient Impairments and Criteria for Water Quality Restoration
Annual mean chlorophyll a values and TSI values are the primary means for assessing nutrient impairment in a waterbody, pursuant to FDEP’s Impaired Waters Rule (IWR), as approved by EPA. Several lakes in the WHCL are designated by FDEP as impaired for nutrients based on elevated annual average TSI values, which is calculated for Florida lakes using TN, TP, and chlorophyll a data, as described previously. To better address nutrient impairment from nonpoint (non-regulated) sources, FDEP recently revised the IWR to include numeric nutrient impairment thresholds.
EPA (2010) classified Florida’s lakes into three groups: colored (> 40 PCU), clear and alkaline (< 40 PCU), clear and acidic (<40 PCU), and then assigned TN, TP and chlorophyll a criteria to each lake group based on the biological response (chlorophyll a production) to TN and TP levels in Florida’s lakes (Figure 2-3, Figure 2-4). An accompanying approach is also proposed that allows Florida to adjust TN and TP criteria for a particular lake if TN and TP data are sufficient to demonstrate that the chlorophyll a criteria will still be met. The EPA NNC are calculated using lake alkalinity in addition to color.
NNC established by EPA are not site-specific and consequently, some criteria thresholds may be inappropriate for particular regions. EPA’s proposed NNC distinguishes clear, acidic lakes from clear, alkaline lakes for the WHCL using 20 mg CaCO3/liter alkalinity. This distinction is important because the chlorophyll a and nutrient targets for clear acidic lakes are much lower (more stringent) than those for clear alkaline lakes. Alkalinity data are unavailable for the majority of lakes in the WHCL. As such, specific conductivity was used as a surrogate for alkalinity to evaluate the WHCL.
Local lake specific conductivity data indicated that 164 µmhos/cm was an appropriate surrogate for the 20 mg CaCO3/liter alkalinity as the threshold specific conductivity for a lake to be classified as clear and alkaline rather than clear, acidic. In fact, there will be a mechanism/process to have site specific alternative criteria (SSAC) established, contingent upon submittal of scientifically defensible recalculations that meet the requirements of Clean Water Act Section 303(c) and approval by the EPA. Consequently, 164 µmhos/cm was used to classify lakes for identifying lake-specific NNC values in this WQMP. Using this information, lakes in the WHCL were classified as clear and colored, and alkaline and acidic (PBS&J 2008) and lake-specific nitrogen, phosphorus, and chlorophyll a values were calculated to provide “targets” for meeting NNC.
EPA chlorophyll a NNC values, in-lake geometric mean (1997 to 2007) chlorophyll a values, and chlorophyll a percent concentration reductions required (if any) to meet NNC chlorophyll a
values are listed for each of the WHCL (colored and clear, acid and alkaline) in Table 2-2. Similarly, EPA TP and TN NNC values, in-lake geometric mean TP and TN values, and percent concentration reductions in TP and TN necessary to meet NNC are listed in Table 2-3. Annual and long-term (1997-2007) geometric means were calculated for chlorophyll a, TN, and TP for each lake as outlined in the EPA NNC. The median percent chlorophyll a reduction for the 25 lakes is 27, indicating that a chlorophyll a reduction of about 27 percent is needed for lakes in the WHCL to meet the proposed EPA NNC criteria. Lakes Fannie, Hamilton, Hartridge, Henry,

Factors Affecting Water Quality in the WHCL
2-8 WHCL Water Quality Management Plan Final December 2010
Little Hamilton, Summit, and Winterset have geometric mean chlorophyll a levels (1997 to 2007) below their relevant thresholds, although they may exceed the proposed values in some years: impairment is established by failure to meet criteria more than once in three years. Insufficient chlorophyll a data are available in Lake Roy for NNC comparison.
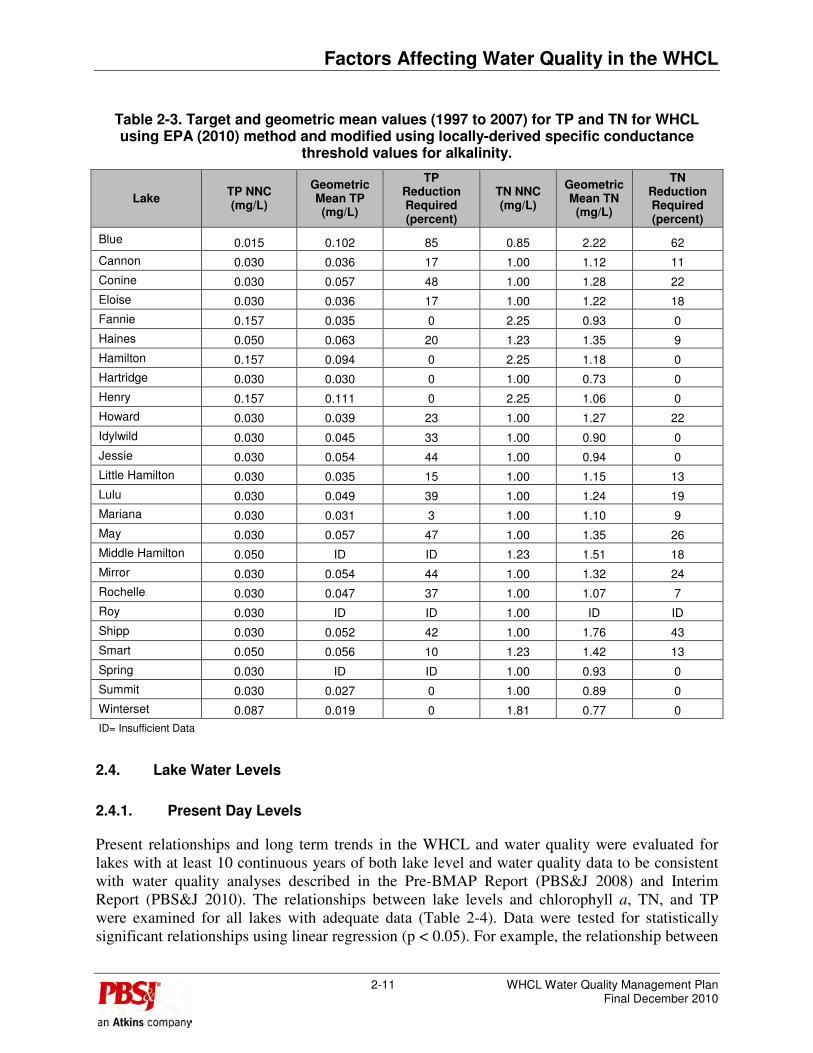
Target and geometric mean TP values and percent TP reductions for lakes in the WHCL are listed in Table 2-3. The mean (geometric) percent TP reduction required for all the lakes combined is 19 percent and represents the reduction needed to meet the EPA NNC. The median TN reduction for the listed values is 10 percent, although phosphorus control is considered more important for water quality in the WHCL when compared with nitrogen (FDEP 2007).
Figure 2-3. EPA numeric nutrient criteria guidance for high color lakes.

Factors Affecting Water Quality in the WHCL
2-9 WHCL Water Quality Management Plan Final December 2010
Figure 2-4. EPA Numeric nutrient criteria guidance for low color lakes.

Factors Affecting Water Quality in the WHCL
2-10 WHCL Water Quality Management Plan Final December 2010
Table 2-2. Target and geometric mean chlorophyll a values (1997 to 2007) for WHCL using EPA method (2010) modified for locally-derived specific conductivity values for
alkalinity.
Lake Chlorophyll
a NNC (µg/L)
If >1 Exceedance,
then Impaired
In-lake Geometric
Mean Chlorophyll a
(µg/L)
Percent Chlorophyll a
Reduction Required
Clear or Colored
Locally-derived: Acidic or Alkaline
Blue 6 Impaired 62 90 Clear Acidic
Cannon 20 Impaired 27 26 Clear Alkaline
Conine 20 Impaired 32 37 Clear Alkaline
Eloise 20 Impaired 33 39 Clear Alkaline
Fannie 20 Unimpaired 12 0 Colored NA
Haines 20 Impaired 39 49 Colored NA
Hamilton 20 Unimpaired 9 0 Colored NA
Hartridge 20 Unimpaired 15 0 Clear Alkaline
Henry 20 Unimpaired 5 0 Colored NA
Howard 20 Impaired 34 41 Clear Alkaline
Idylwild 20 Impaired 26 22 Clear Alkaline
Jessie 20 Impaired 28 29 Clear Alkaline
Little Hamilton
20 Impaired 18 0 Clear Alkaline
Lulu 20 Impaired 39 48 Clear Alkaline
Mariana 20 Impaired 23 12 Clear Alkaline
May 20 Impaired 42 53 Clear Alkaline
Middle Hamilton
20 Impaired 30 33 Colored NA
Mirror 20 Impaired 38 48 Clear Alkaline
Rochelle 20 Impaired 26 22 Clear Alkaline
Roy 20 Unimpaired ID ID Clear Alkaline
Shipp 20 Impaired 60 67 Clear Alkaline
Smart 20 Impaired 29 30 Colored NA
Spring 20 Impaired 22 9 Clear Alkaline
Summit 20 Unimpaired 15 0 Clear Alkaline
Winterset 20 Unimpaired 15 0 Clear Alkaline
NA=not applicable ID= Insufficient data
Factors Affecting Water Quality in the WHCL
2-11 WHCL Water Quality Management Plan Final December 2010
Table 2-3. Target and geometric mean values (1997 to 2007) for TP and TN for WHCL using EPA (2010) method and modified using locally-derived specific conductance
threshold values for alkalinity.
Lake TP NNC (mg/L)
Geometric Mean TP (mg/L)
TP Reduction Required (percent)
TN NNC (mg/L)
Geometric Mean TN
(mg/L)
TN Reduction Required (percent)
Blue 0.015 0.102 85 0.85 2.22 62
Cannon 0.030 0.036 17 1.00 1.12 11
Conine 0.030 0.057 48 1.00 1.28 22
Eloise 0.030 0.036 17 1.00 1.22 18
Fannie 0.157 0.035 0 2.25 0.93 0
Haines 0.050 0.063 20 1.23 1.35 9
Hamilton 0.157 0.094 0 2.25 1.18 0
Hartridge 0.030 0.030 0 1.00 0.73 0
Henry 0.157 0.111 0 2.25 1.06 0
Howard 0.030 0.039 23 1.00 1.27 22
Idylwild 0.030 0.045 33 1.00 0.90 0
Jessie 0.030 0.054 44 1.00 0.94 0
Little Hamilton 0.030 0.035 15 1.00 1.15 13
Lulu 0.030 0.049 39 1.00 1.24 19
Mariana 0.030 0.031 3 1.00 1.10 9
May 0.030 0.057 47 1.00 1.35 26
Middle Hamilton 0.050 ID ID 1.23 1.51 18
Mirror 0.030 0.054 44 1.00 1.32 24
Rochelle 0.030 0.047 37 1.00 1.07 7
Roy 0.030 ID ID 1.00 ID ID
Shipp 0.030 0.052 42 1.00 1.76 43
Smart 0.050 0.056 10 1.23 1.42 13
Spring 0.030 ID ID 1.00 0.93 0
Summit 0.030 0.027 0 1.00 0.89 0
Winterset 0.087 0.019 0 1.81 0.77 0
ID= Insufficient Data
2.4. Lake Water Levels
2.4.1. Present Day Levels
Present relationships and long term trends in the WHCL and water quality were evaluated for lakes with at least 10 continuous years of both lake level and water quality data to be consistent with water quality analyses described in the Pre-BMAP Report (PBS&J 2008) and Interim Report (PBS&J 2010). The relationships between lake levels and chlorophyll a, TN, and TP were examined for all lakes with adequate data (Table 2-4). Data were tested for statistically significant relationships using linear regression (p < 0.05). For example, the relationship between

Factors Affecting Water Quality in the WHCL
2-12 WHCL Water Quality Management Plan Final December 2010
lake water level and chlorophyll in Lake Blue (Figure 2-5) indicates a significant, albeit weak, inverse relationship: higher chlorophyll a levels correspond to lower lake levels.
Figure 2-5. Relationship between lake level (feet NGVD) and chlorophyll a for Lake Blue.
Data were inadequate to evaluate potential relationships in five of the lakes and relationships were inconsistent among the remaining lakes. While many relationships were significant (p < 0.05), correlations (r2 values) between lake levels and nutrient and chlorophyll a values were not strong. For example, chlorophyll a and lake levels had no relationship in 12 lakes, but correlations were negative in four lakes, and positive in four lakes. The highest r2 value for a chlorophyll a and lake level relationship was 0.35 for Lake Shipp, i.e. 35 percent of the variation in chlorophyll a levels in Lake Shipp could be explained by variation in lake levels. The relationships between lake levels and water quality should therefore be considered as guidance rather than rules per se.
Four lakes exhibited positive chlorophyll a - lake levels relationships, suggesting that higher runoff volumes increase both lake water levels and nutrient and chlorophyll a levels. In contrast, lakes Blue, Henry, Howard and Shipp had negative chlorophyll a – lake level relationship, suggesting that internal processes such as sediment re-suspension and re-mineralization may influence chlorophyll a more than external nutrient loads from stormwater runoff. At least two lakes (Shipp and Howard) previously received point source discharges (Table 2-5) and many of the lakes have received effluent from domestic and/or industrial discharges, sometimes for many decades (Table 2-5).
Chl-a vs. Lake Level - Lake Blue
(monthly data 1997 to 2007)
y = -31.53x + 4741.6
R2 = 0.2137; p < 0.05
0
20
40
60
80
100
120
140
160
180
146.0 146.5 147.0 147.5 148.0 148.5 149.0 149.5
Lake Level (ft)
Ch
l-a
(u
g / lit
er)

Factors Affecting Water Quality in the WHCL
2-13 WHCL Water Quality Management Plan Final December 2010
Table 2-4. Regression analysis of lake levels and chlorophyll a, TN, and TP using closest lake with adequate lake level data (data from PBS&J 2008).
Lake Chlorophyll a TP TN Stage Data Source
Blue Neg None Neg* Blue
Cannon Pos Pos Pos Howard
Conine Pos Pos None Conine
Eloise None None None Shipp
Fannie ID ID ID ID
Haines None Pos Pos Haines
Hamilton None None None Hamilton
Hartridge Pos Pos Pos Howard
Henry Neg Pos None Henry
Howard Neg None Neg* Howard
Idylwild Pos Pos Neg Howard
Jessie None Pos None Howard
Little Hamilton ID ID ID ID
Lulu None Neg Neg Shipp
Mariana ID ID ID ID
May None Neg Neg Shipp
Middle Hamilton ID ID ID ID
Mirror None None None Mirror
Rochelle None None None Rochelle
Roy ID ID ID ID
Smart None None None Smart
Shipp Neg Neg Neg Shipp
Spring None None None Mirror
Summit None Pos Neg Shipp
Winterset None None None Shipp
“NEG” = inverse relationship found. “NEG*” = inverse relationship found with evidence of nitrogen fixation. “POS” = positive relationship found. “NONE” = no significant relationship found. “ID” = insufficient data for analysis.

Factors Affecting Water Quality in the WHCL
2-14 WHCL Water Quality Management Plan Final December 2010
Table 2-5. Summary of available information on point source discharge history of various WHCL lakes (compiled from various sources).
Lake Status Discharge Source Comments
Eloise diverted in June 1975 Cypress Gardens WWTP 9.5 m3/d, 30kg P/year; 85 kg TN/year
Haines ended in 1992 Lake Alfred WWTP 77 percent lake TP load; 1,515 kg
P/year; 2,230 kg TN/year, 0.3 million gallons/day (MGD)
Howard discharge until 1977, capable
of overflow until 1980 Jan-Phyl Village WWTP ~1,500 lbs TP/year
Conine discharges ended Birds Eye
Conine discharges ended Pipping Packing Co.
Conine discharges ended Florida Citrus Salads
Conine ended in 1992 City of Winter Haven (CWH)
WWTP
Lulu ended in 1977 CWH WWTP 90 percent lake TP load, domestic
secondary effluent, 1.8 MGD in 1976
Lulu discharges ended Bordo's citrus processing
plant
Lulu discharges ended Snively plant
Lulu discharges ended Swift Fertilizer plant
Shipp discharges ended Robert Brothers vegetable
processing Sewer discharge until connected to the City, then sludge from tankers
Shipp discharges ended Bordo's citrus processing
plant
May closed in 1949 Imhoff Plant
May discharges ended Citrus
May discharges ended Velda
Jessie discharges ended Wastewater treatment plant
effluent
Shaded cells represent no available data. Data on total period of operation unavailable.
2.4.2. Historical Trends in Lake Levels
Longer term patterns in lake level changes were examined using lake level data from available sources, including SWFWMD and the U.S. Geological Survey (USGS) over a period of record (POR) that, in some cases, went back to the 1940s. Lake level data for lakes Cannon, Eloise, Hamilton, Howard, Lulu, and Smart suggest that these lakes are lower than they were 50 to 60 years ago. Heath (1961) also noted that Polk County lake levels had likely been affected by drainage as well as water withdrawals for public supply, agriculture, and/or phosphate mining and concluded that “…The construction of a canal to remove water from what previously had been a landlocked lake, for example, would change the stage characteristics…” Further, Kaufman (1967) concluded that “Pumpage from the Floridan aquifer has increased the hydraulic gradient between the lake surfaces and the piezometric surface and may be responsible in part for lowered lake levels in this area.” These conclusions, and the data for several of the lakes, contrast with conclusions of Spechler and Kroening (2006), who found little evidence of recent

Factors Affecting Water Quality in the WHCL
2-15 WHCL Water Quality Management Plan Final December 2010
declines in lake levels in Polk County (see Table 2-6). For example, Lake Clinch exhibited a significant decline in water levels from 1960 to 2003, while Scott Lake exhibited a significant incline, and both had relatively weak correlations (28 percent).
Spechler and Kroening (2006) found that only half of the 14 lakes they examined in Polk County exhibited evidence of a change in lake levels over the period of 1960 to 2003, and two (Scott Lake and Lake Mariana) had significant increases in lake levels during that time. However, with the exception of Lake Smart, lake level trends suggest lake level declines mostly during the 1940s and the 1950s. Consistent with the Spechler and Kroenig (2006) work, data for lakes Cannon, Eloise, Hamilton, Howard, Lulu, and Smart exhibit a wide range of lake levels over the past 20 to 30 years, however, there is no apparent continued decline in water levels over the past two to three decades.
Table 2-6. Summary of lake level trends in Polk County (Spechler and Kroening 2006).
Lake Name POR Analyzed Kendall’s tau (correlation)
Lake Clinch 1960-2003 -.28*
Lake Parker 1960-2003 .15
Crooked Lake 1960-2003 -.40*
Lake Hamilton 1960-2002 .01
Scott Lake 1960-2002 .29*
Mountain Lake 1960-1986, 1989-1999,2000-2003 -.53*
Lake Hancock 1960-2002 .08
Lake Howard 1960-2003 .11
Lake Mariana 1960-2003 .98*
Lake Deeson 1960, 1965-2003 .17
Lake Otis 1960-2003 -.08
Reedy Lake 1960-2003 .09
Lake Marion 1960-1993, 1998, 2001-2003 -.23*
Lake Wales 1960-2003 -.29*
*Indicates results of seasonal Kendall-Tau test is statistically significant (p<0.05)
Further analysis of lake level trends was completed using Geographic Information System techniques (GIS) to integrate elevation data and historic photography and existing lake edges. Historic lake edges were identified using General Land Office Survey (GLOS) maps (circa 1850) and data obtained from FDEP Bureau of Survey and Mapping (BSM), Land Boundary Information System (LABINS) website. Present day lake edges were established by referencing SWFWMD 2006 land use data and 2008 aerial photographs. Historic and present day lake level elevations for the lakes with adequate data are graphed in Figure 2-6.
Analyses indicate that most of lakes in the WHCL system (14 of 16 in Table 2-4) are at lower elevations than in the 1850s or earlier. This finding is supported by anecdotal observations from various sources (e.g. Stokes 1999). The average reduction in lake level elevations, from estimated historical conditions, is approximately five feet.

Factors Affecting Water Quality in the WHCL
2-16 WHCL Water Quality Management Plan Final December 2010
Figure 2-6. Comparison of lake level elevations (feet NGVD) for historical (1850s) and current (2005) conditions.
2.5. Historic Point Source Discharges and Legacy Sediments
Although the WHCL TMDL report (FDEP 2007) reports no current wastewater discharges to lakes in the WHCL, “legacy effects” of these prior discharges could delay or preclude improvements in water quality until and unless accumulated sediments are appropriately addressed. The impact of phosphorus inputs from lake sediments on water quality was not examined in the WHCL TMDL (FDEP 2007), but should be part of the development of lake restoration strategies.
Phosphorus inputs into lakes include external sources from the watershed and internal sources from the lake sediments. Phosphorus flux from sediments is sometimes sufficient to maintain anthropogenic eutrophication of a lake even when external phosphorus loads have been reduced or eliminated (Larsen et al. 1979, Ryding 1981). Consequently, after watershed management strategies reduce external phosphorus flux (e.g. stormwater treatment), recovery to a steady state (no net efflux of phosphorus from sediments into the water column) can be delayed many years if mechanisms controlling internal phosphorus flux due to sediments are not included in restoration plans (Haggard et al. 2005, Hullebusch et al. 2005) (Figure 2-7). Phosphorus from sediments occurs via two mechanisms: 1) diffusion of dissolved phosphate into the water column, and 2) the release of sediment pore water phosphorus or release of phosphorus adsorbed to sediment particles into the water column. Seasonal variation in phosphorus release into the water column has been attributed to changes in redox status and phosphorus concentration gradients at the sediment-water interface (Penn et al. 2000).
100
110
120
130
140
150
Lak
e E
lev
ati
on
(fe
et)
in
NG
VD
19
29
Historical Current

Factors Affecting Water Quality in the WHCL
2-17 WHCL Water Quality Management Plan Final December 2010
Figure 2-7. Influence of reduced external phosphorus reductions on phosphorus in water column (after Reddy et al. 1999).
The type of lake may also influence the effect of legacy phosphorus on water quality in the WHCL. Lakes in the WHCL watershed can be characterized as ridge or valley lakes, as described in section 1.0 of this WQMP. Ridge lakes are typically associated with sandy areas with high ground water recharge at higher elevations when compared with valley lakes, which are often dominated by surface water flows and located at lower elevations. Ridge lakes typically have marsh-dominated shorelines compared with forested wetlands that often characterize valley lakes. Ridge lakes, particularly those with a history of point source discharges, can be more susceptible to impacts from nutrient-enriched bottom sediments when compared with valley lakes (i.e. see Bachman et al. 2000). Sediments disturbed by wind or wave action can re-introduce nutrients into the water column and cause phytoplankton blooms. For valley lakes, lower lake levels can “disconnect” the lake from historical swamp shorelines, reducing the benefits of wetland-derived tannins that buffer the effects of increased nutrients (PBS&J 2008).
Phosphorus release into the water column can result from less dilution of internal nutrient loads due to lower water volumes and greater potential for wind-induced sediment resuspension with shallower water depths. For example, the Lake Dynamic Ratio concept for Florida lakes (Bachman et al. 2000) was used to predict decreases in sediment resuspension frequency (from once/week to once/two weeks) due to a 4 ½ feet increase in water levels in Lake Hancock (Tomasko et al. 2009). The study concluded that “…increases in effective water depth of Lake Hancock would likely bring about an improvement in water quality, due in part to conditions being less favorable for resuspension of bottom sediments.” For Lakes May, Shipp, and Lulu, ERD (2010) reported that “… windy conditions increased total suspended solids (TSS) by approximately 37 percent in Lake May, 33 percent in Lake Shipp, and 53 percent in Lake Lulu.”
Decisions regarding management and restoration of wetlands and aquatic systems are often difficult and controversial because they involve regulating phosphorus loads from external
Factors Affecting Water Quality in the WHCL
2-18 WHCL Water Quality Management Plan Final December 2010
sources. Implementation of phosphorus reduction goals can have significant costs and economic impacts and therefore an understanding of the physical, chemical, and biological processes that regulate water quality in the system is paramount. The effectiveness of phosphorus management can be measured by knowing: 1) the baseline phosphorus concentration of surface water, sediments, and biota, and 2) the mass phosphorus imports and export (budget) in the system.
Results from the ERD (2010) sediment study were used to calculate the length of time expected before the internal phosphorus loading reaches background conditions (i.e. steady state) for Lakes May, Shipp, and Lulu. Phosphorus decay to time of labile phosphorus depletion from sediments is expected to take more than twenty years in all three lakes (May- 403 years; Shipp- 76.3 years, Lulu- 142.4 years) (see individual lake descriptions in Section 4.0 for greater detail).
2.6. Rainfall and Lake Levels
Monthly average total rainfall data in Polk County for the 1915-2008 POR obtained from SWFWMD were used to evaluate monthly, annual, total wet season, and total dry season rainfall, as well as five-year moving averages for the POR. Wetter and drier periods of rainfall were apparent from trends in annual, but not monthly, total rainfall. During the 1950s, there were extended periods of wetter than average conditions, while two of the driest periods in the last 70 years occurred during the years 1999 to 2001 and 2006 to 2008. Both droughts corresponded with low rainfall during both wet and dry seasons. Dry season rainfall totals in 2001 and 2002 were the two lowest total recorded during the last 70 years (PBS&J 2010). In contrast, wet season rainfall in 2004 was the highest recorded over the POR, the same year central Florida was affected by hurricanes Charley, Frances, and Jeanne during the same six weeks.
Historic lake level data from SWFWMD and USGS were sufficient to examine long term water levels trends in lakes Fannie, Hamilton, Howard, and Smart. Data were graphed and smoothed using appropriate statistical and graphing software. Differences between rainfall and lake levels varied among lakes and time lags between rainfall events and lake levels were also apparent (for example, in Lake Hamilton, Figure 2-8). The maximum lake level response to increased rainfall is limited by outflow from the lake.
The relationship between measured lake levels and antecedent rainfall was evaluated for lakes using analyses of correlation between lake levels and antecedent rainfall, regressions for quantifying a predictive relationship and testing whether the relationship was significant (p < 0.05). The analyses were performed using SAS statistical software (Cary, NC 2009).
Results of analyses are graphed for lakes Fannie, Hamilton, Howard, and Smart in Figure 2-9. The “fit” of the relationships is illustrated by the 95 percent prediction lines, which include nearly all the observations. The regression models use the generalized form presented below.

Factors Affecting Water Quality in the WHCL
2-19 WHCL Water Quality Management Plan Final December 2010
Lake level = βα + (β1 x rain1) + (β2 x rain2) + (β3 x rain3), where:
αβ = line intercept
1β = slope for “short-term (i.e. 3 months)” rainfall (linear and/or non-linear)
2β = slope “long-term (i.e. 12 months)” rainfall (linear and/or non-linear)
3β = slope “longer-term (i.e. 21 to 24 months)” rainfall (linear and/or non-linear)
Figure 2-8. Comparisons of lake levels and rainfall for Lake Hamilton.
Approximately 60 percent (r2 = 0.60) of the observed variation in monthly lake levels in Lake Fannie and Lake Hamilton can be explained by rainfall during previous three and 12 months (Table 2-7). Similar r2 values resulted from regression models for Lakes Howard and Smart by also accounting for rainfall during the previous 12 months. The positive relationship between antecedent rainfall conditions and water levels is illustrated for the four lakes (Figure 2-9).
These results indicate that lake levels reflect longer term rainfall conditions rather than only recent rain events. Therefore, ground water from the surficial aquifer may influence lake water levels more than recent rainfall, particularly during the dry season. Restoration activities that increase recharge to the surficial aquifer would, then, also improve water quality.
Table 2-7. Summary of model results for lake levels and antecedent rainfall.
Lake Level Intervals for Rainfall r2 Value
Lake Fannie 3 month 21 month Not significant 0.60
Lake Hamilton 3 month 24 month Not significant 0.57
Lake Howard 3 month 12 month 24 month 0.58
Lake Smart 3 month 12 month 24 month 0.61

Factors Affecting Water Quality in the WHCL
2-20 WHCL Water Quality Management Plan Final December 2010
Figure 2-9. Comparisons of lake levels and rainfall patterns in lakes Fannie, Hamilton, Howard, and Smart, for selected model terms.

Factors Affecting Water Quality in the WHCL
2-21 WHCL Water Quality Management Plan Final December 2010
Figure 2-9 (continued) Comparisons of lake levels and rainfall patterns for selected model terms.

Factors Affecting Water Quality in the WHCL
2-22 WHCL Water Quality Management Plan Final December 2010
2.7. Lake Color: Valley Lakes and Forested Wetlands
Lake color, nutrients and chlorophyll a (as a measure of algae abundance) data for the WHCL were examined to evaluate the effect of lake color on the relationship between increased nutrients on algae abundance in a lake (Table 2-8). As an example, lakes with median color levels less than or equal to 50 PCU (ridge lakes) and greater than 50 PCU (valley lakes) were compared. The 50 PCU threshold was based on the relationship between color and nutrients for the WHCL (PBSJ 2010). That is, lakes in the WHCL with color less than or equal to 50 PCU had elevated phytoplankton biomass, but lower TP levels (p = 0.05), although TN levels were no different between low and high color lakes. These results are evidence that in the higher color valley lakes, phytoplankton biomass is more strongly influenced by color than phosphorus.
A graph of phosphorus and chlorophyll a for colored lakes Henry and Lulu (Figure 2-10) further illustrates the effect of color on nutrients: higher TP in Lake Henry does not correspond to higher levels of chlorophyll a. Similarly, low color in Lake Lulu corresponds to high chlorophyll a, while high color in Lake Henry corresponds to low chlorophyll a, (Figure 2-11) indicating that the most likely factor moderating chlorophyll a concentrations in Lake Henry is the elevated color.
Table 2-8. Mean and median values of water quality parameters for lakes with color < 50 PCU and color > 50 PCU (1997 to 2007).
Statistic Chlorophyll a (µg/L) TP (mg/L) TN (mg/L)
PCU < 50 PCU > 50 PCU < 50 PCU > 50 PCU < 50 PCU > 50
Mean 31.0 20.2 0.046 0.076 1.201 1.161
Median 28.0 13.6 0.041 0.070 1.103 1.089

Factors Affecting Water Quality in the WHCL
2-23 WHCL Water Quality Management Plan Final December 2010
Figure 2-10. Relationship between in lakes Henry and Lulu.
Figure 2-11. Median concentrations of chlorophyll a, TN, TP and color in Lakes Henry and Lulu (1997 to 2007).

Factors Affecting Water Quality in the WHCL
2-24 WHCL Water Quality Management Plan Final December 2010
Sources of color for lakes in the WHCL system (PBS&J 2008) were examined by evaluating relationships between lake chemistry and landscape features. Results indicated that the presence of forested wetlands on the immediate shoreline (within 500 feet of the lake edge) explained the greatest amount of variability in levels of color: the greater the extent of forested wetlands, the greater the color (i.e. tannins) in the lake. In addition, a shoreline of about 10 to 20 percent forested wetlands appears necessary to meet or exceed 50 PCU color. Using this information, the following targets are proposed for color and forested wetlands:
• A preliminary and minimum target of 50 PCU or higher for high color valley lakes in the WHCL to maintain water color at a level that moderates the effect of increased nutrients on phytoplankton.
• Restore or maintain a minimum 10 to 20 percent of nearshore habitat as forested wetland. This management goal may be important in controlling phytoplankton levels.
2.8. Submerged Aquatic Vegetation (SAV)
Removal of nutrients from the water column by SAV communities is well documented (Kadlec and Wallace 2009, Knight et al. 2003, Blindow et al. 2002, Canfield et al. 1984, Havens 2003, Shireman et al. 1985) and, as such, SAV is an important consideration for improving water quality in the WHCL. Unfortunately, the results of water quality improvements and non-native invasive species control sometimes conflict.
Quantifying the relationship between SAV and nutrients in the WHCL is impossible in the absence of SAV abundance data. However, there is information regarding the impact of SAV eradication on water quality in other lakes in central Florida, as well as anecdotal information from various lakes in the WHCL. In the WHCL, for example, herbicide treatments to eradicate non-native invasive SAV are an important component of lake management because of the negative impacts of these species in the lakes, including replacement of native plant species and habitat and adverse impacts to recreation and fishing. Hydrilla (H. verticillata) is the primary target of herbicide treatments in the WHCL. However, eradication of SAV also removes a nutrient reduction mechanism and can result in a decline in water quality. For example, TP levels in Lake Howard increased in the months after the completion of an extensive Hydrilla eradication implemented over approximately half of Lake Howard. The eradication efforts in Lake Howard may have compromised some of the benefits of the prior regional stormwater treatment projects.
Similarly, Lake Hartridge chlorophyll a values from 1997 to 2007 were highest in 1998, following Hydrilla treatment over at least 30 percent of the lake each year from 1994 to 1998 and may be due to Hydrilla eradications in prior years. In contrast, chlorophyll a values during the period 1997 to 2007 were lowest in 2002 to 2004, following two previous years of Hydrilla treatments limited to 10 percent of the lake. Fourteen of the lakes in the WHCL with treatment data (70 percent of the lakes) had more than 50 percent of their surface areas treated on at least one occasion. Replacing Hydrilla with native SAV would restore the water quality benefits provided by SAV and restore native habitat for fish and wildlife as well.