20. credit and insurance - gpo€¦ · 20. credit and insurance ... some natural and man-made...
TRANSCRIPT
307
20. CREDIT AND INSURANCE
The Federal Government offers direct loans and loan guarantees to support a wide range of activities includ-ing home ownership, education, small business, farming, energy efficiency, infrastructure investment, and exports. Also, Government-sponsored enterprises (GSEs) operate under Federal charters for the purpose of enhancing cred-it availability for targeted sectors. Through its insurance programs, the Federal Government insures deposits at depository institutions, guarantees private defined-bene-fit pensions, and insures against some other risks such as flood and terrorism.
This chapter discusses the roles of these diverse programs:
• The first section emphasizes the roles of Federal credit and insurance programs in addressing mar-
ket imperfections that may prevent the private mar-ket from efficiently providing credit and insurance.
• The second section discusses individual credit pro-grams and the GSEs. Credit programs are broadly classified into five categories: housing, education, small business and farming, energy and infrastruc-ture, and international lending.
• The third section reviews Federal deposit insurance, pension guarantees, disaster insurance, and insur-ance against terrorism and other security-related risks.
I. THE FEDERAL ROLE
Credit and insurance markets sometimes fail to func-tion smoothly due to market imperfections. Relevant market imperfections include information failures, monitoring problems, limited ability to secure resources, insufficient competition, externalities, and financial mar-ket instability. Federal credit and insurance programs may improve economic efficiency if they effectively fill the gaps created by market imperfections. Addressing market imperfections, however, is a subtle task. To be effective, a credit or insurance program should be care-fully designed to reduce inefficiencies in the targeted area without disturbing efficiently functioning areas. In ad-dition to correcting market failures, Federal credit and insurance programs may provide subsidies to serve other policy purposes, such as reducing inequalities and extend-ing opportunities to disadvantaged regions or segments of the population. The effectiveness of credit assistance in serving these purposes should be carefully compared with that of more direct policy tools, such as grants and tax credits.
Information Failures. When lenders have insuf-ficient information about borrowers, they may fail to evaluate the creditworthiness of borrowers accurately. As a result, some creditworthy borrowers may fail to obtain credit at a reasonable interest rate, while some high-risk borrowers obtain credit at an attractive interest rate. The problem becomes more serious when borrowers are much better informed about their own creditworthiness than lenders (asymmetric information). With asymmetric information, raising the interest rate can disproportion-ately draw high-risk borrowers who care less about the interest rate (adverse selection). Thus, lenders may limit the amount of credit to a group of borrowers with highly uncertain creditworthiness, or even exclude the group all
together, instead of charging a high interest rate. In this situation, many creditworthy borrowers may fail to ob-tain credit even at a high interest rate. Ways to deal with this problem in the private sector include equity financing and pledging collateral. Federal credit programs play a crucial role for those populations that are vulnerable to this information failure and do not have effective means to deal with it. Start-up businesses lacking a credit histo-ry, for example, are vulnerable to the information failure, but most of them are unable to raise equity publicly and do not have sufficient collateral. Another example is stu-dents who have little income, little credit experience, and no collateral to pledge. Without Federal credit assistance, many in these groups may be unable to pursue their en-trepreneurial or academic goals. In addition, a moderate subsidy provided by the Government can alleviate ad-verse selection by attracting more low-risk borrowers, although an excessive subsidy can cause economic inef-ficiency by attracting many borrowers with unworthy or highly risky projects.
Monitoring Needs. Monitoring is a critical part of credit and insurance businesses. Once the price (the in-terest rate or the insurance premium) is set, borrowers and policyholders may have incentives to engage in risky activities. Insured banks, for example, might take more risk to earn a higher return. Although private lenders and insurers can deter risk-taking through covenants, re-pricing, and cancellation, Government regulation and supervision can be more effective in some cases, especially where covering a large portion of the target population is important. For a complex business like banking, close ex-amination may be necessary to deter risk-taking. Without legal authority, close examination may be impractical. When it is difficult to prevent risk-taking, private insur-
308 ANALYTICAL PERSPECTIVES
ers may turn down many applicants and often cancel policies, which is socially undesirable in some cases, such as deposit insurance and pension guarantees. It is im-portant to protect bank deposits to prevent disruption to the financial market. Without pension guarantees, many retirees could experience financial hardships and strain other social safety nets.
Limited Ability to Secure Resources. The ability of private entities to absorb losses is often more limited than that of the Federal Government. For some events poten-tially involving a very large loss concentrated in a short time period, therefore, Government insurance can be more reliable. Such events include massive bank failures and some natural and man-made disasters that can threaten the solvency of private insurers. In addition, some lenders may have limited funding sources. Small local banks, for example, may have to rely largely on local deposits.
Insufficient Competition. Competition can be insuf-ficient in some markets because of barriers to entry or economies of scale. Insufficient competition may result in unduly high prices of credit and insurance in those markets.
Externalities. Decisions at the individual level are not socially optimal when individuals do not capture the full benefit (positive externalities) or bear the full cost (negative externalities) of their activities. Education, for example, generates positive externalities because the general public benefits from the high productivity and good citizenship of a well-educated person. Pollution, in contrast, is a negative externality, from which other peo-ple suffer. Without Government intervention, people may engage less than the socially optimal level in activities that generate positive externalities and more in activities that generate negative externalities.
Financial Market Instability. Another rationale for Federal intervention is to prevent instability in the financial market. Without deposit insurance, for example, the financial market would be much less stable. When an economic shock impairs the financial structure of many banks, depositors may find it difficult to distinguish be-tween solvent banks and insolvent ones. In this situation, failures of some banks might prompt depositors to with-draw deposits from all banks (bank runs), making bank failures contagious. Deposit insurance is critical in pre-venting bank runs, which harm the entire economy.
II. CREDIT IN VARIOUS SECTORS
Housing Credit Programs and GSEs
Through housing credit programs, the Federal Government promotes homeownership among various target groups, including low- and moderate-income peo-ple, veterans, and rural residents. Recently, the target market expanded dramatically due to the financial crisis.
The consequences of inflated house prices and loose mortgage underwriting during the housing bubble that peaked in 2007 created perilous conditions for many American homeowners. Millions of families were fore-closed upon and millions more found themselves owing more on their homes than their homes were worth. Private capital all but disappeared from the market. Without the Federal support provided to the housing market since 2008, the situation would have been more problematic.
Federal Housing Administration
The Federal Housing Administration (FHA) guaran-tees mortgage loans to provide access to homeownership for people who may have difficulty obtaining a conven-tional mortgage. FHA has been a primary facilitator of mortgage credit for first-time and minority buyers, a pioneer of products such as the 30-year self-amortizing mortgage, and a vehicle to enhance credit for many mod-erate and low-income households.
FHA and the Mortgage Market
In the early 2000s, FHA’s market presence diminished greatly as low interest rates increased the affordability of mortgage financing and more borrowers used emerging non-prime mortgage products, including subprime and Alt-A mortgages. Many of these products had risky and
hard-to-understand features such as low “teaser rates” offered for periods as short as the first two years of the mortgage, high loan-to-value ratios (with some mortgages exceeding the value of the house), and interest-only loans with balloon payments that require full payoff at a set future date. The Alt-A mortgage made credit easily avail-able by waiving documentation of income or assets. This competition eroded the market share of FHA’s single-fam-ily loans, reducing it from 9 percent in 2000 to less than 2 percent in 2005.
Starting at the end of 2007, the availability of FHA and Government National Mortgage Association (which sup-ports the secondary market for federally-insured housing loans by guaranteeing securities backed by mortgages guaranteed by FHA, VA, and USDA) credit guarantees has been an important factor countering the tightening of private-sector credit. The annual volume of FHA’s single-family mortgages soared from $52 billion in 2006 to $330 billion in 2009.
FHA’s presence has supported the home purchase mar-ket and enabled many existing homeowners to re-finance at today’s lower rates. If not for such re-financing options, many homeowners would remain stuck in high-interest mortgages and face higher risk of foreclosure given the economic challenges resulting from the Great Recession and decreased house prices.
The return of conventional financing to the mortgage market—with appropriate safeguards for consumers and investors including prudent underwriting and disclosure of risk—will broaden both the options available to bor-rowers and the sources of capital to fund those options. The Administration supports a greater role for non-feder-ally assisted mortgage credit, while recognizing that FHA
20. CREDIT AND INSURANCE 309
will continue to play an important role in the mortgage market going forward.
Although loan volume declined since its 2009 peak, FHA enjoyed strong demand in 2015 as mortgage rates remained low and the improving economy brought new home buyers into the market. Also contributing was a re-duction in FHA premiums, as discussed in detail below. FHA’s new origination loan volume in 2015 was $213 bil-lion and FHA’s market share of home purchase financing was 21 percent. For 2017, the Budget projects FHA vol-ume will be $204 billion.
FHA’s Budget Costs
FHA’s budget estimates can be volatile and prone to forecast error because default claim rates are sensitive to a variety of dynamics. FHA insurance premium revenues are spread thinly but universally over pools of policy-holders. Mortgage insurance costs for FHA, however, are concentrated in only those borrowers who default and whose lender files a claim, with the average per claim cost being much larger than the average premium income. Therefore, if claims change by even a small fraction of borrowers (e.g., one percentage point), net FHA insurance costs will move by a multiple of that change. For other forms of insurance, such as life and health, these changes tend to gradually occur over time, allowing actuaries to anticipate the effects and modify risk and pricing models accordingly. The history of FHA, however, has been spot-ted with rapid, unanticipated changes in claim costs and recoveries. FHA is vulnerable to “Black Swans,” outlier events that are difficult to predict and have deep effect. For FHA, these include the collapse of house prices after market bubbles burst and the effects of lending practices with very high claim rates, such as the now illegal seller-financed down-payment mortgage.
One of the major benefits of an FHA-insured mortgage is that it provides a homeownership option for borrowers who can make only a modest down-payment, but show that they are creditworthy and have sufficient income to afford the house they want to buy. In 2015, over 72 per-cent of new FHA loans were financed with less than five percent down. The disadvantage to low down-payment mortgages is that they have little in the way of an eq-uity cushion should house prices decline or events such as income loss or unexpected medical expenses make it dif-ficult for households to remain current on their mortgage payment. When these occur, the net sales proceeds from home sales may not be sufficient to support exit strategies that allow borrowers to completely pay off the debt and relocate to more affordable housing.
According to its annual actuarial analysis, in 2015 FHA achieved its statutory minimum capital reserve ratio of 2 percent for the first time since 2008. As the housing market has recovered and FHA has improved its risk management, the actuarial review found that FHA’s capital reserve increased by $41 billion over the last three years. Even a low capital ratio as existed from 2009 to 2014 does not threaten FHA’s operations, however, ei-ther for its existing portfolio or for new books of business.
FHA accounts contain sufficient funds to pay anticipated claims and unlike private lenders, the guarantee on FHA and other Federal loans is backed by the full faith and credit of the Federal Government and is not dependent on capital reserves to honor its commitments.
In 2009, the FHA capital reserve was broadened to include Home Equity Conversion Mortgages (HECMs) in addition to single-family purchase and re-finance (for-ward) mortgages. This change has increased the volatility of FHA’s capital reserves. The financial performance of HECMs is highly sensitive to changes in house prices and interest rates. While the trend in capital reserves of for-ward mortgages has been consistently upward over the last three years, HECM capital reserves experienced a downward spike in 2014 followed by a large upward swing in 2015. For 2015, the capital reserve ratio was 6.4 per-cent for HECMs and 1.6 percent for forward mortgages.
FHA increased insurance premiums to bolster its cap-ital resources five times starting in 2008. For a typical borrower, the cumulative increases were 0.25 percentage points in the upfront premium and 0.85 percentage points in annual premiums. Given the improvement in FHA’s fi-nancial position, it makes sense to partially reverse these premium increases to promote access to housing credit. A 0.50 percentage point reduction of annual premiums, from 1.35 percent to .85 percent, was rolled out in January 2015. Even with this reduction, FHA will collect premiums on new mortgages that are well above the estimated costs of guaranteeing those mortgages against default. As a re-sult, FHA will stay on a strong trajectory with its capital reserve ratio. This reduction also provides pricing to new FHA borrowers more in line with the stronger underwrit-ing requirements they have to meet in order to qualify and will make homeownership more likely for many bor-rowers, including those who have sufficient credit quality but would lack the income to support mortgage payments at the higher premium levels.
In addition to the single-family mortgage insurance provided through the MMI program, FHA’s General Insurance and Special Risk Insurance (GISRI) loan programs continue to facilitate the construction, rehabili-tation, and refinancing of multifamily housing, hospitals and other health care facilities. GISRI’s new origination loan volume in 2015 was $13.4 billion and the Budget projects $13.8 billion for 2017, including $10.6 billion in multifamily loans and $3.1 billion in healthcare loans.
In 2016, FHA will reduce upfront and annual premiums for affordable and energy efficient rental housing. For loans insured under FHA’s three signature new construc-tion/substantial rehabilitation and refinance programs, the annual premium will be reduced by a range of 10 to 40 basis points. These targeted reductions will: (1) sup-port the production and preservation of affordable rental housing; (2) incent energy efficiency improvements in both affordable and market rate housing; and (3) improve housing choice for low-income families by tying certain premium reductions to landlord acceptance of Federal rental vouchers.
310 ANALYTICAL PERSPECTIVES
VA Housing Program
The Department of Veterans Affairs (VA) assists vet-erans, members of the Selected Reserve, and active duty personnel in purchasing homes in recognition of their service to the Nation. The housing program effectively substitutes the Federal guarantee for the borrower’s down payment, making the lending terms more favorable than loans without a VA guarantee. VA does not guaran-tee the entire mortgage loan to veterans, but provides a 100 percent guarantee on the first 25 percent of losses upon default. The number of loans that VA guaranteed reached a new record level in 2015, as the tightened credit markets continued to make the VA housing program more attractive to eligible homebuyers. VA provided 264,057 zero down payment loans. The continued historically low interest rate environment of 2015 allowed 309,027 Veteran borrowers to lower interest rates on their home mortgages through refinancing. VA provided over $38 bil-lion in guarantees to assist 631,142 borrowers in 2015, of which 238,013 were fee-exempt loans to Veterans with service-connected disabilities. This followed $25 billion and 438,398 borrowers in 2014.
VA, in cooperation with VA-guaranteed loan servicers, also assists borrowers through home retention options and alternatives to foreclosure. VA intervenes when need-ed to help veterans and service members avoid foreclosure through loan modifications, special forbearances, repay-ment plans, and acquired loans; as well as assistance to complete compromise sales or deeds-in-lieu of foreclosure. These joint efforts helped resolve over 83 percent of de-faulted VA-guaranteed loans in 2015.
Rural Housing Service
The Rural Housing Service (RHS) at the U.S. Department of Agriculture (USDA) offers direct and guar-anteed loans to help very-low- to moderate-income rural residents buy and maintain adequate, affordable housing. RHS housing loans and loan guarantees differ from other Federal housing loan programs in that they are means-tested, making them more accessible to low-income, rural residents. For the direct loan program, approximately 40 percent of borrowers earn less than 50 percent of their area’s median income; the remainder earn between 50 percent and 80 percent (maximum for the program) of area median income. The single family housing guar-anteed loan program is designed to provide home loan guarantees for moderate-income rural residents whose incomes are between 80 percent and 115 percent (maxi-mum for the program) of area median income.
The 2017 Budget continues USDA single family hous-ing assistance programs. Within its $24 billion guarantee loan level, the Budget expects RHS to potentially provide over $3.0 billion in loan guarantees for low-income rural borrowers, which could provide 20,800 new homeown-ership opportunities to that income group. Overall, the program could potentially provide approximately 160,000 new homeownership or refinancing opportunities to low- to moderate-income rural residents in 2017. The Budget assumes this level will only be reached in the event of
increased market demand for mortgage credit in rural areas, a possibility for which this funding level is accom-modative. Typical program funding utilization will be within 80 percent of the funding level.
This funding level includes the continuation of an an-nual and up-front fee structure. These fees reduce the overall subsidy cost of the loans without adding signifi-cant burden to the borrowers. The Budget also proposes to make USDA’s guaranteed home loan program a del-egated underwriting program, allowing approved lenders with a strong track record with the program to make the loans on behalf of the government and no longer requir-ing USDA to sign-off in conjunction with each loan. This change will make RHS more efficient and allow the single family housing staff to refocus on other important needs.
For USDA’s single family housing direct loan program, the 2017 Budget provides a loan level of $900 million, which is expected to allow approximately 6,500 low to very-low income rural residents an opportunity to realize the dream of home-ownership.
For USDA’s multifamily housing portfolio, the Budget focuses primarily on portfolio management. Management includes the retention of its existing portfolio of afford-able rental housing as well as the rehabilitation of that housing to continue to provide safe and decent housing for residents. USDA is working with OMB and other Federal housing partners, as well as program participants, to develop solutions that will continue to provide rental sub-sidies for the low and very-low income residents in those properties with maturing mortgages at the lowest cost to the government. The Budget fully funds this rehabilita-tion effort by providing $66.5 million for the multifamily housing revitalization activities, which include loan mod-ifications, grants, zero percent loans, and soft second loans as well as some funding for traditional multifam-ily housing direct loans to allow USDA to better address its inventory property. These activities allow borrowers to restructure their debt so that they can effectively reha-bilitate properties within the portfolio in order for them to continue to supply decent, safe, affordable rental hous-ing to the low- and very-low-income population in rural America. The Budget also proposes to codify these activi-ties into permanent law.
In addition, rental assistance grants, which supplement tenant rental payments to the property owners and are vi-tal to the proper underwriting of the multifamily housing direct loan portfolio, are funded at $1.405 billion, which is sufficient to renew outstanding agreements. The Budget also provides $230 million in guaranteed multifamily housing loans and $15.4 million in budget authority for the Farm Labor Housing grants and loans. Collectively, the 2017 Budget request in the rural development mul-tifamily housing portfolio reflects the Administration’s support for the poorest rural tenant population base.
Government-Sponsored Enterprises in the Housing Market
The Federal National Mortgage Association, or Fannie Mae, created in 1938, and the Federal Home Loan Mortgage Corporation, or Freddie Mac, created in 1970,
20. CREDIT AND INSURANCE 311
were established to support the stability and liquidity of a secondary market for residential mortgage loans. Fannie Mae’s and Freddie Mac’s public missions were later broad-ened to promote affordable housing.
Growing stress and losses in the mortgage markets in 2007 and 2008 seriously eroded the capital of Fannie Mae and Freddie Mac, and responsive legislation enacted in July 2008 strengthened regulation of the housing GSEs and provided the Treasury Department with authorities to purchase GSE securities. In September 2008, reacting to growing GSE losses and uncertainty that threatened to paralyze the mortgage markets, the GSEs’ independent regulator, the Federal Housing Finance Agency (FHFA), placed Fannie Mae and Freddie Mac under Federal con-servatorship, and Treasury began to exercise its purchase authorities to provide support to the GSEs. The Budget continues to reflect the GSEs as non-budgetary entities in keeping with their temporary status in conservatorship. However, all of the current Federal assistance being pro-vided to Fannie Mae and Freddie Mac, including capital provided by Treasury through the Senior Preferred Stock Purchase Agreements (PSPA), is shown on-budget, and discussed below.
The Federal Home Loan Bank (FHLB) System, creat-ed in 1932, is comprised of eleven individual banks with shared liabilities. Together they lend money to financial institutions—mainly banks and thrifts—that are in-volved in mortgage financing to varying degrees, and they also finance some mortgages using their own funds.
Mission
The mission of the housing GSEs is to support certain aspects of the U.S. mortgage market. Fannie Mae and Freddie Mac’s mission is to provide liquidity and stability to the secondary mortgage market and to promote afford-able housing. Currently, they engage in two major lines of business.
1. Credit Guarantee Business—Fannie Mae and Freddie Mac guarantee the timely payment of principal and interest on mortgage-backed securi-ties (MBS). They create MBS by pooling mortgages acquired through either purchase from or swap ar-rangements with mortgage originators. Over time these MBS held by the public have averaged nearly 40 percent of the U.S. mortgage market, and as of November 30, 2015, they totaled $4.3 trillion.
2. Mortgage Investment Business—Fannie Mae and Freddie Mac manage retained mortgage portfolios composed of their own MBS, MBS issued by others, and individual mortgages. The GSEs finance the purchase of these portfolio assets through debt is-sued in the credit markets. As of November 30, 2015, these retained mortgages, financed largely by GSE debt, totaled $698 billion. As a term of their PSPA contracts with Treasury, the combined investment portfolios of Fannie Mae and Freddie Mac were lim-ited to no more than $1.8 trillion as of December 31, 2009, and this limitation was directed to decline by
10 percent each year. To accelerate the wind-down of the GSEs’ retained mortgage portfolios, Treasury revised the PSPA terms in August 2012, setting the effective portfolio limitation at $1.1 trillion as of December 31, 2013, and accelerating the reduc-tion in this limitation to 15 percent each year until December 31, 2018, when the combined limitation will be fixed at $500 billion ($250 billion for each company).
As of November 30, 2015, the combined debt and guar-anteed MBS of Fannie Mae and Freddie Mac totaled $5.1 trillion.
The mission of the FHLB System is broadly defined as promoting housing finance, and the System also has specific requirements to support affordable housing. Its principal business remains lending (secured by mortgag-es and financed by System debt issuances) to regulated depository institutions and insurance companies engaged in residential mortgage finance. Historically, investors in GSE debt have included thousands of banks, institutional investors such as insurance companies, pension funds, foreign governments and millions of individuals through mutual funds and 401k investments.
Together these three GSEs currently are involved, in one form or another, with approximately half of the $11 trillion residential mortgages outstanding in the U.S. today.
Regulatory Reform
The 2008 Housing and Economic Recovery Act (HERA) reformed and strengthened the GSEs’ safety and sound-ness regulator by creating the Federal Housing Finance Agency (FHFA), a new independent regulator for Fannie Mae, Freddie Mac, and the Federal Home Loan Banks. The FHFA authorities consolidate and expand upon the regulatory and supervisory roles of what were previous-ly three distinct regulatory bodies: the Federal Housing Finance Board as the FHLB’s overseer; the Office of Federal Housing Enterprise Oversight as the safety and soundness regulator of the other GSEs; and HUD as their public mission overseer. FHFA was given substan-tial authority and discretion to influence the size and composition of Fannie Mae and Freddie Mac investment portfolios through the establishment of housing goals, monitoring GSE compliance with those goals, and capital requirements.
FHFA is required to issue housing goals, such as for purchases of single-family mortgages provided to low-income families, for each of the regulated enterprises, including the FHLBs, with respect to single family and multi-family mortgages and has the authority to require a corrective “housing plan” if an enterprise does not meet its goals and statutory reporting requirements, and in some instances impose civil money penalties. The housing goals for 2012 through 2014, promulgated on November 13, 2012, established revised benchmarks for Fannie Mae and Freddie Mac, comprising four goals and one subgoal for single-family, and one goal and one subgoal for multi-family housing. FHFA determined that both Fannie Mae
312 ANALYTICAL PERSPECTIVES
and Freddie Mac exceeded the 2012 benchmark levels on all of the single-family and multifamily goals, while in 2013 Fannie Mae fell short on one goal and Freddie Mac fell short on three goals. FHFA’s evaluation of the GSEs’ performance in reaching the 2014 goals indicates that Fannie Mae achieved all its goals and that Freddie Mac fell short on two goals. Freddie Mac will be required to submit a housing plan to address their plans to achieve those goals. On August 19, 2015, FHFA published a final rule that establishes new affordable housing goals for years 2015-2017, including for the first time a goal for low-income rental units in small multifamily properties.
The expanded authorities of FHFA also include the ability to place any of the regulated enterprises into conservatorship or receivership based on a finding of un-der-capitalization or a number of other factors.
Conservatorship
On September 6, 2008, FHFA placed Fannie Mae and Freddie Mac under Federal conservatorship. This action was taken in response to the GSEs’ declining capital ad-equacy and to support the safety and soundness of the GSEs, given the role they played in the secondary mort-gage market and the potential impact of their failure on broader financial markets. HERA provides that as con-servator FHFA may take any action that is necessary to put Fannie Mae and Freddie Mac in a sound and solvent condition and to preserve and conserve the assets of each firm. As conservator, FHFA has assumed by operation of law the powers of the Board and shareholders at Fannie Mae and Freddie Mac. FHFA has appointed Directors and CEOs who are responsible for the day-to-day operations of the two firms. While in conservatorship, FHFA expects Fannie Mae and Freddie Mac to continue to fulfill their core statutory purposes, including their support for af-fordable housing discussed above. In its Strategic Plan for the Conservatorships of Fannie Mae and Freddie Mac, released in 2014, FHFA outlined three key goals for con-servatorship: 1) maintain, in a safe and sound manner, foreclosure prevention activities and credit availability for new and refinanced mortgages to foster liquid, efficient, competitive and resilient national housing finance mar-kets; 2) reduce taxpayer risk through increasing the role of private capital in the mortgage market; and 3) build a new single-family securitization infrastructure for use by the GSEs and adaptable for use by other participants in the secondary market in the future.
Department of Treasury GSE Support Programs under HERA
On September 7, 2008, the U.S. Treasury launched three programs to provide temporary financial support to the GSEs under the temporary authority provided in HERA to purchase GSE securities. These purchase au-thorities expired on December 31, 2009.
1. PSPAs with Fannie Mae and Freddie Mac
Treasury entered into agreements with Fannie Mae and Freddie Mac to make investments in senior preferred
stock in each GSE in order to ensure that each company maintains a positive net worth. In exchange for the sub-stantial funding commitment, the Treasury received $1 billion in senior preferred stock for each GSE and warrants to purchase up to a 79.9 percent share of common stock at a nominal price. The initial agreements established fund-ing commitments for up to $100 billion in each of these GSEs. On February 18, 2009, Treasury announced that the funding commitments for these agreements would be increased to $200 billion for each GSE. On December 24, 2009, Treasury announced that the funding commit-ments in the purchase agreements would be modified to the greater of $200 billion or $200 billion plus cumulative net worth deficits experienced during 2010-2012, less any positive net worth remaining as of December 31, 2012. Based on the financial results reported by each company as of December 31, 2012, the cumulative funding commit-ment for Fannie Mae and Freddie Mac was set at $445.5 billion. In total, as of December 31, 2015, $187.5 billion has been invested in the GSEs, and the initial liquidation preference of the senior preferred stock held by Treasury has increased accordingly. The PSPAs also require that Fannie Mae and Freddie Mac pay quarterly dividends to Treasury. Prior to calendar year 2013, the quarterly divi-dend amount was based on an annual rate of 10 percent of the liquidation preference of Treasury’s senior preferred stock. Amendments to the PSPAs effected on August 17th, 2012, replaced the 10 percent dividend with an amount equivalent to the GSE’s positive net worth above a capital reserve amount. The capital reserve amount for each com-pany was set at $3.0 billion for calendar year 2013, and declines by $600 million at the beginning of each calendar year thereafter until it reaches zero. Through December 31, 2015, the GSEs have paid a total of $241.2 billion in dividends payments to Treasury on the senior preferred stock. The Budget estimates additional dividend receipts of $151.5 billion from January 1, 2016, through FY 2026. The cumulative budgetary impact of the PSPAs from the establishment of the PSPAs through FY 2026 is es-timated to be a net return to taxpayers of $205.2 billion. The Temporary Payroll Tax Cut Continuation Act of 2011 signed into law on December 23, 2011, required that the GSEs increase their fees on security guarantees issued through FY 2021 by an average of at least 0.10 percent-age points above the average guarantee fee imposed in 2011. Revenues generated by this fee increase are remit-ted directly to the Treasury for deficit reduction and are not included in the PSPA amounts. The Budget estimates resulting deficit reductions from this fee of $40.5 billion from FY 2012 through FY 2026.
2. GSE MBS Purchase Programs
Treasury initiated a temporary program during the financial crisis to purchase MBS issued by Fannie Mae and Freddie Mac, which carry the GSEs’ standard guar-antee against default. The purpose of the program was to promote liquidity in the mortgage market and, thereby, affordable homeownership by stabilizing the interest rate spreads between mortgage rates and corresponding rates
20. CREDIT AND INSURANCE 313
on Treasury securities. Treasury purchased $226 bil-lion in MBS from September 2008 to December 31, 2009, when the statutory purchase authority that Treasury used for this program expired, and sold the last of its MBS holdings in March 2012. The MBS purchase program gen-erated $11.9 billion in net budgetary savings, calculated on a net present value basis as required by the Federal Credit Reform Act.
3. GSE Credit Facility
Treasury promulgated the terms of a temporary se-cured credit facility available to Fannie Mae, Freddie Mac, and the Federal Home Loan Banks. The facility was intended to serve as an ultimate liquidity backstop to the GSEs if necessary. No loans were needed or issued through December 31, 2009, when Treasury’s HERA pur-chase authority expired.
4. State Housing Finance Agency Programs
In December 2009, Treasury used its purchase au-thorities under HERA to initiate two programs to support state and local Housing Financing Agencies (HFAs). Under the New Issue Bond Program (NIBP), Treasury purchased $15.3 billion in securities of Fannie Mae and Freddie Mac backed by new HFA housing bond issuances. As of December 31 2015, NIBP balances had decreased to approximately $7.5 billion. The Temporary Credit and Liquidity Program (TCLP) provided HFAs with credit and liquidity facilities supporting up to $8.2 billion in existing HFA bonds. The TCLP ended in July 2015 after the last participating HFAs received alternative liquidity facili-ties from private sector banks.
Recent GSE Role in Administration Initiatives to Relieve the Foreclosure Crisis and Support Access to Affordable Housing
While under Federal conservatorship, Fannie Mae and Freddie Mac have continued to play a leading role in Government and private market initiatives to pre-vent homeowners who are having difficulty making their mortgage payments from losing their homes. In March 2009, the Administration announced its Making Home Affordable (MHA) initiative, which includes the Home Affordable Modification Program (HAMP) and the Home Affordable Refinance Program (HARP).
Fannie Mae and Freddie Mac are participating in HAMP both for mortgages they own or guarantee and as the Treasury Department’s contractual financial agents. Under HAMP, investors, servicers, and borrowers re-ceive incentive payments to reduce eligible homeowners’ monthly payments to affordable levels. The incentive pay-ments for the modification of loans not held by the GSEs are paid by Treasury’s Troubled Asset Relief Program (TARP) fund, while the incentive payments for the modi-fication of loans held by the GSEs are generally paid by the GSEs, with a small portion paid through TARP. As of December 31, 2015, nearly 2.4 million trial modi-
fications have been initiated, resulting in more than 1.6 million homeowners entering permanent mortgage modifications. HAMP has also encouraged the mortgage industry to adopt similar programs that have helped mil-lions more at no cost to the taxpayer. In December 2015, the Consolidated Appropriations Act, 2016 set December 31, 2016 as the termination date for new applications under MHA. However, through HAMP and other TARP housing programs, the Administration continues to sup-port homeowners who are facing foreclosure, those who are struggling with increasing interest rates on their mortgages, and those whose homes are underwater. For more information on HAMP and other TARP housing pro-grams, see the Budgetary Effects of the Troubled Asset Relief Program chapter of this volume.
Fannie Mae and Freddie Mac also facilitate under-water refinancing through HARP. Under the program, borrowers with a mortgage that is owned by Fannie Mae or Freddie Mac and who are current on their loan pay-ments may be eligible to refinance their mortgage to take advantage of the current low interest rate environment regardless of their current loan-to-value (LTV) ratio. Prior to HARP, the LTV limit of 80 percent for conforming purchase mortgages without a credit enhancement such as private mortgage insurance applied to refinancing of mortgages owned by the GSEs. Thus, borrowers whose home values had dropped such that their LTVs had in-creased above 80 percent could not take advantage of the refinance opportunity. With the introduction of HARP in 2009, eligible borrowers with LTVs up to 105 percent (lat-er extended to 125 percent) could qualify. On October 24, 2011, FHFA announced that HARP would be enhanced by lowering the fees charged by Fannie Mae and Freddie Mac on these refinancings, streamlining the application process, and removing the previous LTV cap of 125 per-cent. In May of 2015, FHFA announced that it would extend HARP through December 31, 2016. From the in-ception of the program through October 2015, nearly 3.4 million refinancings have been completed through HARP.
As the housing market strengthens, the Administration has worked to expand responsible lending to creditwor-thy borrowers and to increase access to affordable rental housing for families not ready or wanting to buy a home. Under the direction of FHFA, the GSEs continue to play a role in these efforts. In 2014, Fannie Mae and Freddie Mac announced a revised framework that clarifies the circumstances under which lenders may be required to repurchase a loan when the GSEs determine that the pur-chased loan does not meet their underwriting guidelines. In 2015, they continued these efforts by publishing guid-ance that for the first time defines severity levels for loan origination defects and establishes a process for remedy-ing them, and by releasing updated guidance on servicing remedies. These steps are expected to help alleviate lend-er uncertainty that has contributed to increased credit overlays that drive up lending costs and reduce access to credit. In December 2015, FHFA issued a proposed rule that establishes a framework for evaluating the GSEs’ progress toward serving three underserved markets, as required by HERA: manufactured housing, affordable

314 ANALYTICAL PERSPECTIVES
housing preservation, and rural markets. Finally, FHFA has directed the GSEs to begin setting aside 4.2 basis points for each dollar of unpaid principal balance of new business purchases (such as mortgages purchased for securitization) in each year to fund several federal afford-able housing programs created by HERA: the Housing Trust Fund, the Capital Magnet Fund, and the HOPE Reserve Fund. These set-asides, initially authorized by HERA, were suspended by FHFA in November 2008 and were reinstated effective January 1, 2015. The first set-aside of approximately $373 million is projected to be transferred to the affordable housing funds in early 2016, subject to terms and conditions as prescribed by FHFA.
Future of the GSEs
To finish addressing the weaknesses exposed by the financial crisis, the housing finance system must be re-formed, and Fannie Mae and Freddie Mac should be wound down. The bipartisan progress in the Senate in the previous session was a meaningful step towards securing a system that aligns with many of the Administration’s principles for reform, including ensuring that private cap-ital is at the center of the housing finance system so that taxpayer assistance is never again required, and that the new system supports broad access to credit and affordable rental housing through programs like the Housing Trust and Capital Magnet Funds. Further, the Consolidated Appropriations Act, 2016, included a provision that pro-hibits Treasury from selling or otherwise disposing of the preferred stock it holds in Fannie Mae or Freddie Mac until January 1, 2018, unless legislation instruct-ing Treasury on how to do so is enacted into law. Further, this provision recommends that legislation regarding the future of Fannie Mae and Freddie Mac be enacted and, notwithstanding the previous limitation, suggests that Treasury should not sell or dispose of its stock until such legislation is enacted. The Administration will continue to work with Congress to pass comprehensive reform, centered on several core principles: require more private capital in the system; end the Fannie Mae/Freddie Mac duopoly business model in order to improve system sta-bility and better protect taxpayers; ensure broad access for all creditworthy families to sustainable products like the 30-year fixed rate mortgage in good times and bad; and help ensure sustainable rental options are widely available.
In the absence of comprehensive housing finance re-form legislation, the Administration continues to take actions that balance the desire to reduce taxpayer risk with the need to support the continued flow of mortgage credit in a recovering housing market. Starting in 2013, Fannie Mae and Freddie Mac began to initiate a series of credit risk-sharing transactions with private market participants that add an additional layer of private loss coverage, further limiting taxpayer exposure to credit losses from the GSEs and potentially providing a model for future reforms. As of October 2015, the GSEs have transferred a significant portion of credit risk on single-family mortgages with a total unpaid principal balance over $700 billion. The GSEs and FHFA also plan to con-
tinue building a new single-family securitization platform for the GSEs that can be adapted for use by non-GSE users in order to increase liquidity in the secondary mort-gage market.
Education Credit Programs
Historically, the Department of Education financed student loans through two programs: the Federal Family Education Loan (FFEL) program and the William D. Ford Federal Direct Student Loan (Direct Loan) program. In March 2010, President Obama signed the Student Aid and Fiscal Responsibility Act (SAFRA) which ended the FFEL program. On July 1, 2010, ED became the sole orig-inator of Federal student loans through the Direct Loan program, and despite significant technical challenges, ED made all loans on time and without disruption.
The Direct Loan program was authorized by the Student Loan Reform Act of 1993. Under the program, the Federal Government provides loan capital directly to over 6,000 domestic and foreign schools, which then disburse loan funds to students. Loans are available to students and parents of students regardless of income, but the terms of the loans differ. There are three types of Direct Loans: Federal Direct Subsidized Stafford Loans, Federal Direct Unsubsidized Stafford Loans, and Federal Direct PLUS Loans. For Direct Subsidized Stafford loans, which are available to undergraduate borrowers from low and moderate income families, the Federal Government pro-vides more benefits, including not charging interest while the borrowers are in school and during certain deferment periods.
In 2013 President Obama signed the Bipartisan Student Loan Certainty Act which established interest rates for all types of new Direct Loans made on or after July 1, 2013. Interest rates on Direct Loans are set annually based on Treasury rates but once the rate is set, the rate is fixed for the life of the loan. Interest rates are set by: (1) indexing the interest rate to the rate of ten-year Treasury notes; and (2) adding the indexed rate to a specific base percent for each loan type with specific caps for each loan type. For Federal Direct Subsidized Stafford Loans and Federal Direct Unsubsidized Stafford Loans issued to un-dergraduate students, the rate is 2.05 percentage points above the Treasury 10-year note rate and capped at 8.25 percent. For Federal Direct Unsubsidized Stafford Loans issued to graduate and professional students, the rate is 3.6 percentage points above the Treasury rate and capped at 9.5 percent. For Federal Direct PLUS Loans issued to parents and graduate and professional students, the rate is 4.6 percentage points above the Treasury rate and capped at 10.5 percent.
The Direct Loan program offers a variety of flexible repayment plans including income-driven ones for all stu-dent borrowers, regardless of the type of loan. In October 2011, the Administration announced a “Pay As You Earn” (PAYE) initiative for certain eligible student bor-rowers that set monthly loan payments at no more than 10 percent of the borrowers’ discretionary incomes and with their remaining balances forgiven after 20 years. In

20. CREDIT AND INSURANCE 315
December 2015, similar benefits were extended to all stu-dent borrowers, regardless of when they borrowed. The 2017 Budget would continue to allow all borrowers access to PAYE, but proposes reforms to ensure that the pro-gram’s benefits are better targeted.
In addition, the Federal Perkins Loan Program has pro-vided low interest loans to help students finance the costs of postsecondary education. Students at approximately 1,500 participating postsecondary institutions could ob-tain Perkins loans from the school. In 2016, Congress extended the authority to make loans under the existing program through September 30, 2017. The 2017 Budget proposes to create an expanded, modernized Perkins Loan program providing $8.5 billion in loan volume annually, beginning in the 2017-2018 school year, so that students will continue to have access to credit after the scheduled program termination.
The Department of Education offers two types of loan forgiveness to incentivize student borrowers to enter teaching careers in high-needs schools. The 2017 Budget consolidates into one new program these forgiveness pro-grams and the TEACH Grant program. TEACH currently offers annual grants to undergraduate and graduate stu-dents who agree to teach in high-needs subjects and schools, which convert to loans for participants who do not fulfill their service requirements. Beginning in 2021, the proposed streamlined teacher loan forgiveness program increases the maximum benefit available to teachers graduating from effective teacher preparation programs, seeks to incentivize retention by staggering forgiveness over five years, and maintains the requirement to teach in a high-need school.
Small Business and Farm Credit Programs and GSEs
The Government offers direct loans and loan guarantees to small businesses and farmers, who may have difficulty obtaining credit elsewhere. It also provides guarantees of debt issued by certain investment funds that invest in small businesses. Two GSEs, the Farm Credit System and the Federal Agricultural Mortgage Corporation, increase liquidity in the agricultural lending market.
Loans to Small Businesses
The Small Business Administration (SBA) helps en-trepreneurs start, sustain, and grow small businesses. As a “gap lender,” SBA works to supplement market lending and provide access to credit where private lend-ers are reluctant to do so at a reasonable price without a Government guarantee. SBA also helps home- and business-owners, as well as renters, cover the uninsured costs of recovery from disasters through its direct loan program. At the end of 2015 SBA’s outstanding balance of direct and guaranteed loans totaled approximately $119 billion. Due to the improved economy, past fee waivers, and SBA improvements in streamlining lender documen-tation requirements, demand for SBA guaranteed loans has significantly increased in the last two years. For this reason, the 2016 limitation on SBA’s 7(a) loan guarantees
was increased to $26.5 billion following nearly $22 billion in lending net of cancellations in 2015, and the Budget in-creases it to $27 billion to accommodate expected demand as the economy and opportunities for small businesses grow. The 2017 Budget appropriations language also in-cludes a provision that would provide the Administrator of SBA flexibility to further increase the program level if needed.
The 2017 Budget supports $42 billion in financing for small businesses with no subsidy costs through the 7(a) General Business Loan program and the 504 Certified Development Company (CDC) program. As noted, the 7(a) program will support $27 billion in guaranteed loans that will help small businesses operate and expand. The 504 program will support $7.5 billion in guaranteed loans for fixed-asset financing, and $7.5 billion in 504 guarantees to allow small businesses to refinance to take advan-tage of current interest rates and free up resources for expansion. In addition, SBA will supplement the capital of Small Business Investment Corporations (SBICs) with up to $4 billion in long-term, guaranteed loans to support SBICs’ venture capital investments in small businesses. SBA is able to continue all borrower fee waivers on 7(a) loans less than $150 thousand as well as partial waivers on 7(a) loans less than $500 thousand to veteran-owned businesses in the 2017 Budget.
The Budget also supports SBA’s disaster direct loan program at its 10-year average volume of $1.1 billion in loans, and includes $187 million to administer the pro-gram. Of this amount, $159 million is provided through the Budget Control Act’s disaster relief cap adjustment for costs related to Stafford Act (Presidentially-declared) disasters.
For the 2017 Budget, SBA recorded a net downward reestimate of $1.3 billion in the expected costs of its outstanding loan portfolio, reflecting an improved loan performance forecast, which will decrease the 2016 bud-get deficit.
The Budget also requests subsidy to support $44 mil-lion in direct loans, and $31 million in technical assistance grant funds for the Microloan program. The Microloan program provides low-interest loan funds to non-profit in-termediaries who in turn provide loans of up to $50,000 to new entrepreneurs.
The 2017 Budget also includes a mandatory propos-al to create the Scale-Up Manufacturing Investment Companies (SUMIC) program within SBA that would support young, innovative manufacturing technologies by financing their scale-up from prototypes to commercial-scale facilities in the United States. The SUMIC program is designed to generate $10 billion in investment activity over five years, using $5 billion in Federal financing and a matching amount of private funds to bridge a significant portion of the financing gap for small advanced manu-facturing startups. The program would support private funds in a similar way to how SBA operates its SBIC debt guarantee program, but of a much larger fund and proj-ect size necessary to support the needs of manufacturing scale-up efforts. The estimated subsidy costs associated with each application for a Federal contribution to a fund
316 ANALYTICAL PERSPECTIVES
would be determined on a fund-by-fund basis using ac-tual fund financial information. For purposes of the 2017 Budget, a subsidy rate of 25 percent is assumed, based on conservative cash flow assumptions and an annual fee to offset some expected default costs.
To help small businesses drive economic recovery and create jobs, the Small Business Jobs Act of 2010 created two new mandatory programs that provide financing as-sistance to small businesses: State Small Business Credit Initiative (SSBCI) and Small Business Lending Fund. The Department of the Treasury administers those programs, and SSBCI remains highly active. SSBCI is designed to support state programs that make new loans or invest-ments to small businesses and small manufacturers. SSBCI has offered states and territories (and in certain circumstances, municipalities) the opportunity to apply for Federal funds to finance programs that partner with private lenders to extend new credit to small businesses to create jobs. These funds have allowed States to create or improve various small business programs, including collateral support programs, capital access programs, revolving loan and loan guarantee programs, loan par-ticipation programs, and State venture capital programs. SSBCI guidelines state that all approved programs must demonstrate a reasonable expectation of minimum over-all leverage of $10 in new private lending for every $1 in Federal funding. Treasury is providing approximately $1.5 billion for SSBCI, which translates into $15 billion in new lending to small businesses at the 10-to-1 lever-age ratio. As of September 14, 2015, SSBCI had approved funding for 47 states, 5 territories, 4 municipalities, and the District of Columbia for a total of nearly $1.5 billion in obligations, of which $1.35 billion had already been disbursed. Through December 31st, 2014, SSBCI has supported more than 12,400 loans or investments, which helped create 87 new businesses and are estimated to cre-ate or save 140,000 American jobs.
The Budget proposes a new authorization of $1.5 billion for a second round of the SSBCI to build on the momen-tum of the program’s first round, strengthen the Federal government’s relationship with state economic develop-ment agencies, and provide capital to America’s diverse community of entrepreneurs. The proposal requires $1 billion of the funding to be competitively awarded to States best able to target local market needs, promote in-clusion, attract private capital for start-up and scale-up businesses, strengthen regional entrepreneurial ecosys-tems, and evaluate results. The remaining $500 million will be allocated to States according to a need-based for-mula reflecting economic factors such as job losses and pace of economic recovery.
Treasury’s Community Development Financial Institutions (CDFI) Fund Bond Guarantee program, also authorized in the Small Business Jobs Act of 2010, provides CDFIs access to long term capital to fund large economic development projects such as multi-family rent-al properties, charter schools, and health care centers in low-income communities. Treasury is authorized to guar-antee up to 10 bond issuances per year with a $100 million minimum individual bond size. Program authority initial-
ly expired on September 30, 2014, but has been extended twice in annual appropriations bills and now expires in 2016. The Bond Guarantee program does not require dis-cretionary budget authority for credit subsidy but annual loan guarantee limitations must be appropriated. Through September 30, 2015, Treasury had issued $852 million in bond guarantee commitments to 16 CDFIs, supporting investments in low-income and underserved communi-ties. The Consolidated Appropriations Act, 2016, provides $750 million in additional commitment authority, and the Budget proposes to extend the Bond Guarantee program through 2017 with an annual commitment limitation of $1 billion and introduce reforms that will increase par-ticipation and ensure credit-worthy CDFIs have access to this important source of capital while continuing to main-tain strong protections against credit risk.
Loans to Farmers
The Farm Service Agency (FSA) assists low-income family farmers in starting and maintaining viable farm-ing operations. Emphasis is placed on aiding beginning and socially disadvantaged farmers. FSA offers operating loans and ownership loans, both of which may be either direct or guaranteed loans. Operating loans provide credit to farmers and ranchers for annual production expenses and purchases of livestock, machinery, and equipment, while farm ownership loans assist producers in acquiring and developing their farming or ranching operations. As a condition of eligibility for direct loans, borrowers must be unable to obtain private credit at reasonable rates and terms. As FSA is the “lender of last resort,” default rates on FSA direct loans are generally higher than those on private-sector loans. FSA-guaranteed farm loans are made to more creditworthy borrowers who have access to private credit markets. Because the private loan origina-tors must retain 10 percent of the risk, they exercise care in examining the repayment ability of borrowers. The subsidy rates for the direct programs fluctuate largely be-cause of changes in the interest component of the subsidy rate.
The number of loans provided by these programs has varied over the past several years. In 2015, FSA provided loans and loan guarantees to more than 37,000 family farmers totaling $5.7 billion. Direct and guaranteed loan programs provided assistance totaling $2.5 billion to beginning farmers during 2015. Loans for socially dis-advantaged farmers totaled $827 million, of which $438 million was in the farm ownership program and $389 mil-lion in the farm operating program. The average size of farm ownership loans was consistent over the past two years, with new customers receiving the bulk of the direct loans. The majority of assistance provided in the operat-ing loan program during 2015 was to beginning farmers as well. Overall, demand for FSA loans—both direct and guaranteed—continues to be high. More conservative credit standards in the private sector continue to drive ap-plicants from commercial credit to FSA direct programs. Low grain prices and uncertainty over interest rates con-tinue to cause lenders to force their marginal borrowers to FSA for credit. In the 2017 Budget, FSA proposes to
20. CREDIT AND INSURANCE 317
make $6.7 billion in direct and guaranteed loans through discretionary programs, including guaranteed conserva-tion loans. The overall loan level for conservation loans is unchanged from the 2016 requested level of $150 million.
Lending to beginning farmers was strong during 2015. FSA provided direct or guaranteed loans to more than 20,500 beginning farmers. Loans provided under the Beginning Farmer Down Payment Loan Program repre-sented 37 percent of total direct ownership loans made during the year, slightly lower than the previous year. Sixty-four percent of direct operating loans were made to beginning farmers, an increase of 4 percent in dol-lar volume over 2015. Overall, as a percentage of funds available, lending to beginning farmers was 7 percent-age points above the 2014 level, propelled by a 5 percent increase in ownership loans and 9 percent increase in operating loans made to beginning farmers. Lending to minority and women farmers was a significant portion of overall assistance provided, with $827 million in loans and loan guarantees provided to more than 9,200 farm-ers. This represents an increase of 8 percent in the overall number of direct loans to minority and women borrowers. Outreach efforts by FSA field offices to reach out to be-ginning and minority farmers and promote FSA funding have resulted in increased lending to these groups.
FSA continues to evaluate the farm loan programs in order to improve their effectiveness. FSA released a new Microloan program to increase lending to small niche pro-ducers and minorities. This program has been expanded to include guaranteed as well as direct loans. This pro-gram dramatically simplifies application procedures for small loans, and implements more flexible eligibility and experience requirements. The demand for the micro-loan program continues to grow while delinquencies and defaults remain at or below those of the regular FSA oper-ating loan program. FSA has also developed a nationwide continuing education program for its loan officers to en-sure they remain experts in agricultural lending, and it is transitioning all information technology applications for direct loan servicing into a single, web-based applica-tion that will expand on existing capabilities to include all special servicing options. Its implementation will al-low FSA to better service its delinquent and financially distressed borrowers.
The Farm Credit System (Banks and Associations)
The Farm Credit System (FCS or System) is a Government-sponsored enterprise (GSE) composed of a nationwide network of borrower-owned cooperative lend-ing institutions originally authorized by Congress in 1916. The FCS’s mission continues to be providing sound and dependable credit to American farmers, ranchers, produc-ers or harvesters of aquatic products, their cooperatives, and farm-related businesses. In addition, they serve ru-ral America by providing financing for rural residential real estate, rural communication, energy and water infra-structure, and agricultural exports.
The financial condition of the System’s banks and as-sociations remains fundamentally sound. The ratio of capital to assets has remained stable at 16.8 percent
on September 30, 2015, compared with 16.9 percent on September 30, 2014. Capital consisted of $44.9 billion in unrestricted capital and $4.0 billion in restricted capital in the Farm Credit Insurance Fund, which is held by the Farm Credit System Insurance Corporation (FCSIC). For the first nine months of calendar year 2015, net income equaled $3.5 billion compared with $3.6 billion for the same period of the previous year. The small decline in net income resulted from a slight increase in noninterest expense.
Over the 12-month period ending September 30, 2015, nonperforming loans as a percentage of total loans out-standing decreased from 0.85 percent to 0.76 percent. System assets moderately grew by 7.1 percent during that period, primarily due to increases in real estate mortgage loans and agribusiness loans. Real estate mortgage loans increased due to continued demand for financing crop-land. The increase in agribusiness loans was due to an increase in advances on existing processing and market-ing loans.
Over the 12-month period ending September 30, 2015, the System’s loans outstanding grew by $18.8 billion, or 9.0 percent, while over the past three years they grew by $41.7 billion, or 23.0 percent. As required by law, bor-rowers are also stockholder-owners of System banks and associations. As of September 30, 2015, System institu-tions had 504,568 of these stockholders-owners.
The number of FCS institutions continues to decrease because of consolidation. As of September 30, 2015, the System consisted of four banks and 76 associations, compared with seven banks and 104 associations in September 2002. Of the 80 FCS banks and associations, 76 of them had one of the top two examination ratings (1 or 2 on a 1 to 5 scale) and accounted for 99 percent of gross Systems assets. Three FCS institutions had a rating of 3, and 1 institution was rated a 4.
In 2014, the pace of new lending to young, beginning, and small farmers exceeded the pace in overall farm lend-ing by Farm Credit System institutions. The number of loans made in 2014 to young and beginning farmers in-creased by 2.0 percent and 1.8 percent from 2013, while overall the number of farm loans made by the System fell 1.8 percent. The number of loans to small farmers declined by 1.4 percent, but because small farmer loans declined less than overall farm loans, the share of small farmer loans increased as well. Loans to young, begin-ning, and small farmers and ranchers represented 16.9 percent, 21.2 percent, and 40.2 percent, respectively, of the total new farm loans made in 2014.
The dollar volume of new loans made to young and beginning categories rose in 2014 from 2013 by 5.0 per-cent and 3.2 percent, respectively. The System’s overall volume of new farm loans grew by 1.8 percent. Therefore, the share of total System farm loan volume made to these categories rose from that of 2013. Loan volume to small farmers decreased 5.2 percent from 2013. Loans to young, beginning, and small farmers and ranchers represented 11.3 percent, 14.8 percent, and 13.9 percent, respectively, of the total dollar volume of all new farm loans made in 2014. Young, beginning, and small farmers are not mutu-
318 ANALYTICAL PERSPECTIVES
ally exclusive groups and, thus, cannot be added across categories. Maintaining special policies and programs for the extension of credit to young, beginning, and small farmers and ranchers is a legislative mandate for the System.
The System, while continuing to record strong earn-ings and capital growth, remains exposed to a variety of risks associated with its portfolio concentration in agri-culture and rural America. In 2015, downward pressure on grain prices stemmed from large supplies relative to demand following bumper crops in recent years for the major grains. Low grain and oilseed prices have helped control feed costs for livestock, poultry, and dairy farm-ers, but margins for these subsectors have been squeezed by weaker output prices. The housing sector continues to improve, which should translate into improved credit conditions for the housing related sectors such as timber and nurseries. Overall, the agricultural sector remains subject to risks such as a farmland price decline, which actually occurred in 2015 in the Midwest and other parts of the country, a potential rise in interest rates, continued volatility in commodity prices, weather-related catas-trophes, and long-term environmental risks related to climate change.
The FCSIC, an independent Government-controlled corporation, ensures the timely payment of principal and interest on FCS obligations on which the System banks are jointly and severally liable. On September 30, 2015, the assets in the Insurance Fund totaled $4.0 billion. As of September 30, 2015, the Insurance Fund as a per-centage of adjusted insured debt was 1.94 percent. This was slightly below the statutory secure base amount of 2 percent. During the first nine months of calendar year 2015, outstanding insured System obligations grew by 2.7 percent.
Federal Agricultural Mortgage Corporation (Farmer Mac)
Farmer Mac was established in 1988 as a federally chartered instrumentality of the United States and an in-stitution of the FCS to facilitate a secondary market for farm real estate and rural housing loans. Farmer Mac is not liable for any debt or obligation of the other System in-stitutions, and no other System institutions are liable for any debt or obligation of Farmer Mac. The Farm Credit System Reform Act of 1996 expanded Farmer Mac’s role from a guarantor of securities backed by loan pools to a direct purchaser of mortgages, enabling it to form pools to securitize. In May 2008, the Food, Conservation and Energy Act of 2008 (2008 Farm Bill) expanded Farmer Mac’s program authorities by allowing it to purchase and guarantee securities backed by rural utility loans made by cooperatives.
Farmer Mac continues to meet core capital and regu-latory risk-based capital requirements. As of September 30, 2015, Farmer Mac’s total outstanding program volume (loans purchased and guaranteed, standby loan purchase commitments, and AgVantage bonds purchased and guar-anteed) amounted to $15.6 billion, which represents an increase of 11.4 percent from the level a year ago. Of to-
tal program activity, $11.1 billion were on-balance sheet loans and guaranteed securities, and $4.5 billion were off-balance-sheet obligations. Total assets were $14.9 bil-lion, with non-program investments (including cash and cash equivalents) accounting for $3.5 billion of those as-sets. Farmer Mac’s net income attributable to common stockholders (“net income”) for the first three quarters of calendar year 2015 was $32.3 million. Net income was stable compared to the same period in 2014 during which Farmer Mac reported net income of $32.6 million.
Farmer Mac’s earnings can be substantially influenced by unrealized fair-value gains and losses. For example, fair-value changes on financial derivatives resulted in an unrealized gain of $0.9 million for the first three quarters of 2015, compared with unrealized losses of $12.5 mil-lion for the same period in 2014 (both pre-tax). Although unrealized fair-value changes experienced on financial derivatives temporarily impact earnings and capital, those changes are not expected to have any permanent effect if the financial derivatives are held to maturity, as is expected.
Energy and Infrastructure Credit Programs
This Administration is committed to constructing a new foundation for economic growth and job creation, and clean energy is a critical component of that. The general public, as well as individual consumers and owners, ben-efits from clean energy and well-developed infrastructure. Thus, the Federal Government promotes clean energy and infrastructure development through various credit programs.
Credit Programs to Promote Clean and Efficient Energy
The Department of Energy (DOE) administers two credit programs that serve to reduce emissions and en-hance energy efficiency: a loan guarantee program to support innovative energy technologies and a direct loan program to support advanced automotive technologies.
The Energy Policy Act of 2005 authorized DOE to issue loan guarantees for projects that employ innova-tive technologies to reduce air pollutants or man-made greenhouse gases under the Title 17 loan guarantee program. Congress provided $4 billion in loan volume au-thority for Title 17 in 2007, and the 2009 Consolidated Appropriations Act provided an additional $47 billion in loan volume authority, allocated as follows: $18.5 billion for nuclear power facilities, $2 billion for “front-end” nu-clear enrichment activities, $8 billion for advanced fossil energy technologies, and $18.5 billion for energy efficien-cy, renewable energy, and transmission and distribution projects. The 2011 appropriations reduced the available loan volume authority for energy efficiency, renewable energy, and transmission and distribution projects by $17 billion and provided $170 million in credit subsidy to support renewable energy or energy efficient end-use energy technologies. In 2015 DOE added $1 billion from existing unallocated mixed-use authority to existing loan solicitations and clarified eligibility for distributed energy
20. CREDIT AND INSURANCE 319
projects. The President’s 2017 Budget requests $4 billion in mixed-use loan authority.
The American Reinvestment and Recovery Act of 2009 amended the program’s authorizing statute to al-low loan guarantees on a temporary basis for commercial or advanced renewable energy systems, electric power transmission systems, and leading edge biofuel projects, providing $2.5 billion in credit subsidy for loan guaran-tees. Authority for the temporary program to extend new loans expired September 30, 2011. DOE provided loan guarantees to 28 projects totaling over $16 billion in guaranteed debt including: 12 solar generation, 4 solar manufacturing, 4 wind generation, 3 geothermal, 2 bio-fuels, and 3 transmission/energy storage projects. Four projects withdrew prior to any disbursement of funds. From 2014-2015, DOE closed on three loan guarantees to-taling approximately $8 billion to support the construction of two new commercial nuclear power reactors. Currently DOE has open solicitations for Renewable Energy and Efficient Energy, Advanced Fossil, and Advanced Nuclear projects.
The Advanced Technology Vehicle Manufacturing (ATVM) Direct Loan program was created to support the development of advanced technology vehicles and associ-ated components in the United States that would improve vehicle energy efficiency by at least 25 percent relative to a 2005 Corporate Average Fuel Economy standards base-line. In 2009, Congress appropriated $7.5 billion in credit subsidy to support a maximum of $25 billion in loans un-der ATVM. The program provides loans to automobile and automobile part manufacturers for the cost of re-equip-ping, expanding, or establishing manufacturing facilities in the United States, and for other costs associated with engineering integration.
Electric and Telecommunications Loans
Rural Utilities Service (RUS) programs of the United States Department of Agriculture (USDA) provide loans for rural electrification, telecommunications, distance learning, and telemedicine, and also provide grants for distance learning and telemedicine (DLT).
The Budget includes $6.5 billion in direct loans for electricity distribution, construction of renewable energy facilities, transmission, and carbon capture projects on facilities to replace fossil fuels. The Budget also provides $690 million in direct telecommunications loans, $39 mil-lion in broadband grants, and $35 million in DLT grants.
USDA Rural Infrastructure and Business Development Programs
USDA provides grants, loans, and loan guarantees to communities for constructing facilities such as healthcare clinics, police stations, and water systems. Direct loans are available at lower interest rates for the poorest com-munities. These programs have very low default rates. That coupled with the historically low funding costs for the Government has resulted in negative subsidy rates for these programs.
The program level for the Water and Wastewater treatment facility loan and grant program in the 2017
President’s Budget is $1.23 billion. These funds are avail-able to communities of 10,000 or fewer residents.
The Community Facility (CF) Program targets grants and direct loans to rural communities with fewer than 20,000 residents. The 2017 Budget includes $25 million for the CF grants to expand the community facility grant program to address ongoing needs and emerging priori-ties such as Promise Zones and Strike Force Communities. These funds will allow USDA to be responsive to new needs in communities across rural America and target them in a flexible way. In addition, the Budget includes a direct CF loan level of $2.2 billion.
USDA also provides grants, direct loans, and loan guar-antees to assist rural businesses, cooperatives, nonprofits, and farmers in creating new community infrastructure (i.e. educational and healthcare networks) and to diver-sify the rural economy and employment opportunities. In 2017, USDA proposes to provide $935 million in loan guar-antees and direct loans to entities that serve communities of 25,000 or fewer residents through the Intermediary Relending program and to entities that serve communi-ties of 50,000 or fewer residents through the Business and Industry guaranteed loan program and the Rural Microentrepreneur Assistance program. These loans are structured to save or create jobs and stabilize fluctuating rural economies.
The Rural Business Service is also responsible for the Rural Energy for America program for which the Budget includes $68.5 million in funding to support $357 million in loan guarantees and grants to promote energy efficien-cies, renewable energy, and small business development in rural communities.
Transportation Infrastructure
Federal credit programs offered through the Department of Transportation (DOT) fund critical transportation infrastructure projects, often using innovative financing methods. The two predominant pro-grams are the program authorized by the Transportation Infrastructure Finance and Innovation Act (TIFIA) and the Railroad Rehabilitation and Improvement Financing (RRIF) program.
Established by the Transportation Equity Act of the 21st century (TEA-21) in 1998, the TIFIA program is designed to fill market gaps and leverage substantial private co-investment by providing supplemental and subordinate capital to projects of national or regional significance. Through TIFIA, DOT provides three types of Federal credit assistance to highway, transit, rail, and intermodal projects: direct loans, loan guarantees, and lines of credit. The 61 TIFIA-assisted loans account for almost $83 billion of infrastructure investment in the United States. Government commitments in these part-nerships constitute over $23 billion in Federal assistance with a budgetary cost of approximately $1.5 billion.
TIFIA can help advance qualified, large-scale projects that otherwise might be delayed or deferred because of size, complexity, or uncertainty over the timing of rev-enues at a relatively low budgetary cost. Each dollar of subsidy provided for TIFIA can provide approximately
320 ANALYTICAL PERSPECTIVES
$10 in credit assistance, and leverage an additional $20 to $30 in non-Federal transportation infrastructure in-vestment. The Fixing America’s Surface Transportation (FAST) Act of 2015 authorizes TIFIA at $275 million in fiscal year 2016, escalating to $300 million by fiscal year 2020.
DOT has also provided direct loans and loan guaran-tees to railroads since 1976 for facilities maintenance, rehabilitation, acquisitions, and refinancing. Federal as-sistance was created to provide financial assistance to the financially-challenged portions of the rail industry. However, following railroad deregulation in 1980, the industry’s financial condition began to improve, larger railroads were able to access private credit markets, and interest in Federal credit support began to decrease.
Also established by TEA-21 in 1998, the RRIF program may provide loans or loan guarantees with an interest rate equal to the Treasury rate for similar-term securi-ties. TEA-21 also stipulates that non-Federal sources pay the subsidy cost of the loan, thereby allowing the program to operate without Federal subsidy appropria-tions. The RRIF program assists projects that improve rail safety, enhance the environment, promote economic development, or enhance the capacity of the national rail network. While refinancing existing debt is an eligible use of RRIF proceeds, capital investment projects that would not occur without a RRIF loan are prioritized. Since its in-ception, $2.7 billion in direct loans have been made under the RRIF program.
The FAST Act included programmatic changes to en-hance the RRIF program to mirror the qualities of TIFIA, including broader eligibility, a loan term that can be as long as 35 years from project completion, and a fully sub-ordinated loan under certain conditions. Additionally, in 2016 Congress reprogrammed $1.96 million in unobli-gated balances to assist Class II and Class III Railroads in preparing and applying for direct loans and loan guarantees.
Financing America’s Infrastructure Renewal (FAIR) program
The Budget proposes to establish a Financing America’s Infrastructure Renewal (FAIR) program with-in the Department of the Treasury that would provide direct loans to U.S. infrastructure projects developed through a public-private partnership (P3). The program seeks to reduce the financing cost gap between P3s and traditional procurement, which will level the playing field for P3s and encourage the public sector, including State and local governments, to evaluate the merits of P3s for a given project. While P3s are not a solution to the Nation’s overall infrastructure funding needs, which continue to deserve greater Federal investment, they may generate certain public benefits. P3s are a financing and procure-ment tool that, in some circumstances, can accelerate the delivery of complex projects, leverage the resources and expertise of the private sector, mitigate construction and operational risks to the public sector, and reduce the like-lihood of deferred maintenance on a project.
Eligible projects under the program will encompass the transportation, water, energy, and broadband sectors, as well as certain social infrastructure, such as educational facilities, and must meet all applicable environmental and labor standards. The Budget estimates that the FAIR program will provide $15 billion in financing support over the current 10 year budget window (2017-2026), with an average transaction size of $300 million. The proposal dif-fers from the Administration’s National Infrastructure Bank (NIB) proposal, described more fully below, because it targets lending at zero financing subsidy and does not require the formation of a new entity. The Budget estimates approximately $2.3 million per year of admin-istrative expenses. This program may ultimately serve as a bridge to the creation of a NIB.
National Infrastructure Bank
To direct Federal resources for infrastructure to proj-ects that demonstrate the most merit and may be difficult to fund under the current patchwork of Federal programs, the President has called for the creation of an independent, non-partisan National Infrastructure Bank (NIB), led by infrastructure and financial experts. The NIB would offer broad eligibility and unbiased selection for transporta-tion, water, and energy infrastructure projects. Projects would have a clear public benefit, meet rigorous economic, technical and environmental standards, and be backed by a dedicated revenue stream. Geographic, sector, and size considerations would also be taken into account. Interest rates on loans issued by the NIB would be indexed to United States Treasury rates, and the maturity could be extended up to 35 years, giving the NIB the ability to be a “patient” partner side-by-side with State, local, and private co-investors. To maximize leverage from Federal investments, the NIB would finance no more than 50 per-cent of the total costs of any project.
International Credit Programs
Seven Federal agencies—the Department of Agriculture (USDA), the Department of Defense, the Department of State, the Department of the Treasury, the Agency for International Development (USAID), the Export-Import Bank, and the Overseas Private Investment Corporation (OPIC)—provide direct loans, loan guarantees, and in-surance to a variety of private and sovereign borrowers. These programs are intended to level the playing field for U.S. exporters, deliver robust support for U.S. goods and services, stabilize international financial markets, enhance security and promote sustainable development.
Leveling the Playing Field
Federal export credit programs counter official financ-ing that foreign governments around the world, largely in Europe and Japan but also increasingly in emerging mar-kets such as China and Brazil, provide their exporters, usually through export credit agencies (ECAs). The U.S. Government has worked since the 1970’s to constrain offi-cial credit support through a multilateral agreement in the Organization for Economic Cooperation and Development
20. CREDIT AND INSURANCE 321
(OECD). In its current form, this agreement has virtu-ally eliminated direct interest rate subsidies, significantly constrained tied-aid grants, and standardized the fees for corporate and sovereign lending across all OECD ECAs—bringing the all-in costs of OECD export credit financing broadly in line with market levels. In addition to ongo-ing OECD negotiations, U.S. Government efforts resulted in the 2012 creation of the International Working Group (IWG) on export credits. This group includes China and other non-OECD providers of export credits in discus-sions on a broader framework that would bring common practices to ECAs throughout the world.
The Export-Import Bank provides export credits, in the form of direct loans or loan guarantees, to U.S. export-ers who meet basic eligibility criteria and who request the Bank’s assistance. USDA’s Export Credit Guarantee Programs (also known as GSM programs) similarly help to level the playing field. Like programs of other agri-cultural exporting nations, GSM programs guarantee payment from countries and entities that want to import U.S. agricultural products but cannot easily obtain credit.
Stabilizing International Financial Markets
Consistent with U.S. obligations in the International Monetary Fund regarding global financial stabil-ity, the Exchange Stabilization Fund managed by the Department of the Treasury may provide loans or credits to a foreign entity or government of a foreign country. A loan or credit may not be made for more than six months in any 12-month period unless the President gives the Congress a written statement that unique or emergency circumstances require that the loan or credit be for more than six months.
Supporting the Nation’s International Partners
The U.S. Government, through USAID, can extend short-to-medium-term loan guarantees that cover poten-tial losses that might be incurred by lenders if a country defaults on its borrowings; for example, the U.S. may guarantee another country’s sovereign bond issuance. The purpose of this tool is to provide the Nation’s sovereign international partners access to necessary, urgent, and relatively affordable financing during temporary periods of strain when they cannot access such financing in inter-national financial markets, and to support critical reforms that will enhance long term fiscal sustainability, often in concert with support from international financial institu-tions such as the International Monetary Fund. The long term goal of sovereign loan guarantees is to help lay the economic groundwork for the Nation’s international part-ners to graduate to an unenhanced bond issuance in the international capital markets. For example, as part of the U.S. response to fiscal crises, the U.S. Government has ex-tended sovereign loan guarantees to Tunisia, Jordan, and Ukraine to enhance their access to capital markets, while promoting economic policy adjustment.
Using Credit to Promote Sustainable Development
Credit is an important tool in U.S. bilateral assistance to promote sustainable development. USAID’s Development Credit Authority (DCA) allows USAID to use a variety of credit tools to support its development activities abroad. DCA provides non-sovereign loan guarantees in targeted cases where credit serves more effectively than tradition-al grant mechanisms to achieve sustainable development. DCA is intended to mobilize host country private capital to finance sustainable development in line with USAID’s strategic objectives. Through the use of partial loan guar-antees and risk sharing with the private sector, DCA stimulates private-sector lending for financially viable development projects, thereby leveraging host-country capital and strengthening sub-national capital markets in the developing world.
OPIC mobilizes private capital to help solve critical challenges such as renewable energy and infrastructure development, and in doing so, advances U.S. foreign policy. OPIC achieves its mission by providing investors with fi-nancing, guarantees, political risk insurance, and support for private equity investment funds. These programs are intended to create more efficient financial markets, even-tually encouraging the private sector to supplant OPIC finance in developing countries.
Ongoing Coordination
International credit programs are coordinated through two groups to ensure consistency in policy design and cred-it implementation. The Trade Promotion Coordinating Committee (TPCC) works within the Administration to develop a National Export Strategy to make the delivery of trade promotion support more effective and convenient for U.S. exporters.
The Interagency Country Risk Assessment System (ICRAS) standardizes the way in which most agencies that lack sufficient historical experience to budget for the cost associated with the risk of international lend-ing. The cost of lending by these agencies is governed by proprietary U.S. Government ratings, which correspond to a set of default estimates over a given maturity. The methodology establishes assumptions about default risks in international lending using averages of international sovereign bond market data. The strength of this method is its link to the market and an annual update that ad-justs the default estimates to reflect the most recent risks observed in the market.
Promoting Economic Growth and Poverty Reduction through Debt Sustainability
The Enhanced Heavily Indebted Poor Countries (HIPC) Initiative reduces the debt of some of the poorest countries with unsustainable debt burdens that are com-mitted to economic reform and poverty reduction.
322 ANALYTICAL PERSPECTIVES
III. INSURANCE PROGRAMS
Deposit Insurance
Federal deposit insurance promotes stability in the U.S. financial system. Prior to the establishment of Federal deposit insurance, depository institution failures often caused depositors to lose confidence in the banking system and rush to withdraw deposits. Such sudden withdrawals caused serious disruption to the economy. In 1933, in the midst of the Great Depression, a system of Federal de-posit insurance was established to protect depositors and to prevent bank failures from causing widespread disrup-tion in financial markets.
Today, the Federal Deposit Insurance Corporation (FDIC) insures deposits in banks and savings associa-tions (thrifts) using the resources available in its Deposit Insurance Fund (DIF). The National Credit Union Administration (NCUA) insures deposits (shares) in most credit unions through the National Credit Union Share Insurance Fund (SIF). (Some credit unions are privately insured.) As of September 30, 2015, the FDIC insured $6.4 trillion of deposits at 6,279 commercial banks and thrifts, and the NCUA insured $940 billion of shares at 6,102 credit unions.
Recent Reforms
Since its creation, the Federal deposit insurance sys-tem has undergone many reforms. As a result of the 2008 crisis, several reforms were enacted to protect both the immediate and longer-term integrity of the Federal de-posit insurance system. The Helping Families Save Their Homes Act of 2009 (P.L. 111–22) provided NCUA with tools to protect the Share Insurance Fund and the fi-nancial stability of the credit union system. Notably, the Helping Families Save Their Homes Act:
• Established the Temporary Corporate Credit Union Stabilization Fund (TCCUSF), allowing NCUA to segregate the losses of corporate credit unions and providing a mechanism for assessing those losses to federally insured credit unions over an extended pe-riod of time;
• Provided flexibility to the NCUA Board by permit-ting use of a restoration plan to spread insurance premium assessments over a period of up to eight years or longer in extraordinary circumstances, if the SIF equity ratio fell below 1.2 percent; and
• Permanently increased the Share Insurance Fund’s borrowing authority to $6 billion.
The Dodd-Frank Wall Street Reform and Consumer Protection (Wall Street Reform) Act of 2010 included provisions allowing the FDIC to more effectively and ef-ficiently manage the DIF. The Act requires the FDIC to achieve a minimum DIF reserve ratio (ratio of the de-posit insurance fund balance to total estimated insured deposits) to 1.35 percent by 2020, up from 1.15 percent. In
addition to raising the minimum reserve ratio, the Wall Street Reform Act also:
• Eliminated the FDIC’s requirement to rebate premi-ums when the DIF reserve ratio is between 1.35 and 1.5 percent;
• Gave the FDIC discretion to suspend or limit re-bates when the DIF reserve ratio is 1.5 percent or higher, effectively removing the 1.5 percent cap on the DIF; and
• Required the FDIC to offset the effect on small in-sured depository institutions (defined as banks with assets less than $10 billion) when setting assess-ments to raise the reserve ratio from 1.15 to 1.35 percent.
In implementing the Wall Street Reform Act, the FDIC issued a final rule setting a long-term (i.e., beyond 2025) reserve ratio target of 2 percent, a goal that FDIC con-siders necessary to maintain a positive fund balance during economic crises while permitting steady long-term assessment rates that provide transparency and predict-ability to the banking sector. This rule, coupled with other provisions of the Wall Street Reform Act, will significantly improve the FDIC’s capacity to resolve bank failures and maintain financial stability during economic downturns.
The Wall Street Reform Act also permanently increased the insured deposit level to $250,000 per account at banks or credit unions insured by the FDIC or NCUA.
Recent Fund Performance
After seven consecutive quarters of negative balances, the DIF balance became positive on June 30, 2011, stand-ing at $3.9 billion on an accrual basis, then doubling to $7.8 billion on September 30, 2011. As of September 30, 2015, the DIF fund balance stood at $70.1 billion. The growth in the DIF balance is a result of fewer bank fail-ures and higher assessment revenue. The reserve ratio on September 30, 2015 was 1.09 percent.
As of September 30, 2015, the number of insured in-stitutions on the FDIC’s “problem list” (institutions with the highest risk ratings) totaled 203, which represented a decrease of more than 74 percent from December 2010, the peak year for bank failures during the recent crisis. Furthermore, the assets held by problem institutions de-creased by nearly 87 percent.
The SIF ended September 2015 with assets of $12.5 billion and an equity ratio of 1.29 percent. If the equity ratio increases above the normal operating level of 1.30 percent, a distribution is normally paid to member credit unions to reduce the equity ratio to the normal operating level. However, the Helping Families Save Their Homes Act requires that the SIF distribution be directed to Treasury for the repayment of any outstanding TCCUSF loans before a distribution can be paid to member cred-it unions. In 2015, the equity ratio did not exceed 1.30

20. CREDIT AND INSURANCE 323
percent. As of September 30, 2015, the TCCUSF had a $2.3 billion loan outstanding from the Department of the Treasury.
The health of the credit union industry continues to improve. Consequently, the ratio of insured shares in problem institutions to total insured shares decreased to 0.81 percent in September 2015 from a high of 5.7 percent in December 2009. With the improving health of credit unions, NCUA has been steadily reducing SIF loss re-serves. As of September 30, 2015, the SIF had set aside $169.5 million in reserves to cover potential losses, a re-duction of 31 percent from the $244 million set-aside as of September 30, 2013.
Restoring the Deposit Insurance Funds
Pursuant to the Wall Street Reform Act, the restora-tion period for the FDIC’s DIF reserve ratio to reach 1.35 percent was extended to 2020. (Prior to the Act, the DIF reserve ratio was required to reach the minimum target of 1.15 percent by the end of 2016.) In late 2009, the FDIC Board of Directors adopted a final rule requiring insured institutions to prepay quarterly risk-based assessments for the fourth quarter of CY 2009 and for all of CY 2010, 2011, and 2012. The FDIC collected approximately $45 billion in prepaid assessments pursuant to this rule. Unlike a special assessment, the prepaid assessments did not immediately affect bank earnings; it was booked as an asset and amortized each quarter by that quarter’s as-sessment charge. This prepaid assessment, coupled with annual assessments on the banking industry, provided the FDIC with ample operating cash flows to effectively and efficiently resolve bank failures during the short period in which the DIF balance was negative. Although the FDIC has authority to borrow up to $100 billion from Treasury to maintain sufficient DIF balances, the Budget does not anticipate FDIC utilizing its borrowing authority because the DIF is projected to maintain positive operating cash flows over the entire 10-year budget horizon.
Since 2009 NCUA has successfully restored the re-serve ratio of the SIF to the normal operating level. Additionally, NCUA continues to seek compensation from the parties that created and sold troubled assets to the failed corporate credit unions. As of September 30, 2015, NCUA’s gross recoveries from securities underwriters to-tal more than $1.9 billion, helping to minimize losses and future assessments on federally insured credit unions. These recoveries have also accelerated repayment of the TCCUSF’s outstanding U.S. Treasury borrowings.
Budget Outlook
The Budget estimates DIF net outlays of -$68.0 bil-lion over the current 10-year budget window (2017-2026). Over the previous 10-year window of 2016-2025, net out-lays are -$68.2 billion. This $68.2 billion in net inflows to the DIF is $6 billion lower than estimated for the 2016 Mid-Session Review (MSR). The latest public data on the banking industry led to a reduction in bank failure esti-mates, reducing receivership proceeds, resolution outlays, and premiums necessary to reach the minimum Wall Street Reform Act DIF reserve ratio of 1.35 percent rela-
tive to MSR. On November 6, 2015, the FDIC published a notice of proposed rulemaking (as required by the Wall Street Reform Act) that would lower overall assessments and impose a 4.5 basis point surcharge on large banks, starting in the first quarter after the DIF reserve ratio reaches 1.15 percent and continuing until the reserve ratio reaches 1.35 percent. FDIC expects to collect these surcharges during 2017 and 2018 and the Budget esti-mates reflect the proposed assessment rates and a DIF reserve ratio of 1.35 percent in 2020.
Pension Guarantees
The Pension Benefit Guaranty Corporation (PBGC) insures the pension benefits of workers and retirees in covered defined-benefit pension plans. PBGC operates two legally distinct insurance programs: single-employer plans and multiemployer plans.
Single-Employer Program. Under the single-employer program, PBGC pays benefits, up to a guaranteed level, when a company’s plan closes without enough assets to pay future benefits. PBGC’s claims exposure is the amount by which qualified benefits exceed assets in in-sured plans. In the near term, the risk of loss stems from financially distressed firms with underfunded plans. In the longer term, loss exposure results from the possibility that well-funded plans become underfunded due to inade-quate contributions, poor investment results, or increased liabilities, and that the healthy firms sponsoring those plans become distressed.
PBGC monitors companies with underfunded plans and acts to protect the interests of the pension insur-ance program’s stakeholders where possible. Under its Early Warning Program, PBGC works with companies to strengthen plan funding or otherwise protect the insur-ance program from avoidable losses. However, PBGC’s authority to manage risks to the insurance program is limited. Most private insurers can diversify or reinsure their catastrophic risks as well as flexibly price these risks. Unlike private insurers, federal law does not allow PBGC to deny insurance coverage to a defined-benefit plan or adjust premiums according to risk. Both types of PBGC premiums—the flat rate (a per person charge paid by all plans) and the variable rate (paid by some under-funded plans) are set in statute.
Claims against PBGC’s insurance programs are highly variable. One large pension plan termination may result in a larger claim against PBGC than the termination of many smaller plans. The future financial health of the PBGC will continue to depend largely on the termination of a limited number of very large plans.
Single employer plans generally provide benefits to the employees of one employer. When an underfunded single employer plan terminates, usually through the bankruptcy process, PBGC becomes trustee of the plan, applies legal limits on payouts, and pays benefits. The amount of benefit paid is determined after taking into account (a) the benefit that a beneficiary had accrued in the terminated plan, (b) the availability of assets from the terminated plan to cover benefits, and (c) the legal maxi-
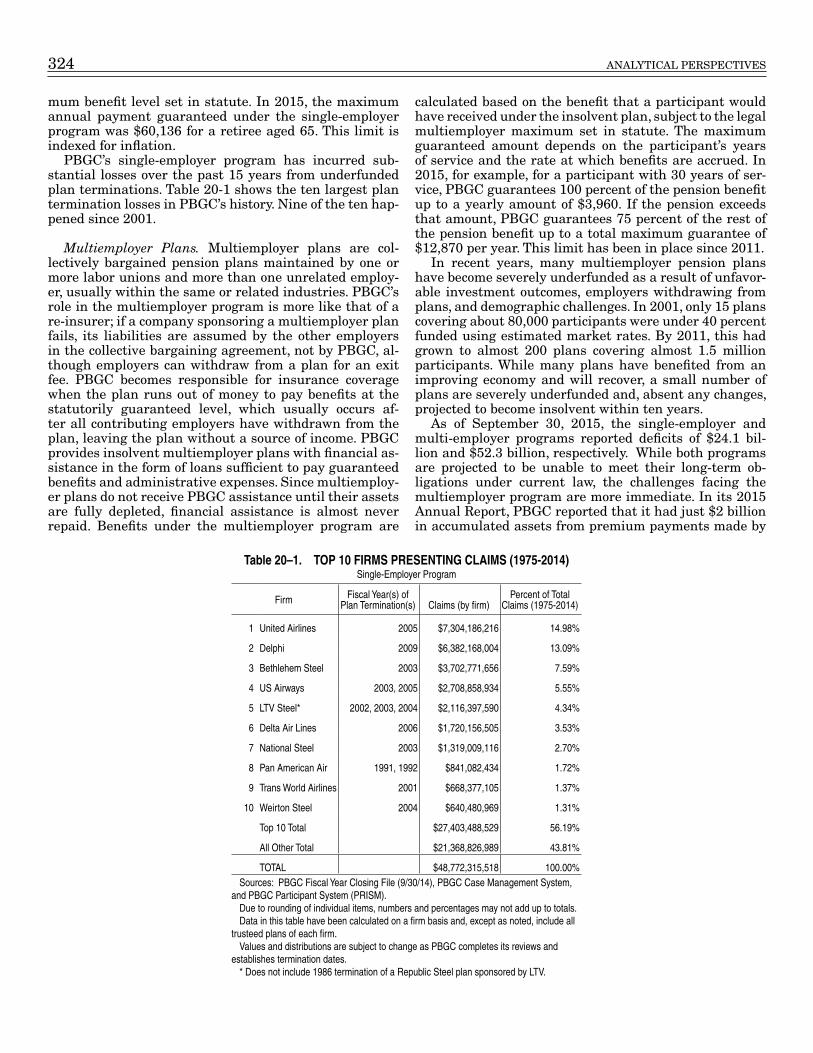
324 ANALYTICAL PERSPECTIVES
mum benefit level set in statute. In 2015, the maximum annual payment guaranteed under the single-employer program was $60,136 for a retiree aged 65. This limit is indexed for inflation.
PBGC’s single-employer program has incurred sub-stantial losses over the past 15 years from underfunded plan terminations. Table 20-1 shows the ten largest plan termination losses in PBGC’s history. Nine of the ten hap-pened since 2001.
Multiemployer Plans. Multiemployer plans are col-lectively bargained pension plans maintained by one or more labor unions and more than one unrelated employ-er, usually within the same or related industries. PBGC’s role in the multiemployer program is more like that of a re-insurer; if a company sponsoring a multiemployer plan fails, its liabilities are assumed by the other employers in the collective bargaining agreement, not by PBGC, al-though employers can withdraw from a plan for an exit fee. PBGC becomes responsible for insurance coverage when the plan runs out of money to pay benefits at the statutorily guaranteed level, which usually occurs af-ter all contributing employers have withdrawn from the plan, leaving the plan without a source of income. PBGC provides insolvent multiemployer plans with financial as-sistance in the form of loans sufficient to pay guaranteed benefits and administrative expenses. Since multiemploy-er plans do not receive PBGC assistance until their assets are fully depleted, financial assistance is almost never repaid. Benefits under the multiemployer program are
calculated based on the benefit that a participant would have received under the insolvent plan, subject to the legal multiemployer maximum set in statute. The maximum guaranteed amount depends on the participant’s years of service and the rate at which benefits are accrued. In 2015, for example, for a participant with 30 years of ser-vice, PBGC guarantees 100 percent of the pension benefit up to a yearly amount of $3,960. If the pension exceeds that amount, PBGC guarantees 75 percent of the rest of the pension benefit up to a total maximum guarantee of $12,870 per year. This limit has been in place since 2011.
In recent years, many multiemployer pension plans have become severely underfunded as a result of unfavor-able investment outcomes, employers withdrawing from plans, and demographic challenges. In 2001, only 15 plans covering about 80,000 participants were under 40 percent funded using estimated market rates. By 2011, this had grown to almost 200 plans covering almost 1.5 million participants. While many plans have benefited from an improving economy and will recover, a small number of plans are severely underfunded and, absent any changes, projected to become insolvent within ten years.
As of September 30, 2015, the single-employer and multi-employer programs reported deficits of $24.1 bil-lion and $52.3 billion, respectively. While both programs are projected to be unable to meet their long-term ob-ligations under current law, the challenges facing the multiemployer program are more immediate. In its 2015 Annual Report, PBGC reported that it had just $2 billion in accumulated assets from premium payments made by
Table 20–1. TOP 10 FIRMS PRESENTING CLAIMS (1975-2014)Single-Employer Program
Firm Fiscal Year(s) of Plan Termination(s) Claims (by firm)
Percent of Total Claims (1975-2014)
1 United Airlines 2005 $7,304,186,216 14.98%
2 Delphi 2009 $6,382,168,004 13.09%
3 Bethlehem Steel 2003 $3,702,771,656 7.59%
4 US Airways 2003, 2005 $2,708,858,934 5.55%
5 LTV Steel* 2002, 2003, 2004 $2,116,397,590 4.34%
6 Delta Air Lines 2006 $1,720,156,505 3.53%
7 National Steel 2003 $1,319,009,116 2.70%
8 Pan American Air 1991, 1992 $841,082,434 1.72%
9 Trans World Airlines 2001 $668,377,105 1.37%
10 Weirton Steel 2004 $640,480,969 1.31%
Top 10 Total $27,403,488,529 56.19%
All Other Total $21,368,826,989 43.81%
TOTAL $48,772,315,518 100.00%Sources: PBGC Fiscal Year Closing File (9/30/14), PBGC Case Management System,
and PBGC Participant System (PRISM).Due to rounding of individual items, numbers and percentages may not add up to totals.Data in this table have been calculated on a firm basis and, except as noted, include all
trusteed plans of each firm.Values and distributions are subject to change as PBGC completes its reviews and
establishes termination dates.* Does not include 1986 termination of a Republic Steel plan sponsored by LTV.
20. CREDIT AND INSURANCE 325
multiemployer plans, which it projected would be deplet-ed by 2025. If the program runs out of cash, the only funds available to support benefits would be the premiums that continue to be paid by remaining plans; this could result in benefits being cut much more deeply, to a small fraction of current guarantee levels.
To address the problems facing the multiemployer pro-gram and the millions of Americans who rely on those plans for their retirement security, the Congress passed The Multiemployer Pension Reform Act, which was in-cluded in the Consolidated and Further Continuing Appropriations Act signed on December 16, 2014. The law includes significant reforms to the multiemployer pen-sion plan system, including provisions that allow trustees of multiemployer plans facing insolvency to apply to the Department of Treasury to reduce benefits by temporar-ily or permanently suspending benefits. The law does not allow suspensions for individuals over age 80 or for those receiving a disability retirement benefit. A participant or beneficiary’s monthly benefit cannot be reduced be-low 110 percent of the PBGC guarantee. It also increases PBGC premiums from the $13 per person to $26 begin-ning in 2015. While the legislation is an important first step, it will not be enough to improve PBGC’s solvency for more than a very short period of time. PBGC projects that it is likely to become insolvent by 2025, extending its projected insolvency date by three years compared to the 2013 projection.
In addition, Congress enacted premium increases in the single-employer program as part of the Bipartisan Budget Act of 2015 (BBA). By increasing both the flat-rate and variable-rate premiums, the Act will raise as estimated $4 billion over the 10-year budget window. This additional revenue will improve the financial outlook for the single-employer program, which was already project-ed to see a large reduction in its deficit over the next 10 years.
Premiums. Both programs are underfunded, with combined liabilities exceeding assets by $76 billion at the end of 2015. While the single-employer program’s fi-nancial position is projected to improve over the next 10 years, in part because Congress has raised premiums in that program several times in recent years, the multiem-ployer program is projected to run out of funds in 2024. Particularly in the multiemployer program, premium rates remain much lower than what a private financial institution would charge for insuring the same risk and well below what is needed to ensure PBGC’s solvency.
To address these concerns, the Budget proposes to give the PBGC Board the authority to adjust premiums. The 2016 Budget proposed to raise premiums by $19 billion, with premiums to be split between the multiemployer and single-employer programs based on the size of their deficits. Given the $4 billion in recent premium increas-es enacted in the Bipartisan Budget Act (BBA) of 2015 and the single-employer program’s improving financial projections, the Budget directs the Board to raise $15 bil-lion in additional premium revenue within the Budget window only from the multiemployer program. The
Administration believes additional increases in single-employer premiums are unwise at this time and would unnecessarily create further disincentives to maintain-ing defined benefit pension plans. This level of additional multiemployer premium revenue would nearly eliminate the risk of the multiemployer program becoming insol-vent within 20 years.
The Budget assumes that the Board will raise these revenues by using its premium-setting authority to create a variable-rate premium (VRP) and an exit premium in the multiemployer program. A multiemployer VRP would require plans to pay additional premiums based on their level of underfunding—as is done in the single-employer program. An exit premium assessed on employers that withdraw from a plan would compensate PBGC for the additional risk imposed on it when healthy employers exit.
Disaster Insurance
Flood Insurance
The Federal Government provides flood insurance through the National Flood Insurance Program (NFIP), which is administered by the Federal Emergency Management Agency of the Department of Homeland Security (DHS). Flood insurance is available to homeown-ers and businesses in communities that have adopted and enforce appropriate floodplain management measures. Coverage is limited to buildings and their contents. At the end of fiscal year 2015, the program had over 5.1 million policies in more than 22,100 communities with $1.23 tril-lion of insurance in force.
Prior to the creation of the program in 1968, many factors made it cost prohibitive for private insurance com-panies alone to make affordable flood insurance available. In response, the NFIP was established to make insurance coverage widely available, to combine a program of insur-ance with flood mitigation measures to reduce the nation’s risk of loss from flood, and to minimize Federal disaster-assistance expenditures. The NFIP requires participating communities to adopt certain building standards and take other mitigation efforts to reduce flood-related losses, and operates a flood hazard mapping program to quantify geographic variation in the risk of flooding. These efforts have resulted in substantial reductions in the risk of flood-related losses nationwide. However, structures built prior to flood mapping and NFIP floodplain management requirements, which make up 20 percent of the total poli-cies in force, currently pay less than fully actuarial rates and continue to pose relatively high risk.
A major goal of the National Flood Insurance Program is to ensure that property owners are compensated for flood losses through flood insurance, rather than through taxpayer-funded disaster assistance. The agency’s mar-keting strategy aims to increase the number of Americans insured against flood losses and improve retention of poli-cies among existing customers. The strategy includes:

326 ANALYTICAL PERSPECTIVES
1. Providing financial incentives to the private insur-ers that sell and service flood policies for the Federal Government to expand the flood insurance business.
2. Conducting the national marketing and advertising campaign, FloodSmart, which uses TV, radio, print and online advertising, direct mailings, and public relations activities to help overcome denial and re-sistance and increase demand.
3. Fostering lender compliance with flood insurance requirements through training, guidance materials, and regular communication with lending regulators and the lending community.
4. Conducting NFIP training for insurance agents via instructor-led seminars, online training modules, and other vehicles.
5. Seeking opportunities to simplify and clarify NFIP processes and products to make it easier for agents to sell and for consumers to buy.
These strategies resulted in steady policy growth for many years, peaking in 2008 at 5.62 million policies. From 2009-2013, in the aftermath of the economic recession, policy growth stagnated and total policies in effect ranged between 5.55 million and 5.61 million. In fiscal year 2014, when policy premiums were increased in compliance with the Biggert-Waters legislation, policy counts dropped 4.3% to 5.3 million. Additionally, in fiscal year 2015, when a surcharge on all policyholders was introduced in compli-ance with the Homeowner Flood Insurance Affordability Act of 2014 (HFIAA), policy counts dropped an additional 3.8% to 5.1 million.
DHS has a multi-pronged strategy for reducing future flood damage. The NFIP offers flood mitigation assis-tance grants to assist flood victims to rebuild to current building codes, including higher base flood elevations, thereby reducing the likelihood of future flood damage. In particular, flood mitigation assistance grants targeted toward repetitive and severe repetitive loss properties not only help owners of high-risk property, but also reduce the disproportionate drain these properties cause on the National Flood Insurance Fund, through acquisition, relo-cation, or elevation of select properties. DHS is working to ensure that the flood mitigation grant program is closely integrated with other FEMA mitigation grant programs, resulting in better coordination and communication with State and local governments. Further, through the Community Rating System, DHS adjusts premium rates to encourage community and State mitigation activities beyond those required by the NFIP. These efforts, in ad-dition to the minimum NFIP requirements for floodplain management, save over $1 billion annually in avoided flood damages claims.
Due to the catastrophic nature of flooding, with hur-ricanes Katrina and Sandy as notable examples, insured flood damages far exceeded premium revenue in some years and depleted the program’s reserve account. On
those occasions, the NFIP exercises its borrowing author-ity through the Treasury to meet flood insurance claim obligations. While the program needed appropriations in the early 1980s to repay the funds borrowed during the 1970’s, it was able to repay all borrowed funds with inter-est using only premium dollars between 1986 and 2004. In 2005, however, hurricanes Katrina, Rita, and Wilma generated more flood insurance claims than the cumula-tive number of claims paid from 1968 to 2004. Hurricane Sandy in 2012 generated $8.3 billion in flood insurance claims. As a result, the Administration and Congress have increased the borrowing authority for the fund to $30.4 billion. On December 31, 2014, the NFIP repaid $1 billion of outstanding borrowing, reducing the program’s out-standing debt to $23 billion.
The catastrophic nature of the 2005 hurricane sea-son also triggered an examination of the program, and the Administration worked with the Congress to improve the program. On July 6, 2012, the Biggert Waters Flood Insurance Reform Act of 2012 (BW-12) was signed into law. In addition to reauthorizing the NFIP for 5 years, the bill required the NFIP generally to move to full risk-based premium rates and strengthened the NFIP financially and operationally. BW-12 also required FEMA, in con-junction with the National Academy of Sciences (NAS), conduct a study regarding the affordability of the NFIP to policyholders. In 2013, the NFIP began phasing in risk-based premiums for certain properties, as required by the law. In March 2014, HFIAA was signed into law, further reforming the NFIP and revising many sections of BW-12. Notably, HFIAA repealed many of the largest premium increases introduced by BW-12 and required retroactive refunds of collected BW-12 premium increases, introduced a phase-in to higher full-risk premiums for structures newly mapped into the Special Flood Hazard Area, and created a Flood Insurance Advocate.
In 2015, FEMA initiated a Hurricane Sandy NFIP Claims Review Process to ensure that policyholders im-pacted by Hurricane Sandy receive every dollar they are entitled to under their policy. In many cases, the review validates that the original payment was correct. In others, the review indicates that additional payment is warrant-ed. FEMA directed insurance companies to issue checks to those who were determined to have been underpaid af-ter the completion of the claim review. Also in 2015, NAS completed two studies related to NFIP affordability, and FEMA now has 18 months to develop an affordability framework that can inform NFIP reauthorization. The current NFIP authorization ends September 30, 2017.
Crop Insurance
Subsidized Federal crop insurance, administered by USDA’s Risk Management Agency (RMA) on behalf of the Federal Crop Insurance Corporation (FCIC), assists farmers in managing yield and revenue shortfalls due to bad weather or other natural disasters, and is com-monly known as “multi-peril crop insurance” (MPCI). The program is a cooperative partnership between the Federal Government and the private insurance industry. Private insurance companies sell and service crop in-
20. CREDIT AND INSURANCE 327
surance policies. The Federal Government, in turn, pays private companies an administrative and operating ex-pense subsidy to cover expenses associated with selling and servicing these policies. The Federal Government also provides reinsurance on MPCI policies through the Standard Reinsurance Agreement (SRA) and pays compa-nies an “underwriting gain” if they have a profitable year. However, the private companies also rely on commercial reinsurance for premium retained after reinsurance pro-vided by the SRA. For the 2017 Budget, the payments to the companies are projected to be $2.5 billion in com-bined subsidies. The Federal Government also subsidizes premiums for farmers as a way to encourage farmers to participate in the program and purchase higher levels of coverage.
The 2017 Budget includes two proposals that are de-signed to optimize the current crop insurance program so that it will continue to provide a quality safety net at a lower cost:1. Reduce premium subsidy by 10 percentage points
for revenue coverage that includes additional cov-erage for the price at harvest. This would simplify revenue insurance by reducing indemnity payments based on the higher of the market price right before planting or the harvest price. This would, in turn, reduce the potential for “windfall” profits from this additional coverage. Under this coverage, farmers pay an out-of-pocket premium which more closely matches the market price of the coverage purchased. As a result, the number farmers choosing the more expensive coverage for price hedging will decrease. Over 10 years the government will save $16.9 bil-lion, of which 7.6 percent will be from subsidies that the government pays the insurance companies.
2. Reform the prevented planting program by: elimi-nating prevented planting optional +5 and +10 coverage, and requiring a 60 percent transitional yield be applied to the producer’s Actual Production History (APH) for those who receive a prevented planting payment. This is expected to save $1.07 bil-lion over 10 years and improve the accuracy of the prevented planting coverage as well as promote ad-ditional food production.
The most basic type of crop insurance is catastrophic coverage (CAT), which compensates the farmer for losses in excess of 50 percent of the individual’s average yield at 55 percent of the expected market price. The CAT premium is entirely subsidized, and farmers pay only an administrative fee. Higher levels of coverage, called “buy-up,” are also avail-able. A portion of the premium for buy-up coverage is paid by FCIC on behalf of producers and varies by coverage level - generally, the higher the coverage level, the lower the per-cent of premium subsidized. The remaining (unsubsidized) premium amount is owed by the producer and represents an out-of-pocket expense.
For 2015, the 10 principal crops, (barley, corn, cotton, grain sorghum, peanuts, potatoes, rice, soybeans, tobacco, and wheat) accounted for over 80 percent of total liability, and
approximately 86 percent of the total U.S. planted acres of the 10 crops were covered by crop insurance. Producers can purchase both yield and revenue-based insurance products which are underwritten on the basis of a producer’s APH. Revenue insurance programs protect against loss of revenue resulting from low prices, low yields, or a combination of both. Revenue insurance has enhanced traditional yield insurance by adding price as an insurable component. In the current program, the farmer can opt to cover the projected or the harvest price. Traditional revenue insurance only protects against a projected price decline, where the farmer is guar-anteed a price at the time of planting. Revenue coverage that protects against the price at the time of harvest guarantees the price to the farmer for the higher of the projected price or the harvest price. The harvest price protection policies are more costly than traditional revenue coverage and therefore more heavily subsidized by the government. Almost all farm-ers choose the harvest price option because taxpayers pay such a large portion of the extra premium and in some cases, this heavy subsidy results in windfall profits to the farmer.
In addition to price and revenue insurance, FCIC has made available other plans of insurance to provide protec-tion for a variety of crops grown across the United States. For example, “area plans” of insurance offer protection based on a geographic area (most commonly, a county), and do not directly insure an individual farm. Often, the loss trigger is based on an index, such as a rainfall or vegetative index, which is established by a Government entity (for example, NOAA or USGS). One such plan is the pilot Rainfall and Vegetation Index plan, which insures against a decline in an index value covering Pasture, Rangeland, and Forage. These pilot programs meet the needs of livestock producers who purchase insurance for protection from losses of forage pro-duced for grazing or harvested for hay. In 2015, there were 28,779 Rainfall and Vegetation Index policies earning pre-mium, covering about 56 million acres of pasture, rangeland and forage. As of December 2015, there was about $1.2 billion in liability, with $142 million in indemnities paid to livestock producers who purchased coverage.
A crop insurance policy also contains coverage compen-sating farmers when they are prevented from planting their crops due to weather and other perils. When an insured farmer can’t plant the planned crop within the planting time period because of excessive drought or moisture, the farmer may file a prevented planting claim, which pays the farmer a portion of the full coverage level. It is optional for the farmer to plant a second crop on the acreage. If the farmer does, the prevented planting claim on the first crop is reduced and the farmer’s APH is recorded for that year. If the farmer does not plant a second crop, the farmer gets the full prevented planting claim, and the farmer’s APH is held harmless for premium calculation purposes the following year. USDA recently conducted a study to determine if the prevented planting costs were accurately priced for all crops and have considered policy changes for prevented planting based on the study’s findings.
RMA is continuously working to develop new prod-ucts and to expand or improve existing products in order to cover more agricultural commodities. Under section 508(h) of the Federal Crop Insurance Act, RMA may ad-

328 ANALYTICAL PERSPECTIVES
vance payment of up to 50 percent of expected reasonable research and development costs for FCIC Board approved Concept Proposals prior to the complete submission of the policy or plan of insurance. Numerous private products have been approved through the 508(h) authority, in-cluding Downed Rice Endorsement, Machine Harvested Cucumbers, APH Olive, Camelina, Pulse Crop Revenue, Fresh Market Beans, and Louisiana Sweet Potato.
Last, the Agricultural Act of 2014 (2014 Farm Bill) ex-panded FCIC’s authority to approve products developed under the 508(h) process, authorized new plans, and man-dated specific research and development priorities. For example, in 2015 RMA implemented the Supplemental Coverage Option for major crops and the Stacked Risk Income Protection for upland cotton. These “area” plans were mandated by the 2014 Farm Bill and supplement an underlying MPCI policy. In addition, in 2015 FCIC ap-proved and implemented a Peanut Revenue plan and a Whole Farm Revenue Protection plan, which were also mandated by the 2014 Farm Bill. RMA also implement-ed the APH Yield Exclusion option in 2015. Additional Research and Development priorities mandated by the 2014 Farm Bill included biomass and sweet sorghum energy insurance, catastrophic programs for swine and poultry, margin coverage for catfish, and insurance for organic crops. In some instances RMA contracts with qualified entities to develop feasibility studies or develop the products.
For more information and additional crop insurance program details, please reference RMA’s web site (www.rma.usda.gov).
Insurance against Security-Related Risks
Terrorism Risk Insurance
The Terrorism Risk Insurance Program (TRIP) was authorized under P.L. 107-297 to help ensure the continued availability of property and casualty insurance following the terrorist attacks of September 11, 2001. TRIP’s initial three-year authorization enabled the Federal Government to establish a system of shared public and private compensation for insured property and casualty losses arising from certified acts of foreign terrorism. In 2005, Congress passed a two-year extension (P.L. 109-144), which narrowed the Government’s role by increasing the private sector’s share of losses, reduc-ing lines of insurance covered by the program, and adding a threshold event amount triggering Federal payments.
In 2007, Congress enacted a further seven-year extension of TRIP and expanded the program to include losses from do-mestic as well as foreign acts of terrorism (P.L. 110-318). For all seven extension years, TRIP maintained a private insurer
deductible of 20 percent of the prior year’s direct earned pre-miums, an insurer co-payment of 15 percent of insured losses of up to $100 billion above the deductible, and a $100 million minimum event cost triggering Federal coverage. The 2007 extension also required Treasury to recoup 133 percent of all Federal payments made under the program up to $27.5 bil-lion, and accelerated deadlines for recoupment of any Federal payments made before September 30, 2017.
In January 2015, Congress passed the Terrorism Risk Insurance Extension Act of 2015 (P.L. 114–1), which ex-tended TRIP for six more years, through December 31, 2020 and made several program changes to further reduce Federal liability. Over the first five extension years, the loss threshold that triggers Federal assistance will be in-creased by $20 million each year to $200 million in 2019, and the Government’s share of losses above the deductible will decrease from 85 to 80 percent over the same period. The 2015 extension also requires Treasury to recoup 140 percent of all Federal payments made under the program up to a mandatory recoupment amount which increases by $2 billion each year until 2019 when the threshold will be set at $37.5 billion. Effective January 1, 2020, the man-datory recoupment amount will be indexed to a running three-year average of the aggregate insurer deductible of 20 percent of direct-earned premiums. These programmatic reforms will facilitate, over the longer term, full transition of the program to the private sector. The Budget baseline includes the estimated Federal cost of providing terrorism risk insurance, reflecting the 2015 TRIA extension. Using market data synthesized through a proprietary model, the Budget projects annual outlays and recoupment for TRIP. While the Budget does not forecast any specific triggering events, the Budget includes estimates representing the weighted average of TRIP payments over a full range of possible scenarios, most of which include no notional ter-rorist attacks (and therefore no TRIP payments), and some of which include notional terrorist attacks of varying mag-nitudes. On this basis, the Budget projects net spending of $1.4 billion over the 2017–2021 period and $1.2 billion over the 2017–2026 period.
Aviation War Risk Insurance
In December 2014, Congress sunset the premium avia-tion war risk insurance program, thereby sending U.S. air carriers back to the commercial aviation insurance market for all of their war risk insurance coverage. The non-premium program is authorized through December 31, 2018. It provides aviation insurance coverage for aircraft used in connection with certain Government con-tract operations by a Department or Agency that agrees to indemnify the Secretary of Transportation for any loss-es covered by the insurance.
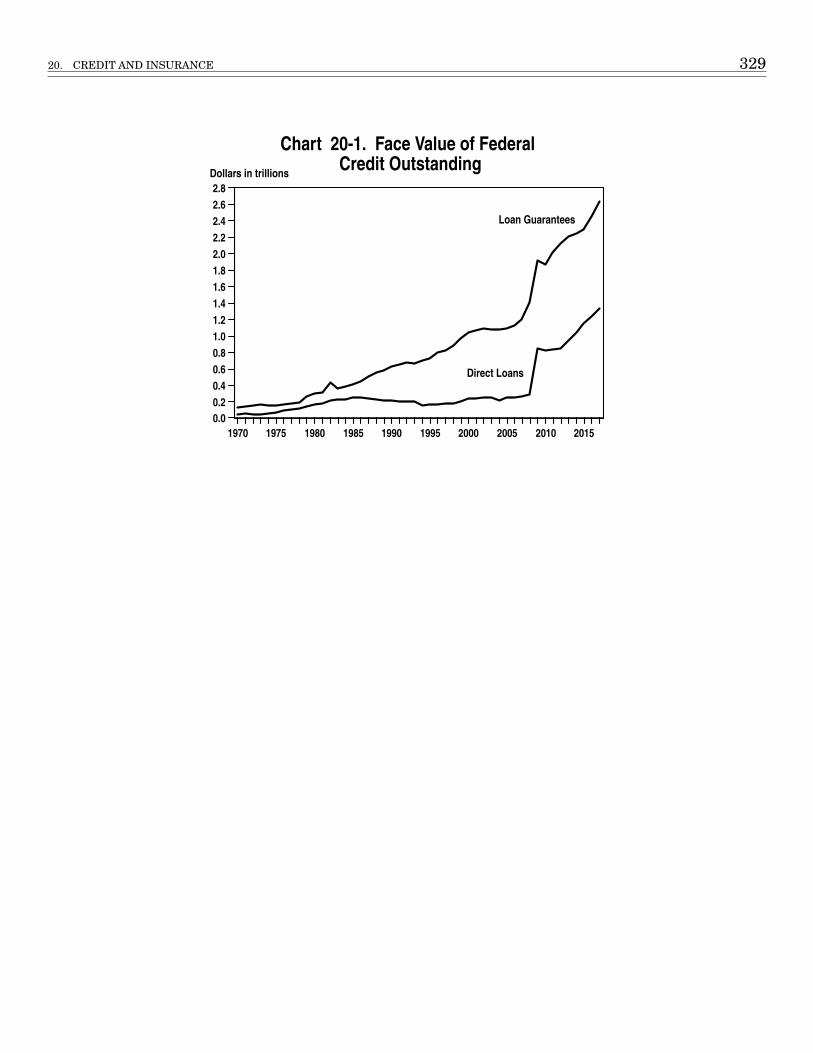
20. CREDIT AND INSURANCE 329
1970 1975 1980 1985 1990 1995 2000 2005 2010 20150.00.20.40.60.81.01.21.41.61.82.02.22.42.62.8
Direct Loans
Loan Guarantees
Dollars in trillions
Chart 20-1. Face Value of Federal Credit Outstanding

330 ANALYTICAL PERSPECTIVES
Table 20–2. ESTIMATED FUTURE COST OF OUTSTANDING DIRECT LOANS AND LOAN GUARANTEES(In billions of dollars)
Program Outstanding 2014
Estimated Future Costs
of 2014 Outstanding 1
Outstanding 2015
Estimated Future Costs
of 2015 Outstanding 1
Direct Loans: 2
Federal Student Loans ................................................................................................................................................ 734 –37 839 –26Education Temporary Student Loan Purchase Authority ............................................................................................. 84 –13 77 –12Rural Utilities Service and Rural Telephone Bank ....................................................................................................... 56 2 52 2Farm Service Agency, Rural Development, Rural Housing ......................................................................................... 54 6 55 6Export-Import Bank ..................................................................................................................................................... 22 3 23 2Advance Technology Vehicle Manufacturing, Title 17 Loans ....................................................................................... 15 2 16 2Housing and Urban Development ................................................................................................................................ 14 8 19 11State Housing Finance Authority Direct Loans ............................................................................................................ 9 1 8 1Transportation Infrastructure Finance and Innovation Act Loans ................................................................................ 9 * 11 *Disaster Assistance ..................................................................................................................................................... 7 1 6 1International Assistance .............................................................................................................................................. 5 1 3 1Public Law 480 ............................................................................................................................................................ 4 2 3 2Troubled Asset Relief Program (TARP) 3 ..................................................................................................................... 3 1 1 *Small Business Lending Fund (SBLF) 3 ....................................................................................................................... 3 * 2 *Other direct loan programs 3 ........................................................................................................................................ 27 9 29 8
Total direct loans ..................................................................................................................................................... 1,046 –15 1,145 –2
Guaranteed Loans: 2
FHA Mutual Mortgage Insurance Fund ....................................................................................................................... 1,132 25 1,123 10Department of Veterans Affairs (VA) Mortgages .......................................................................................................... 398 9 462 10Federal Student Loan Guarantees .............................................................................................................................. 242 * 220 *FHA General and Special Risk Insurance Fund .......................................................................................................... 153 9 149 6Farm Service Agency, Rural Development, Rural Housing ......................................................................................... 124 5 134 6Small Business Administration (SBA) Business Loan Guarantees 4 ........................................................................... 99 2 106 2Export-Import Bank ..................................................................................................................................................... 63 2 62 2International Assistance ............................................................................................................................................. 24 2 24 2Commodity Credit Corporation Export Loan Guarantees ............................................................................................ 4 * 3 *Title 17 Loan Guarantees ............................................................................................................................................ 3 * 3 *Government National Mortgage Association (GNMA) 4 ............................................................................................... ......... * ......... *Other guaranteed loan programs 3 .............................................................................................................................. 11 1 13 1
Total guaranteed loans ........................................................................................................................................... 2,253 55 2,300 38Total Federal credit .......................................................................................................................................... 3,299 40 3,445 36
* $500 million or less.1 Future costs represent balance sheet estimates of allowance for subsidy cost, liabilities for loan guarantees, and estimated uncollectible principal and interest. 2 Excludes loans and guarantees by deposit insurance agencies and programs not included under credit reform, such as Tennessee Valley Authority loan guarantees. Defaulted
guaranteed loans that result in loans receivable are included in direct loan amounts.3 As authorized by the statute, table includes TARP and SBLF equity purchases, and International Monetary Fund (IMF) transactions resulting from the 2009 Supplemental
Appropriations Act. Future costs for TARP and IMF transactions are calculated using the discount rate required by the Federal Credit Reform Act adjusted for market risks, as directed in legislation. IMF activity is accounted for on a present value basis beginning in FY 2016 as directed by P. L. 114-113 Consolidated Appropriations Act, 2016. IMF activity will no longer be reflected in this table as of the end of FY 2015.
4 To avoid double-counting, outstandings for GNMA and SBA secondary market guarantees, and TARP FHA Letter of Credit program are excluded from the totals.
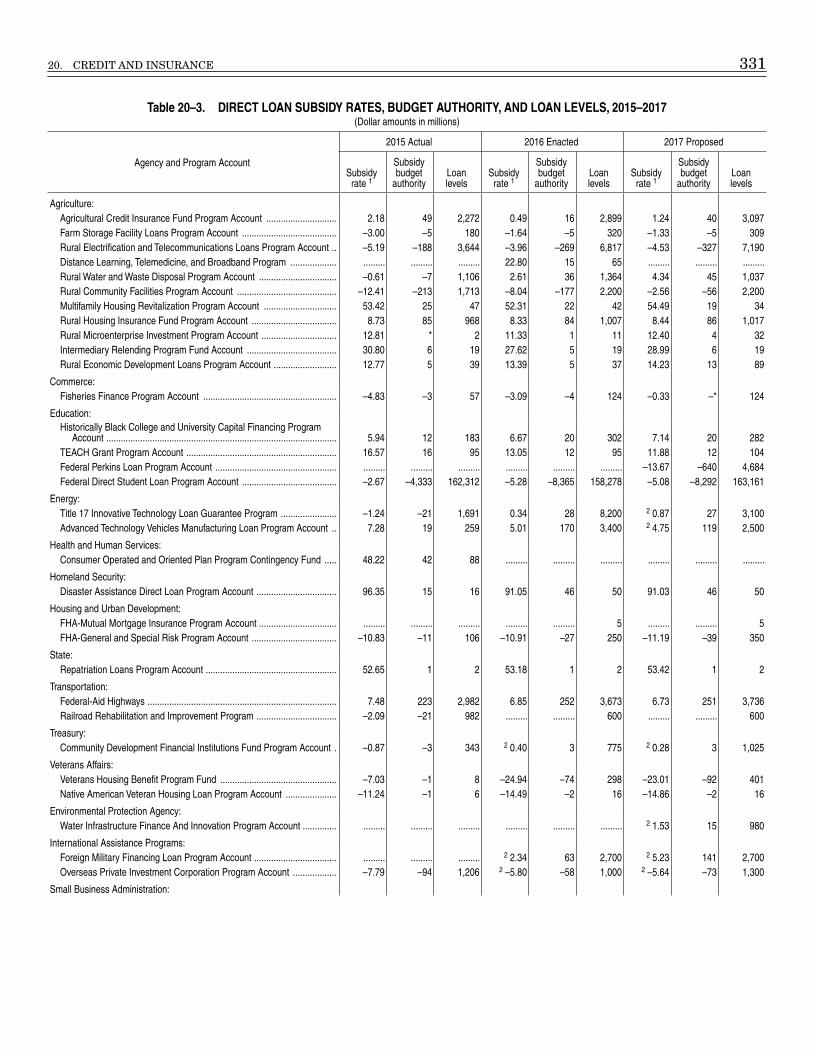
20. CREDIT AND INSURANCE 331
Table 20–3. DIRECT LOAN SUBSIDY RATES, BUDGET AUTHORITY, AND LOAN LEVELS, 2015–2017(Dollar amounts in millions)
Agency and Program Account
2015 Actual 2016 Enacted 2017 Proposed
Subsidy rate 1
Subsidy budget
authorityLoan levels
Subsidy rate 1
Subsidy budget
authorityLoan levels
Subsidy rate 1
Subsidy budget
authorityLoan levels
Agriculture:Agricultural Credit Insurance Fund Program Account ............................. 2.18 49 2,272 0.49 16 2,899 1.24 40 3,097Farm Storage Facility Loans Program Account ....................................... –3.00 –5 180 –1.64 –5 320 –1.33 –5 309Rural Electrification and Telecommunications Loans Program Account .. –5.19 –188 3,644 –3.96 –269 6,817 –4.53 –327 7,190Distance Learning, Telemedicine, and Broadband Program ................... ......... ......... ......... 22.80 15 65 ......... ......... .........Rural Water and Waste Disposal Program Account ................................ –0.61 –7 1,106 2.61 36 1,364 4.34 45 1,037Rural Community Facilities Program Account ......................................... –12.41 –213 1,713 –8.04 –177 2,200 –2.56 –56 2,200Multifamily Housing Revitalization Program Account .............................. 53.42 25 47 52.31 22 42 54.49 19 34Rural Housing Insurance Fund Program Account ................................... 8.73 85 968 8.33 84 1,007 8.44 86 1,017Rural Microenterprise Investment Program Account ............................... 12.81 * 2 11.33 1 11 12.40 4 32Intermediary Relending Program Fund Account ..................................... 30.80 6 19 27.62 5 19 28.99 6 19Rural Economic Development Loans Program Account .......................... 12.77 5 39 13.39 5 37 14.23 13 89
Commerce:Fisheries Finance Program Account ....................................................... –4.83 –3 57 –3.09 –4 124 –0.33 –* 124
Education:Historically Black College and University Capital Financing Program
Account ............................................................................................... 5.94 12 183 6.67 20 302 7.14 20 282TEACH Grant Program Account .............................................................. 16.57 16 95 13.05 12 95 11.88 12 104Federal Perkins Loan Program Account .................................................. ......... ......... ......... ......... ......... ......... –13.67 –640 4,684Federal Direct Student Loan Program Account ....................................... –2.67 –4,333 162,312 –5.28 –8,365 158,278 –5.08 –8,292 163,161
Energy:Title 17 Innovative Technology Loan Guarantee Program ....................... –1.24 –21 1,691 0.34 28 8,200 2 0.87 27 3,100Advanced Technology Vehicles Manufacturing Loan Program Account .. 7.28 19 259 5.01 170 3,400 2 4.75 119 2,500
Health and Human Services:Consumer Operated and Oriented Plan Program Contingency Fund ..... 48.22 42 88 ......... ......... ......... ......... ......... .........
Homeland Security:Disaster Assistance Direct Loan Program Account ................................. 96.35 15 16 91.05 46 50 91.03 46 50
Housing and Urban Development:FHA-Mutual Mortgage Insurance Program Account ................................ ......... ......... ......... ......... ......... 5 ......... ......... 5FHA-General and Special Risk Program Account ................................... –10.83 –11 106 –10.91 –27 250 –11.19 –39 350
State:Repatriation Loans Program Account ...................................................... 52.65 1 2 53.18 1 2 53.42 1 2
Transportation:Federal-Aid Highways .............................................................................. 7.48 223 2,982 6.85 252 3,673 6.73 251 3,736Railroad Rehabilitation and Improvement Program ................................. –2.09 –21 982 ......... ......... 600 ......... ......... 600
Treasury:Community Development Financial Institutions Fund Program Account . –0.87 –3 343 2 0.40 3 775 2 0.28 3 1,025
Veterans Affairs:Veterans Housing Benefit Program Fund ................................................ –7.03 –1 8 –24.94 –74 298 –23.01 –92 401Native American Veteran Housing Loan Program Account ..................... –11.24 –1 6 –14.49 –2 16 –14.86 –2 16
Environmental Protection Agency:Water Infrastructure Finance And Innovation Program Account .............. ......... ......... ......... ......... ......... ......... 2 1.53 15 980
International Assistance Programs:Foreign Military Financing Loan Program Account .................................. ......... ......... ......... 2 2.34 63 2,700 2 5.23 141 2,700Overseas Private Investment Corporation Program Account .................. –7.79 –94 1,206 2 –5.80 –58 1,000 2 –5.64 –73 1,300
Small Business Administration:
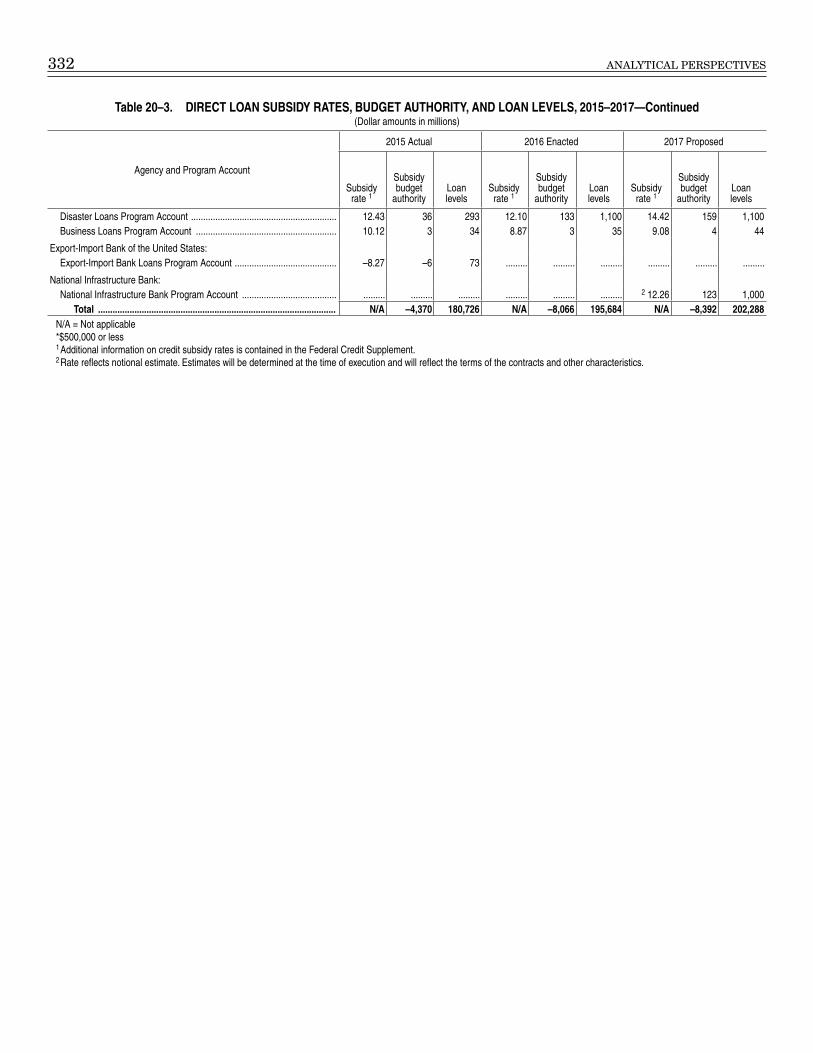
332 ANALYTICAL PERSPECTIVES
Table 20–3. DIRECT LOAN SUBSIDY RATES, BUDGET AUTHORITY, AND LOAN LEVELS, 2015–2017—Continued(Dollar amounts in millions)
Agency and Program Account
2015 Actual 2016 Enacted 2017 Proposed
Subsidy rate 1
Subsidy budget
authorityLoan levels
Subsidy rate 1
Subsidy budget
authorityLoan levels
Subsidy rate 1
Subsidy budget
authorityLoan levels
Disaster Loans Program Account ............................................................ 12.43 36 293 12.10 133 1,100 14.42 159 1,100Business Loans Program Account .......................................................... 10.12 3 34 8.87 3 35 9.08 4 44
Export-Import Bank of the United States:Export-Import Bank Loans Program Account .......................................... –8.27 –6 73 ......... ......... ......... ......... ......... .........
National Infrastructure Bank:National Infrastructure Bank Program Account ....................................... ......... ......... ......... ......... ......... ......... 2 12.26 123 1,000
Total .................................................................................................. N/A –4,370 180,726 N/A –8,066 195,684 N/A –8,392 202,288N/A = Not applicable*$500,000 or less1 Additional information on credit subsidy rates is contained in the Federal Credit Supplement.2 Rate reflects notional estimate. Estimates will be determined at the time of execution and will reflect the terms of the contracts and other characteristics.
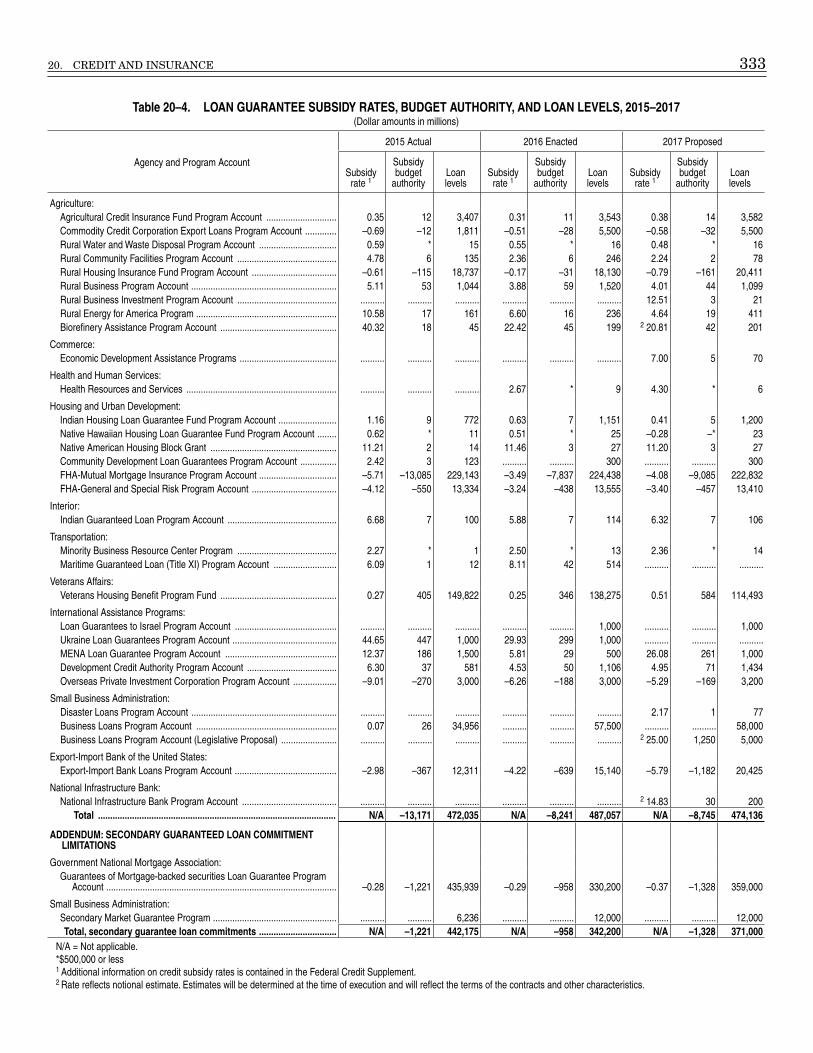
20. CREDIT AND INSURANCE 333
Table 20–4. LOAN GUARANTEE SUBSIDY RATES, BUDGET AUTHORITY, AND LOAN LEVELS, 2015–2017(Dollar amounts in millions)
Agency and Program Account
2015 Actual 2016 Enacted 2017 Proposed
Subsidy rate 1
Subsidy budget
authorityLoan levels
Subsidy rate 1
Subsidy budget
authorityLoan levels
Subsidy rate 1
Subsidy budget
authorityLoan levels
Agriculture:Agricultural Credit Insurance Fund Program Account ............................. 0.35 12 3,407 0.31 11 3,543 0.38 14 3,582Commodity Credit Corporation Export Loans Program Account ............. –0.69 –12 1,811 –0.51 –28 5,500 –0.58 –32 5,500Rural Water and Waste Disposal Program Account ................................ 0.59 * 15 0.55 * 16 0.48 * 16Rural Community Facilities Program Account ......................................... 4.78 6 135 2.36 6 246 2.24 2 78Rural Housing Insurance Fund Program Account ................................... –0.61 –115 18,737 –0.17 –31 18,130 –0.79 –161 20,411Rural Business Program Account ............................................................ 5.11 53 1,044 3.88 59 1,520 4.01 44 1,099Rural Business Investment Program Account ......................................... .......... .......... .......... .......... .......... .......... 12.51 3 21Rural Energy for America Program .......................................................... 10.58 17 161 6.60 16 236 4.64 19 411Biorefinery Assistance Program Account ................................................ 40.32 18 45 22.42 45 199 2 20.81 42 201
Commerce:Economic Development Assistance Programs ........................................ .......... .......... .......... .......... .......... .......... 7.00 5 70
Health and Human Services:Health Resources and Services .............................................................. .......... .......... .......... 2.67 * 9 4.30 * 6
Housing and Urban Development:Indian Housing Loan Guarantee Fund Program Account ........................ 1.16 9 772 0.63 7 1,151 0.41 5 1,200Native Hawaiian Housing Loan Guarantee Fund Program Account ........ 0.62 * 11 0.51 * 25 –0.28 –* 23Native American Housing Block Grant .................................................... 11.21 2 14 11.46 3 27 11.20 3 27Community Development Loan Guarantees Program Account ............... 2.42 3 123 .......... .......... 300 .......... .......... 300FHA-Mutual Mortgage Insurance Program Account ................................ –5.71 –13,085 229,143 –3.49 –7,837 224,438 –4.08 –9,085 222,832FHA-General and Special Risk Program Account ................................... –4.12 –550 13,334 –3.24 –438 13,555 –3.40 –457 13,410
Interior:Indian Guaranteed Loan Program Account ............................................. 6.68 7 100 5.88 7 114 6.32 7 106
Transportation:Minority Business Resource Center Program ......................................... 2.27 * 1 2.50 * 13 2.36 * 14Maritime Guaranteed Loan (Title XI) Program Account .......................... 6.09 1 12 8.11 42 514 .......... .......... ..........
Veterans Affairs:Veterans Housing Benefit Program Fund ................................................ 0.27 405 149,822 0.25 346 138,275 0.51 584 114,493
International Assistance Programs:Loan Guarantees to Israel Program Account .......................................... .......... .......... .......... .......... .......... 1,000 .......... .......... 1,000Ukraine Loan Guarantees Program Account ........................................... 44.65 447 1,000 29.93 299 1,000 .......... .......... ..........MENA Loan Guarantee Program Account .............................................. 12.37 186 1,500 5.81 29 500 26.08 261 1,000Development Credit Authority Program Account ..................................... 6.30 37 581 4.53 50 1,106 4.95 71 1,434Overseas Private Investment Corporation Program Account .................. –9.01 –270 3,000 –6.26 –188 3,000 –5.29 –169 3,200
Small Business Administration:Disaster Loans Program Account ............................................................ .......... .......... .......... .......... .......... .......... 2.17 1 77Business Loans Program Account .......................................................... 0.07 26 34,956 .......... .......... 57,500 .......... .......... 58,000Business Loans Program Account (Legislative Proposal) ....................... .......... .......... .......... .......... .......... .......... 2 25.00 1,250 5,000
Export-Import Bank of the United States:Export-Import Bank Loans Program Account .......................................... –2.98 –367 12,311 –4.22 –639 15,140 –5.79 –1,182 20,425
National Infrastructure Bank:National Infrastructure Bank Program Account ....................................... .......... .......... .......... .......... .......... .......... 2 14.83 30 200
Total .................................................................................................. N/A –13,171 472,035 N/A –8,241 487,057 N/A –8,745 474,136
ADDENDUM: SECONDARY GUARANTEED LOAN COMMITMENT LIMITATIONS
Government National Mortgage Association:Guarantees of Mortgage-backed securities Loan Guarantee Program
Account ............................................................................................... –0.28 –1,221 435,939 –0.29 –958 330,200 –0.37 –1,328 359,000
Small Business Administration:Secondary Market Guarantee Program ................................................... .......... .......... 6,236 .......... .......... 12,000 .......... .......... 12,000 Total, secondary guarantee loan commitments ................................ N/A –1,221 442,175 N/A –958 342,200 N/A –1,328 371,000
N/A = Not applicable.*$500,000 or less1 Additional information on credit subsidy rates is contained in the Federal Credit Supplement.2 Rate reflects notional estimate. Estimates will be determined at the time of execution and will reflect the terms of the contracts and other characteristics.
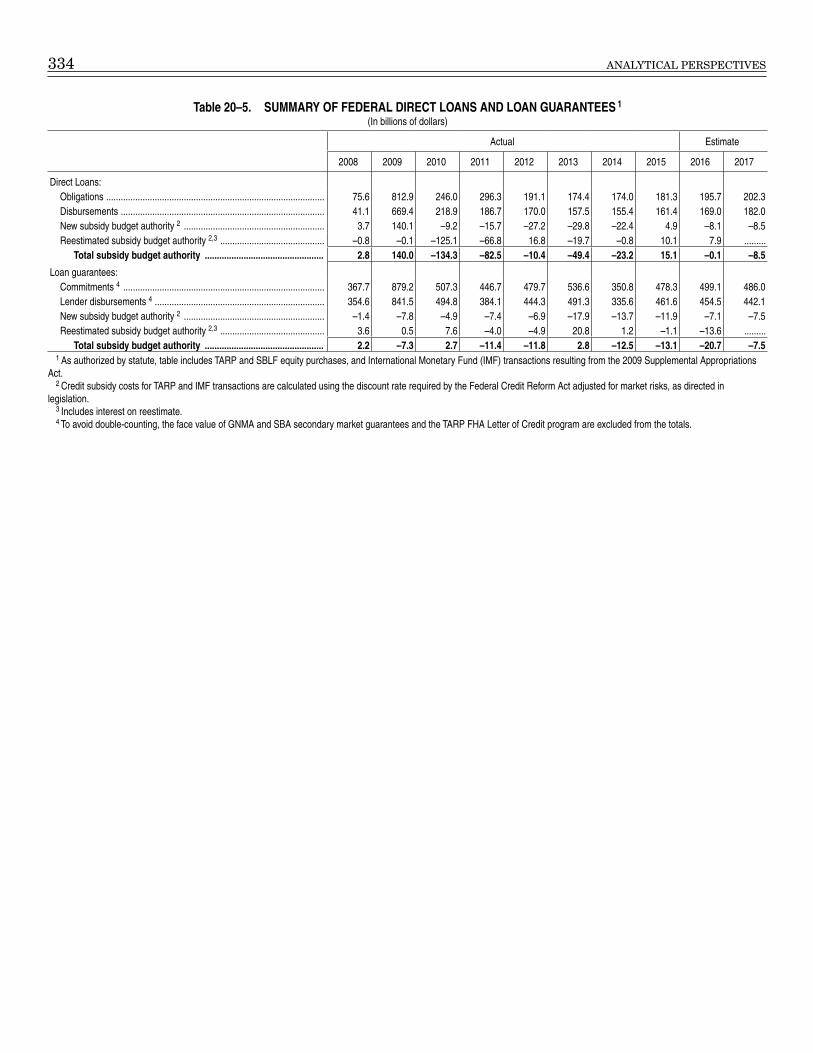
334 ANALYTICAL PERSPECTIVES
Table 20–5. SUMMARY OF FEDERAL DIRECT LOANS AND LOAN GUARANTEES 1 (In billions of dollars)
Actual Estimate
2008 2009 2010 2011 2012 2013 2014 2015 2016 2017
Direct Loans: Obligations .......................................................................................... 75.6 812.9 246.0 296.3 191.1 174.4 174.0 181.3 195.7 202.3Disbursements .................................................................................... 41.1 669.4 218.9 186.7 170.0 157.5 155.4 161.4 169.0 182.0New subsidy budget authority 2 .......................................................... 3.7 140.1 –9.2 –15.7 –27.2 –29.8 –22.4 4.9 –8.1 –8.5Reestimated subsidy budget authority 2,3 ........................................... –0.8 –0.1 –125.1 –66.8 16.8 –19.7 –0.8 10.1 7.9 .........
Total subsidy budget authority ................................................. 2.8 140.0 –134.3 –82.5 –10.4 –49.4 –23.2 15.1 –0.1 –8.5
Loan guarantees: Commitments 4 ................................................................................... 367.7 879.2 507.3 446.7 479.7 536.6 350.8 478.3 499.1 486.0Lender disbursements 4 ...................................................................... 354.6 841.5 494.8 384.1 444.3 491.3 335.6 461.6 454.5 442.1New subsidy budget authority 2 .......................................................... –1.4 –7.8 –4.9 –7.4 –6.9 –17.9 –13.7 –11.9 –7.1 –7.5Reestimated subsidy budget authority 2,3 ........................................... 3.6 0.5 7.6 –4.0 –4.9 20.8 1.2 –1.1 –13.6 .........
Total subsidy budget authority ................................................. 2.2 –7.3 2.7 –11.4 –11.8 2.8 –12.5 –13.1 –20.7 –7.51 As authorized by statute, table includes TARP and SBLF equity purchases, and International Monetary Fund (IMF) transactions resulting from the 2009 Supplemental Appropriations
Act.2 Credit subsidy costs for TARP and IMF transactions are calculated using the discount rate required by the Federal Credit Reform Act adjusted for market risks, as directed in
legislation.3 Includes interest on reestimate.4 To avoid double-counting, the face value of GNMA and SBA secondary market guarantees and the TARP FHA Letter of Credit program are excluded from the totals.