2 toxicology
TRANSCRIPT

8/10/2019 2 Toxicology
http://slidepdf.com/reader/full/2-toxicology 1/29
MKH 1313 - Industrial Hygiene
AA, UTM, 2011 Page
Topic 2
Toxicology
1
Toxicology Industrial Hygiene
Toxicology
– A qualitative and quantitative study of the adverse
effects of toxicants on biological organism.
Industrial Hygiene
–Industrial hygiene is the science of anticipating, recognizing,evaluating, and controlling workplace conditions that may
cause workers' injury or illness.
8/10/2019 2 Toxicology
http://slidepdf.com/reader/full/2-toxicology 2/29
MKH 1313 - Industrial Hygiene
AA, UTM, 2011 Page
Definition
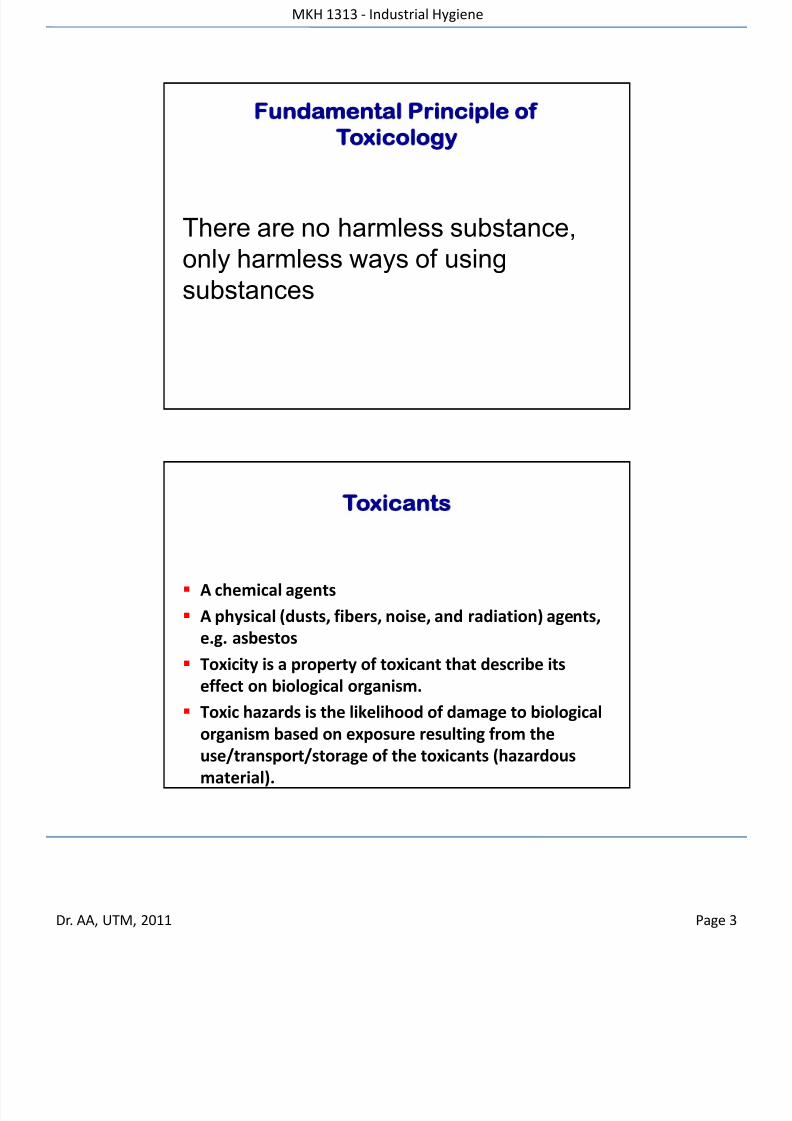
Toxicology
The way toxicants enter biological
organism
The way toxicants are eliminated from
biological organism
The effect of toxicants on biologicalorganism
8/10/2019 2 Toxicology
http://slidepdf.com/reader/full/2-toxicology 3/29
MKH 1313 - Industrial Hygiene
AA, UTM, 2011 Page
Fundamental Principle of
Toxicology
There are no harmless substance,
only harmless ways of using
substances
Toxicants
A chemical agents
A physical (dusts, fibers, noise, and radiation) agents,
e.g. asbestos
Toxicity is a property of toxicant that describe its
effect on biological organism.
Toxic hazards is the likelihood of damage to biological
organism based on exposure resulting from the
use/transport/storage of the toxicants (hazardous
material).
8/10/2019 2 Toxicology
http://slidepdf.com/reader/full/2-toxicology 4/29
MKH 1313 - Industrial Hygiene
AA, UTM, 2011 Page
7
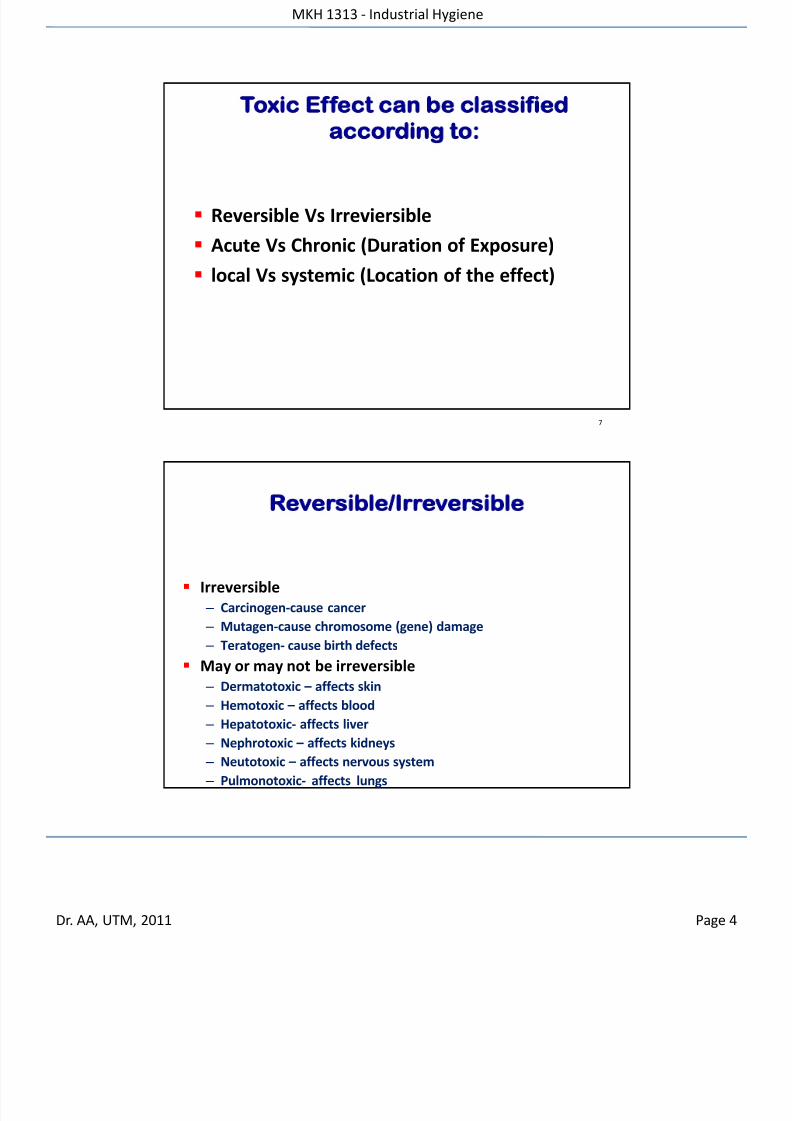
Toxic Effect can be classified
according to:
Reversible Vs Irreviersible
Acute Vs Chronic (Duration of Exposure)
local Vs systemic (Location of the effect)
Reversible/Irreversible
Irreversible
– Carcinogen-cause cancer
– Mutagen-cause chromosome (gene) damage
– Teratogen- cause birth defects
May or may not be irreversible
– Dermatotoxic – affects skin
–Hemotoxic – affects blood
– Hepatotoxic- affects liver
– Nephrotoxic – affects kidneys
– Neutotoxic – affects nervous system
– Pulmonotoxic- affects lungs

8/10/2019 2 Toxicology
http://slidepdf.com/reader/full/2-toxicology 5/29
MKH 1313 - Industrial Hygiene
AA, UTM, 2011 Page
9
Acute / Chronic
Acute exposure
– High Dosage (e.g. due to accidental release
– The effect is immediate
Chronic Exposure
– Normally lower dose
– The effect only noticed/detected following long
exposure – Sometimes, the worker could not recall the
exposure.
Local/Systemic
Local
Damage to the part of the body that comes in contact with
the substance.
Systemic
Chemical is absorbed by the body and attacks a target
organ.
8/10/2019 2 Toxicology
http://slidepdf.com/reader/full/2-toxicology 6/29
MKH 1313 - Industrial Hygiene
AA, UTM, 2011 Page
11
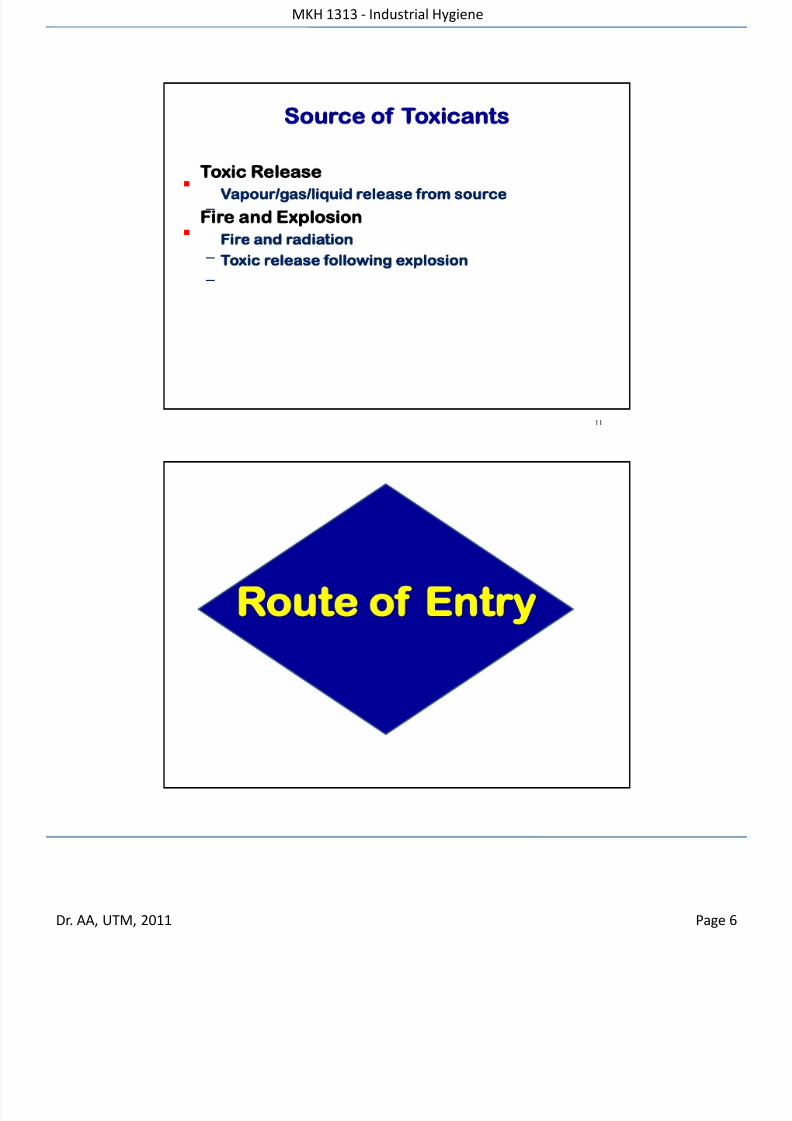
Source of Toxicants
Toxic Release
–Vapour/gas/liquid release from source
Fire and Explosion
–Fire and radiation
– Toxic release following explosion
Route of Entry

8/10/2019 2 Toxicology
http://slidepdf.com/reader/full/2-toxicology 7/29
MKH 1313 - Industrial Hygiene
AA, UTM, 2011 Page
Route of Entry
Injection: through cuts or hypodermic needles into theskin, usually cause highest blood level concentration.
Inhalation: through mouth/nose into the lungs(respiratory system), 2nd highest blood levelconcentration.
Ingestion: through mouth into stomach andgastrointestinal tract, 2nd lowest in blood levelconcentration.
Dermal (Skin) absorption: through skin membrane, lowestin blood level concentration, note: absorption of phenolcould result in death
14
Inhalation mouth, nose ventilation, hoods,
protection equipment
Injection cuts in skin protective clothing
Dermal Absorption skin protective clothing
Ingestion mouth, stomach rules on eating, drinking,
smoking
ROUTE ENTRY CONTROL
*
*
* industrially most significant
Route of Entry for Toxicants
8/10/2019 2 Toxicology
http://slidepdf.com/reader/full/2-toxicology 8/29
MKH 1313 - Industrial Hygiene
AA, UTM, 2011 Page
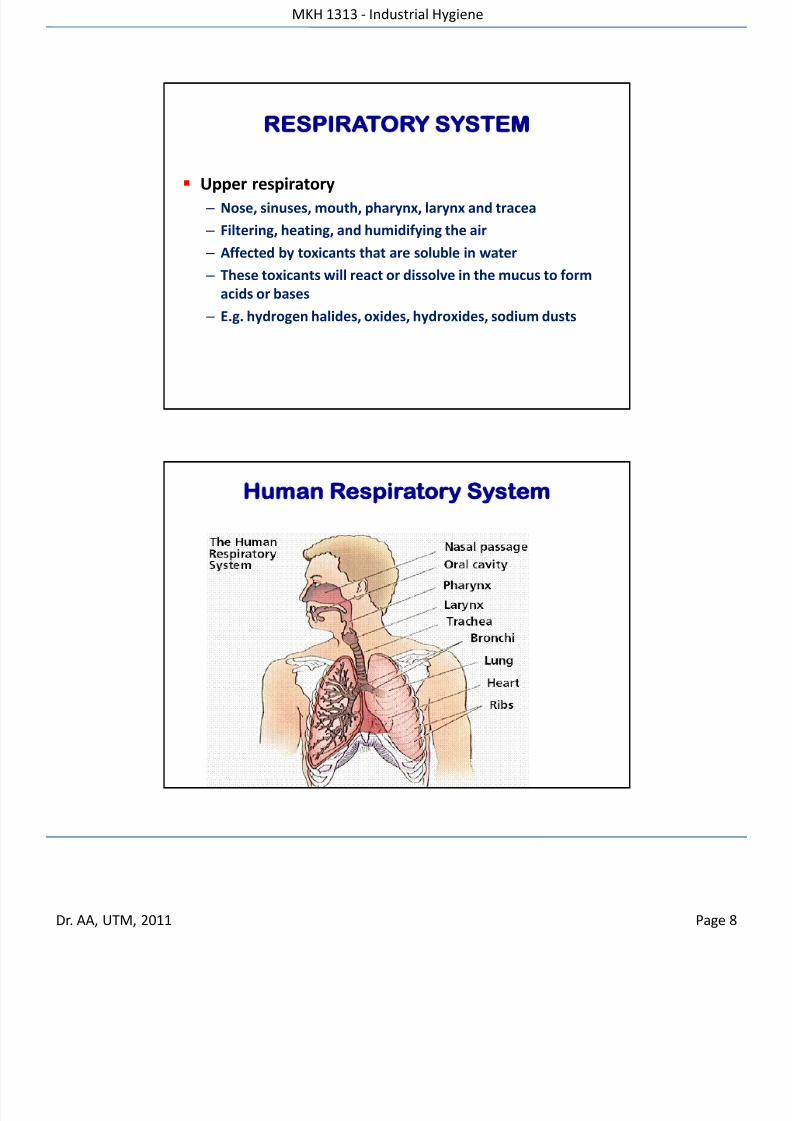
RESPIRATORY SYSTEM
Upper respiratory
– Nose, sinuses, mouth, pharynx, larynx and tracea
– Filtering, heating, and humidifying the air
– Affected by toxicants that are soluble in water
– These toxicants will react or dissolve in the mucus to form
acids or bases
– E.g. hydrogen halides, oxides, hydroxides, sodium dusts
Human Respiratory System
8/10/2019 2 Toxicology
http://slidepdf.com/reader/full/2-toxicology 9/29
MKH 1313 - Industrial Hygiene
AA, UTM, 2011 Page
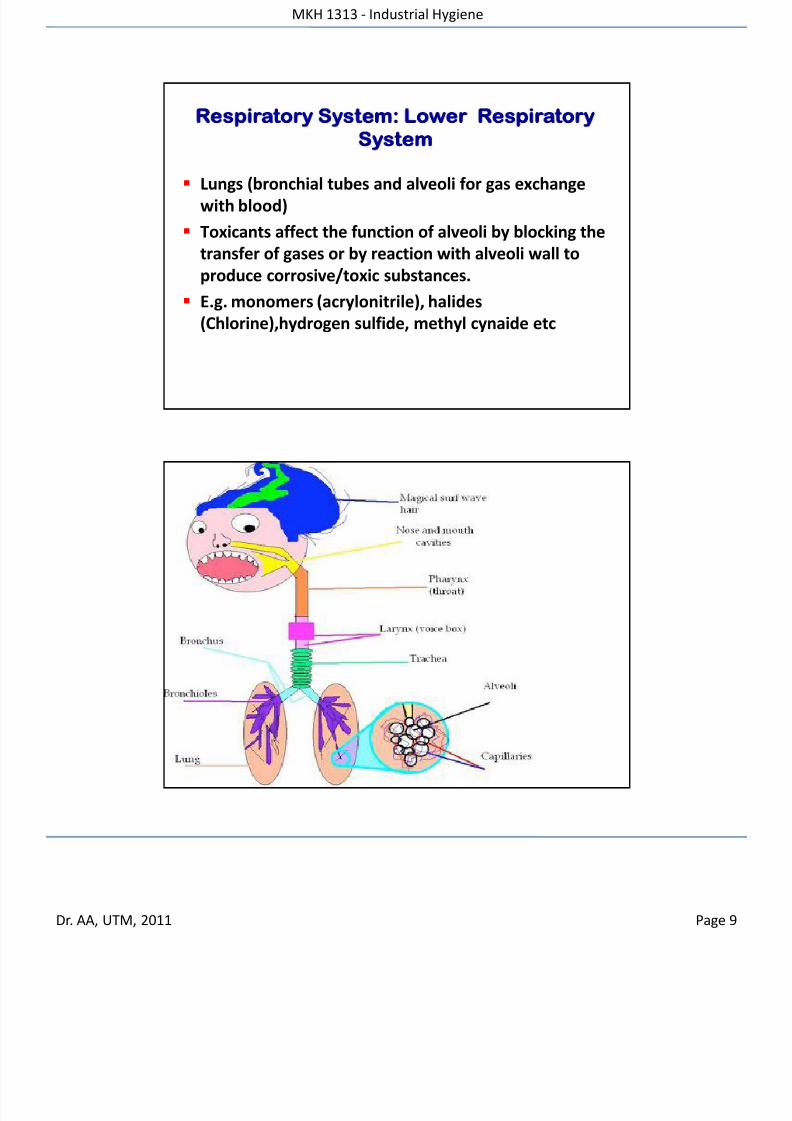
Respiratory System: Lower Respiratory
System
Lungs (bronchial tubes and alveoli for gas exchange
with blood)
Toxicants affect the function of alveoli by blocking the
transfer of gases or by reaction with alveoli wall to
produce corrosive/toxic substances.
E.g. monomers (acrylonitrile), halides
(Chlorine),hydrogen sulfide, methyl cynaide etc
8/10/2019 2 Toxicology
http://slidepdf.com/reader/full/2-toxicology 10/29
MKH 1313 - Industrial Hygiene
AA, UTM, 2011 Page
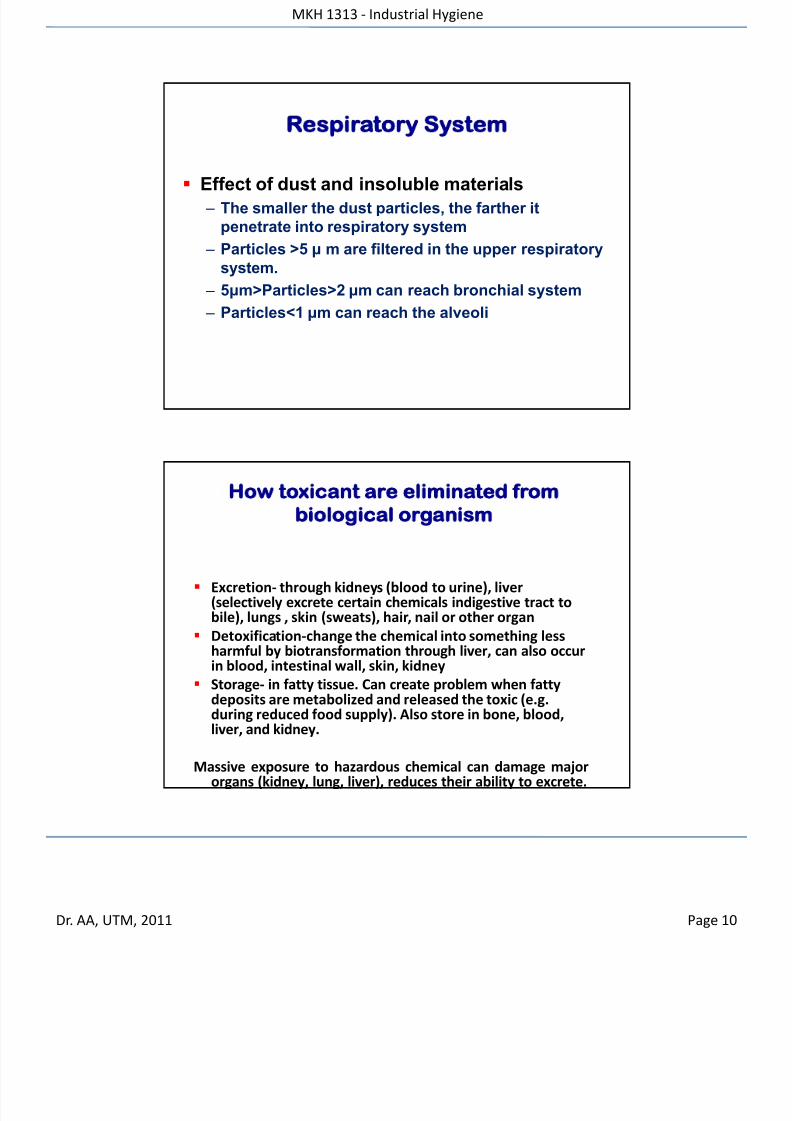
Respiratory System
Effect of dust and insoluble materials
– The smaller the dust particles, the farther it
penetrate into respiratory system
– Particles >5 μ m are filtered in the upper respiratory
system.
– 5μm>Particles>2 μm can reach bronchial system
– Particles<1 μm can reach the alveoli
How toxicant are eliminated from
biological organism
Excretion- through kidneys (blood to urine), liver(selectively excrete certain chemicals indigestive tract tobile), lungs , skin (sweats), hair, nail or other organ
Detoxification-change the chemical into something lessharmful by biotransformation through liver, can also occurin blood, intestinal wall, skin, kidney
Storage- in fatty tissue. Can create problem when fatty
deposits are metabolized and released the toxic (e.g.during reduced food supply). Also store in bone, blood,liver, and kidney.
Massive exposure to hazardous chemical can damage majororgans (kidney, lung, liver), reduces their ability to excrete.

8/10/2019 2 Toxicology
http://slidepdf.com/reader/full/2-toxicology 11/29
MKH 1313 - Industrial Hygiene
AA, UTM, 2011 Page
Kidney
Your kidneys receive
the blood from the
renal artery, process it,
return the processed
blood to the body
through the renal vein
and remove the wastes
and other unwanted
substances in the urine.
Urine flows from the
kidneys through the
ureters to the bladder.
Liver
8/10/2019 2 Toxicology
http://slidepdf.com/reader/full/2-toxicology 12/29
MKH 1313 - Industrial Hygiene
AA, UTM, 2011 Page
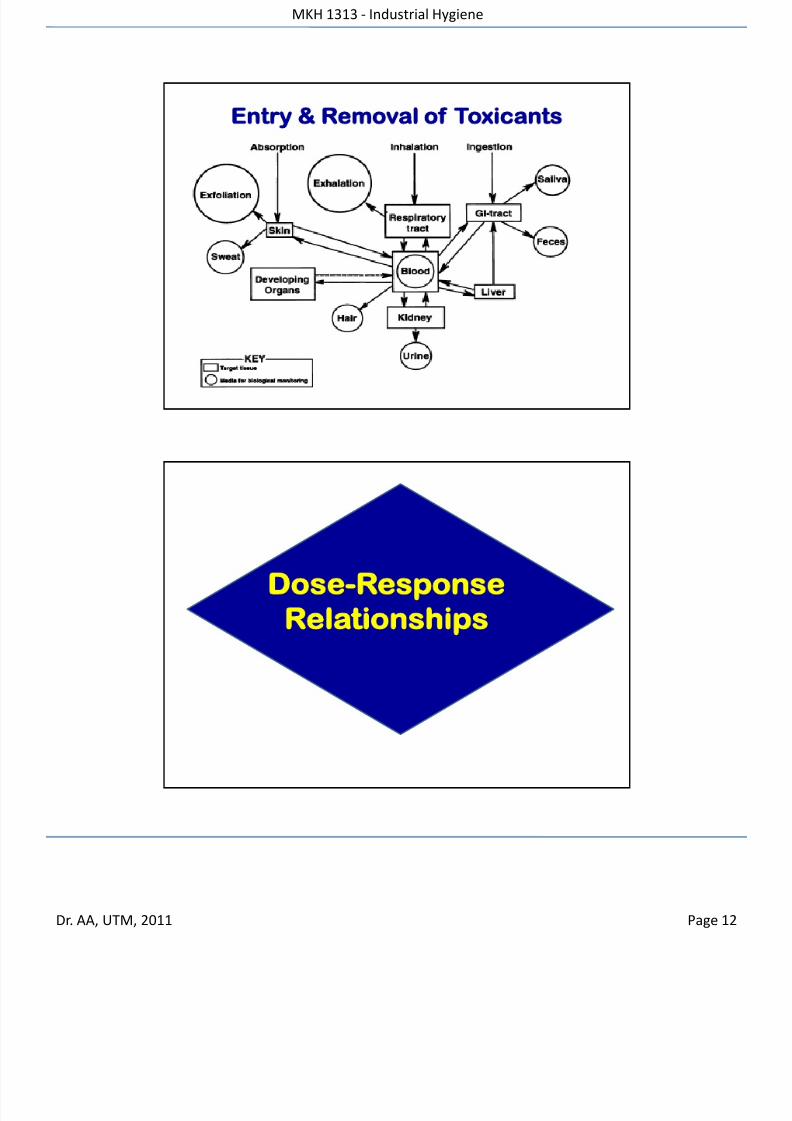
Entry Removal of Toxicants
Dose-Response
Relationships

8/10/2019 2 Toxicology
http://slidepdf.com/reader/full/2-toxicology 13/29
MKH 1313 - Industrial Hygiene
AA, UTM, 2011 Page
Dosis facit venenum - The Dose
Makes the Poison
All substances are poisons; there is none which isnot a poison. The right dose differentiates apoison…." Paracelsus (1493-1541)
10 Grams Caffeine – Usually Fatal
– 150 mg – Stimulate Entire Spinal Cord
– 65 to 350 mg in 8 oz. of Coffee
– 55 mg in 12 oz Can of Mountain Dew®
– 45 mg in 12 oz Can of Coke® or Diet Coke®
Key Factors Related to Dose
Response
The dose-response curve may differ for different
populations.
Individuals vary with regard to response to drugs or
toxins.

8/10/2019 2 Toxicology
http://slidepdf.com/reader/full/2-toxicology 14/29
MKH 1313 - Industrial Hygiene
AA, UTM, 2011 Page
Dose-Response Curve
Dose-respon se curve graphically represents therelationship between the dose of a stimulant (e.g.chemicals, drugs) the response elicited
Responses - Toxicology
Toxicology:
– Only toxic effects are of
concern.
– Low doses NOEL
(no observable effect
level)
–Greater than NOEL toxicity
Toxicity is the ability of a chemical to damage anorgan system, to disrupt a biochemical process, orto disturb an enzyme system.

8/10/2019 2 Toxicology
http://slidepdf.com/reader/full/2-toxicology 15/29
MKH 1313 - Industrial Hygiene
AA, UTM, 2011 Page
Responses (Pharmacology
Perspectives)
Low dose no observableresponse
(subtherapeutic)
Increase dose leads toincrease in therapeuticresponse (and side effects)
Greater than therapeuticdose toxicity
Monty Herr
8/10/2019 2 Toxicology
http://slidepdf.com/reader/full/2-toxicology 16/29
MKH 1313 - Industrial Hygiene
AA, UTM, 2011 Page
Factor Influencing a Dose-Response
Curve?
Species
Gender
Genetic strain
Age
Route of administration
Environmental conditions
Nutritional status
Effects of More Than One
Chemical
Additive Effect: the combined effect of the two
chemicals is equal to the sum of the effects of each
agent given alone. This is the most commonly
observed effect when two chemicals are given
together. (2 + 2 = 4)
8/10/2019 2 Toxicology
http://slidepdf.com/reader/full/2-toxicology 17/29
MKH 1313 - Industrial Hygiene
AA, UTM, 2011 Page
Effects of More Than One
Chemical Continued
Synergistic Effect: occurs when the combined
effects of two chemicals are much greater than the
sum of the effects of each agent given alone.
– CCl4 and ethanol are hepatotoxic alone but when given
together produce much more liver injury than the
mathematical sum of their individual effects. (2 + 2 = 20).
– Smoking and asbestos exposure is another example.
– Cocaine use with alcohol use is a third example.
Effects of More Than One
Chemical Continued
Potentiation: occurs when one compound does not
have a toxic effect on a certain organ or system but
when added to another chemical makes that chemical
much more toxic.
– CCl4 is hepatotoxic, isopropanol is not hepatotoxic, when
given together the effect of CCl4 is more than expected. (0 +2 = 10)

8/10/2019 2 Toxicology
http://slidepdf.com/reader/full/2-toxicology 18/29
MKH 1313 - Industrial Hygiene
AA, UTM, 2011 Page
Effects of More Than One
Chemical Continued
Antagonism: occurs when two chemicals
administered together interfere with each other’s
action. Antagonistic interactions are very often
desirable in toxicology and are the basis of many
antidotes. (2 + (-2) = 0).
Types of Antagonism
Functional antagonism occurs when two chemicalscounterbalance each other by producing oppositeeffects on the same physiological function.
Chemical antagonism is a chemical reaction between
two compounds that produces a less toxic product.Example = a chelator and a metal.

8/10/2019 2 Toxicology
http://slidepdf.com/reader/full/2-toxicology 19/29
MKH 1313 - Industrial Hygiene
AA, UTM, 2011 Page
Types of Antagonism-Continued
Dispositional antagonism occurs when the dispositionof a chemical is altered so that the concentrationand/or duration of the chemical at the target organare diminished. Ex. Metabolism is increased – Excretion is increased, therefore half-life is decreased
Receptor antagonism occurs when two chemicals thatbind to the same receptor produce less of an effectwhen given together than the addition of their
separate parts. Receptor antagonists are oftentermed blockers.
Determination
of Exposure Limits
8/10/2019 2 Toxicology
http://slidepdf.com/reader/full/2-toxicology 20/29
MKH 1313 - Industrial Hygiene
AA, UTM, 2011 Page
Toxicology study
To quantify the effects of toxicant on target organism
Usually done on animals (lung, kidney, liver) and the
results are extrapolated to human. For genetic effect,
the study is on single-cell organism.
Different routes requires different toxicological study
Toxicological study
Involve identifying,
– The toxicant
– The target or test organism
– The effect or response to be monitored
– The dose range
– Ingestion or injection , mg toxicant/kg of body weight
– Gaseous Inhalation, ppm or mg/m3 air
–Particle inhalation, millions of particle per cubic foot (mppcf) ormg/m3 air
– The period of the test (mostly acute tocixity study)
– Acute toxicity, single exposure or series of exposure in a shorttime
– Chronic toxicity, multiple exposure over a long period of time,also difficult to perform

8/10/2019 2 Toxicology
http://slidepdf.com/reader/full/2-toxicology 21/29
MKH 1313 - Industrial Hygiene
AA, UTM, 2011 Page
Acute Exposure - Continued
Mouse and rat are the species most commonly usedfor testing
Both sexes are used
Food is withheld the night before testing
The number of animals that reach a prescribedendpoint at each dose are tabulated
10 animals per dose
5 dose levels
Acute Exposure - Continued
If larger animals are used the dose is increased in the
same animal until the prescribed endpoint is reached
Endpoints could be
– Lethal dose (death)
– Toxic dose (ex. Liver injury)
–Effective dose (ex. Relief from itching)
8/10/2019 2 Toxicology
http://slidepdf.com/reader/full/2-toxicology 22/29
MKH 1313 - Industrial Hygiene
AA, UTM, 2011 Page
Subchronic Testing
90 days is the most common test duration but 30 daysto 90 days can be used
Usually oral administration of the chemical via food;also implant
Used to further characterize the specific organsaffected by test compound after repeatedadministration of the chemical
Subchronic Exposure
At least 3 doses
– A high dose that produces toxicity but death in less than
10% of the animals
– A low dose that does not produce apparent toxic effects
during an acute exposure
–An intermediate dose
8/10/2019 2 Toxicology
http://slidepdf.com/reader/full/2-toxicology 23/29
MKH 1313 - Industrial Hygiene
AA, UTM, 2011 Page
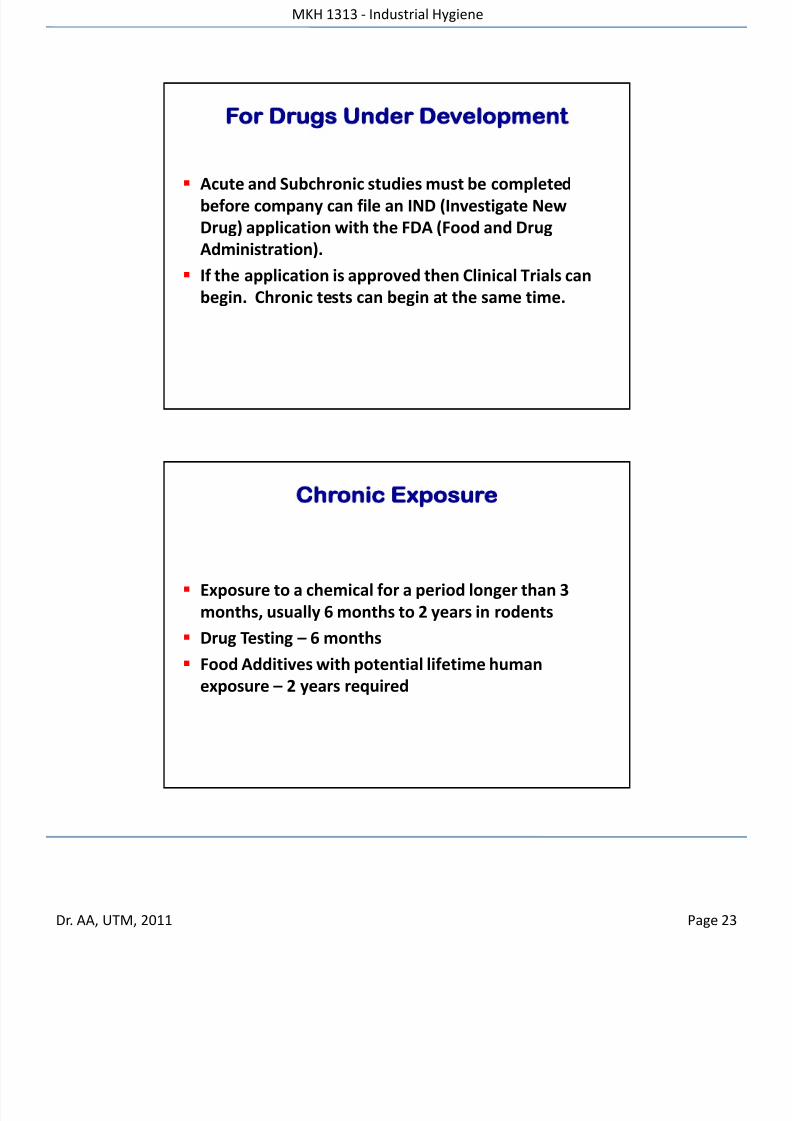
For Drugs Under Development
Acute and Subchronic studies must be completed
before company can file an IND (Investigate New
Drug) application with the FDA (Food and Drug
Administration).
If the application is approved then Clinical Trials can
begin. Chronic tests can begin at the same time.
Chronic Exposure
Exposure to a chemical for a period longer than 3
months, usually 6 months to 2 years in rodents
Drug Testing – 6 months
Food Additives with potential lifetime human
exposure – 2 years required

8/10/2019 2 Toxicology
http://slidepdf.com/reader/full/2-toxicology 24/29
MKH 1313 - Industrial Hygiene
AA, UTM, 2011 Page
Chronic Exposure - Continued
Designed to assess cumulative toxicity of chemicals
including consideration of carcinogenic potential
Mice – 18 months to 2 years
Rats – 2 to 2.5 years
Start with 60 animals/sex/dose to end up with 30
animals to survive study
Chronic Exposure - Continued
Highest administered dose = “Estimated Maximum
Tolerable Dose (MTD) derived from subchronic study
The National Toxicology Program defines the MTD as
“a dose that suppresses body weight slightly (i.e. 10%)
in a 90 day study
Also use ½ MTD, ¼ MTD, and a control group

8/10/2019 2 Toxicology
http://slidepdf.com/reader/full/2-toxicology 25/29
MKH 1313 - Industrial Hygiene
AA, UTM, 2011 Page
What Can Be Learned From A Dose-
Response Curve?
LD50 – Median Lethal Dose, quantity of the chemical
that is estimated to be fatal to 50% of the organisms
– LD50 values are the standard for comparison of acute
toxicity between chemical compounds and between species
TD50 – Median Toxic Dose
ED50 – Median Effective Dose
LC50 – Median Lethal Concentration
50
LD50 is commonly used for assessment of toxicity
%
affected
population
100
50
0
LD50 Dose
LD50 = 50% fatality
LD-50
8/10/2019 2 Toxicology
http://slidepdf.com/reader/full/2-toxicology 26/29
MKH 1313 - Industrial Hygiene
AA, UTM, 2011 Page
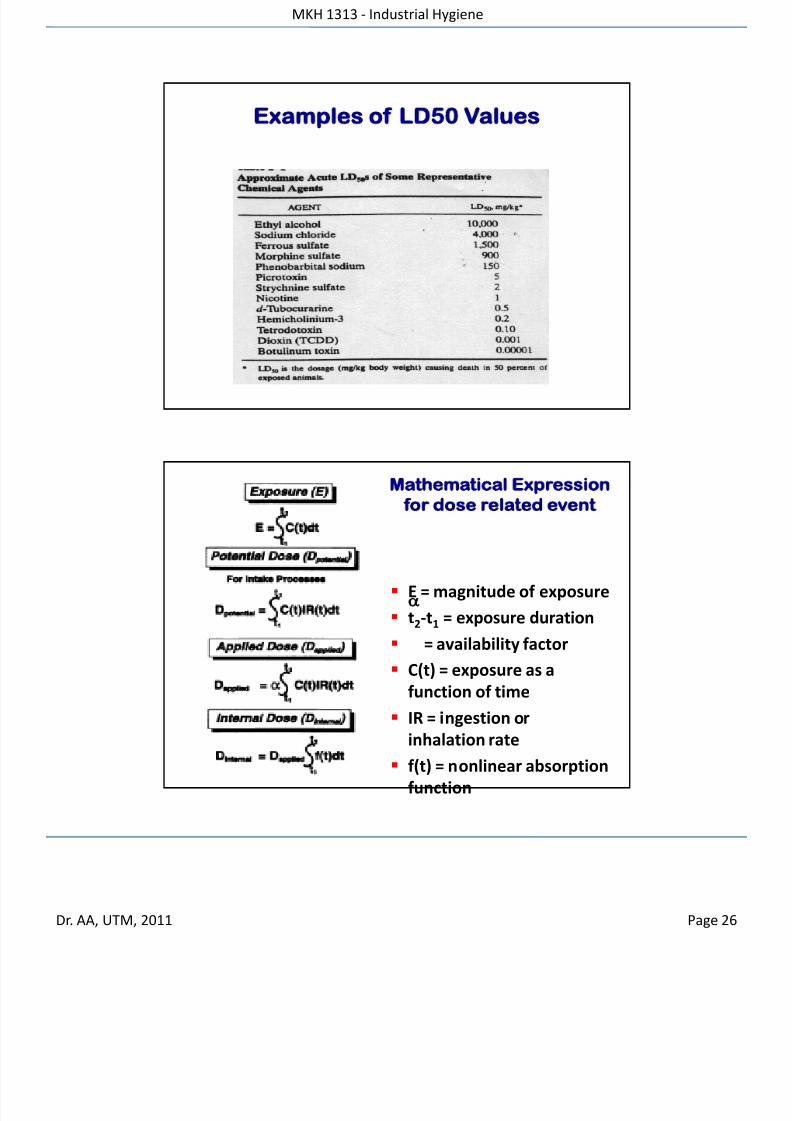
Examples of LD50 Values
Mathematical Expression
for dose related event
E = magnitude of exposure
t2-t1 = exposure duration
= availability factor
C(t) = exposure as a
function of time IR = ingestion or
inhalation rate
f(t) = nonlinear absorption
function

8/10/2019 2 Toxicology
http://slidepdf.com/reader/full/2-toxicology 27/29
MKH 1313 - Industrial Hygiene
AA, UTM, 2011 Page
Probit Analysis
Probit Analysis
The dose level of the various hazard events
against fatality can be conveniently determined
using Probit Analysis.
It is a graphical and Look-up Table approach to
determine probability of fatality
54
8/10/2019 2 Toxicology
http://slidepdf.com/reader/full/2-toxicology 28/29
MKH 1313 - Industrial Hygiene
AA, UTM, 2011 Page
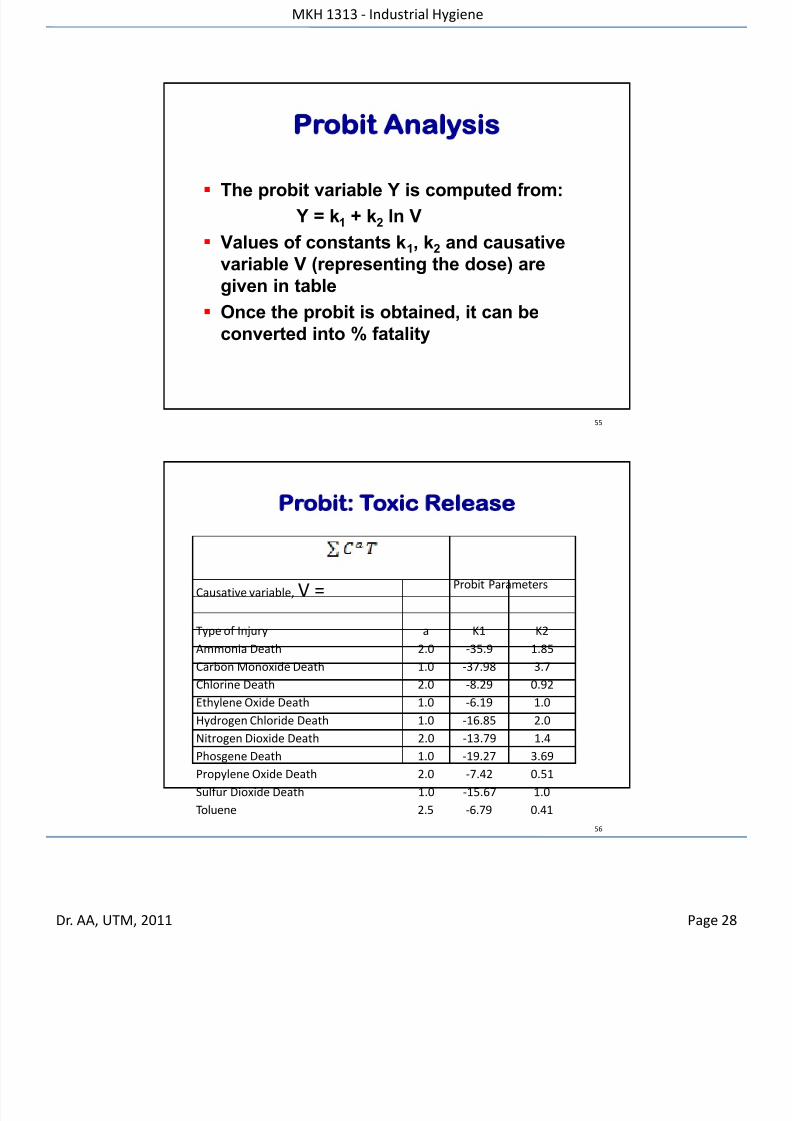
Probit Analysis
The probit variable Y is computed from:
Y = k1 + k2 ln V
Values of constants k1, k2 and causative
variable V (representing the dose) are
given in table
Once the probit is obtained, it can be
converted into % fatality
55
Probit: Toxic Release
56
Causative variable, V = Probit Parameters
Type of Injury a K1 K2
Ammonia Death 2.0 -35.9 1.85
Carbon Monoxide Death 1.0 -37.98 3.7
Chlorine Death 2.0 -8.29 0.92
Ethylene Oxide Death 1.0 -6.19 1.0
Hydrogen Chloride Death 1.0 -16.85 2.0
Nitrogen Dioxide Death 2.0 -13.79 1.4
Phosgene Death 1.0 -19.27 3.69
Propylene Oxide Death 2.0 -7.42 0.51
Sulfur Dioxide Death 1.0 -15.67 1.0
Toluene 2.5 -6.79 0.41
8/10/2019 2 Toxicology
http://slidepdf.com/reader/full/2-toxicology 29/29
MKH 1313 - Industrial Hygiene
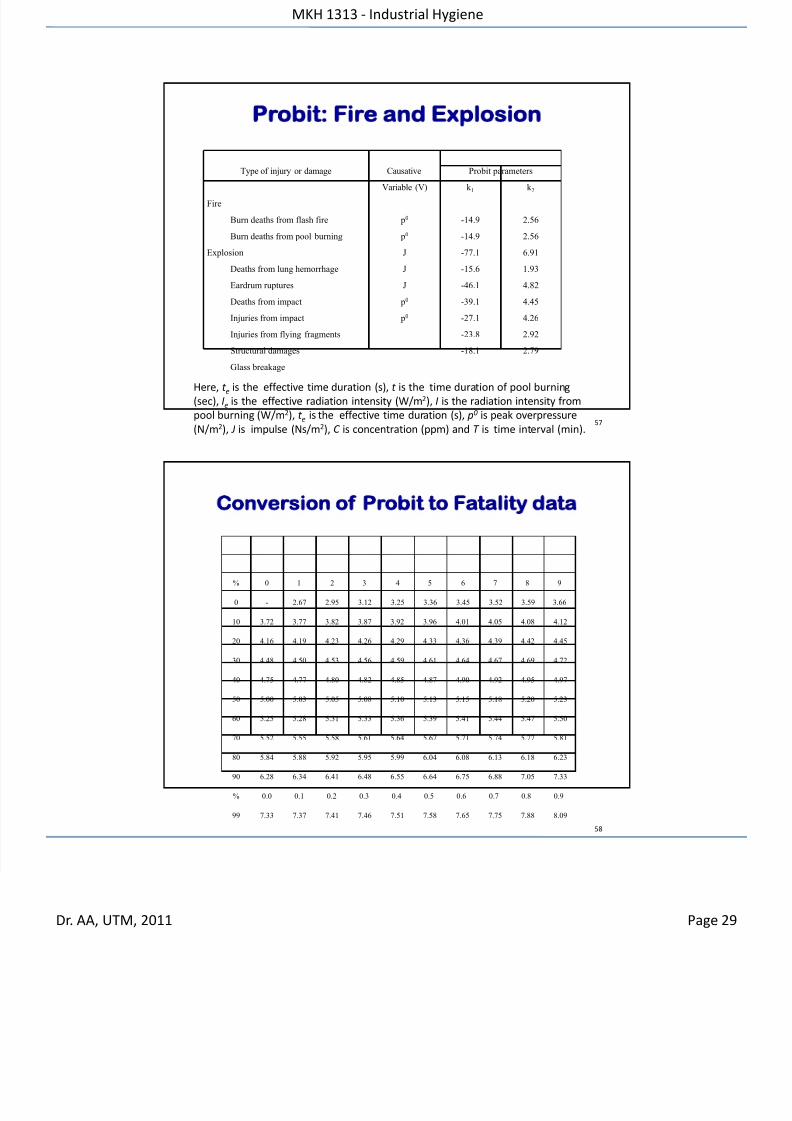
Probit: Fire and Explosion
Type of injury or damage CausativeVariable (V)
Probit parametersk 1 k 2
Fire
Burn deaths from flash fire
Burn deaths from pool burning
Explosion
Deaths from lung hemorrhage
Eardrum ruptures
Deaths from impact
Injuries from impact
Injuries from flying fragments
Structural damages
Glass breakage
p0
p0
J
J
J
p0
p0
-14.9
-14.9
-77.1
-15.6
-46.1
-39.1
-27.1
-23.8
-18.1
2.56
2.56
6.91
1.93
4.82
4.45
4.26
2.92
2.79
57
Here, t e is the effective time duration (s), t is the time duration of pool burning
(sec), Ie is the effective radiation intensity (W/m2), I is the radiation intensity from
pool burning (W/m2), t e is the effective time duration (s), p0 is peak overpressure
(N/m2), J is impulse (Ns/m2), C is concentration (ppm) and T is time interval (min).
Conversion of Probit to Fatality data
58
% 0 1 2 3 4 5 6 7 8 9
0 - 2.67 2.95 3.12 3.25 3.36 3.45 3.52 3.59 3.66
10 3.72 3.77 3.82 3.87 3.92 3.96 4.01 4.05 4.08 4.12
20 4.16 4.19 4.23 4.26 4.29 4.33 4.36 4.39 4.42 4.45
30 4.48 4.50 4.53 4.56 4.59 4.61 4.64 4.67 4.69 4.72
40 4.75 4.77 4.80 4.82 4.85 4.87 4.90 4.92 4.95 4.97
50 5.00 5.03 5.05 5.08 5.10 5.13 5.15 5.18 5.20 5.23
60 5.25 5.28 5.31 5.33 5.36 5.39 5.41 5.44 5.47 5.50
70 5.52 5.55 5.58 5.61 5.64 5.67 5.71 5.74 5.77 5.81
80 5.84 5.88 5.92 5.95 5.99 6.04 6.08 6.13 6.18 6.23
90 6.28 6.34 6.41 6.48 6.55 6.64 6.75 6.88 7.05 7.33
% 0.0 0.1 0.2 0.3 0.4 0.5 0.6 0.7 0.8 0.9
99 7.33 7.37 7.41 7.46 7.51 7.58 7.65 7.75 7.88 8.09