2. topdressing canola: how to maximize the benefits … · topdressing canola: how to maximize ......
TRANSCRIPT

1
Number 335 February 3, 2012
1. New 4R Nutrient Stewardship program _________________________________________ 1
2. Topdressing canola: How to maximize the benefits ________________________________ 3
3. Sorghum Schools scheduled in six locations _____________________________________ 5
4. Central Plains Irrigation Conference and Expo planned Feb. 21-22 in Colby __________ 6
5. Comparative Vegetation Condition Report: January 17 – 30 ________________________ 7
1. New 4R Nutrient Stewardship program On December 13, 2011 the USDA announced revisions to the national conservation practice standard on nutrient management, code 590. See: www.nrcs.usda.gov/wps/portal/nrcs/detail/national/newsroom/?cid=STELPRDB1046194 The goals of the revisions are to better assist producers in managing and applying nutrients. The expected outcomes are improved returns on nutrient investments and protection and/or improvement of water, air, soil and overall agricultural sustainability. The revisions are seen as an endorsement of the 4R Nutrient Stewardship concept which takes into account social, economic and environmental factors in the context of determining the right source, rate, time and place for a nutrient addition. The 4R concept was developed through a partnership of the International Plant Nutrition Institute, The Fertilizer Institute, and the Canadian Fertilizer Institute (www.ipni.net).

2
Source: http://www.ipni.net/4r Breaking down the 4R’s Right Source The right source means identifying the best fertility source or combination of sources (commercial fertilizer, manure, etc) that meet the crop needs and are appropriate for the specific location. Factors to consider when determining the right source include:
• Soil conditions and properties • Fertilizer delivery and application issues • Environmental Risks • Economic constraints e.g. price and application costs
http://www.ipni.net/ppiweb/filelib.nsf/0/F3D85DDA3D489C418525762D004DA258/$file/4R-source-2009.pdf Right Rate The right rate is determining your nutrient requirements to achieve your production goals. Present crop, crop history, soil test, and in-season nutrient testing all provide information that should be utilized in determining fertility requirements. Additional factors to consider in determining the right rate are:
• All 17 essential nutrients must be present • A deficiency in one nutrient cannot be overcome by applying an excess of another
nutrient. A crops yield is determined by the most limiting nutrient (Liebig’s law of the Minimum)
• Match nutrient supply with plant requirements
3
http://www.ipni.net/ppiweb/filelib.nsf/0/19BCE23CBD11AFE38525762D004DC16A/$file/4R-rate-2009.pdf Right Time The right time means ensuring that the nutrients are available to meet the crop demand. Strategies to ensure nutrients are available when plant nutrient demands are high include strategies such as split nutrient applications over the growing season, and use of controlled release fertilizers. Additional factors to consider in determining the right time are:
• The availability characteristics of the nutrient source • Sight specific conditions such as soil characteristics • Weather and other environmental conditions
http://www.ipni.net/ppiweb/filelib.nsf/0/EF926099F1C56B4A8525762D004DD6D8/$file/4R-timing-2009.pdf Right Place The right place means ensuring that nutrients are located and retained where they are accessible to the plant. Nutrient placement decisions such as injecting, banding or incorporation need to take into account the crop, soil properties and cropping system and must be balanced with soil erosion goals. Additional factors to consider in determining the right place are:
• The fertilized soil volume (concentration) • Relation to the plant root system. • P and K move to plant roots primarily by diffusion • Plant nutrient demands are greatest during rapid vegetative growth
http://www.ipni.net/ppiweb/filelib.nsf/0/0F716D45D3CFF2F18525766C006B7FEE/$file/4R-placement-2009.pdf -- Peter Tomlinson, Environmental Quality Specialist [email protected] 2. Topdressing canola: How to maximize the benefits To maximize the yield potential of winter canola, producers should topdress with nitrogen, sulfur, and possibly boron in the winter. Producers should be sure to make topdress applications under the right environmental conditions, with the right nutrients, and with the right application method.
Environmental conditions The best time to topdress winter canola is during the rosette stage when the canola is dormant. Most years, this can easily be accomplished by topdressing in January or February, since temperatures are cold enough to keep canola from actively growing. But this year, temperatures have been unusually mild through most of the winter. Fortunately, nighttime temperatures have remained near or below freezing, so the canola is not producing many new leaves nor started bolting. If nitrogen is applied as a liquid when canola is green and physiologically active, be careful that the rate applied does not cause leaf burn. Both dry and liquid fertilizers are effective products.

4
Nutrients A combination of nitrogen and sulfur, perhaps along with some boron, should be used in the topdressing blend. Nitrogen. About two-thirds of the total nitrogen needed by the canola crop should be applied as a winter topdress. This should be done just as plants begin to show increased growth, and before the plants start to bolt. Topdress applications should be based on an updated assessment of yield potential, less profile residual nitrogen, and the amount of nitrogen applied in the fall. Suggested nitrogen rates for five yield levels and a soil with 2 percent organic matter and varying residual nitrate-nitrogen levels is shown in the table below. For soils with 1 percent organic matter, add 15 pounds nitrogen for each yield and nitrate level above and for soils with 3 percent organic matter subtract 15 pounds nitrogen for each yield and nitrate level. Total nitrogen fertilizer needs for canola as affected by yield potential and soil test nitrogen levels
in the southern Great Plains Profile N test (lbs/acre)
Yield potential (lbs/acre)
1,500 2,000 2,500 3,000 3,500 0 75 100 125 150 175 20 55 80 105 130 155 40 35 60 85 110 135 60 15 40 65 90 115 80 0 20 45 70 95 100 0 5 25 50 75 Source: Great Plains Canola Production Handbook, http://www.ksre.ksu.edu/library/crpsl2/mf2734.pdf Either solid or liquid forms of nitrogen can be used before green-up in the early spring. Once the weather warms and growth begins, solid materials are preferred for broadcast applications to prevent/avoid leaf burn. Some of the new controlled-release products such as polymer-coated-urea (ESN) might be considered on very sandy soils prone to leaching, or poorly drained soils prone to denitrification. Generally a 50:50 blend of standard urea and the coated urea -- which will provide some N immediately to support bolting and flowering and also continue to release some N in later stages of development -- works best in settings with high loss potential. Sulfur. If canola is deficient in sulfur, the consequences can be very serious because it needs sulfur to produce oil and protein in the seed. For this reason, soils having less than 20 lbs/acre sulfate-sulfur (10 ppm SO4-S) should receive supplemental sulfur. A good rule to follow is to keep sulfur to nitrogen availability at a ratio of about 1 to 7. Another simple guideline is to apply 20 pounds sulfur per acre, which will be sufficient for low and medium yield levels. Sulfur can be applied in the fall and incorporated into the seedbed or surface applied with nitrogen in the winter topdressing. Canola growers may consider using elemental sulfur, ammonium sulfate, or a thio-sulfate form of sulfur. Since elemental sulfur must oxidize to become plant available, it should only be applied in the fall. Ammonium thio-sulfate or ammonium sulfate can be applied in the spring or fall, but thio-sulfate should not be topdressed directly on tissue or placed with seed to avoid phytotoxicity. Boron. If deficient, boron is one micronutrient that can have negative consequences on canola yield. Typically boron deficiency is not something we have seen in Kansas. However, if there are micronutrients that could influence yield, then boron would be one of them. The most important

5
thing is to know what your soil sample states. Oklahoma State University is looking more into boron fertility. Applying boron may help to reduce flower abortion and enable efficient pod filling. However, there is not much room for error when comparing adequate boron fertility levels and toxic levels that might result from over application. Because of this, application rates of boron are often 1.0 lbs per acre or less. Soil and foliar applications of boron are effective. Foliar applications can be made with herbicides, and soil applied boron can be either broadcasted or banded. Make sure applications are uniform across the field to avoid toxicity.
Application method It is important to avoid crushing winter canola with applicator tires after it bolts. Crushed plants will lodge and maturity will be delayed, which can slow harvest and increase the risk of shattering losses. For this reason, applicators with narrow tires are preferred. Do not use high flotation tires. As for the question of whether broadcast or banding is best -- if temperatures are cold and the plants are dormant, topdress fertilizer can be broadcast. If temperatures are mild enough that the canola plants have resumed active growth, it may be best to use streamer bars or some other form of banded application to avoid foliar burn. -- Mike Stamm, Canola Breeder [email protected] -- Dorivar Ruiz Diaz, Nutrient Management Specialist [email protected] -- Bill Heer, South Central Experiment Field [email protected] 3. Sorghum Schools scheduled in six locations Sorghum production will be the focus of six in-depth Sorghum Schools in various locations around the state. The one-day schools will cover a number of issues facing sorghum growers: profit potential; weed control strategies; and planting, fertility, insect, and disease management. The schools, sponsored by the Kansas Grain Sorghum Commission, each begin with registration at 9:30 a.m. and the program at 9:45 a.m. Lunch is included at each location. The program will wrap up by mid-afternoon. Dates and locations include: Feb. 15 – Burns – Community Center, 301 N. Washington. Feb. 16 – Dodge City – Ford County Fair Building, 901 W. Park. Feb. 17 – Mulvane – St. Michael’s Catholic Church Parish Hall, 525 E. Main. Feb. 29 – Leoti – Wichita County Community Building, Wichita Co. Fairgrounds. March 1 – Stockton – Harding Hall 4-H Building, Rooks County Fairgrounds. March 6 – Concordia – Cloud County Community College, Cook Theater.

6
Participants are asked to register for the sorghum school of their choosing by contacting their local K-State Research and Extension office by the Monday before the school they plan to attend. -- Kraig Roozeboom, Crop Production and Cropping Systems Specialist [email protected] 4. Central Plains Irrigation Conference and Expo planned Feb. 21-22 in Colby The Central Plains Irrigation Conference and Exposition will be held Feb. 21-22 at the City Limits Convention Center in Colby. The conference is sponsored by Kansas State University, the University of Nebraska, Colorado State University and the Central Plains Irrigation Association. Tracy Streeter, director of the Kansas Water Office, will represent Kansas Gov. Sam Brownback in giving the general session address, “Legislative Initiative to Manage the Ogallala” on Feb. 21. Dan Rogers, agricultural engineer state leader with K-State Research and Extension will present “Kansas Irrigation Trends and Impacts” during the Feb. 22 general session. The conference begins with registration and the opening of the expo at 9 a.m. on Feb. 21. Technical sessions start at 10 a.m. on Tuesday. The Feb. 22 program begins earlier, with registration at 8 a.m. and technical sessions starting at 8:30 a.m. All technical sessions will be offered both days, but in different order. Speakers from several universities, as well as the U.S. Department of Agriculture’s Risk Management Agency will present eight technical sessions, including: • Crop Water Budget – Effects of Tillage Systems; • Crop Water Budget – Effects of Irrigation Management; • Optimizing Crop Water Productivity When Irrigation Water is Limited; • Optimizing Crop Water Productivity Using Center Pivot Irrigation; • Optimizing Crop Water Productivity Using Subsurface Drip Irrigation; • Emerging Irrigation Scheduling Technologies; • Decision Support Software for the Irrigation Manager; and • Crop Insurance and Economic Issues. The cost to attend the conference and expo is $85 for participants who are not seeking crop consultant advisor continuing education unit credit. For those seeking CEU credits, the cost is $100. More information is available on the Central Plains Irrigation Association website http://www.ksre.ksu.edu/irrigate/cpia.htm or by contacting Donna Lamm at 785-462-3833 or [email protected]. -- Dan Rogers, Extension Irrigation Engineer [email protected]

7
5. Comparative Vegetation Condition Report: January 17 – 30 K-State’s Ecology and Agriculture Spatial Analysis Laboratory (EASAL) produces weekly Vegetation Condition Report maps. These maps can be a valuable tool for making crop selection and marketing decisions. Two short videos of Dr. Kevin Price explaining the development of these maps can be viewed on YouTube at: http://www.youtube.com/watch?v=CRP3Y5NIggw http://www.youtube.com/watch?v=tUdOK94efxc The objective of these reports is to provide users with a means of assessing the relative condition of crops and grassland. The maps can be used to assess current plant growth rates, as well as comparisons to the previous year and relative to the 21-year average. The report is used by individual farmers and ranchers, the commodities market, and political leaders for assessing factors such as production potential and drought impact across their state. The maps below show the current vegetation conditions in Kansas, the Corn Belt, and the continental U.S, with comments from Mary Knapp, state climatologist:

8
Map 1. The Vegetation Condition Report for Kansas for January 17 – 30 from K-State’s Ecology and Agriculture Spatial Analysis Laboratory shows that very little snow cover affected Kansas. Most of the vegetation is dormant, so little photosynthetic activity can be seen.

9
Map 2. Compared to the previous year at this time for Kansas, the current Vegetation Condition Report for January 17 – 30 from K-State’s Ecology and Agriculture Spatial Analysis Laboratory shows signs of cloud contamination from last year’s image. Note the pronounced splice line in central KS, where last year at this time had very cold, snowy conditions. In general, however, the much warmer temperatures have favored higher NDVI values this year. The dark green areas on the eastern portion of the image are colored green because the NDVI (Normalized Difference Vegetation Index) was very low last year at this time due to snow/clouds cover over a target areas, but much higher this year when there is no snow/clouds over the area. This area is colored green, not because it has lots of green growing vegetation at this time (naturally), but because higher differences in NDVI from one time to another are colored green according to the color scheme shown along the side of the map. During the growing season, this color scheme makes more sense, but we leave it the same in the off growing season period to avoid creating confusion. The areas that are green beyond the dark green area are due to increased photosynthetic activity most likely associated with winter wheat growth.

10
Map 3. Compared to the 23-year average at this time for Kansas, this year’s Vegetation Condition Report for January 17 – 30 from K-State’s Ecology and Agriculture Spatial Analysis Laboratory shows that photosynthetic activity continues to be greater than would be expected. Note that while the vegetation index value (Normalized Difference Vegetation Index, or NDVI) is greater than average this does not indicate high rates of biomass production. Most vegetation is currently dormant except in areas where one might expect cool season plants like winter wheat to still be green.

11
Map 4. The Vegetation Condition Report for the Corn Belt for January 17 – 30 from K-State’s Ecology and Agriculture Spatial Analysis Laboratory shows that snow continued to be a predominate feature in much of the Corn Belt. Biomass production continues to be low, as much of the vegetation is dormant.

12
Map 5. The comparison to last year in the Corn Belt for the period January 17 – 30 from K-State’s Ecology and Agriculture Spatial Analysis Laboratory shows that vegetation index values (NDVI) continue to be higher. Even with the recent storms, snow depths across the upper reaches of the Corn Belt continue well below last year’s depths. This increased NDVI values still represent very low photosynthetic activity, as most vegetation is dormant.

13
Map 6. Compared to the 23-year average at this time for the Corn Belt, this year’s Vegetation Condition Report for January 17 – 30 from K-State’s Ecology and Agriculture Spatial Analysis Laboratory shows that northwestern and eastern regions have higher NDVI values. This is due primarily to lower snow cover in these regions, coupled with milder temperatures than average. Overall biomass production is still slight.
14
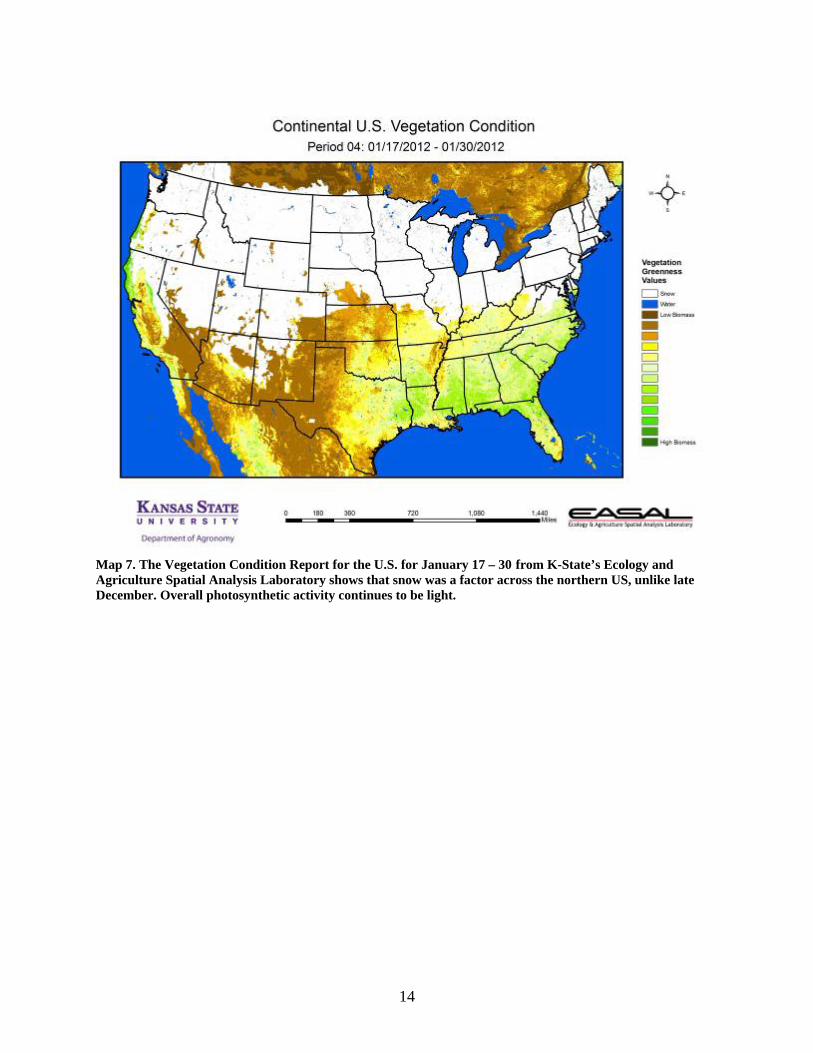
Map 7. The Vegetation Condition Report for the U.S. for January 17 – 30 from K-State’s Ecology and Agriculture Spatial Analysis Laboratory shows that snow was a factor across the northern US, unlike late December. Overall photosynthetic activity continues to be light.

15
Map 8. The U.S. comparison to last year at this time for the period January 17 – 30 from K-State’s Ecology and Agriculture Spatial Analysis Laboratory shows continued higher vegetation index values (NDVI) along the northern states. Most of this is due to the reduced snow cover, when compared to last year. Increased photosynthetic activity along the Texas-Oklahoma border and into northern and central Texas is due to the more favorable moisture conditions in these areas. Extreme to exceptional drought conditions still persist from central Texas southward.

16
Map 9. The U.S. comparison to the 23-year average for the period January 17 – 30 from K-State’s Ecology and Agriculture Spatial Analysis Laboratory shows that milder-than-average winter continues to favor greater-than-average vegetation index values (NDVI), although not as pronounced as last week.. The higher NDVI readings across the Northern U.S. are due mainly to lesser snow cover in the region than average. More significant is the continued elevated NDVI values along the Oklahoma and Texas borders. This is in an area that continued to receive beneficial moisture, providing some relief to the long-term drought in the area. Note to readers: The maps above represent a subset of the maps available from the EASAL group. If you’d like digital copies of the entire map series please contact us at [email protected] and we can place you on our email list to receive the entire dataset each week as they are produced. The maps are normally first available on Wednesday of each week, unless there is a delay in the posting of the data by EROS Data Center where we obtain the raw data used to make the maps. These maps are provided for free as a service of the Department of Agronomy and K-State Research and Extension. -- Mary Knapp, State Climatologist [email protected] -- Kevin Price, Agronomy and Geography, Remote Sensing, Natural Resources, GIS [email protected] -- Nan An, Graduate Research Assistant, Ecology & Agriculture Spatial Analysis Laboratory (EASAL) [email protected]
These e-Updates are a regular weekly item from K-State Extension Agronomy and Steve Watson, Agronomy e-Update Editor. All of the Research and Extension faculty in Agronomy will be involved as sources from time to time. If you have any questions or suggestions for topics you'd like to have us address in this weekly update, contact Steve Watson, 785-532-7105 [email protected], or Jim Shroyer, Research and Extension Crop Production Specialist and State Extension Agronomy Leader 785-532-0397 [email protected]