2. the european insurance sector - eiopa home. the european... · 23 2. the european insurance...
TRANSCRIPT
23
2. The European insurance sector
The market-based Solvency II (SII) regime came into force in January 2016 and
required insurance companies to align with new rules and standards.10
In recent years, insurers had been taking actions to improve their solvency position,
by e.g. accumulating specific reserves on their balance sheet as well as changing their
product mix towards less capital-intensive products. The SII strengthens insurers’ risk
management and introduces further harmonisation at the European level, thereby
promoting a level playing field for all insurance companies in Europe.
The implementation of Solvency II was a major step forward to reinforce policyholder
protection, especially in a period where insurance companies had to cope with
challenges triggered by a difficult economic and financial environment, with persistent
low interest rates questioning their solvency position and the sustainability of their
promises and business models.
With SII, starting in January 2016 insurance undertakings are subject to a
risk-based supervisory regime. SII rules stipulate the minimum amounts of
financial resources that insurers and reinsurers must have in order to cover the risks
to which they are exposed. Equally importantly, the rules also lay down the principles
that should guide insurers' overall risk management so that they can better anticipate
any adverse events and better handle such situations.
SII introduced economic risk-based solvency requirements across all EU
Member States. These new solvency requirements are more risk-sensitive and more
sophisticated than in the past, thus enabling a better coverage of the real risks run by
any particular insurer. The new requirements move away from a crude "one-model-
fits-all" way of estimating capital requirements to more entity-specific requirements.
Solvency requirements will be more comprehensive than in the past and also take into
account the asset-side risks.
Insurance companies need to disclose information in the "Quantitative Reporting
Templates" (QRTs) to EIOPA and national supervisors for supervisory purposes. EIOPA
makes use of this data for the first time in this financial stability report (FSR).
10 Solo data is used for country and business line analysis in this report. The data description section on page 66 gives
more information on data used in this FSR.
24
EIOPA is currently in the process of building a comprehensive information
system based on the data collected under the new harmonized QRTs. This
creates a unique opportunity to improve the functioning of the internal market, in
particular by ensuring a high, effective and consistent level of supervision, preventing
supervisory arbitrage, guaranteeing a level playing field and ensuring a similar level of
protection to all policyholders. On the other hand, the risk based approach represents
an enormous opportunity to improve risk management over time, embeds a risk
culture in the organisations and develop sustainable business models putting
customers at the centre of the insurance company's strategy.
Solvency II is a prudential regime based on risks and uses specific models to
evaluate assets, liabilities and capital requirements for insurance companies.
It should be kept in mind though that Solvency II results differ when compared with
results of the previous Solvency I regime. Hence, a full understanding of Solvency II
needs to be developed over time.

25
2.1. Overview
This chapter provides an overview of the insurance undertakings subject to SII
regulation and discusses some key aspects of the insurance market.11
The size of insurance undertakings can be measured by total assets, TP (technical
provisions) and GWPs (gross written premiums). Table 2.1 shows that for the largest
undertakings in Europe (subject to Financial Stability reporting), total assets are more
than EUR 92bn (EUR 50bn) in Q2 of 2016. Also, for the average (median) company,
more than EUR 75bn (EUR 40bn) of insurers’ liabilities are TPs, i.e. contractual
obligations to policyholders. Finally, the average (median) company, writes more than
EUR 3bn (EUR 1.3bn) GWP in Q1. The table also shows the cross-sectional distribution
of the discussed variables. The aggregate amounts (total of the sample) of total
assets, TPs and GWP are shown in the last column of Table 2.1.
Table 2.1: Summary statistics in EUR mn
Percentile average min 10th 25th median 75th 90th max total
Total
assets
92,485 40 16,373 23,852 50,803 98,590 200,639 691,882 7,768,705
TP 75,243 25 12,014 18,466 40,981 81,066 163,942 560,032 6,320,445
GWP 3,214 3 355 879 1,386 2,964 7,273 36,061 269,982
Source: EIOPA (sample based on 84 insurance groups in EEA)
Reporting reference date 30/06/2016 for Total assets and TP and 30/03/2016 for GWP
Insurance companies do different types of activities such as life and non-life business
and may insure directly or reinsure.12
11 The 84 insurance groups represent approximately 77 per cent of total assets of insurers subject to Solvency II.
12 A further breakdown is by lines of business. The Implementing Technical standards define twelve lines of business
for non-life companies in the reporting templates: 1) medical expense insurance 2) income protection insurance 3)
workers' compensation insurance 4) motor vehicle liability insurance 5) other motor insurance 6) marine, aviation and
transport 7) fire and other damage to property insurance 8) general liability insurance 9) credit and suretyship
insurance 10) legal expenses insurance 11) assistance and 12) miscellaneous financial loss. For life insurance
companies, there are six lines of business 1) health insurance 2) insurance with profit participation 3) index-linked and
unit-linked insurance 4) other life insurance 5) annuities stemming from non-life insurance contracts and relating to
health insurance obligations and 6) annuities stemming from non-life insurance contracts and relating to insurance
obligations other than health insurance obligations.
26
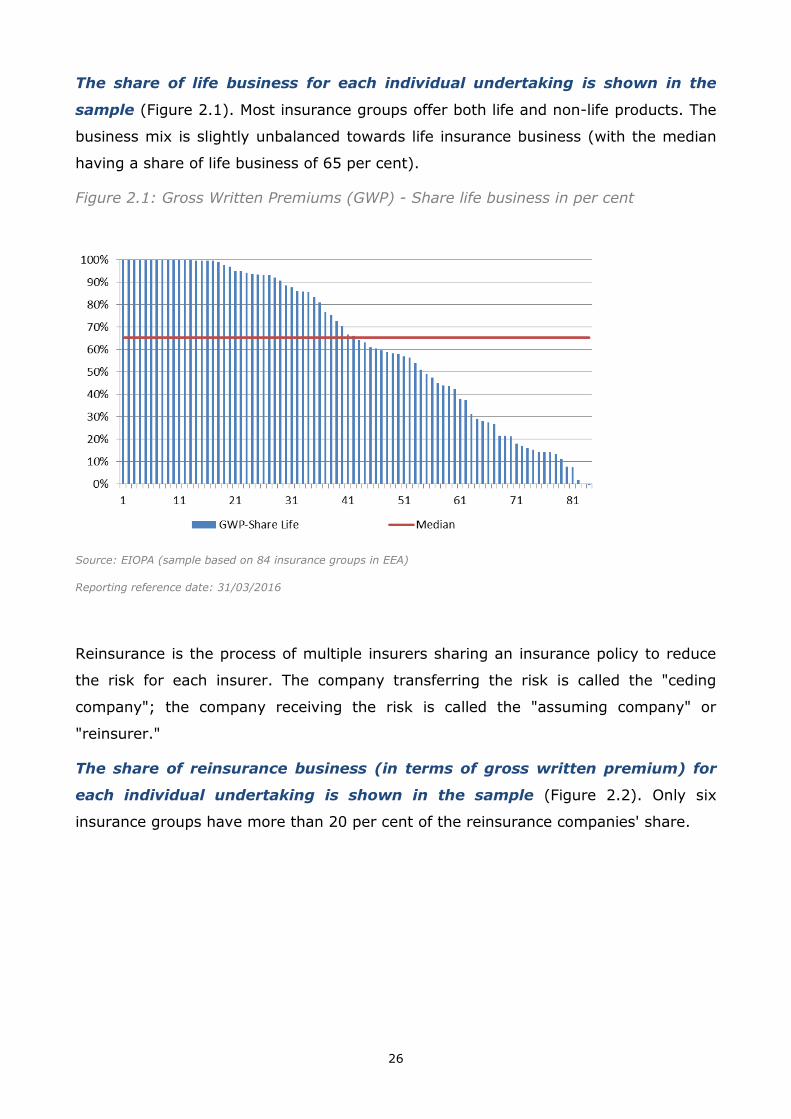
The share of life business for each individual undertaking is shown in the
sample (Figure 2.1). Most insurance groups offer both life and non-life products. The
business mix is slightly unbalanced towards life insurance business (with the median
having a share of life business of 65 per cent).
Figure 2.1: Gross Written Premiums (GWP) - Share life business in per cent
Source: EIOPA (sample based on 84 insurance groups in EEA)
Reporting reference date: 31/03/2016
Reinsurance is the process of multiple insurers sharing an insurance policy to reduce
the risk for each insurer. The company transferring the risk is called the "ceding
company"; the company receiving the risk is called the "assuming company" or
"reinsurer."
The share of reinsurance business (in terms of gross written premium) for
each individual undertaking is shown in the sample (Figure 2.2). Only six
insurance groups have more than 20 per cent of the reinsurance companies' share.

27
Figure 2.2: Gross Written Premiums (GWP) - Share reinsurance business in per
cent
Source: EIOPA (sample based on 84 insurance groups in EEA)
Reporting reference date: 31/03/2016
Based on the geographical location of the subsidiaries each group can be
classified into the categories domestic, European and global.13 From the groups
that report to Solvency II, about 11 per cent are domestic, 22 per cent European and
67 per cent global.
The size of the insurance sector varies substantially across countries (Figure
2.3). Liechtenstein and Luxembourg rank highest when total assets are used;
Bulgaria, Latvia, Lithuania and Romania rank lowest.14 The potential for growth is
hence more likely in countries with a low rate of total assets as a share of GDP in per
cent.
13 The classification is based on total assets, where all activities and not only the insurance activities are considered.
Note: if more than 90 per cent of subsidiaries' total assets are within the country, the group is domestic. If more than
90 per cent of the subsidiaries total assets are out the EEA, the group is global. The remaining companies are EEA
groups.
14 Listing of countries is in alphabetical order throughout the report.

28
Figure 2.3: Total Assets (TA) - Share of GDP in per cent
Source: EIOPA (sample based on 2600 solo undertakings in EEA)
Reporting reference date: 30/06/2016
The size of the insurance market and the business mix (i.e. life vs. non-life)
varies substantially across countries as well (Figure 2.4). Also Liechtenstein and
Luxembourg rank highest; Greece, Lithuania, Romania and Poland lowest.
The sale of life insurance products is particularly pronounced in countries
with high household wealth and income. These markets often benefit from
international customers. The price an insurance company can charge for a product or
line of business is influenced heavily by supply and demand for the type of coverage
on offer. Changes in tax rules, in legislation or in consumer preferences can herald a
considerable shift away from traditional life insurance. Life insurance policies can be
"pure insurance" products, savings products or a combination of both. The lines
between products become increasingly blurred and some insurers might be better
positioned than others to respond, by offering a product range which encompasses the
broader financial services market. In fact, recently increased taxation on premiums or
reduced tax incentives for long-term life and savings products contributing to
declining premium growth were observed in some countries.
0%
100%
200%
300%
400%
500%
600%
AT BE BG CY CZ DE DK EE ES FI FR GR HR HU IE IT LI LT LU LV MT NL NO PL PT RO SE SI SK UK

29
Figure 2.4: Gross Written Premiums (GWP) - Share of GDP in per cent
Source: EIOPA (sample based on 2600 solo undertakings in EEA). Annualised GWP
Reporting reference date: 30/06/2016
Life insurance contracts in some countries entail a market risk for the
insurance company in case they offer policyholders a guaranteed rate of
return. In order to meet these guarantees, the life insurance companies must choose
in their asset and liability management an asset mix that is the most appropriate for
both the structure and the characteristics of the associated liabilities, while
establishing a balance between the risks on the investment portfolio and the expected
rates of return.
The low interest rate environment fosters the evolution of business models
towards unit-linked investments, shifting investment risks to policyholders.
This changes the business model and increases competition between asset managers
and insurers. In addition, the life insurance market may be on the verge of growth.
Demographic changes coupled with low interest rates might lead to an increase in
European households' long-term savings. If current trends continue, then the growth
of unit-linked products may be even stronger.
The trend towards more unit-linked business is visible in the recent quarter
(Table 2.5). This notwithstanding, these products are more complex to both manage
and sell but the return is linked to the performance of global financial markets which
0
0.1
0.2
0.3
0.4
0.5
0.6
0.7
0.8
AT BE BG CY CZ DE DK EE ES FI FR GR HR HU IE IT LI LT LU MT NL NO PL PT RO SE SI SK UK
GWP-NonLife
GWP-Life

30
have slightly recovered in the first half of 2016. The insurance sector gradually lowers
or even removes overall guarantees on returns in some countries. Consequently, risks
related to longer-term returns on assets become largely allocated to policyholders.
Table 2.5: GWP-Life business: Unit-linked share
Percentile
Q1 (31/03/2016)
Percentage
Q2 (30/06/2016)
Percentage
10th 0.03 1.04
25th 1.63 4.53
median 14.46 16.58
75th 32.11 34.98
90th 70.53 62.10
average 22.34 24.92
Source: EIOPA, Reporting reference date: 30/06/2016
For life insurance companies the lapse rates have been growing to some
extent for the median company (Table 2.6). Several insurance undertakings have
introduced some penalties during stressed periods. The evolution of lapses will be
monitored carefully by EIOPA in the current low yield environment.
Table 2.6: Lapse rate
Percentile
Q1 (31/03/2016)
Percentage
Q2 (30/06/2016)
Percentage
10th 0.00% 0.00%
25th 0.23% 0.41%
median 0.85% 1.20%
75th 1.79% 2.31%
90th 5.76% 5.37%
Source: EIOPA, Reporting reference date: 30/06/2016
Other liquidity monitoring tools include reporting requirements, supervisory
on site and off site inspections. Insurance companies monitor their current
liquidity situation and funding condition which in turn is monitored by the insurance

31
regulator in each country. In addition, Global Systemically Important Insurers (G-
SIIs) have to develop Liquidity Risk Management Plans (LRMPs). Insurers using the
Matching Adjustment (MA) or the Volatility Adjustment (VA) also have to develop a
liquidity plan. In this context it should be mentioned that so far no significant liquidity
pressure have been observed. Hence, the liquidity risk for insurance companies
currently remains limited.
In terms of technical provisions, life insurance is by far the largest item per
business line (Figure 2.7). The Solvency II Directive requires that insurance and
reinsurance undertakings have processes and procedures in place that ensure the
appropriateness, completeness and accuracy of the data used in the calculation of
their TP.
Figure 2.7: Technical Provisions (TP) - by business line in per cent
Source: EIOPA (sample based on 2600 solo undertakings in EEA)
Reporting reference date: 30/06/2016

32
2.2. Profitability
Insurance companies face challenges arising from a prolonged period of low interest
rates. This applies especially to undertakings with a material exposure to life
insurance contracts with guarantees.
Long-term interest rates as for example 10-year government bond yields remain
historically low. The rising share of negative or low yielding debt securities and long
periods of such low interest rates could potentially harm the insurance sector and
render it more difficult to produce sufficient income to cover the current interest rate
guarantees (i.e. the risk gradually materializes over time). Eventually insurance
undertakings could struggle to generate adequate returns to meet their long-term
liabilities.
Maturing assets will have to be re-invested in order to match the cashflow
profiles of all outstanding liabilities, exposing the insurer to reinvestment
risk. If the low interest rate environment were to persist for a long time, this
reinvestment risk could materialise in the coming years, especially if the large
unrealised capital gains on bond portfolios are used for payouts in the short-run. Also,
if there is a lack of long-term (maturity over 10 years) fixed-income instruments, this
can pose a risk from an asset-liability matching point of view for life insurance
undertakings. Duration mismatches could be compounded by negative investment
spreads, if yields on long-term bonds fall below investment returns that have been
promised to policyholders. Such challenges have prompted concerns that by
squeezing returns, negative rates could incentivise insurance companies to take on
inappropriately risky assets.
In order to protect themselves against the effects of low interest rates on the
profitability, insurers need to boost returns. Insurance companies have various
tools to address the risks of persistently low interest rates. They can increase the
duration of their assets in order to ensure a better duration match between assets and
liabilities or they can alter the terms of new policies by lowering guarantees, thereby
lowering liabilities. In some countries, insurance groups currently sell their life
insurance subsidiaries or simply stop writing new business. The current low interest
rate environment and increased life expectancy simply poses challenges for life
insurance companies and pension funds that could worsen in the medium to long run.
The impact of low interest rates is heavily dependent on the business model. It is
expected to be the highest for small and medium sized life insurers with large

33
government bond portfolios and high guarantees to policyholders, especially where
contracts embed a long time to maturity.
In order to boost returns, insurance companies could also shift their asset
allocation towards more illiquid assets and higher-yielding (but lower-
quality) investments. New business increasingly aims at reducing risk, as seen in
the growth of unit-linked insurance or in the shift to more short-term life protection
business or biometrical products. The maximum interest rates on insurance contracts
are currently lowered in many countries in order to better reflect the current market
conditions. In this environment insurance companies could be encouraged to
excessive risk-taking, which could contribute over time to the formation of asset price
bubbles. However, increases in house and equity prices have thus far remained
moderate.
Article 132 of Solvency II introduces the "prudent person principle" which
determines how undertakings should invest their assets. The absence of
regulatory limits on investments does not mean that undertakings can take
investment decisions without any regard to prudence and to the interests of
policyholders.
The net Combined Ratio remains low for the median company across
business lines (Figure 2.8). However, the motor insurance segment faces industry-
wide pressures. In the short term, intense competition and higher expected claims are
likely to continue to constrain profitability, but in the long term the motor sector may
benefit from the usage of telematics data to help pricing the risk of a driver more
accurately. On the other hand, the sector may face several challenges such as the
introduction of driverless cars which will reshape the sector completely. Hence, the
profitability of this segment may be scrutinised in the future.

34
Figure 2.8: Net CR across business lines (in per cent; median, interquartile range and
10th and 90th percentile)
Source: EIOPA (sample based on 1601 solo non-life undertakings in EEA); Reporting reference data: 30/06/2016
In the current low yield environment maintaining profitability is getting more
and more difficult as reflected by market returns (Figure 2.9). The downward
trend, however, seems to have come to a halt in the last months, both for banks and
insurance companies alike.
Figure 2.9: Market Returns (Index: 2007=100)
Source: Bloomberg; Last observation: 15/11/2016
0
20
40
60
80
100
120
Jan
-10
Ap
r-1
0
Jul-
10
Oct
-10
Jan
-11
Ap
r-1
1
Jul-
11
Oct
-11
Jan
-12
Ap
r-1
2
Jul-
12
Oct
-12
Jan
-13
Ap
r-1
3
Jul-
13
Oct
-13
Jan
-14
Ap
r-1
4
Jul-
14
Oct
-14
Jan
-15
Ap
r-1
5
Jul-
15
Oct
-15
Jan
-16
Ap
r-1
6
Jul-
16
Oct
-16
STOXX EUROPE 600 STOXX EUROPE 600 Insurance
STOXX EUROPE 600 Banks
35
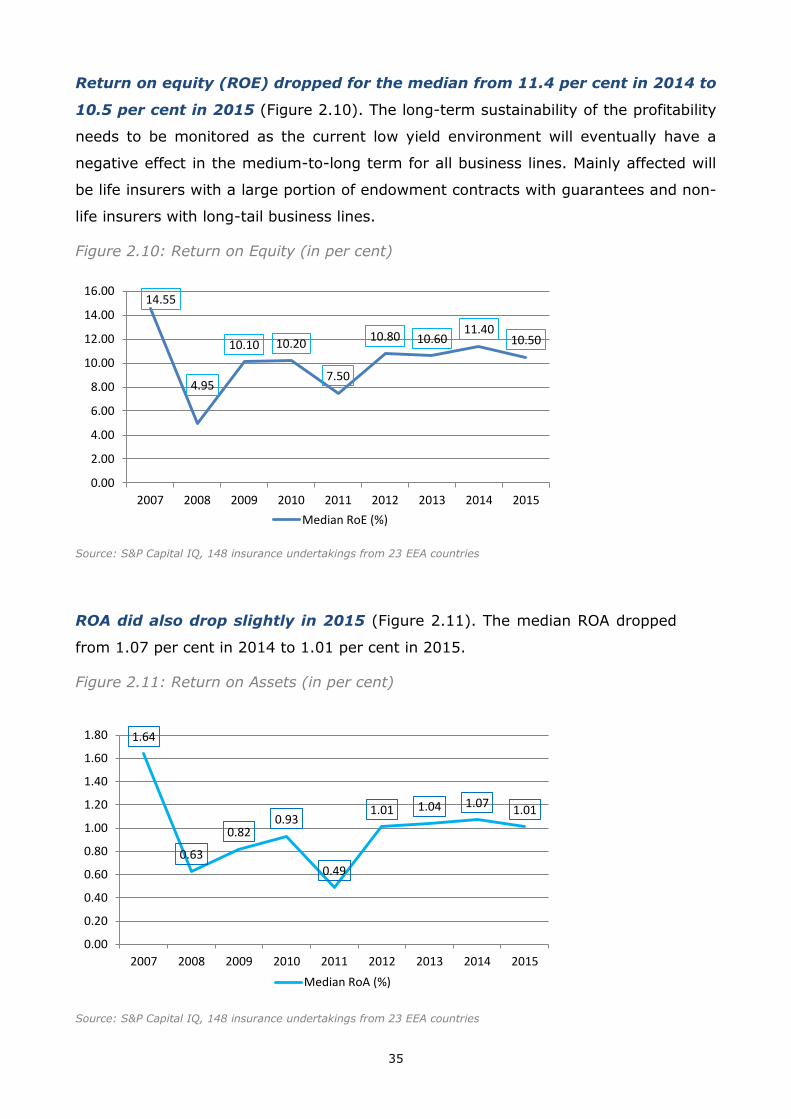
Return on equity (ROE) dropped for the median from 11.4 per cent in 2014 to
10.5 per cent in 2015 (Figure 2.10). The long-term sustainability of the profitability
needs to be monitored as the current low yield environment will eventually have a
negative effect in the medium-to-long term for all business lines. Mainly affected will
be life insurers with a large portion of endowment contracts with guarantees and non-
life insurers with long-tail business lines.
Figure 2.10: Return on Equity (in per cent)
Source: S&P Capital IQ, 148 insurance undertakings from 23 EEA countries
ROA did also drop slightly in 2015 (Figure 2.11). The median ROA dropped
from 1.07 per cent in 2014 to 1.01 per cent in 2015.
Figure 2.11: Return on Assets (in per cent)
Source: S&P Capital IQ, 148 insurance undertakings from 23 EEA countries
14.55
4.95
10.10 10.20
7.50
10.80 10.6011.40
10.50
0.00
2.00
4.00
6.00
8.00
10.00
12.00
14.00
16.00
2007 2008 2009 2010 2011 2012 2013 2014 2015
Median RoE (%)
1.64
0.63
0.820.93
0.49
1.01 1.04 1.071.01
0.00
0.20
0.40
0.60
0.80
1.00
1.20
1.40
1.60
1.80
2007 2008 2009 2010 2011 2012 2013 2014 2015
Median RoA (%)

36
2.3. Solvency
The Solvency II framework implies a completely different approach to assessing the
solvency of insurance undertakings as compared to the Solvency I regime that was
applicable up to the beginning of 2016. Following the introduction of Solvency II,
several insurance companies have been taking measures to improve their capital
positions and optimize their asset and liability profile. In Europe, solvency concerns
can arise for European life insurers due to guaranteed policy pay-outs exceeding
investment yields, and long asset liability duration mismatches. In order to properly
consider an insurance undertaking’s solvency position, it is necessary to evaluate its
assets and liabilities.
Before Solvency II came into force, insurance companies built up their
capital positions (Figure 2.12). In the two years prior to the introduction of
Solvency II, insurance undertakings built up capital.
Figure 2.12: Total Equity(in EUR mn)
Source: S&P Capital IQ, 148 insurance undertakings from 23 EEA countries
Insurance companies are required to hold eligible own funds at least equal to
their respective Solvency Capital Requirement (SCR) at all times in order to
avoid supervisory consequences with various levels of severity. A common
reference is to measure the amount of assets over liabilities. Insurance companies
must have own funds available to cover any unexpected losses that might incur. Own
funds therefore ensure that policyholders' claims against the insurers are covered

37
even under adverse circumstances. The solvency of an insurance company is deemed
sufficient if the level of own funds meets at least the required solvency margin (own
funds requirements).
An adequate level of capital will ensure proper protection of the
policyholders and beneficiaries. Insurance companies should calculate the SCR at
least once a year according to the standard formula or by applying a (full or partial)
internal model. The SCR calculated on the basis of the standard formula is the sum of
the Basic Solvency Capital Requirement, the capital requirement for operational risk
and the adjustments for the capacity to absorb unexpected losses of technical
provisions and deferred taxes
Under the Solvency II regime, total assets and liabilities have to be
calculated at market or market-consistent values, with a company’s own
funds being defined as the difference between the assets and liabilities at
market value. Therefore, the estimated value of the technical provisions will be high,
when market interest rates are low. Insurance companies’ liabilities are mainly
technical liabilities (for which market values as such are not available). The value of
these reserves is arrived at by calculating the present value of the incoming and
outgoing cashflows on the basis of the discount rate. This discount rate is a risk-free
rate on the basis of market swap rates with maturities of up to 20 years, currently
extrapolated to the ultimate forward rate of 4.2 per cent for maturities beyond
20 years.15
As of June 2016, all of the insurance groups reported sufficient SCR coverage
(Figure 2.13). The SCR coverage ratio for the median non-life insurance company is
210 per cent and is approximately equal for life companies (209 per cent) and for
undertakings pursuing both life and non-life business (201 per cent). While the sector
overall seems well positioned for Solvency II capital requirements, the analysis of the
solvency margins also revealed that some insurance companies, typically smaller
ones, in some European countries were not adequately capitalised.
15 See chapter 2.4 in this report for more information on regulatory developments

38
Figure 2.13: SCR coverage ratio (in per cent; median, interquartile range and 10th
and 90th percentile)
Source: EIOPA (sample based on 2600 solo insurance undertakings in EEA)
Reporting reference data: 30/06/2016
As of June 2016, the SCR coverage ratio by country was sufficient for the EEA
average (Figure 2.14). However, the 10th per centile of Malta, Poland and Romania is
loss making at county level.

39
Figure 2.14: SCR coverage ratio by country (in per cent; median, interquartile
range and 10th and 90th percentile)
Source: EIOPA (sample based on 2600 solo insurance undertakings in EEA)
Reporting reference data: 30/06/2016
In order to smooth the transition towards the new regulatory framework, Solvency II
has put in place transitional measures.
Most undertakings made use of both transitional measures and volatility
adjustments in their ratio calculations. This means that some insurance
companies, with the consent of the supervisory authority, may apply transitional
measures that extend the period of adaptation to the Solvency II requirements for as
long as 16 years. Also, volatility stemming from interest rate changes is an
impediment to comparing individual SCR ratios. Detailed knowledge about the
assumptions underlying the ratios is a prerequisite to gauging the financial strength
based on Solvency II results. Insurers put transitionals in place for derisking balance
sheets and increasing capital.
50%
150%
250%
350%
450%
550%
AT
BE
BG CY
CZ
DE
DK EE ES EU FI FR GR
HR
HU IE IT LI LT LU LV MT
NL
NO PL
PT
RO SE SK SL UK

40
Several LTG and transitional measures have been introduced in Solvency II in
order to allow a smooth transition. This could lead to a gradual increase of
solvency needs (as the effect of the transitional measures is gradually lowered over
time).
On the other hand, the use of the transitional measures or volatility
adjustments reduces the comparability of Solvency II results. A deterioration
in equity markets could result in a number of potential issues impacting capital. These
could arise in the form of credit defaults and equity impairments. Widening credit
spreads are not a problem per se, but, if seen to a major extent, these issues could
hit capital materially as they increase the denominator of the Solvency II ratio (i.e.
capital requirements) and decrease the numerator (i.e. available capital). In such a
scenario, Solvency II ratios could decline faster than the rates suggested in reported
sensitivities, as the latter tend to only reflect spread movements. There is some
uncertainty about how companies would cope with a stress situation.
2.4. Regulatory developments
After the entry into force of Solvency II on 1st January 2016, insurance and
reinsurance undertakings have started to report to their National Competent
Authorities (NCAs) according to the new regime. The templates for the submission of
information to the supervisory authorities according to Solvency II have been
amended by Commission on 20th October 2016 in order to make the necessary
adaptations following the amendments of the Solvency II Delegated Regulation
adopted in April 2016; in particular the templates have been amended in order to
ensure that supervisors collect all the relevant information concerning qualifying
infrastructure investments made by insurance and reinsurance undertakings as well as
investments in European Long-Term Investment Funds (ELTIFs) and equities traded
on multilateral trading facilities (MTFs).
On 9th September 2016 Commission has adopted the implementing technical
standards (ITS) with regard to the procedures for the application of the
transitional measure for the equity risk sub-module in Article 308b (13) of
the Solvency II Directive. Since the transitional measure applies to equities
purchased on or before 1 January 2016, the IT'S refer to the procedure to be followed
by insurance and reinsurance undertakings for the appropriate identification and
documentation of those equities.

41
Furthermore, on 11th October 2016 Commission has adopted the ITS with
regard to the allocation of credit assessments of external credit assessment
institutions to an objective scale of credit quality steps. For the purposes of the
calculation of the solvency capital requirement, credit assessments of external credit
assessment institutions (ECAIs) are allocated to an objective scale of seven credit
quality steps, from zero to six.
In April 2016, EIOPA published a Consultation Paper on the methodology for
deriving the Ultimate Forward Rate (UFR) and its implementation. EIOPA will
provide an update of the UFR at the end of December 2016.
Furthermore, EIOPA published changes to the relevant financial instruments
used to derive the Risk Free Rate (RFR). EIOPA will implement these changes for
the calculation of the RFR at the end of December 2016.
As part of the process of post-evaluation of the new insurance supervisory
regime, EIOPA has received on 18th July 2016 a call for technical Advice
from the Commission for the review of the Solvency Capital Requirement
(SCR) standard formula. This call has two priorities: simplifications and
proportionate application of the SCR requirements as well as the removal of technical
inconsistencies, i.e. recalibration of certain risks and other technical issues. The
Commission have requested the technical advice of EIOPA in preparation of the review
of the Solvency II Delegated Regulation which is expected to be carried out in 2018.
Following the adoption of the Insurance Distribution Directive (IDD) in
January 2016, EIOPA published on 13th April 2016 the Preparatory
Guidelines on Product Oversight and Governance arrangements
(POG). Insurers (manufacturers of insurance products) and distributors need to
follow these arrangements, including requirements such as the appropriate
identification of the group of consumers for whom each product is designed (the
“target market”). Also products are aligned with the relevant interests and objectives
of the target market in this context as is the usage of appropriate distribution
channels. The preparatory Guidelines provide early guidance and support NCAs and
market participants with the implementation of POG requirements in preparation for
formal requirements provided for in the Directive and to be further specified in the
delegated acts.

42
In this regard, EIOPA received from the Commission on 24th February 2016 a
request for technical advice on possible delegated acts concerning the IDD.
These delegated acts are expected to be approved in 2017 including provisions
regarding POG as well as conflicts of interest, inducements, assessment of suitability
and appropriateness and reporting.