2 relationships using design of experiment...
TRANSCRIPT

1
Plasma Sprayed Hydroxyapatite Coatings: Understanding Process 1
Relationships using Design of Experiment Analysis 2
3
Tanya J. Levingstone 1,2,3,4, Malika Ardhaoui5, Khaled Benyounis1,2,3, Lisa Looney 4
1,2,3, Joseph T. Stokes 1,2,3 5
6
1National Centre for Plasma Science and Technology, Dublin City University, Dublin 7
Ireland 8
2Centre for Medical Engineering Research, Dublin City University, Dublin Ireland 9
3 School of Mechanical and Manufacturing Engineering, Dublin City University, Dublin 10
9, Ireland. 11
4Tissue Engineering Research Group, Dept. of Anatomy, Royal College of Surgeons in 12
Ireland, 123 St. Stephen’s Green, Dublin 2, Ireland. 13
5Surface Engineering Research Group, School of Electrical, Electronic and Mechanical 14
Engineering, University College Dublin, Belfield, Dublin 4, Ireland. 15
16
Corresponding Author: 17
Dr. Tanya Levingstone 18
Tissue Engineering Research Group, 19
Dept. of Anatomy, Royal College of Surgeons in Ireland, 20
123 St. Stephen’s Green, 21
Dublin 2, Ireland. 22

2
Abstract 24
The biocompatibility and osteoconductivity of hydroxyapatite (HA) coatings have led to 25
their use in a wide range of applications in dentistry and orthopaedics. One such application 26
is for the uncemented fixation of implants, where coatings are commonly applied to 27
titanium implants using a plasma thermal spraying process. The spraying process is 28
affected by a large number of parameters leading to highly complex process – property – 29
structure relationships. In a step forward from one-at-a-time analyses, this study used 30
Design of Experiment (DOE) methodology to investigate the simultaneous effects of key 31
plasma spray process parameters on hydroxyapatite coatings for biomedical applications. 32
The effects of five plasma spray process parameters (current, gas flow rate, powder feed 33
rate, spray distance and carrier gas flow rate) on the roughness, crystallinity and purity of 34
hydroxyapatite coatings was determined using a fractional factorial design. The results of 35
this study enabled identification of consistent and competing influences within the process 36
and the identification of some first order interactions. In particular, the diffuse particle size 37
of the HA feedstock powder was found to influence the responses observed within the 38
parameter range investigated. The roughness of HA coatings was found to relate to the 39
particle velocity and the degree of particle melting occurring, withhigher coating roughness 40
resulting when current was high, gas flow rate was low and powder feed rate was high. 41
Highest coating crystallinity resulted at high current, low spray distance and low carrier 42
gas flow rate. Under these conditions deposition of larger HA particles resulted leading to 43
higher amounts of bulk crystalline material and the low spray distance increased the 44
substrate temperature allowing amorphous material to recrystallise. Coating purity relates 45
directly to thermal decomposition of the particles within the plasma jet with a high purity 46

3
coating resulting at low particle temperatures i.e at the lower ranges of powder feed rate, 47
spray distance and carrier gas flow rate. This study thus brings greater clarity on the effects 48
of plasma spray process parameters on the properties of resultant hydroxyapatite coatings. 49
50
Keywords 51
Plasma spraying, hydroxyapatite, Design of Experiment (DOE) 52
53
1. Introduction 54
Hydroxyapatite (HA; Ca10(PO4)6(OH)2) is a bioceramic with a composition similar to that 55
of the mineral component of bone. It is biocompatible and osteoconductive, allowing the 56
growth on bone cells on its surface [1, 2, 3, 4, 5]. As a result of its favourable biological 57
properties it has been used successfully for many applications in dentistry and 58
orthopaedics. One such application is as a coating applied to hip implants, where it provides 59
implant fixation. The most commonly used method for the production of HA coatings is 60
the atmospheric plasma spraying (APS) process [6, 7]. This is a thermal spray process in 61
which powder particles are melted in a plasma jet and propelled towards the substrate 62
material. The process involves passing a readily ionised gas through an electric arc, formed 63
between a cathode and an anode, resulting in the formation of a plasma jet. The plasma 64
formed is unstable and quickly recombines releasing a large amount of thermal energy. 65
Particles are fed into this high temperature jet, melted and propelled at high velocities 66
towards the substrate. Temperatures involved can potentially be in excess of 15,000°C 67
depending on the selected process parameters [8,9,10]. The process has been used for many 68
4
years to apply of a variety of coatings used to protect surfaces from severe harsh 69
environments, such as, wear, corrosion and thermal effects. 70
71
Atmospheric (air) plasma spraying (APS) is a complicated process, affected by as many as 72
50 parameters, and for this reason the process - property – structure relationship are still 73
not fully understood [11,12]. Clinically, HA coated implants have been found to remain 74
functional in vivo for up to 15 years [13]. HA coatings are naturally resorbed in the body, 75
releasing calcium and phosphorus ions needed to enable replacement of the coating by 76
ingrowing bone tissue over time; however, delamination or rapid dissolution due to coating 77
instability can lead to short-term implant failure [2, 14,15]. The stability of HA coatings 78
has been shown to be largely affected by its crystallinity and purity [3]. Highly amorphous 79
coatings dissolve more quickly leading to the rapid weakening and disintegration of the 80
coating [3,16]. Coatings with a high degree of crystallinity have lower dissolution rates and 81
are thus more stable in vivo [11]. The production of HA coatings using APS has added 82
complexities relating to the decomposition of HA at high temperatures leading to the 83
formation of less stable calcium phosphate phases, such as α-tricalcium phosphate (α-84
TCP), β-tricalcium phosphate (β-TCP), tetracalcium phosphate (TTCP) and calcium oxide 85
(CaO) [17-20]. Control over the phase purity of HA coatings is thus critically important. 86
In terms of requirements for biomedical applications, ISO standards for hydroxyapatite 87
coatings specify a requirement for a crystallinity of > 45 % and a purity of > 95 % [21]. In 88
addition, early biological responses to HA coatings are influenced by the surface roughness 89
of the coating which affects osteoblast cell attachment and thus bone growth on the coating 90
once it is implanted into the body. Whereas fibroblasts and epithelial cells prefer smoother 91

5
surfaces, osteoblasts attach and proliferation better on rough surfaces [22, 23]. It is thus 92
clear that in order to improve implant life, the tayloring of the properties of HA coatings 93
is necessary [24, 25]. This can only be achieved through a clearer understanding of the 94
spraying process. 95
96
Numerous studies have investigated the effects of varying process parameters on various 97
properties of HA coatings [6, 25-37]. Contradictions exist within the literature, for 98
example, increased power or current was found by Tsui et al. [30] and Sun et al. [28] to 99
lead to a decrease in the purity and crystallinity of HA coatings. However, Yang et al. [31] 100
found crystallinity to increase with increasing spray current. Dyshlovenko et al. [38-39] 101
and Cizek and Khor [40] report net power to have the greatest influence on crystallinity. 102
One method that has been successfully used in order to establish the relationship between 103
process parameters and the properties of a resultant coating is the Design of Experiment 104
(DOE) technique. DOE studies of a variety of plasma sprayed coatings have been carried 105
out, including alumina [11, 41], titanium dioxide [42, 43], zirconia [44, 45], titanium nitride 106
[46] and alumina-titania [11, 47]. DOE experimental techniques have also been applied in 107
the investigation of the complex process relationships involved in plasma sprayed 108
hydroxyapatite coatings [39-40, 48-53]. While these studies have brought about some 109
clarity to the relationships between the spray process parameters and resultant HA coating 110
properties, further understanding of these relationships is required. In this study, a Design 111
of Experiment (DOE) methodology has been used in order to gain additional understanding 112
of parameter interaction and desirable parameter ranges for plasma spraying of HA 113
coatings. The specific objectives of the study were to assess the effects of varying five 114

6
process parameters: current (A), gas flow rate (B), powder feed rate (C), spray distance (D) 115
and carrier gas flow rate (E), on the crystallinity, purity and roughness of plasma sprayed 116
hydroxyapatite coatings; key properties that influence coating stability and cellular 117
response upon implantation. 118
119
2. Experimental Methods 120
2.1. Materials 121
Titanium alloy, Ti6Al4V, was selected as the substrate material in this study as it is 122
typically used in femoral implants as the receiving substrate for HA coatings. Discs, 10 mm 123
in diameter with a thickness of 2 mm, were used. The discs were grit-blasted prior to 124
spraying at a pressure of 5 bars and an angle of incidence of 75°, using pure white 125
aluminium oxide (Al2O3) grit with a particle size of 500 µm (mesh 36), selected due to its 126
biocompatibility. After grit blasting, loose grit particles were removed using high pressure 127
air. The discs were then cleaned for 5 mins in an ultrasonic cleaner. The average surface 128
roughness (Ra) of the discs was determined, using the Surftest 402 surface profilometer, to 129
be approximately 3.2 µm. 130
131
The HA powder used for the coating process was Captal 60-1 Thermal Spraying HA 132
powder (Plasma Biotal Ltd, UK). This powder is reported by the manufacturer to have an 133
average particle size of 45 µm. Particle size analysis was carried out using the Malvern 134
Mastersizer particle size analyser to determine the particle size distribution. Powder 135
morphology was examined using scanning electron microscopy (SEM) (LEO 440 Stereo 136
Scan, Leica, UK), using a current of 150 pA, accelerating voltage of 15 KeV and a 137
7
magnification range of 50-200 x. The surface area of the powder was determined using 138
Micromeritics GEMINI BET surface area analyser (Georgia, USA). Powder particle 139
density was determined using the Helium Pycnometer (Micromeritics, Georgia, USA). 140
141
2.2. Experimental Design 142
The experiment was designed using the statistical software, Design-Expert 7.0 (Stat-Ease 143
Inc., Minneapolis, USA). A ¼ fraction fractional factorial design (25-2 design) was used to 144
investigate the effect of various process parameters (factors) on the properties of HA 145
coatings. Five factors were investigated, current (A), gas flow rate (B), powder feed rate 146
(C), spray distance (D) and carrier gas flow rate (E). Two levels were selected for each 147
parameter, based on parameters levels that are currently reported in literature (N1-N8) [26-148
31, 39, 50, 54]. In addition, three centre point experiments were included to provide a 149
measure of process stability and inherent variability while also checking for curvature (N9- 150
N11). The parameter ranges selected are detailed in Table 1. The design consisted of 11 151
experiments, details of which are given in Table 2. The experiments were carried out in 152
random order to ensure that systematic errors did not influence the results. 153
154
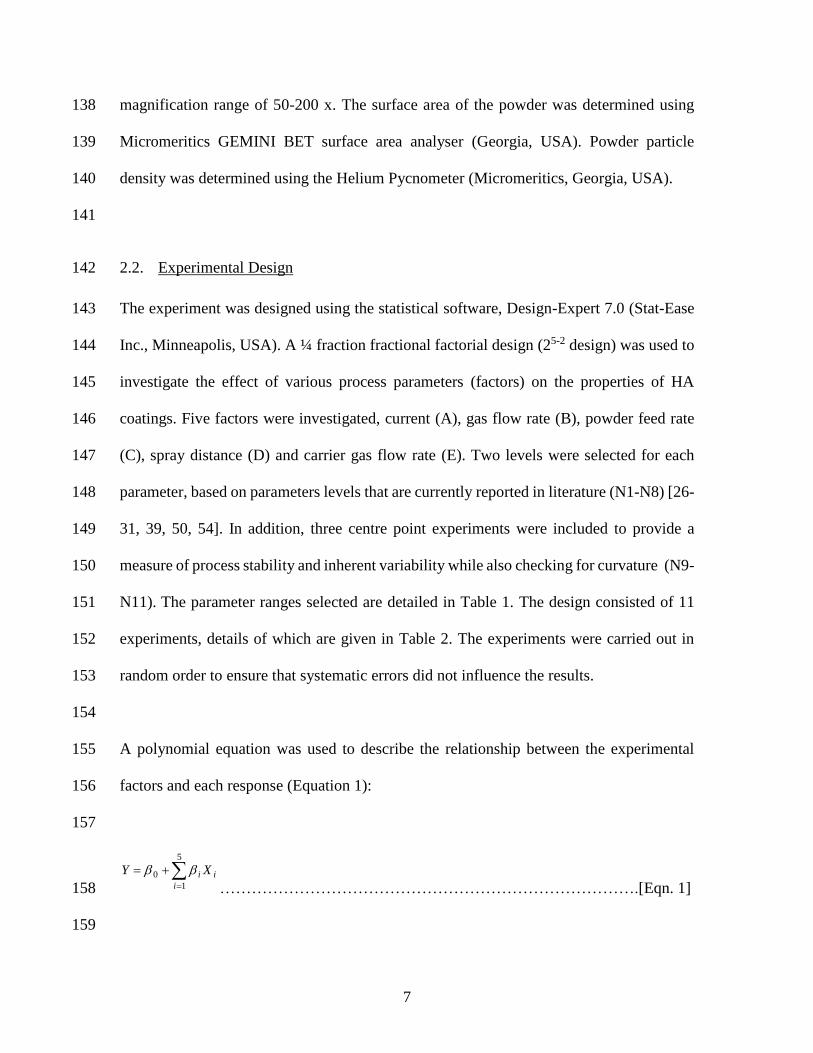
A polynomial equation was used to describe the relationship between the experimental 155
factors and each response (Equation 1): 156
157
i
i
i XY
5
1
0
…………………………………………………………………….[Eqn. 1] 158
159

8
where Y is the response, β0 is the mean value of the response, βi represents the coefficient 160
of the variable Xi. 161
162
The results obtained from the study were analysed using the Design Expert software. The 163
main affects on each response were modelled using the backward selection method to 164
elimate insignificant terms (P-value ≤ 0.01). The analysis of variance (ANOVA) test was 165
used to determine the statistical significance of the developed equations. Statistical 166
measures, R2, Adjusted R2, Predicted R2 and Adequate Precision, were used to determine 167
the adequacy of the resultant equations. The most important of these measures is the R2 168
value, which is a number between 0 and 1 and should be greater than 0.6 in order to indicate 169
an adequate equation [55]. 170
171
2.3. Plasma Spraying 172
Plasma thermal spraying was carried out using a Sulzer Metco 9MB plasmatronfitted with 173
a 3M7-GH nozzle (Sulzer Metco, Winterthur, Switzerland). High purity argon was used as 174
both the plasma forming gas and the powder carrier gas. No secondary gas was used. A 175
traverse speed of 38 mm/s and a spray time of 35 s were used for all coatings, resulting in 176
15 passes of the spray gun. Coatings were sprayed according to the experimental matrix 177
described in Table 2. 178
179

9
2.4. Coating Characterisation 180
Three responses were measured, roughness, crystallinity, and purity. Surface roughness, 181
Ra, was measured using the Surftest 402 surface profilometer (Mitutoyo, Michigan, US). 182
Four measurements were taken for each sample, with the sample orientation changed 183
between each measurement. The surface morphology of each coating was also examined 184
using the LEO 440 Stereo Scan Scanning Electron Microscope, using a current of 150 pA, 185
accelerating voltage of 15 KeV and a magnification range of 50-200 x. The crystallinity 186
and purity of HA coatings were determined from X-ray diffraction patterns, obtained using 187
the Bruker D-8 Advance Diffractometer (Coventry, UK) with a copper anode. A locked-188
couple scan was carried out between 20 and 60º 2θ. An increment of 0.02 and a scan speed 189
of 5 sec/step were applied. 190
191
The % crystallinity was calculated by comparing the crystalline area of the XRD pattern to 192
the total XRD pattern area, using Equation 2 [28, 30, 56, 57]. The % purity was calculated 193
by comparing the impurity area to the total crystalline area, using Equation 3. The areas 194
used for the crystallinity and purity calculations were identified and measured using the 195
curve fitting function in the Bruker Diffract Plus EVA software (Bruker AXS, UK). 196
Crystallinity and purity measurements were repeated three times for each coating. 197
198
100(%) xA
AityCrystallin
T
C
……………………………………………………….[Eqn. 2] 199
200

10
where AT is the area under the total diffraction pattern and AC is area under the diffraction 201
pattern once the amorphous part of the pattern has been removed using the curve fitting 202
function in the Bruker Diffract Plus EVA software (Bruker AXS, UK).. 203
204
100(%) xA
APurity
C
I
……………………………………………………………...[Eqn. 3] 205
206
where AC is the crystalline area from the diffraction pattern and AI is the total impurity 207
area, i.e. the sum of the areas of the peaks between 29º 2θ and the base of the tallest HA 208
peak (2 1 1 peak). 209
210
3. Results 211
3.1. Powder Characterisation 212
The initial HA powder was found to have an irregular morphology, as can be seen from 213
the micrograph in Fig. 1. The particle size analysis results, shown in Fig. 2, indicate that 214
the size of the particles fall within two separate clusters, one between 0.1 and 1.0 μm and 215
the other between 10 and 100 μm. The mean particle size of the HA powder was found, 216
from the laser particle size analysis, to be 38.3 µm. The average density of the powder 217
sample was found using helium pycnometry to be 3.28 g/cm3. The surface area of the 218
powder was found using BET surface area analysis to be 0.4640 m2/g. The HA powder had 219
a crystallinity of 99.96 %. From analysis of the XRD pattern the powder contained 99 % 220
pure HA (JCPDS 9-0432) with a trace amount of tetracalcium phosphate (TTCP, JCPDS 221
25-1137). 222

11
223
3.2. Measured Responses 224
Following spraying, each of the resultant coatings was inspected. The measured responses 225
for each experimental run (N1 – N11) are given in Table 3. The coating from run N1 was 226
very thin, with the substrate visible through the coating and thus crystallinity and purity 227
measurements for this sample could not be obtained. In addition, the measured roughness 228
values were very low and were not included in the analysis. The crystallinity and purity 229
measurements for coating N10 were much lower than those of all other coatings and it was 230
thus deemed to be an outlier and was not included in the analysis. The centre point 231
experiments (N9 and N11) showed good process reliability. The surface roughness (Ra) of 232
the coatings was found to vary between 6.2 ± 0.7 µm (N3) and 13.4 ± 0.7 µm (N6). 233
Micrographs of the coatings with the lowest (N3) and highest (N6) Roughness are shown 234
in Fig. 3. The % crystallinity ranged from 65.2 % (N5) to 87.6 % (N2). The XRD patterns 235
for coatings with the lowest (N5) and highest (N2) crystallinity are shown in Figure 4. 236
Micrographs of coatings N5 and N2 are shown in Figure 5 (a) and (b) respectively. The % 237
purity was found to range between 95.5 % (N8) and 99.4 % (N2). The XRD patterns for 238
the coatings with the lowest (N8) and highest (N2) purity are shown in Fig. 6. Overall, all 239
coatings met the > 45 % crystallinity and > 95 % purity required by ISO 13779-2:2000 240
(Implants for surgery- Hydroxyapatite. Coatings of hydroxyapatite) [21]. 241
242

12
3.3. Roughness 243
Roughness was found to be significantly affected by three factors: current (A), gas flow 244
rate (B) and powder feed rate (C) (P-value ≤ 0.01), with highest roughness resulting at high 245
current, low gas flow rate and high powder feed rate. The regression equation for roughness 246
is presented in Table 4, expressed in terms of coded factors in Equation 4 and actual factors 247
in Equation 5. The coded factors equation uses the coded low and high levels (-1 and 1) 248
from the experimental design, whereas the actual equation incorporates the numerical 249
differences between the factors in the equation. It can be seen from the coded factors 250
equation (Equation 4), that current has the greatest affect on roughness, followed by gas 251
flow rate and powder feed rate. The predicted vs. actual graph (Fig. 7a), shows that the 252
actual experimental values closely fits the values predicted by the equation, represented as 253
a straight line in the graph. The statistical measures, summarised in Table 5, indicate the a 254
good fit of the data to the equation. 255
256
257
3.4. Crystallinity 258
Statistical analysis of the results showed that the crystallinity of the coating was 259
significantly affected by the current (A), spray distance (D) and carrier gas flow rate (E) 260
(P-value ≤ 0.01). The regression equation for crystallinity is presented in Table 4, 261
expressed in terms of coded factors in Equation 6 and actual factors in Equation 7. Current 262
was found to have the greatest effect, followed by carrier gas flow rate and then spray 263
distance, with highest crystallinity at high current, low spray distance and low carrier gas 264

13
flow rate. The statistical measures summarised in Table 5 and predicted vs. actual graph 265
for crystallinity, (Fig. 7 b), indicate a good fit of the data to the equation. 266
267
268
269
3.5. Purity 270
Statistical analysis of the results showed that the purity of the coating was significantly 271
affected by the powder feed rate, spray distance and carrier gas flow rate (P-value ≤ 0.01). 272
The regression equation for purity is presented in Table 4, expressed in terms of coded 273
factors in Equation 8 and actual factors in Equation 9. Powder feed rate was found to have 274
the greatest effect, followed by spray distance and carrier gas flow rate, with the highest 275
purity reported at low powder feed rate, low spray distance and low carrier gas flow rate. 276
The statistical measures summarised in Table 5 and predicted vs. actual graph for 277
crystallinity, (Fig. 7 c), indicate a good fit of the data to the equation. 278
279
280
4. Discussion 281
The plasma thermal spraying process is affected by a large number of parameters including 282
current, gas flow rate, powder feed rate, spray distance and carrier gas flow rate. While 283
there are a range of factors influencing the process, on a mechanistics level, each of these 284
parameters ultimately influence two key aspects; the degree of particle melting within the 285
plasma jet and the velocity at which particles impact the substrate surface. Thus the 286
14
influence that each process parameter has on particle melting and particle velocity 287
ultimately determines the properties of the coatings produced. The plasma sprayed coatings 288
produced at the parameter ranges investigated in this study resulted in coatings with widely 289
varying roughness, purity and crystallinity results. Overall, the study showed that while 290
good quality coatings, with suitable roughness, crystallinity and purity values were 291
achieved in experiments N2 to N8, the process settings for experiment N1 did not enable 292
deposition of a coating that fully covered the substrate. Thus, for further studies it is 293
recommended that the parameter range be modified to ensure adequate melting of the 294
particles within the plasma jet. 295
The roughness of HA coatings produced here ranged between 6.15 μm and 13.4 μm, similar 296
to those reported by Cizek and Khor [40]. Roughness is known to relate to the particle 297
velocity and the degree of particle melting occurring. In this study it was found that high 298
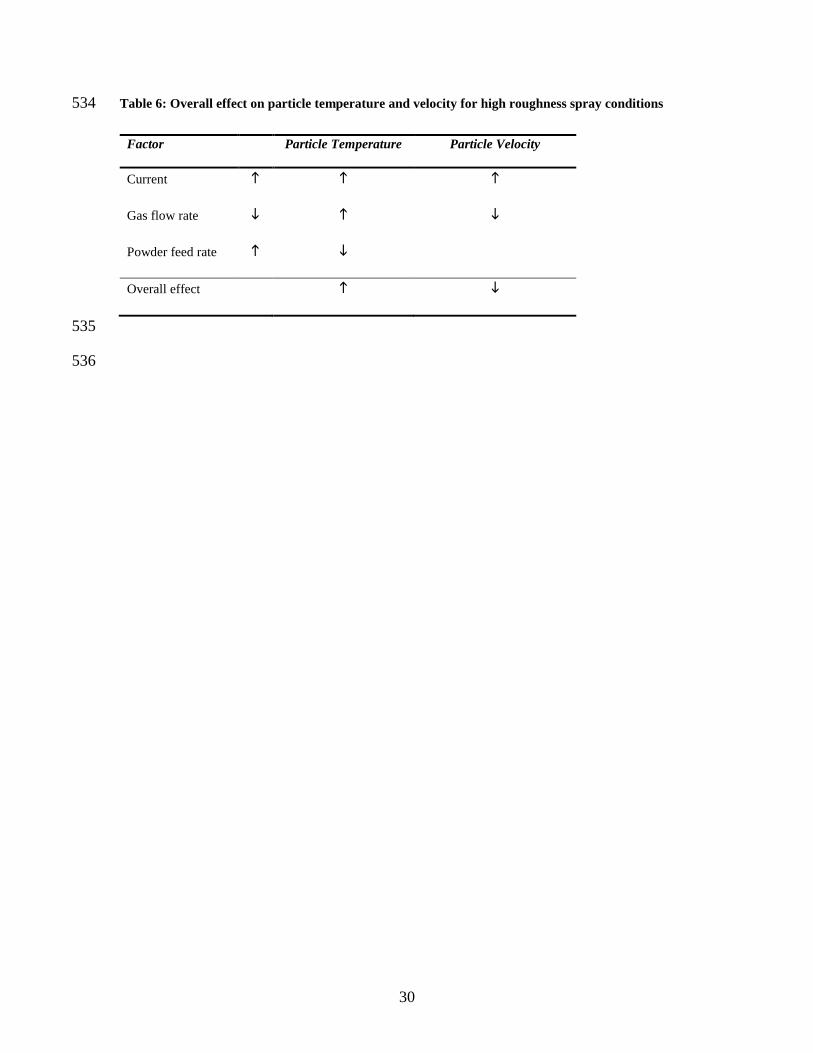
roughness results when the current is high, gas flow rate is low and powder feed rate is 299
high, with the overall effect of these parameters for the high roughness condition leading 300
to increased particle temperature and decreased particle velocity (Table 6). Cizek and Khor 301
reported a similar occurrence with rougher coatings demonstrating individual splat 302
morphologies being formed when particle temperatures were higher [40]. However, these 303
results were contrary to findings reported in other studies [28, 58], where conditions that 304
generally lead to increased particle temperatures were seen to result in lower coating 305
roughness. It was observed from particle size analysis, that the size of the HA particles fall 306
within two separate clusters, one between 0.1 and 1.0 μm and the other between 10 and 307
100 μm. Thus at the low roughness condition only the smaller powder particles are melted, 308
larger particles remain unmelted and bounce off the surface of the substrate rather than 309
15
being deposited onto it. At the high roughness condition all particles are melted and thus 310
the larger particles are incorporated into the coating rather than bouncing off it, resulting 311
in a greater degree of coating roughness. Low particle velocity resulting at the high 312
roughness condition leads to increased dwell time within the plasma and thus allows 313
melting of the larger particles, and the lower velocity at which particles impact the substrate 314
leads to less splat flattening; thus the overall result is a rougher coating. The SEM 315
micrographs (Fig. 3) confirm this, demonstrating a visible difference in the size of the 316
particles present with smaller particles observed in the low roughness coatings (Fig. 3 a) 317
than the high roughness coating (Fig. 3 b). While, the effect of powder feed rate on the 318
temperature and velocity of the plasma flame is known to be minimal [49], higher 319
roughness at higher powder feed rates may be due to greater numbers of overlapping 320
particles and reduced particle spreading. 321
322
Coating crystallinity is determined by the degree of particle melting and the particle cooling 323
rate and was found to be highest at high current, low spray distance and low carrier gas 324
flow rate. The crystalline fraction of a HA coating consists of bulk crystalline material 325
resulting from the unmelted central cores of the HA particles and amorphous material that 326
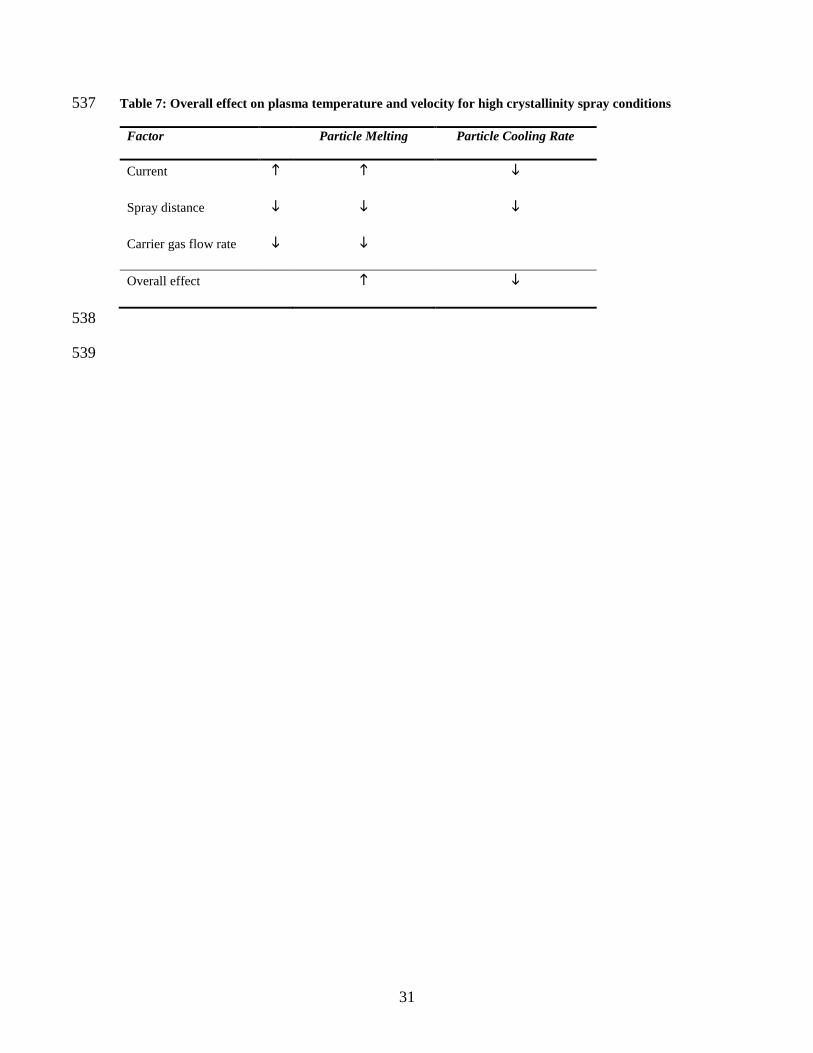
has recrystallised following spraying [28, 60]. The overall expected effects of the high 327
coating crystallinity spraying conditions (N2) are a high coating temperature and low 328
particle cooling rate (Table 7). Thus for this condition, the high current causes an increase 329
in particle melting and an increase in substrate temperature, leading to a low particle 330
cooling rate. The quantity of larger particles deposited at high current is greater, leading to 331
the presence of a greater amount of bulk crystalline material within the coating, leading to 332

16
a high % crystallinity. The low spray distance causes particle melting to be low due to 333
reduced residence time in the plasma jet and the substrate temperature to be high as it is 334
closer to the plasma jet, thus leading to a low particle cooling rate which enabled 335
recrystallisation of the amorphous phase. The carrier gas flow rate determines the entry 336
positions of particles into the jet; at low flow rates particles do not enter the center of the 337
plasma jet and thus undergo less melting. This was confirmed by the observed differences 338
in coating splat morphology between the highest crystallinity coating (N2 Fig. 5 a) and the 339
lowest crystallinity coating (N5 Fig. 5 b). The powder particles visible in the low 340
crystallinity coating retain their spherical shape, indicating that only partial melting of the 341
particles occurred, whereas greater particle melting was observed in the high crystallinity 342
coating. Coating crystallinity was found to be reduced significantly compared to the 343
starting HA powder, although all coatings met the >45% crystallinity ISO requirement 344
[21]. The highest coating crystallinity achieved was 87.6% and thus coatings sprayed using 345
these spraying conditions would thus be highly stability in vivo. 346
347
Coating purity relates directly to thermal decomposition of the particles within the plasma 348
jet with a high purity coating resulting when the spray conditions led to a low particle 349
temperature i.e at the lower ranges of powder feed rate, spray distance and carrier gas flow 350
rate (Table 8). At low powder feed rate, the plasma temperature would be higher than at 351
high powder feed rate, as less cooling of the plasma occurs when fewer particles are 352
injected into it. At low spray distance, the particles only remain in the plasma for a short 353
time and thus experience less heating. At low carrier gas flow rate the particles do not enter 354
the central, hottest part of the plasma jet and thus remain at a lower temperature. While 355

17
Cizek and Khor [40] found no distinct relationship between in-flight temperature or 356
velocity and percentage phase change, the findings reported here agree with the finding of 357
Sun et al. [28]. Importantly for clinical translation, the purity of all coating was > 95 % as 358
per ISO guidelines [21]. For N2, very low levels of impurity phases were present and a 359
coating purity of 99.4% was achieved. 360
361
362
This study has successfully identified suitable parameter ranges for this spraying process 363
while also investigating the main effects of process parameter on coating roughness, 364
crystallinity and purity. The two-level factorial design employed here provides a valuable 365
tool for identification of the main effects and some first order interactions; however it 366
imposes some constraints and thus presents a limitation in this study. The inclusion of 367
centre point experiments provided a useful addition in demonstrating the stability of the 368
process. Although this study design enabled just linear relationships to be evaluated, 369
assessment of the centre points indicates that there is some curvature in the responses which 370
could be further elucidated through a larger investigation of parameter interactions. In order 371
to understand these responses, further assessment of the plasma spray process is thus 372
currently being undertaken within our lab. The study presented here thus presents and 373
important first step in this investigation. A significant finding in this study is that the degree 374
of powder particle melting that occurs is dependent on the powder particle size distribution 375
of the feedstock powder. The powder used in this study had a large particle size distribution 376
which led to the observation of some unexpected effects. Use of a sieving process may be 377
beneficial in order to reduce the particle size range for future studies. Overall, this study 378

18
provides a valuable contribution to the understanding of this complex system and presents 379
predictive process equations for the roughness, crystallinity and purity of plasma sprayed 380
HA coatings, which provide useful tools for coating production and for further 381
development and optimisation of this process. 382
383
384
385
5. Conclusion 386
A Design of Experiment study has been used to determine the effects of current, gas flow 387
rate, powder feed rate, spray distance and carrier gas flow rate on the roughness, 388
crystallinity and purity of plasma sprayed hydroxyapatite coatings leading to the 389
identification of consistent and competing influences and first order interactions. The 390
results demonstrated thatcoatings with higher roughness resulted when current was high, 391
gas flow rate was low and powder feed rate was high as under these conditions melting of 392
larger particles occurred enabling them to be deposited in the coating and a lower impact 393
velocity led to less splat flattening. Coating crystallinity was highest at high current, low 394
spray distance and low carrier gas flow rate. Under these conditions deposition of larger 395
HA particles resulted leading to greater amounts of bulk crystalline material and the low 396
spray distance increased the substrate temperature allowing amorphous material to 397
recrystallise. Coating purity related directly to thermal decomposition of the particles 398
within the plasma jet with a high purity coating resulting when the spray conditions led to 399
a low particle temperature i.e at the lower ranges of powder feed rate, spray distance and 400
carrier gas flow rate. These predictive process equations provide a better understanding of 401
19
effect of plasma spray properties on the roughness, crystallinity and purity of 402
hydroxyapatite coatings. These findings also demonstrate the effects of a diffuse particle 403
size range on the process showing that increased plasma temperatures are required in order 404
to ensure melting of larger particles. These results thus bring greater clarity on the effects 405
of plasma spray process parameters on the properties of resultant hydroxyapatite coatings 406
and provide the first step in a larger study aimed at further elucidating parameter effects 407
and interactions. 408
409
410
Acknowledgements 411
The authors would like to acknowledge the research support provided by the Irish Research 412
Council, funded under the National Development Plan. 413
414
References 415
[1] K. Søballe, E. S. Hansen, H. B. Rasmussen, P. H. Jørgensen and C. Bünger, J. 416
Orthopaed. Res., 10, (1992) 285-299. 417
[2] M. Nagano, T. Nakamura, T. Kokubo, M. Tanahashi and M. Ogawa, Biomaterials, 17 418
(1996) 1771-1777. 419
[3] R. B. Heimann, Surf. Coat. Tech., 233 (2013) 27–38. 420
[4] S. Robbins, C. Lauryssen and M.N. Songer, J. Spinal. Disord. Tech., (2014) Feb 27. 421
[Epub ahead of print] 422

20
[5] R.K. Wong, B.M. Gandolfi, H. St-Hilaire, J. Craniofac. Surg. 22 (2011) 1, 247-251. 423
[6] R. Gadow, A. Killinger, N. Stiegler, Surf. Coat. Tech., 205 (2010) 1157–1164. 424
[7] R. Surmenev, Surf. Coat. Tech., 206 (2012) 2035-2056. 425
[8] Oerlikon Metco, [online], www.oerlikon.com/metco, (Accessed 25th June 2015). 426
[9] M. Roy, A. Bandyopadhyay, S. Bose, Surf. Coat. Tech., 205 (2011) 8, 2785-2792. 427
[10] R.C, Tucker, ASM Handbook Vol 5A: Thermal Spray Technology, ASM 428
International, Ohio, 2013. 429
[11] T. J. Steeper, Varacalle, D. J. JR., G. C. Wilson, W. L. Riggs, A. J. Rotolico and J. E. 430
Nerz, J. Therm. Spray. Technol., 2 (1993) 251-256. 431
[12] G. Singh, S. Singh, S. Prakash, Surf. Coat. Tech., 205 (2011) 20, 4814 – 4820. 432
[13] Department of Orthopaedic Surgery Haukeland University Hospital, "The Norwegian 433
Arthroplasty Register Report 2010", [online], 434
http://nrlweb.ihelse.net/eng/Report_2010.pdf, (Accessed 9th May 2015) 435
[14] L. Sun, C. C. Berndt, K. A. Gross and A. Kucuk, J. Biomed. Mater. Res., 58 (2001) 436
570-592. 437
[15] F. Fazan and P. M. Marguis, J. Mater. Science: Mater. Med., 11 (2000) 787-792. 438
[16] G. Bolelli, D. Bellucci, V. Cannillo, L. Lusvarghi, A. Sola, P. Müller, A. Killinger, R. 439
Gadow, L. Altomare, L. De Nardo, N. Stiegler, Mater Sci Eng C, 34 (2014) 287–303. 440

21
[17] T. M. Sridhar, U. Kamachi Mudali and M. Subbaiyan, Corros. Sci., 45 (2003) 2337-441
2359. 442
[18] Y. Yang, K. Kim, C. M. Agrawal and J. L. Ong, Biomaterials, 25 (2004) 2927-2932. 443
[19] R. B. Heimann, Surf. Coat. Tech., 201 (2006) 2012-2019. 444
[20] N. Cao, J. Dong and Q. Wang, J. Biomed. Mater. Res. A, 92 (2010), 3, 1019-1027. 445
[21] International Organisation for Standards "Implants for Surgery- Hydroxyapatite. Part 446
2: Coatings of Hydroxyapatite", BS ISO 13779-2:2000, 2000. 447
[22] B. D. Boyan, T. W. Hummert, D. D. Dean and Z. Schwartz, Biomaterials, 17 (1996) 448
137-146. 449
[23] A. Boyde, A. Corsi, R. Quarto, R. Cancedda and P. Bianco, Bone, 24 (1999) 579-589. 450
[24] H. Wang, S. Guan, Y. Wang, Colloids Surf., B, 88 (2011), 1, 254-259. 451
[25] G.A. Fielding, M. Roy, A. Bandyopadhyay, Acta. Biomater., 8 (2012) 8, 3144-3152. 452
[26] P. Cheang and K. A. Khor, J. Mater. Process. Tech., 48 (1995) 429-436. 453
[27] S. W. K. Kweh, K. A. Khor and P. Cheang, Biomaterials, 21 (2000) 1223-1234. 454
[28] L. Sun, C. C. Berndt and C. P. Grey, Mater. Sci. Eng. A, 360 (2003) 70-84. 455
[29] Y. P. Lu, S. T. Li, R. F. Zhu and M. S. Li, Surf. Coat. Tech., 157 (2002) 221-225. 456
[30] Y. C. Tsui, C. Doyle and T. W. Clyne, Biomaterials, 19 (1998) 2015-2029. 457

22
[31] C. Y. Yang, B. C. Wang, E. Chang and J. D. Wu, J. Mater. Sci: Mater. Med., 6 (1995) 458
249-257. 459
[32] X. Bai, K. More, C.M. Rouleau, Acta. Biomater., 6 (2010), 6, 2264-2273. 460
[33] H. Podlesak, L. Pawlowski, R. d’Haese, J. Therm. Spray Technol., 19 (2010), 3, 657-461
664. 462
[34] I. Demnati, M. Parco, D. Grossin, Surf. Coat. Tech., 206 (2012) 8, 2346-2353. 463
[35] U. Ripamonti, L.C. Roden, L.F. Renton, Biomaterials, 33 (2012) 15, 3813-3823. 464
[36] S. Durdu, O.F. Deniz, I. Kutbay, J. Alloy Compd., 551 (2013), 422-429. 465
[37] A. Cattini, D. Bellucci, A. Sola, Biomaterials, 102 (2014) 3, 551-560 466
[38] S. Dyshlovenko, L. Pawlowski, P. Roussel, D. Murano and A. Le Maguer, Surf. Coat. 467
Tech., 200 (2006), 3845-3855. 468
[39] S. Dyshlovenko, C. Pierlot, L. Pawlowski, R. Tomaszek and P. Chagnon, Surf. Coat. 469
Tech., 201 (2006) 2054-2060. 470
[40] J. Cizek, K. A. Khor, Surf. Coat. Tech., 206 (2012) 2181–2191. 471
[41] J. R. Mawdsley, Y. J. Su, K. T. Faber and T. F. Bernecki, Mater. Sci. Eng. A, 308 472
(2001) 189-199. 473
[42] J.G. Malinka, D.J. Varacalle Jr., W.L. Riggs, Thermal Spray: International Advances 474
in Coating Technology, ASM Int., Materials Park, Ohio, USA, 1992, p. 87. 475

23
[43] S. Forghani, M. Ghazali, A. Muchtar, Ceram. Int., 39 (2013) 3, 551-560. 476
[44] G. Bertrand, P. Bertrand, P. Roy, C. Rio, R. Mevrel, C. Rio, Surf. Coat. Technol., 202 477
(2008) 1994. 478
[45] B. Lin, M. Jean and J. Chou, Appl. Surf. Sci, 253 6 (2007) 3254-3262. 479
[46] J. F. Li, H. Liao, B. Normand, C. Cordier, G. Maurin, J. Foct and C. Coddet, Surf. 480
Coat. Tech., 176 (2003) 1-13. 481
[47] S. P. Sahu, A. Satapathy, Patnaik A, Mater. Design, 31 (2010) 3, 1165-1173. 482
[48] S. Dyshlovenko, L. Pawlowski, B. Pateyron, I. Smurov, J.H. Harding, Surf. Coat. 483
Tech., 200 (2006) 12-13, 3757–3769. 484
[49] J. Cizek, K. A. Khor and Z. Prochazka, Mater. Sci. Eng: C, 27 2 (2007) 340-344. 485
[50] A. Chebbi and J. Stokes, J. Therm. Spray Technol., 21(2012)719-730. 486
[51] R.B. Heimann, J. Therm. Spray Technol., 19 (2010) 4 765-778. 487
[52] H. Farnoush, J. Aghazadeh Mohandesi, D. Haghshenas Fatmehsari, Ceram. Int., 38 488
(2010) 8, 6753-6767. 489
[53] S.S Kalkarni, Y. Yong, M.J. Rys, J. Manuf. Process., 15 (2013) 4, 666-672. 490
[54] Y. Zhao, A. Shinmi, X. Zhao, P.J. Withers, S. Van Boxel, N. Markocsan, P. Nylen, P. 491
Xiao, Surf. Coat. Tech., 206, (2012) 23, 4922–4929. 492

24
[55] D. C. Montgomery, G. C. Runger and N. R. Hubble, Engineering Statistics, 2nd ed., 493
John Wiley & Sons, New York, 2001. 494
[56] M. F. Morks and A. Kobayashi, Appl. Surf. Sci., 253, 17 (2007) 7136-7142. 495
[57] L. Keller and W. A. Dollase, J. Biomed. Mater. Res., 49 (2000) 2, 244–249[58] K. A. 496
Gross and M. Babovic, Biomaterials, 23 (2002) 4731-4737. 497
[59] S. Guessasma, G. Montavon and C. Coddet, Surf. Coat. Tech., 192 (2005) 70-76. 498
[60] W. Tong, J. Chen and X. Zhang, Biomaterials, 16 (1995) 829-832. 499
500
501
502

25
Tables 503
Table 1: Parameter ranges selected for the screening experiment 504
Low Level
(-1)
High Level
(+1)
A - Current (A) 450 750
B - Gas flow rate (slpm/scfh) 33/70 61.4/130
C - Powder feed rate (g/min) 10 20
D - Spray distance (mm) 80 120
E - Carrier gas flow rate (slpm/scfh) 4.7/10 9.4/20
505
506

26
Table 2: Plasma spray screening experiment variables and experimental plan 507
Exp Name Variables
Current
(A)
A
Gas flow rate
(B)
Slmp (Scfh)
Powder feed
rate
(C)
g/min
Spray
distance
(D)
mm
Carrier gas
flow fate (E)
Slmp (Scfh)
¼ Design
-2(5-2)
(N1-N8)
N1 450 33 (70) 10 120 9.4 (20)
N2 750 33 (70) 10 80 4.7 (10)
N3 450 61.4 (130) 10 80 9.4 (20)
N4 750 61.4 (130) 10 120 4.7 (10)
N5 450 33 (70) 20 120 4.7 (10)
N6 750 33 (70) 20 80 9.4 (20)
N7 450 61.4 (130) 20 80 4.7 (10)
N8 750 61.4 (130) 20 120 9.4 (20)
Centre
points
(N9-N11)
N9 600 47.2 (100) 15 100 7.1 (15)
N10 600 47.2 (100) 15 100 7.1 (15)
N11 600 47.2 (100) 15 100 7.1 (15)
508
509
510

27
Table 3: Average Response Values for Roughness, Crystallinity and Purity 511
Exp Name Average Responses
Roughness
μm
Crystallinity
%
Purity
%
N1 4.1 - -
N2 10.55 87.6 99.4
N3 6.15 65.2 97.8
N4 8.65 81.3 98.9
N5 10.48 65.2 97.6
N6 13.4 77.4 97.7
N7 7.28 77.8 98.2
N8 11.03 65.8 96.4
N9 10.65 79.9 97.4
N10 9.48 54.9 95.5
N11 10.6 76.1 97.2
512
513
514
515
516
517
518
519
520
521
522
523
524
525
526
527

28
Table 4: Coded and actual experimental equations for Roughness, Crystallinity and Purity 528
Response Coded and Actual Regression Equations Eqn. No.
Roughness Roughness = + 9.45 + 1.4 * A – 1.17 * B + 1.10 * C Eqn. 4
Roughness = + 4.257 + 9.70417 E-003 * Current – 0.039146 *
Gas flow rate + 0.21912 * Powder feed rate Eqn. 5
Crystallinity Crystallinity = + 71.83 + 6.2 * A – 5.16 * D – 6.14 * E Eqn. 6
Crystallinity = + 91.25062 + 0.041329 * Current – 0.25797 *
Spray distance – 1.22839* Carrier gas flow rate Eqn. 7
Purity Purity = + 97.93 – 0.46 * C – 0.34 * D – 0.59 * E Eqn. 8
Purity = + 102.8 – 0.09125 * Powder feed rate – 0.017187 *
Spray distance – 0.11875 * Carrier gas flow rate Eqn. 9
529
530

29
Table 5: Statistical Measures of Equation Adequacy 531
Statistical Measure Roughness Crystallinity Purity
R2 0.95 0.96 0.91
Adjusted R2 0.92 0.92 0.85
Predicted R2 0.82 0.81 0.56
Adequate Precision 17.776 14.902 10.44
532
533
30
Table 6: Overall effect on particle temperature and velocity for high roughness spray conditions 534
Factor Particle Temperature Particle Velocity
Current
Gas flow rate
Powder feed rate
Overall effect
535
536
31
Table 7: Overall effect on plasma temperature and velocity for high crystallinity spray conditions 537
Factor Particle Melting Particle Cooling Rate
Current
Spray distance
Carrier gas flow rate
Overall effect
538
539

32
Table 8: Overall effect on particle temperature for high purity spray conditions 540
Factor Particle Temperature
Powder feed rate
Spray distance
Carrier gas flow rate
Overall effect
541
542

33
Figures Captions 543
544
Figure 1: SEM micrograph of Plasma Biotal Captal 60-1 HA Powder 545
546

34
547
Figure 2: Particle Size Distribution of Plasma Biotal Captal 60-1 HA Powder. Power 548
particles fall within two separate clusters, one between 0.1 and 1.0 μm and the other 549
between 10 and 100 μm with the mean particle size found to be 38.3 µm. 550
551

35
552
Figure 3: SEM micrographs showing the surface morphology of a) coating N3 and b) N6. 553
Coating N3 had the lowest roughness and coating N6 had the highest roughness. 554

36
555
Figure 4: XRD patterns for samples with lowest (N5) and highest (N2) crystallinity. 556
Graph shows the amorphous region and HA peaks (*), α-TCP peaks (α) and β-TCP peaks 557
(β). 558
559

37
560
Figure 5: SEM micrographs showing surface morphology of a) Coating N5 and b) N2. 561
Coating N5 had the lowest crystallinity and coating N2 had the highest crystallinity. 562
563

38
564
Figure 6: XRD patterns for samples with lowest (N8) and highest (N2) purity. Graph shows 565
HA peaks (*), α-TCP peaks (α) and β-TCP peaks (β). 566
567
568
Figure 7: Predicted vs. Actual Plot for a) Roughness b) Crystallinity c) Purity. Graphs show 569
the relationship between the developed equation and actual experimental results. 570