2-port residual noise measurements - rohde & schwarz1ef100_2e rohde & schwarz 2-port...
TRANSCRIPT

2-Port Residual Noise Measurements Application Note
Products:
ı R&S®FSWP
As phase noise becomes an increasingly important system-level specification for electronic test equipment,
communications systems, and radar systems. It is not only important to quantify the noise produced by
oscillators, but also the noise added by each component in the signal processing chain. This application
note reviews the fundamentals of residual or additive noise and addresses measurement techniques for
determining the amplitude (AM) and phase noise added by two-port devices such as: amplifiers, mixers,
block frequency converters, multipliers, dividers, and frequency synthesizers.
Additionally, the Rohde & Schwarz FSWP phase noise analyzer will be introduced and a discussion of re-
sidual noise measurement techniques for the above-mentioned devices will be provided.
Please find the most up-to-date document on our homepage
http://www.rohde-schwarz.com/appnote/1EF100.
App
licat
ion
Not
e
Kay
Ghe
en
10.2
017 –
1EF
100_
2e

Table of Contents
1EF100_2e Rohde & Schwarz 2-Port Residual Noise Measurements
2
Table of Contents
1 Introduction ......................................................................................... 3
1.1 Phase Noise .................................................................................................................. 4
1.2 Residual Noise ............................................................................................................. 5
1.2.1 Noise Mechanisms......................................................................................................... 5
1.3 Residual Phase Noise Measurement ......................................................................... 8
2 Rohde & Schwarz FSWP .................................................................. 11
2.1 Residual Phase Noise Measurements with FSWP .................................................14
2.1.1 Using an External Source for Residual Noise Measurements ....................................17
2.1.2 Pulsed Residual Noise Measurements ........................................................................18
3 Residual Noise Measurement Techniques ..................................... 19
3.1 Simple Amplifier Residual Noise Measurements ...................................................19
3.1.1 Additional FSWP Measurements .................................................................................22
3.1.2 Measuring the Instrument's Noise floor .......................................................................23
3.1.3 Dynamic Noise Figure .................................................................................................25
3.1.4 Residual Noise Measurement Considerations ............................................................27
3.2 High-Power Amplifier Residual Noise Measurements ...........................................28
3.2.1 Residual Noise Measurements for Pulsed High-Power Devices .................................31
3.3 Measurement of Frequency Converters ..................................................................32
3.3.1 Residual Noise Measurements for Block Frequency Converters ................................32
3.3.2 The Two Converter Method .........................................................................................35
3.3.3 The Three-Converter Method ......................................................................................37
3.4 Measurement of Binary Frequency Dividers ..........................................................39
3.5 Measurement of Comb Frequency Multipliers ........................................................39
3.6 Residual Phase Noise of a DDS ...............................................................................41
3.7 Residual Noise Measurement of Frequency Synthesizers ....................................43
3.8 Extending Residual Noise Measurements above 18 GHz .....................................45
3.8.1 Using an External Mixer for Frequency Converter Measurements. ............................46
4 Conclusions ...................................................................................... 48
5 Bibliography ...................................................................................... 49
6 Ordering Information ........................................................................ 50

1EF100_2e Rohde & Schwarz 2-Port Residual Noise Measurements
3
1 Introduction
In the not too distant past radar systems engineers were happy simply to detect targets;
however, today it is not enough to simply detect a target, but the target's extremely small
return signal must be extracted from high amplitude ground or sea clutter. This is typically
accomplished by only processing target signals that are Doppler shifted away from the ra-
dar's carrier frequency and rejecting those signals with zero Doppler. This is the concept
of the so-called moving target indicator (MTI) radar. Also, most modern fire control radars
are required to measure the target's velocity, again by processing the target's Doppler re-
turn. Accurate velocity information is critical when trying to predict target track and a firing
solution for weapons systems.
In both of the examples mentioned above radar system phase noise is the key parameter
defining the radar's ability to extract small signals from a noisy background.
Similarly, in digital communications systems, both terrestrial and satellite, the current trend
is to try to squeeze more information into a smaller bandwidth. Generally, this is accom-
plished by increasing the complexity of the modulation constellation with the risk of in-
creased sensitivity to symbol errors caused by factors such as phase noise. As constella-
tions become more complex, they become more sensitive to both AM and phase noise.
As can be seen in the following figure, phase noise causes a constellation to rotate around
its origin, increasing error vector magnitude (EVM) and bit-error rate (BER). This effect is
most noticeable at the extreme corners of the constellation.
Fig. 1-1: Effect of Phase Noise on a 16-QAM Constellation
For both radar and communications systems, system-level phase noise must be main-
tained at sufficiently low levels over the offset frequency range from the carrier where sig-
nal information is processed. Thus, critical offset frequencies can range from 0.1 Hz to
greater than 100 MHz, depending on system requirements.
1EF100_2e Rohde & Schwarz 2-Port Residual Noise Measurements
4
1.1 Phase Noise
Before discussing residual phase noise, a basic review of phase noise would be helpful.
Essentially, phase noise is a figure of merit describing the frequency stability of a signal.
Frequency stability can be viewed in several different ways. In most cases frequency sta-
bility is specified over some time interval. For example, for a crystal oscillator that may be
used as the time base for a clock it may be important that clock accuracy is maintained
over a very long time period such as days, weeks, or even years. However, when we think
of phase noise we are concerned with an oscillator's frequency stability over a very short
observation time, possibly only for a fraction of a second to possibly a few seconds.
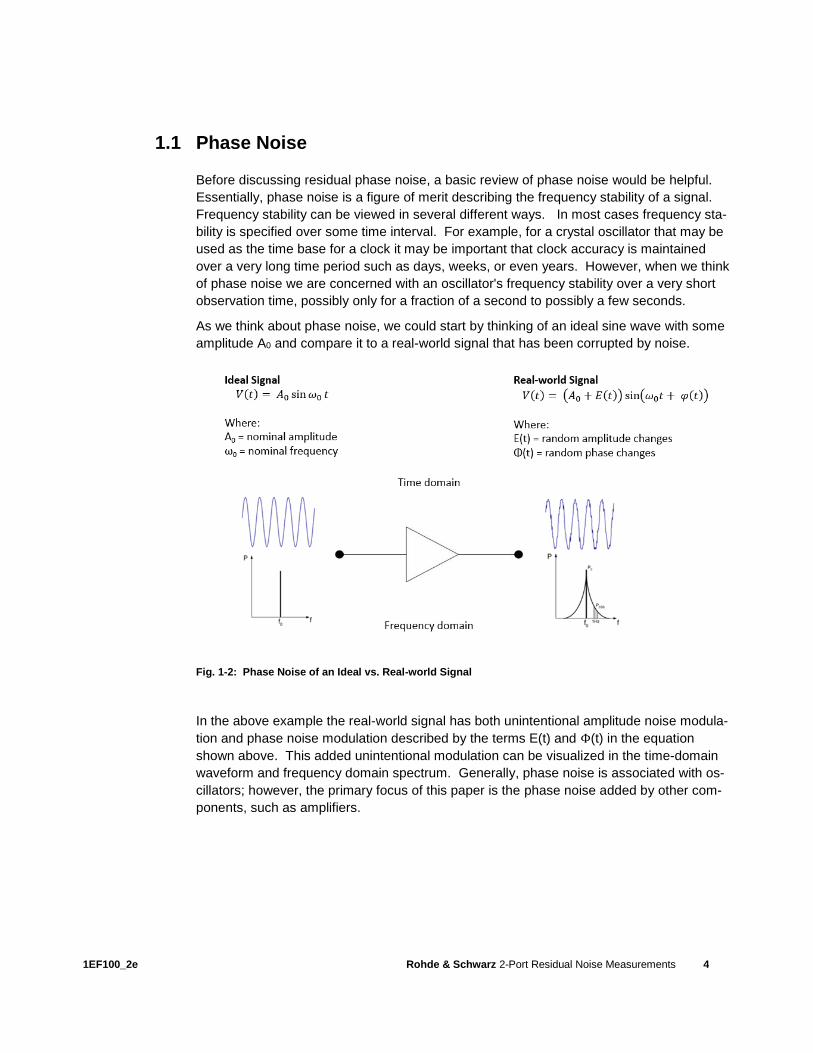
As we think about phase noise, we could start by thinking of an ideal sine wave with some
amplitude A0 and compare it to a real-world signal that has been corrupted by noise.
Fig. 1-2: Phase Noise of an Ideal vs. Real-world Signal
In the above example the real-world signal has both unintentional amplitude noise modula-
tion and phase noise modulation described by the terms E(t) and Φ(t) in the equation
shown above. This added unintentional modulation can be visualized in the time-domain
waveform and frequency domain spectrum. Generally, phase noise is associated with os-
cillators; however, the primary focus of this paper is the phase noise added by other com-
ponents, such as amplifiers.

1EF100_2e Rohde & Schwarz 2-Port Residual Noise Measurements
5
1.2 Residual Noise
Residual or additive noise is noise added to a signal by two-port devices used to process
the signal. In the remainder of this paper we will use the term residual noise, referring to
both AM noise and phase noise.
The terms residual and additive noise are used interchangeably in the literature; however,
the term additive noise is more descriptive since the noise adds in a linear fashion to the
input signal of the two-port device.
Two-port devices of interest could include:
ı Amplifiers
ı Frequency multipliers
ı Frequency dividers
ı Frequency synthesizers
ı Up or down converters
ı Mixers
ı Filters, and
ı Any other two-port device.
In an effort to accurately predict and manage total system noise, the RF systems engineer
not only needs to quantify the noise generated by the oscillators used in his system, but he
must account for the noise added to a clean oscillator signal by every stage that processes
the signal. This is equally important for receivers as well as transmitters.
1.2.1 Noise Mechanisms
The first noise mechanism to be considered is thermal or Johnson noise. It is common un-
derstanding that every amplifier adds some noise to signals, as described by the concept
of noise figure (FN). Noise figure (dB form) or noise factor (linear form) is described as a
degradation of signal to noise ratio (SNR) as a signal passes through an amplifier. This is
a good example of additive noise and is broadband or white noise.
Another example noise mechanism is shot or flicker noise. Flicker noise is a near DC
noise with a power spectral density of 1/f. All active electronic devices exhibit flicker noise.
In the case of amplifiers and multipliers, the near DC flicker noise is multiplied with the car-
rier and the resulting mixing action convolves the flicker noise spectrum with that of the
carrier. Additional forms of multiplicative noise include baseband power supply noise and
noise generated by digital clocks. These noise sources are mixed with the carrier signal
due to non-linearities in the two-port device.

1EF100_2e Rohde & Schwarz 2-Port Residual Noise Measurements
6
Returning to noise factor (F), noise factor is the ratio of input signal to noise ratio to output
signal to noise ratio.
Fig. 1-3: Noise factor of an amplifier
Rearranging the above equation and inserting values for Sin and Nin, we can solve for the
output signal and noise power of the amplifier. Where Sin = Pin and Nin = kTBn where k is
Boltzman's constant, T = the absolute Kelvin temperature generally; 290°K at room tem-
perature; and Bn is the noise bandwidth in Hertz, resulting in a noise power density of -174
dBm/Hz.
Assuming that the amplifier's gain G = Sout/Pin
The output signal will be equal to Sout = PinG and the output noise power will be:
𝑁𝑜𝑢𝑡 = 𝐺𝐹𝑘𝑇𝐵𝑛
From this point on, bandwidth references will be assumed noise bandwidth and B will
simply replace Bn. Next, the output noise power and signal powers (Nout and Sout) are con-
verted to voltages, assuming a resistance R.
𝑉𝑜𝑢𝑡= √𝑅𝐺𝑃𝑖𝑛 + √𝑅𝐺𝐹𝑘𝑇𝐵
The question that should now be addressed is: What does noise factor have to do with
phase noise? To answer this question, we need to look at the above equation on a phasor
diagram.

1EF100_2e Rohde & Schwarz 2-Port Residual Noise Measurements
7
Fig. 1-4: Phasor diagram, showing effect of noise factor
ΔΦrms describes the phase fluctuations about the carrier, in radians, or the broadband
phase noise because of the amplifier's input noise and its noise factor. Phase noise is
usually displayed as a spectral density plot in a log format. The spectral density of phase
fluctuations sΦ(f) can be found by squaring ΔΦrms and dividing by the bandwidth.
𝑆𝜑(𝑓) = ∆𝜑𝑟𝑚𝑠
2 (𝑓)
𝐵=
𝐹𝑘𝑇
𝑃𝑖𝑛[𝑟𝑎𝑑2
𝐻𝑧]
Sφ(f) is the double side-band phase noise, as would be measured using a phase detector,
whose voltage output is digitized by an FFT analyzer. However, the more common term
for phase noise is single side-band phase noise denoted as script L(f), where L(f) ≡ Sφ(f)/2
(1) (2).
Therefore:
ℒ(𝑓) ≡ 𝑆𝜑(𝑓)
2=
𝐹𝑘𝑇
2𝑃𝑖𝑛[𝑟𝑎𝑑2
𝐻𝑧]
Finally, it can be useful to convert the above equation into dB form, as follows:
ℒ(𝑓) = 10 log(𝑘𝑇) + 10 log(𝐹) − 10 log(𝑃𝑖𝑛) − 10 log(2)
Note that the 10•Log (2) term is 3 dB which can be subtracted from the 10•Log (kT) term
resulting in a thermal noise floor of -177 dBm/Hz at room temperature. A fundamental as-
sumption in phase noise measurement is that thermal noise (kT) is composed of a phase
noise component and an equal amplitude noise component with their sum being equal to -
174 dBm/Hz. We can then simplify the above equation to:

1EF100_2e Rohde & Schwarz 2-Port Residual Noise Measurements
8
ℒ(𝑓) = 𝑁𝑇𝐻 + 𝐹𝑁 − 𝑃𝑖𝑛
Where NTH = -177 dBm/Hz.
The above equation only applies to the broadband or white noise portion of the amplifier's
phase noise. In addition, it shows that the broadband portion of an amplifier's phase noise
is dependent on the input power level of the amplifier and noise figure. Therefore, it is im-
portant to make residual phase noise measurements at a specified input drive level.
In summary, there are two primary components of residual or additive phase noise of an
amplifier:
ı Shot or flicker noise and
ı Noise factor.
The following graph illustrates this concept.
Fig. 1-5: Two Phase Noise Components of an Amplifier
1.3 Residual Phase Noise Measurement
Traditionally, residual phase noise is measured by splitting the output of a signal generator
with a two-way power divider. One of the outputs of the power splitter is used to drive the
input to the device under test (DUT) and the DUT's output is fed to an input of a phase de-
tector. The remaining power divider output is fed to a phase shifter whose output is fed to
the remaining phase detector input; however, the phase shifter could be placed in either
path. The phase shifter is used to adjust the phase between the two phase detector inputs
into quadrature. In most cases, a double-balanced mixer is used as the phase detector.
The mixer's output will contain both sum and difference signals of the two input signals.
The low-pass filter removes the sum and leaves the difference signal to be processed by

1EF100_2e Rohde & Schwarz 2-Port Residual Noise Measurements
9
the FFT analyzer. With the two inputs of the phase detector in phase quadrature, the nom-
inal DC output voltage of the phase detector goes to zero and all that remains is a voltage
that is proportional to the phase fluctuations (phase noise) around the quadrature point.
Fig. 1-6: Residual Phase Noise Measurement, Using a Double-Balanced Mixer as a Phase Detector
Since the residual noise signal may be very small compared to the absolute phase noise of
the signal generator used to drive the DUT it is imperative that the signal generator noise
be cancelled. Examining the above diagram, it is apparent that the signal generator noise
is common mode or correlated at both inputs of the phase detector. With this configura-
tion, the signal generator noise is cancelled or subtracted from the measurement by the
mixing action of the phase detector, leaving only the residual noise of the DUT.
NOTE: In residual noise measurements the signal generator noise must be cancelled to
ensure that the DUT's noise is measured and not the signal generator's noise.
Referring to Figure 1-6, the signal at the input (R port) of the mixer is represented as VR (t)
and the signal at the reference port (port L) is represented as VL (t). Where:
𝑉𝑅(𝑡) = cos(𝜔𝐶𝑡 + ∆𝜑𝐺𝑒𝑛 + ∆𝜑𝐴𝑚𝑝)
𝑉𝐿(𝑡) = sin(𝜔𝐶𝑡 + ∆𝜑𝐺𝑒𝑛 )
Where: ΔφGen is the signal generator's phase noise and ΔφAmp is the phase noise produced
by the DUT.
When used as a phase detector, the mixer acts as a multiplier and its output voltage would
be:
𝑉(𝑡) = 𝑉𝑅(𝑡) ∙ 𝑉𝐿(𝑡)
𝑉(𝑡) = cos(𝜔𝐶𝑡 + ∆𝜑𝐺𝑒𝑛 + ∆𝜑𝐴𝑚𝑝) ∙ sin(𝜔𝐶𝑡 + ∆𝜑𝐺𝑒𝑛 )
= 1
2[sin(𝜔𝐶𝑡 + ∆𝜑𝐺𝑒𝑛 + ∆𝜑𝐴𝑚𝑝 + 𝜔𝐶𝑡 + ∆𝜑𝐺𝑒𝑛 )
− sin(𝜔𝐶𝑡 + ∆𝜑𝐺𝑒𝑛 + ∆𝜑𝐴𝑚𝑝 − 𝜔𝐶𝑡 − ∆𝜑𝐺𝑒𝑛 )]

1EF100_2e Rohde & Schwarz 2-Port Residual Noise Measurements
10
= 1
2[sin(2𝜔𝐶𝑇 + 2∆𝜑𝐺𝑒𝑛 + ∆𝜑𝐴𝑚𝑝) + sin( ∆𝜑𝐴𝑚𝑝)]
The low-pass filter will now remove the doubled components leaving only:
𝑉(𝑡) = sin( ∆𝜑𝐴𝑚𝑝)
Now referring back to the assumption made in Figure 1-4 that the small-angle criterion will
be used, where sin(x) = x:
𝑉(𝑡) = ∆𝜑𝐴𝑚𝑝
For the sake of simplicity, any discussion of proportionality constants used to calibrate a
measurement have been left out. Normally these constants are lumped together to form a
phase detector constant denoted as Kφ with units of V/radian. Therefore:
𝑉(𝑡) = 𝐾𝜑∆𝜑𝐴𝑚𝑝
As can be seen from the above discussion, if the phase noise produced by the signal gen-
erator is correlated on both ports of the phase detector it will be cancelled, leaving only the
phase noise of the device under test. This assumes an ideal double-balanced mixer and
that the source phase noise would be completely cancelled, when using real-world mixer
this is not the case and one could expect to only achieve 40 to 60 dB of cancellation.

1EF100_2e Rohde & Schwarz 2-Port Residual Noise Measurements
11
2 Rohde & Schwarz FSWP
The Rohde & Schwarz (R&S) FSWP Phase Noise Analyzer (3) is a modern alternative to
the classical phase detector method of phase noise measurement described in Section
1.3, above. FSWP is available in three frequency range dependent models:
ı 1 MHz to 8 GHz
ı 1 MHz to 26.5 GHz, and
ı 1 MHz to 50 GHz.
FSWP can also be augmented with the following options to increase capability and perfor-
mance:
Option Description
B1 Signal and Spectrum Analyzer
B4 High stability OCXO
B60 Cross correlation
B61 Low Phase Noise Cross-Correlation
B64 Residual (two-port) phase noise measurements
B80 80 MHz analysis bandwidth
K4 Pulsed Carrier Noise Measurements Note: This option is required for pulsed carrier noise (AM and PM) measurements
K6 Pulse measurements--detailed pulse analysis and trends--not necessary for phase noise measurement
K7 Analog modulation analysis for AM, FM, and PM
K30 Noise figure measurements
K33 Security Write Protect--Prevents storage of classified information on instru-ment's mass storage
K70 Vector Signal Analysis
Table 2-1: FSWP Options
Traditional phase noise test sets utilize an analog double-balanced, mixer with the two in-
puts in phase quadrature, as a phase detector. With the inputs in phase quadrature, the
DC component of the mixer's output goes to zero and only the small phase variations
about the quadrature point (phase noise) are present at the output. The primary disad-
vantage of this method is that quadrature must be closely maintained between the input
ports and the set up must be calibrated to determine the phase detector constant Kφ for
each measurement.
In comparison, the R&S FSWP (4) directly down converts the signal under test to a low or
zero IF frequency using a pair of In-phase and Quadrature (I/Q) mixers. The IF signals are
then digitized and demodulated for phase and amplitude variations, using digital signal
processing (DSP). Moving the phase detector into the digital domain provides much eas-
ier measurement set up and calibration for the user and greatly improves measurement

1EF100_2e Rohde & Schwarz 2-Port Residual Noise Measurements
12
accuracy. Since the characteristics of the digital components are predefined, any meas-
urement inaccuracies can be compensated in DSP yielding absolute precision.
Fig. 2-1: FSWP Analog Block Diagram
Referring to Figure 2-1 above, the RF input signal is filtered and split between two inde-
pendent channels. Each channel in filtered and then introduced to an I/Q mixer, where the
input signal is mixed with an ultra-low phase noise local oscillator. The local oscillators
(LOs) for channel 1 and 2 are derived from two independent reference clocks to ensure
they are uncorrelated over the offset frequency range of interest. The reference of Chan-
nel 2 is loosely coupled to the reference of Channel 1 by a phase lock loop (PLL) with a
loop bandwidth of less than 0.1 Hz. This loose coupling allows cross correlation down to
offset frequencies of 0.1 Hz.
Since the mixers and amplifiers are analog components, their performance is non-ideal in-
troducing quadrature errors, gain imbalance, and LO feed through. During manufacturing,
gain and phase deviations are factory calibrated over the instrument's frequency range,
while the DC offset caused by LO feedthrough is calibrated prior to each measurement.
One of the primary advantages of this architecture is that it typically achieves an AM rejec-
tion of 40 dB, compared to the 15 to 30 dB achieved by typical phase detector designs.
This excellent AM rejection reduces the likelihood of cross-spectrum collapse that has
been attributed to anti-correlated AM/PM conversion in most cross-correlated phase noise
measurement systems (5).
Once the signal has been down converted and amplified each I and Q signal for both
Channels 1 and 2 are digitized by an independent 100 Msa/s ADCs. Since the carrier is
not suppressed, as in the case of a classical phase detector, the ADC's dynamic range
must be sufficient to capture the carrier and all noise sidebands of interest. Each of the
four ADCs, shown in Figure 2-1, contains four parallel channels with 16 bits of resolution.
The four parallel ADCs outputs are then averaged for improved SNR. Since the only sig-
nal that is correlated for both Channels 1 and 2 is the signal under test, system noise from
the LOs, amplifiers, and ADCs can be reduced using cross-correlation.

1EF100_2e Rohde & Schwarz 2-Port Residual Noise Measurements
13
Fig. 2-2: FSWP DSP for One Channel
Figure 2-2 shows the digital signal processing following the I/Q sampling. This process is
implemented two times in FPGA for cross-correlation measurements. The equalizer at the
beginning of the DSP chain serves two primary purposes: First, it compensates for the
channel frequency response of the analog hardware for both I and Q paths and second, it
compensates the I/Q imbalance and DC offset errors introduced by the analog I/Q mixers.
The equalized signal is shifted in frequency by a numerically controlled oscillator (NCO)
and mixer. Frequency shifting is used to center the spectrum on the carrier frequency. A
low-pass filter next removes any frequency components that fall outside the frequency
range of interest. A pulse detector, squelch, and PRF filter block is invoked for processing
pulsed carrier noise measurements and is bypassed for CW noise measurements. More
information on pulsed residual noise measurements is provided in Section 2.1.2.
Following the pulse signal processing block, the carrier is demodulated to obtain the AM
and PM noise spectrums. The demodulation process begins with a CORDIC (Coordinate
Rotation Digital Computer) algorithm to separate the complex I/Q baseband signals into
their phase and magnitude components. The magnitude signal is used directly to calculate
the AM noise spectrum and the phase signal is converted into a frequency signal prior to
further processing. One key point is that FSWP simultaneously measures both phase
noise and AM noise, saving the user the time and effort of making a separate AM noise
measurement with a different configuration.
Fig. 2-3: AM and FM Demodulation of a Carrier
Considering that the DUT's carrier frequency may not be exactly the same as FSWP's
LOs, the demodulated phase would have a linearly increasing phase which would wrap at
±π radians, making it difficult to determine the signal's phase noise. Therefore, FSWP

1EF100_2e Rohde & Schwarz 2-Port Residual Noise Measurements
14
converts the phase demodulated signal into a non-wrapping FM signal. Slow DUT fre-
quency drift is converted into a low or zero frequency component of the FM signal. Follow-
ing decimation and Fast Fourier Transform of the FM signal, the spectral density of fre-
quency fluctuations Sν(f) is obtained. Sν(f) can easily be converted into the spectral den-
sity of phase fluctuations Sφ(f) by dividing by f2. Single sideband phase noise L(f) can now
be calculated by simply dividing by 2.
ℒ(𝑓) = 𝑆𝜑(𝑓)
2=
𝑆𝜈(𝑓)
2𝑓2
The digital FM demodulator, as realized in FSWP, can be viewed as an ideal FM demodu-
lator and does not suffer from low sensitivity close to the carrier as is typical of analog de-
lay-line FM demodulators, where frequency sensitivity of the demodulator decreases at a
rate of 20 dB per decade approaching DC.
2.1 Residual Phase Noise Measurements with FSWP
With the addition of Option B64, FSWP is capable of residual or additive noise measure-
ments. Option B64 provides the following:
ı Instrument firmware for processing residual noise measurements
ı An internal RF source covering the frequency range of 10 MHz to 18 GHz with up to
+10 dBm of signal power that can be used as a stimulus for residual noise measure-
ments
ı Two front-panel SMA connectors that can be used to connect external LOs to FSWP's
channel 1 and 2 I/Q mixers for residual noise measurements.
The first step in making a residual noise measurement is to invoke the additive noise
measurement by pressing the [MEAS] hard key on the instrument's front panel, followed
by selecting the {Additive Noise} measurement from the menu, as shown below:
Fig. 2-4: FSWP Measurement Menu, Showing Additive Noise Measurement

1EF100_2e Rohde & Schwarz 2-Port Residual Noise Measurements
15
With the Additive Noise measurement selected, the instrument is automatically configured
to make the residual noise measurement. By default, FSWP is set up to use its internal
source as the stimulus for additive noise measurements.
The internal source's output is available from the Type-N connector, labeled “Signal
Source Output,” located on the instrument's front panel. The internal source has the fol-
lowing characteristics:
FSWP B64 RF Signal Source Characteristics
Frequency Range 10 MHz to 18 GHz
Signal Level -50 to +10 dBm in 10 dB steps
Level Accuracy ±2 dB
Modulation Pulse Modulation for Pulsed Additive Noise Measure-ment
Table 2-2: FSWP Option B64, Signal Source Characteristics
The B64 Internal Signal Source provides a general-purpose stimulus signal for basic resid-
ual noise measurements. As can be seen from Table 2-2 the source's frequency range is
limited to 10 MHz through 18 GHz. This is sufficient for the majority of amplifier and fre-
quency converter measurements. In the event that residual noise measurements are be-
ing made outside this frequency range, external multipliers or external mixers may be used
to increase the instrument's frequency range. In addition, the source is limited to 10 dB
amplitude steps, again this is intended to fill a general purpose requirement. If finer ampli-
tude resolution is needed an external step-attenuator may be used. This can be important
when trying to measure the residual noise of an amplifier near its compression point. The
signal source is derived from one of FSWP's internal reference oscillators (LO), as shown
in Figure 2-5.
Fig. 2-5: FSWP B64 Signal Source Block Diagram
A frequency divider chain is used to obtain frequencies below the synthesizer's basic tun-
ing range of 8 to 18 GHz. An electronic attenuator is provided to establish the correct out-
put power. Prior to the electronic attenuator, the signal is split. Half of the signal goes
through the electronic attenuator and is output on the front-panel Type-N connector. The
output from the remaining power splitter port is fed to a second power splitter that provides
the LO signal to the Channel 1 and 2 I/Q mixers. In this configuration it is obvious that the
noise generated by the internal source is common mode (correlated) for the Channel 1 and

1EF100_2e Rohde & Schwarz 2-Port Residual Noise Measurements
16
2 mixer inputs and their LO inputs. Using the same rationale that was developed in Sec-
tion 1.3, we can conclude that the source noise cancels through the multiplication process
of the mixers for both of the I and Q mixers.
A simple menu, shown in Figure 2-6, is provided to allow the user to configure the internal
signal source. The menu is accessed by pressing the [MEAS CONFIG] hard key followed
by pressing the {Source Config} soft key. This menu can also be accessed by pressing
the [INPUT/OUTPUT] hard key followed by pressing the {Output Config} soft key for both
the Phase Noise and Spectrum Analyzer modes.
Fig. 2-6: FSWP Source Control Menu
The source control menu provides the following functions:
Control Description
Source Power radio button Turns the source RF output on and off
Channel coupling This function allows signal source settings made in the phase noise mode to be coupled with signal source settings in other modes, such as the spectrum analyzer mode
Frequency Sets the source output frequency between 10 MHz and 18 GHz
Frequency step size Sets the frequency step size when using the Up and Down arrow keys
Level Sets the source output amplitude from -50 to +10 dBm in 10 dB steps
Pulse Modulation Turns ON and OFF the internal pulse modulator, when in the Pulsed Additive Noise measurement mode
DUT Bypass Provides a convenient way to bypass a connected DUT and measure the sources noise characteristics directly. For measuring the instrument noise floor for specific measurements setups without removing the DUT.
Pulse Controls Set the pulse modulation characteristics, PW and PRI
Table 2-3: FSWP Source Controls

1EF100_2e Rohde & Schwarz 2-Port Residual Noise Measurements
17
In summary, FSWP offers a self-contained residual noise measurement system that can
make residual noise measurements on two-port devices without the need of external delay
lines to tune the measurement into phase quadrature and external signal generators. As a
bonus, AM noise measurements are made without the need of external AM detectors, re-
sulting in improved dynamic range for AM noise measurements.
2.1.1 Using an External Source for Residual Noise Measurements
As mentioned in Section 2.1, above, FSWP Option B64 provides two LO input connectors
on the front panel to allow use of an external signal source for residual noise measure-
ments. Figure 2-7 shows the connection of the external LO inputs to the Channel 1 and 2
I/Q mixers
Fig. 2-7: FSWP Block Diagram, Showing External LO Inputs
Use of external LO inputs may be desirable for some residual noise measurements:
ı Where precise amplitude control is necessary to ensure that a residual noise meas-
urement is made at a specific drive level relative to an amplifier's 1-dB compression
point
ı When DUT pulse modulation must be closely synchronized with DUT bias voltages.
This is common for high-power pulsed devices like traveling wave tubes (TWTs)

1EF100_2e Rohde & Schwarz 2-Port Residual Noise Measurements
18
ı When making measurements of high-power devices where a booster amplifier is nec-
essary to provide a high-power drive signal for the DUT and it is desired to remove
the noise contributed by the booster amp.
The external LO inputs have the same 10 MHz to 18 GHz frequency range as the FSWP
internal source. The external LO inputs require between +5 to +10 dBm of drive, depend-
ing on frequency. (6)
More information on the use of FSWP external LO inputs can be found in Section 3.2 of
this application note.
2.1.2 Pulsed Residual Noise Measurements
Pulsed residual noise measurements using the R&S FSWP are very similar to making CW
residual noise measurements. FSWP has a special measurement personality for pulsed
residual noise measurements, which is accessed through the [MEAS] hard key menu as
shown in Figure 2.4. In this case, the bottom radio button would be selected. FSWP has
special features for measuring pulsed carrier noise. More information on pulsed carrier
noise measurements is available in Application Note "Pulsed Phase Noise Measure-
ments". (7)

1EF100_2e Rohde & Schwarz 2-Port Residual Noise Measurements
19
3 Residual Noise Measurement Techniques
This section will discuss residual noise measurement techniques for several common clas-
ses of two-port devices.
3.1 Simple Amplifier Residual Noise Measurements
As an introduction to residual noise measurements, a good starting point is to measure the
residual noise produced by a simple amplifier. Before making the measurement we need
to know a few things about the amplifier we plan to test, such as:
ı The frequency range of interest
ı The small-signal gain
ı The 1-dB compression point, and
ı The noise figure.
Consider making a residual phase noise measurement on an amplifier with the following
characteristics:
Test Amplifier Characteristics
Frequency Range 50 to 4000 MHz
Gain 20 dB
Input 1-dB Compression Point 0 dBm
Saturated Output Power +20 dBm
Noise Figure 1.5 to 2 dB
Table 3-1: Amplifier Characteristics
The first things to consider are the frequency and drive levels that will be used for the
measurement. For the above amplifier a good starting point might be to choose a stimulus
frequency of 1 GHz at an amplifier drive level of -20 dBm. This drive level was chosen to
ensure small signal operation. Next, the amplifier is connected to FSWP as shown below:
Fig. 3-1: FSWP DUT Connections for a Simple Residual Noise Measurement

1EF100_2e Rohde & Schwarz 2-Port Residual Noise Measurements
20
As shown above, the DUT connections can really be quite simple. In addition to an inter-
nal RF source, FSWP provides three low-noise internal power supplies that can be used to
bias many typical DUTs. The supply outputs are available on three front-panel BNC con-
nectors. The supply labeled V Supply is capable of supplying up to 16 Volts DC with a
maximum current of 2 Amperes. These power supplies are primarily intended for testing
voltage-controlled oscillators (VCOs), but can be used in many applications. Like the RF
source, the power supplies can be used in more than just the phase noise mode.
With the amplifier connected and FSWP's internal source set up and turned on the meas-
urement will proceed automatically. The following figure shows the measurement results
for this amplifier:
Fig. 3-2: Amplifier Residual Phase Noise Measurement
Figure 3-2 shows the graphical results of our phase noise measurement. In addition to the
phase noise plot, notice the annotated locations on the instrument screen showing ampli-
fier output power, amplifier input power, and amplifier gain. These indicators provide a
quick view of the amplifier's performance, giving the operator confidence that the amplifier
is working as expected. A spot-noise table shows the phase noise at each decade offset
frequency.
Referring back to Section 1.2.1 the 1/f noise and the broadband noise of the amplifier can
clearly be seen with the 1/f corner frequency at approximately 12 kHz. At an offset fre-
quency of 1 MHz the broadband noise is well established at -155.77 dBc/Hz. Recalling our
equation for single sideband phase noise, relative to noise figure from Section 1.2.1:
ℒ(𝑓) = 𝑁𝑇𝐻 + 𝐹𝑁 − 𝑃𝑖𝑛

1EF100_2e Rohde & Schwarz 2-Port Residual Noise Measurements
21
Using the information from Figure 3-2 and rearranging the above equation for phase noise
we can solve for the noise figure of the amplifier, where:
𝐹𝑁 = ℒ(𝑓) − 𝑁𝑇𝐻 + 𝑃𝑖𝑛
For our test amplifier:
𝐹𝑁 = −155.77 + 177 − 20 = 1.23 𝑑𝐵
This is well within the expected noise figure for this amplifier. The noise figure can be veri-
fied by making a traditional Y-factor measurement using FSWP's noise figure application
(Option K30), with the following results:
Fig. 3-3: FSWP-K30 Noise Figure Measurement of Test Amplifier
Figure 3-3 shows a noise figure for our test amplifier of 1.16 dB at our test frequency of 1
GHz, as measured with a classical Y-factor method using FSWP-K30. Comparing the Y-
factor measurement with that derived from the residual phase noise measurement shows a
difference of 0.07 dB. Although excellent, this difference could be explained by several
factors, such as:
ı Measurement uncertainty for both methods
ı The Y-factor measurement was made using a 15 dB excess noise ratio (ENR) noise
source, which is not the best choice for a moderate gain low noise figure device
ı The input power to the DUT, that was used to calculate noise figure, was simply the
selected output power of FSWP's internal source, making no corrections for cable
losses. Better accuracy could be obtained by using a power meter at the input of the
DUT.

1EF100_2e Rohde & Schwarz 2-Port Residual Noise Measurements
22
Considering all of these factors there is excellent agreement between the two noise figure
measurements.
As compared to noise figure, the real value of a residual noise measurement is that it pro-
vides a more complete understanding of the noise contributed by the amplifier (8). The
above example demonstrates that noise figure alone does not accurately represent the
noise added by the amplifier and only provides limited information about the small-signal
noise an amplifier adds to a signal at offsets greater than about 1 MHz from the carrier;
whereas, a residual noise measurement provides:
ı The flicker or 1/f noise characteristics close to the carrier
ı The broad band noise
ı The AM noise modulated onto the carrier
ı Any spurious signals that result from power supply or digital clock noise.
In addition, the residual noise measurement can provide great insight into the noise char-
acteristics of an amplifier under large-signal conditions.
3.1.1 Additional FSWP Measurements
FSWP provides up to six measurement traces to view measured data. Each trace can dis-
play:
ı Phase noise
ı AM noise, or
ı The sum of AM and phase noise.
Any of the above data can be viewed showing measured spurious signals or spurs can be
suppressed to provide a cleaner view of the noise trace.
In addition, traces can be stored and displayed as references to compare measured data.
A menu of trace math functions are also available for the user to manipulate trace data.
Traces can also be exported to CSV files allowing analysis of trace data with common
analysis software such as Microsoft Excel®.

1EF100_2e Rohde & Schwarz 2-Port Residual Noise Measurements
23
Fig. 3-4: Residual Noise Measurement Showing AM Noise and Spurs
The measured data shown in Figure 3-2 was displayed showing phase noise only, with
spurs suppressed. This was done to simplify discussion of the measurement.
Figure 3-4 shows a measurement of the same amplifier tested under the same drive condi-
tions. In this figure, the blue trace (trace 1) is the phase noise and matches that shown in
Figure 3-2. The black trace (trace 2) is also a phase noise trace, except in this case spur
suppression was turned off. Examining this trace, a power-line spur is shown at 60 Hz.
Measured spurs are also listed in the spur table in the bottom portion of the screen. Fi-
nally, the green trace (trace 3) shows the amplifier's AM noise.
3.1.2 Measuring the Instrument's Noise floor
In addition to measuring the DUT's residual phase noise, it is often a good idea to measure
the test instrument's residual noise floor. By making a noise floor measurement with the
DUT residual noise measurement the operator can ensure that the measured phase noise
is sufficiently greater than the instrument noise to verify the validity of the measurement.
For the amplifier measurement described above it is a simple matter to measure FSWP's
noise floor.
With the DUT and FSWP configured as shown in Figure 3-1 the user would turn on the
DUT bypass function in the FSWP signal source control menu, as illustrated in Figure 2-6
and make a phase noise measurement.

1EF100_2e Rohde & Schwarz 2-Port Residual Noise Measurements
24
Fig. 3-5: Amplifier Phase Noise and FSWP Noise Floor
Figure 3-5 shows the residual phase noise of our test amplifier under the same test condi-
tions shown previously (see Figure 3-2). However, the green trace in Figure 3-5 shows the
FSWP's residual phase noise floor for the conditions established in Section 3.1.
The following procedure was used to make the noise floor measurement:
1. Set up the DUT and FSWP as described in Section 3.1
2. Press the [RUN SINGLE] hard key to put the FSWP in single-sweep mode. This will
force FSWP to stop making measurements when it finishes the current measurement.
3. Open the source control menu and turn on the DUT bypass, as follows: Press the
[MEAS CONFIG] hard key followed by pressing the {Source Config} soft key. From
the source config menu press the {DUT Bypass} radio button.
4. With the DUT bypassed the output of the internal signal generator is directly con-
nected to FSWP's receiver input. Next increase the signal generator's output power
to match the output power expected from the DUT. In this case 0 dBm. See the an-
notations at the top of Figure 2.6. This is very important! To get an accurate meas-
urement of the noise floor the instrument must measure the same dynamic range sig-
nal as it does in the actual residual noise measurement.
5. Press the [RUN SINGLE] hard key to start the noise floor measurement
6. When the measurement is complete (see ready flag at the bottom of the screen) copy
the current measurement trace to trace 3 (the green trace), by pressing the [TRACE]
hard key followed by pressing the {Copy Trace} soft key. From the copy trace menu,
select Trace 1 as the source trace. Then press the {Copy to Trace 3} radio button to
copy the trace. Now close the copy trace menu.

1EF100_2e Rohde & Schwarz 2-Port Residual Noise Measurements
25
7. Open the source control menu, see step 3 above, and reduce the source power to the
desired level for the amplifier residual noise test, in this example -20 dBm. Next turn
off the DUT bypass and close the source control menu.
8. Press the [RUN SINGLE] hard key to start the amplifier residual noise measurement.
9. When the measurement is complete, the yellow trace (trace 1) will display the residual
phase noise of the amplifier and the green trace (the trace saved to trace 3 in step 6)
will display the instrument's noise floor for this specific measurement configuration.
See example in Figure 3-5.
In general, it is desirable to have at least 10 dB of margin between the measured phase
noise trace and the instrument noise floor, depending on acceptable measurement uncer-
tainty.
3.1.3 Dynamic Noise Figure
As mentioned in Section 1.2.1 there are two primary components of amplifier noise: flicker
or 1/f noise and broadband noise associated with noise figure. From these the amplifier's
dynamic range under operating conditions can be determined. In addition, the amplifier's
small-signal noise figure can be determined, as discussed in Section 3.1. In this manner
the noise figure will correlate quite closely with that of a standard Y-factor measurement, if
the amplifier is operated well below the 1-dB compression point (as great as 20 dB). As
amplifier drive is increased, the calculated noise figure may vary greatly from the small-sig-
nal value, due to non-linear behavior of the amplifier. These effects may be manifest even
at 10 dB below the 1-dB compression point in some amplifiers. Nearing the compression
point and in deep compression, noise present on the amplifier's bias circuitry may undergo
AM to PM conversion and further add to the amplifier's phase noise.
The unique advantage of a residual phase noise measurement is that the measurement
can be made at various amplifier drive levels allowing system engineers to evaluate overall
system noise using real-world amplifier operating conditions. This concept is illustrated in
Figure 3-6 below:

1EF100_2e Rohde & Schwarz 2-Port Residual Noise Measurements
26
Fig. 3-6: Residual Phase Noise of Amplifier at Various Drive Levels
Figure 3-6 shows several residual phase noise measurements of the amplifier used previ-
ously described in Section 3.1 of this paper, but at various drive levels. Test results are
summarized in Table 3-2
Trace DUT Drive
BB Noise
Calc. NF
Notes
5 - Teal -30 dBm -145.7 1.3 Amplifier small-signal performance and noise floor
4 - Orange -20 dBm -155.77 1.2 Same as previous measurements
3 - Green -10 dBm -163.8 3.2 Notice as drive is increased the 1/f corner is moved out in fre-quency. Still 10 dB below compression.
2 - Black 0 dBm -168 9 With additional drive, the 1/f corner moves further to the right and the 1/f noise is compressed. This is the 1-dB compression point for this amplifier
1 - Blue +10 dBm -142.6 44.4 This trace is 10 dB into compression. Notice the 1/f noise is greatly increased and the broadband noise increased, as com-pared to trace 4.
Table 3-2: Explanation of Test Results from Figure 3-6
As can be seen from Figure 3-6 and Table 3-2, our amplifier produces more noise as it
starts to go into compression. Noise figure was calculated at each drive level to demon-
strate the amplifier's characteristics in compression; however, the choice of offset fre-
quency from the carrier (1 MHz) was only used as an example and may not be appropriate
at the higher drive levels. These data demonstrate that noise figure does not tell the full
story of amplifier behavior from an added noise standpoint as drive level is changed.

1EF100_2e Rohde & Schwarz 2-Port Residual Noise Measurements
27
3.1.4 Residual Noise Measurement Considerations
ı The source noise must be correlated at FSWP's mixer RF and LO inputs. This condi-
tion is automatically satisfied if using the internal signal source and must be satisfied
when using an external signal generator with the external LO inputs
ı Correlated phase noise at both the mixer input and LO input will cancel, improving
measurement performance.
ı When making low-noise measurements with an external source it is important to en-
sure that the source and any necessary amplifiers are placed before the power splitter
to ensure that the noise added by the source and amplifier are correlated out of the
measurement.
ı When using an external signal generator (LO), the user must ensure that sufficient LO
drive is provided to FSWP's front-panel LO input connectors (5 to 10 dBm, see FSWP
Phase Noise Analyzer Specifications, reference 8 in the bibliography.) If an amplifier
is necessary it should have sufficient gain to drive the DUT and the LO inputs. The
amplifier should not be driven into compression to avoid non-linear behavior and gen-
eration of multiplicative noise. The amplifier should be selected based on required
gain and low AM and broadband noise. Attenuators may also be required before or
after the DUT to achieve proper power levels.
ı When selecting a signal generator for use with FSWP's external LO inputs, the source
should have good broadband noise characteristics because at large offset frequen-
cies the source's broadband noise can decorrelate, when measuring components with
large delays, resulting in poor source noise cancellation.
ı Likewise, the external source's AM noise should be kept to a minimum to minimize
AM to PM conversion in the DUT.
ı When making residual noise measurements, cable lengths between the source and
DUT and between the DUT and the analyzer's input must be kept as short as practi-
cable. Also, use of semi-rigid cables is preferred to minimize phase changes caused
by cable movement, vibrations, and temperature changes.
ı When making low-level phase noise measurements it is often helpful to place the
DUT on a sheet of soft foam rubber to isolate the DUT and cables from bench vibra-
tions
ı Avoid Radio Frequency Interference (RFI) by ensuring that all components of the
measurement are well shielded, that all connectors are properly torqued, and that
semi-rigid cable is used, where possible. Residual noise measurements are espe-
cially susceptible to RFI.
ı When making analyzer noise floor measurements ensure that the input power to the
analyzer is within 1 or 2 dB of the expected output power of the DUT.

1EF100_2e Rohde & Schwarz 2-Port Residual Noise Measurements
28
3.2 High-Power Amplifier Residual Noise Measurements
The first consideration when making residual noise measurements of high-power devices
with FSWP is to ensure that sufficient attenuation is provided between the output of the de-
vice and FSWP's input. In most cases, high-power attenuators or directional couplers will
be used. The next point to consider is how much RF power will be required to drive the
DUT into the proper operating region. If a booster amplifier will be required for the meas-
urement, the use of an external signal generator and the FSWP external LO inputs may
also be necessary.
Fig. 3-7: Residual Noise Measurement Setup, Using an External Booster Amplifier
Figure 3-7 illustrates one possible way to measure the residual noise of a high-power am-
plifier using FSWP. For this example, the device to be tested is a high-power amplifier
with a saturated output power of 1 kW and a gain of 30 dB. The amplifier requires 1 Watt
of RF drive to achieve full rated power. For this measurement it was determined that an
amplifier would be required to boost the signal generator's output power up to the +30 dBm
level required to drive the DUT (however, signal generators such as the Rohde & Schwarz
SMA100B are available with sufficient output power for this application.) Therefore, it is
necessary to use the FSWP external LO inputs to facilitate cancellation of the signal gen-
erator and amplifier noise.
To invoke the additive noise measurement using the external LO inputs of FSWP the oper-
ator must select the external LO inputs by pressing the [INPUT OUTPUT] hard key and

1EF100_2e Rohde & Schwarz 2-Port Residual Noise Measurements
29
then pressing the {Input Source Config} soft key. From this menu, under the Local Oscil-
lator heading press the External radio button, as shown in the Figure 3-8.
Fig. 3-8: FSWP External LO Control Setup
With this accomplished (refer to Figure 3-7), a 20 dB directional coupler was selected to
reduce the DUT's input power down to +10 dBm. The coupled arm of the directional cou-
pler is then connected to a power divider that provides +7 dBm of LO drive to the two
FSWP LO input connectors. A 6-dB resistive power splitter could have been used; how-
ever, the 3-dB splitter offers superior port isolation and lower loss. The through arm of the
directional coupler is then connected to a second directional coupler that is used to sample
the input power to the DUT. This is critical to allow monitoring of the DUT input power to
ensure the residual noise measurements are made at the correct operation point on the
amplifier's compression curve. One additional component that could prove valuable on the
input side of the DUT is a variable attenuator to allow adjustment the DUT drive level,
while leaving the FSWP LO drive power constant.
The output of the DUT is connected to a 30 dB directional coupler and a dummy load. The
coupler is necessary to reduce the DUT's output power down to a level that will not dam-
age the FSWP (less than 1 Watt). The coupled arm of the coupler is routed to a 10 dB
fixed attenuator, which reduces the input power to FSWP to +20 dBm.
Prior to making the phase noise measurement of the DUT the analyzer's noise floor using
the external signal generator and booster amplifier should be determined. This can be ac-
complished by disconnecting the coupled arm of the DUT's output coupler and connecting

1EF100_2e Rohde & Schwarz 2-Port Residual Noise Measurements
30
the input of the 10 dB attenuator to the output of the DUT's input coupler, essentially by-
passing the DUT. The test setup in Figure 3-7 provides a set of coaxial switches to facili-
tate the setup of the noise floor measurement. Notice that by using a DUT output coupler
with a coupling factor that is equal to the DUT's gain the drive level to FSWP for the noise
floor test will be the same as for the actual noise measurement (+20 dBm). With this setup
the DUT's output is always terminated in its correct load impedance to prevent any dam-
age to an expensive device.
Before leaving this subject it would be good to briefly discuss source noise cancellation us-
ing the external LO inputs of FSWP.
Fig. 3-9: Simple Two-Port Residual Noise Measurement, Using an External Source
Figure 3-9 shows a test configuration for a simple two-port residual noise measurement of
a DUT, using an external signal generator as the test stimulus. Looking closely, one can
see that this is a simplification of Figure 3-7 and could be used for DUTs with lower output
power. To measure the residual noise floor for this configuration the DUT is simply re-
placed with a bypass cable and the noise floor is directly measured.

1EF100_2e Rohde & Schwarz 2-Port Residual Noise Measurements
31
Fig. 3-10: FSWP Noise Floor Measurement, Using an External LO
Figure 3-10 shows an example of such a measurement. In this case, the test setup was
as described above and in Figure 3-9 (the DUT in Figure 3-9 was replaced with a bypass
cable). Prior to making the noise floor measurement an absolute phase noise measure-
ment was made of the signal generator to be used as the signal source at a frequency of
10 GHz. Next the residual phase noise floor was measured to establish the quality of
source noise cancellation. As shown in Figure 3-10, 30 to 50 dB of source noise cancella-
tion was achieved, depending on offset frequency. This illustrates the importance of using
a quality signal generator as the external LO. The better the phase noise and AM noise of
the LO signal generator the better your measurement will be.
3.2.1 Residual Noise Measurements for Pulsed High-Power Devices
Two-port residual noise measurements for high-power pulsed devices are very similar to
those described for CW devices in Section 3.2, above. The primary difference is setting up
the pulse modulation. FSWP provides a dedicated measurement personality for pulsed
additive noise measurements. The pulsed additive noise measurement is invoked by
pressing the Additive Noise radio button from the MEAS menu, shown in Figure 2-4.
NOTE: For more information about pulsed carrier noise measurements please refer to
Bibliography item Number 8.
Generally, for pulsed residual noise measurements, particularly for high power devices, an
external signal generator will be required. An external signal generator will usually provide
improved control of the pulse signal to include pulse shape, rise time, fall time, and pulse

1EF100_2e Rohde & Schwarz 2-Port Residual Noise Measurements
32
delay relative to an external trigger. Trigger delay control is important to allow the RF drive
pulse for the DUT to be properly positioned within the DUT's bias pulse. A typical example
might be a traveling wave tube amplifier (TWTA). In many cases, pulsed TWTAs will re-
quire a pulse modulated power supply to properly bias the tube. The bias pulse can be 50
to 100 per-cent wider than the RF pulse applied to the tube's helix.
For many pulsed residual noise measurements use of an oscilloscope will be necessary to
simultaneously view the bias pulse and the RF drive pulse. While viewing the oscillo-
scope, the RF signal generator's pulse delay function is adjusted to center the RF drive
pulse within the bias pulse.
3.3 Measurement of Frequency Converters
Measurement of residual or additive noise of a frequency converter is similar to that of an
amplifier, as discussed previously. The primary difference is that the input frequency and
output frequency of the converter are different. For FSWP to make a proper phase noise
measurement the FSWP mixer’s LO and RF input frequencies must be the same, requiring
the use of multiple converters. The subject of frequency converters can be rather broad
and the differences between various converter types can mandate different measurement
techniques. The following list of converter types is a starting point for discussion of con-
verter residual noise measurement techniques.
ı Multipliers
ı Dividers
ı Mixers
ı Block converters, and
ı Direct Digital Synthesizers (DDS).
As in the case of residual noise measurements for amplifiers, FSWP's internal signal
source can be used in a stand-alone mode for residual noise measurements of some clas-
ses of frequency converters while other frequency measurements will benefit by using
FSWP's external LO inputs with either the internal source or the external signal generator.
3.3.1 Residual Noise Measurements for Block Frequency Converters
Generally, block frequency converters utilize an embedded LO for use with a mixer and fil-
ters to perform the frequency conversion. In some cases, the LO may be free running, but
in most cases an external input is provided to allow the LO to be frequency locked with an
external reference, generally 10 MHz. In most cases the phase noise of a block frequency
converter will be dominated by the phase noise of the internal local oscillator, which may
moderately high.

1EF100_2e Rohde & Schwarz 2-Port Residual Noise Measurements
33
When the phase noise of the block converter is dominated by its internal LO, the simplest
approach to making a residual noise measurement is to actually make an absolute phase
noise measurement of the converter's output, using a stimulus signal whose phase noise is
much lower that of the converter's own LO. This can easily be accomplished by connect-
ing the DUT to FSWP as shown in Figure 3-11. FSWP's phase noise measurement per-
sonality allows the operator to use the internal source tuned to the converter's input fre-
quency. In this configuration the receiver will automatically acquire the converter's output
signal and measure the phase noise. This approach works quite well for up converters
with an input frequency less than 18 GHz and for many down converters, within the fre-
quency range of FSWP.
Fig. 3-11: Phase Noise Measurement Setup for a Block Frequency Converter
Figure 3-11 shows a simple method for measuring the total phase noise of frequency con-
verters whose phase noise is dominated by an internal LO and the converter's phase noise
is not particularly challenging to measure. In this case, the FSWP source is tuned to the
converter’s input frequency and the receiver is tuned to the converter’s output frequency.
This is not a true residual phase noise measurement, but an absolute phase noise meas-
urement of the converter’s total noise including:
ı The noise generated by the FSWP internal source
ı The phase noise of the converter’s internal LO, and
ı The residual phase noise of the converters mixers and amplifiers.
Since FSWP’s internal signal source is derived from one of the channel LOs the source
noise and its contribution to the DUT’s total noise is no longer uncorrelated between chan-
nels 1 and 2 and cross correlation no longer provides any advantage. Therefore,

1EF100_2e Rohde & Schwarz 2-Port Residual Noise Measurements
34
crosscorrelation is turned off and an orange warning banner is displayed at the bottom of
the phase noise measurement.
As an example of this type of simple total noise measurement, consider the Ku-Band satel-
lite up converter described below. The converter's manufacturer provides the following
specifications:
Parameter Specification
Input Frequency 950 to 1450 MHz
Output Frequency 14 to 14.5 GHz
Embedded LO Frequency 13.05 GHz
Noise Figure 15 dB
Gain 26 dB
Power Output at 1 dB compression +13 dBm
LO Phase Noise @ 10 Hz -45 dBc/Hz
LO Phase Noise @ 100 Hz -67 dBc/Hz
LO Phase Noise @ 1 kHz -77 dBc/Hz
LO Phase Noise @ 10 kHz -87 dBc/Hz
LO Phase Noise @ 100 kHz -97 dBc/Hz
LO Phase Noise @ 1 MHz -97 dBc/Hz
Table 3-3: Ku-Band Satellite Up Converter Specifications
For the above up converter an absolute phase noise measurement was set up as follows:
1. FSWP's internal power supplies were set up to power the converter and provide nec-
essary control voltages
2. The FSWP internal source was set to 1.2 GHz with an output power of -10 dBm
3. The output of the DUT was measured with FSWP's spectrum analyzer (Option B1)
and output frequency was verified to be 14.25 GHz at a level of +10 dBm
4. With the DUT operation successfully verified the FSWP internal source was set to
DUT bypass with a signal level of +10 dBm to match the DUT output level as meas-
ured in Step 3, above.
5. Next the phase noise of the internal source was measured to establish FSWP's
source contribution to the total noise at the output of the DUT and the results were
saved to trace 3
6. In preparation for the DUT phase noise measurement, the FSWP internal source out-
put level was reduced to -10 dBm (see Step 2) and the DUT bypass was turned off.
7. Finally, the [RUN SINGLE] hard was pressed to start the measurement

1EF100_2e Rohde & Schwarz 2-Port Residual Noise Measurements
35
Fig. 3-12: Phase Noise of a Ku-Band Satellite up Converter
The total phase noise for our satellite up converter, as shown in Figure 3-12 is the sum of
the stimulus signal (from FSWP's internal source) plus the converter's own LO noise and
any other residual noise generated in the converter. Referring to table 3-3 and Figure 3-12
it is apparent that the total phase noise of the converter is much lower than the worst case
LO noise specification in the manufacturer's data sheet for the converter.
Again, this is a simplified measurement that may only be useful on some frequency con-
verters with an embedded LO that is much noisier than FSWP's internal signal source and
higher than FSWP's noise floor for this configuration (See FSWP data sheet for specifica-
tions). This same technique is also useful for measuring frequency dividers and some fre-
quency multipliers. A more rigorous method of frequency converter residual noise meas-
urements will be presented in upcoming sections of this paper.
3.3.2 The Two Converter Method
As mentioned in Section 3.3 one of the problems with making a residual noise measure-
ment of frequency converters is that the input and output frequencies are different. One
method of getting around this problem is to measure two converters together. The concept
is that two converters are driven by the same source. If the converters are assumed to be
identical they would have the same output frequency and the same additive phase noise;
therefore, one converter could supply the input signal to the analyzer and the other could
supply the LO. In this case, the noise of the two converters would add and the analyzer
would measure a noise spectrum 3 dB higher than that of each individual converter. An

1EF100_2e Rohde & Schwarz 2-Port Residual Noise Measurements
36
approximation of the actual phase noise can be obtained by simply subtracting 3 dB from
the phase noise trace, using the trace-offset control in the analyzer [TRACE] menu.
Fig. 3-13: Setup for Two-Converter Method
Figure 3-13 shows the basic test setup for making a two-converter residual noise measure-
ment using the FSWP internal source as the stimulus for both converters. If desired, an
external signal generator could also be used. The important thing to remember for this
measurement is to provide the proper LO drive levels to FSWP's external LO ports, as de-
scribed in Section 3.2 when measuring amplifiers using an external LO
Since the signal generator noise (internal or external) is correlated for both the RF and LO
ports of FSWP's mixers the source noise will cancel.
The problem with the two-converter method, as mentioned above, is that we are measur-
ing the combined noise of the two converters and we can only assume that one of the con-
verters is 3 dB better than the total measured noise, but we do not know which one. The
traditional technique for getting around this problem is to measure three converters against
each other in three separate measurements and then solve for the noise of each converter
using a set of three simultaneous equations in three unknowns. FSWP provides a greatly
simplified method for determining the actual noise of the converter under test, as shown in
the next section.

1EF100_2e Rohde & Schwarz 2-Port Residual Noise Measurements
37
3.3.3 The Three-Converter Method
As mentioned in the previous section, the two-converter method has the disadvantage that
the two converters used for the measurement must be identical and that once the meas-
urement is completed the user only knows that the measured noise of one of the two con-
verters is 3 dB lower than the total measured noise. This problem is solved by using the
three-converter method.
Fig. 3-14: Setup for the Three-Converter Method
The three-converter method uses three frequency converters to provide the RF input for
FSWP and its two LO inputs. All three converters are driven by the same source (internal
or external) and therefore the source noise is correlated on both the LO and RF input ports
of each mixer and is therefore cancelled. With the two LO inputs being supplied by two in-
dependent frequency converters the phase noise of these two converters in uncorrelated
with each other and that of the DUT. Therefore, the only signal that is correlated in the two
measurement channels of FSWP is that of the DUT. With this configuration the noise of
the two converters supplying the LO signal is uncorrelated and is cancelled through cross
correlation leaving only the noise of the DUT. The three-converter method greatly im-
proves the uncertainty of frequency converter measurements at the expense of requiring a
third converter.

1EF100_2e Rohde & Schwarz 2-Port Residual Noise Measurements
38
Another important class of frequency converter residual noise measurement is that of a
block frequency converter that uses and external LO or the case of the residual noise of a
mixer. Again, the three-converter method is the best method for measuring the residual
noise of these devices.
Fig. 3-15: Three-Converter Residual Noise Setup Using a Shared LO
Quite often, it is necessary to measure the residual noise of a frequency converter that
uses an external LO. This can be accomplished by using two signal generators, where
one provides the RF input and the second generator supplies the LO signal for the mixer
(or converter) under test. Figure 3-15 shows a three-converter setup where external signal
generators are used for both the RF and LO inputs to the converters. If desired, FSWP's
internal signal source could be used to replace one of these signal generators. As with
other examples using FSWP's external LO inputs, it is important to provide the required LO
drive levels to the FSWP LO inputs. It should be noted that the signal generator's noise is
common mode on both the LO and RF ports of FSWP's internal mixers and therefore can-
cels. Also, the noise generated in the two mixers and amplifiers that are used to drive the
LO inputs is uncorrelated between FSWP Channel 1 and Channel 2 and therefore will be
cancelled by cross correlation.

1EF100_2e Rohde & Schwarz 2-Port Residual Noise Measurements
39
3.4 Measurement of Binary Frequency Dividers
Residual noise measurements for binary frequency dividers and some multipliers can be
made using the same setup that was described in Section 3.3.1 for block frequency con-
verters. Referring back to figure 2-5, note that there are a set of binary dividers and multi-
pliers immediately preceding FSWP’s LO inputs for the I/Q mixers. These dividers and
multipliers are provided to generate LO signals for the mixers when the source and re-
ceiver frequencies of FSWP are set to binary multiples of each other, allowing phase noise
measurements for external multipliers and dividers. For these measurements, it is only
necessary to refer to the FSWP data sheet and determine FSWP's noise floor at the output
frequency of the divider. The user should ensure that the measured phase noise is well
above the instrument's specified noise floor.
3.5 Measurement of Comb Frequency Multipliers
Since a comb generator can be a frequency-converting device, the two or three converter
method is recommended for this measurement, with the three-converter method being pre-
ferred. The basic concept of the comb generator is that it produces a frequency line at
each multiple of the input frequency, where:
𝐹𝑜𝑢𝑡 = ∑ 𝐹𝑖𝑛 ∙ 𝑛𝑛=𝑚
𝑛=1
When measuring the residual noise of a comb generator only one comb line can be meas-
ured at a time. Therefore, band-pass filters are required to isolate the one frequency line
of interest. In addition to the requirement for filtering, the following points should be con-
sidered:
ı Most comb generators, including devices like step recovery diodes (SRD) and non-
linear transmission lines (NRTL), are vulnerable to AM to PM conversion; therefore, it
is important to use a source with very low AM noise
ı Comb generators are also sensitive to output match. Since a band-pass filter will be
required following the comb generator, an isolator will also probably be necessary be-
tween the comb generator and the filter to minimize the filter's out of band reflections
ı Most comb generators require high drive power. An amplifier may be required to
achieve sufficiently drive level
ı Comb generators also exhibit high loss, particularly when using the higher frequency
comb lines. To that end, an amplifier following the comb generator may be required
to drive the FSWP external LO inputs.
As an example, consider a three-converter measurement of a comb generator with a 600
MHz input frequency and a 9.6 GHz output frequency (16th harmonic).

1EF100_2e Rohde & Schwarz 2-Port Residual Noise Measurements
40
Fig. 3-16: Residual Noise Setup for a Comb Generator
Figure 3-16 shows a residual noise test setup for a comb generator, using the three-con-
verter method. The following considerations apply to this measurement:
ı The internal signal source of the FSWP provides the stimulus signal for this measure-
ment. The source output is amplified to the +30 dBm level to provide approximately
+25 dBm of drive for each of the three comb generators
ı The two comb generators that are driving the FSWP LO inputs are amplified to
achieve the desired FSWP LO drive level by two low-noise amplifiers. The additive
noise produced by these amplifiers should be verified to ensure it does not influence
the final phase noise measurement; however, most of this noise will be cancelled
through cross correlation.
ı An isolator follows each comb generator to improve the comb generator's load match
preventing parametric oscillations, which would spoil the phase noise measurement.
ı Finally, a 9.6 GHz band-pass filter removes all of the unwanted frequency lines in the
output spectrum of the comb generator ensuring that FSWP only processes the fre-
quency line of interest, in this case 9.6 GHz
ı Since the three-converter method was used, the phase noise measured is that of the
DUT connected to FSWP's RF input. If the two-converter method was used 3 dB will
need to be subtracted from the measured phase noise, assuming both devices have
identical phase noise.

1EF100_2e Rohde & Schwarz 2-Port Residual Noise Measurements
41
ı To get an idea of the noise contributed by the comb generator, in excess of that of a
perfect multiplier, make an absolute phase noise measurement of the signal source
and scale the phase noise in frequency by 20∙Log(n), where n is the frequency multi-
plier (in this case 16). The measured phase noise of the comb generator can now be
compared to the theoretical performance of a perfect multiplier.
3.6 Residual Phase Noise of a DDS
The direct digital synthesizer or DDS is a frequency synthesizer that is used for creating
arbitrary waveforms from a single fixed clock signal. DDSs are key components in radar
and communications system and their phase noise is therefore a critical system-level
specification. The residual phase noise of the DDS is the DDS noise minus the effects of
the clock oscillator.
For the DDS residual noise measurement the two or three-converter methods are both sat-
isfactory based on expected phase noise. However, the three-converter method provides
better performance due to the advantages of cross correlation.
Fig. 3-17: Residual Noise Measurement Setup for a DDS
Figure 3-17 shows a three-converter measurement setup for measuring the residual noise
of a DDS. The following considerations apply to this setup:

1EF100_2e Rohde & Schwarz 2-Port Residual Noise Measurements
42
ı Either the two-converter method or three-converter method are required for this as in
other frequency converter residual noise measurements. The three-converter method
was chosen for this measurement to allow cross correlation to minimize the noise
generated by the DDSs that were used to provide FSWP's LO signals.
ı The noise produced by the signal generator is common mode to the RF and LO inputs
of FSWP's mixers and is therefore cancelled
ı For this setup, a signal generator (R&S SMA100B) was used as a 6 GHz clock signal
for the DDS. A four-way power divider (due to lack of a three-way) delivered approxi-
mately +6 dBm of drive level to each of three DDSs.
ı Since the DDS had insufficient output power to drive FSWP's LO inputs, an amplifier
was used to boost the power with an attenuator to reduce the amplified signal to the
proper level
ı All three of the DDSs were configured to produce a 1.5 GHz output signal. This signal
was used for both FSWP LO inputs and the RF input.
Fig. 3-18: Phase Noise Measurement of a DDS
Figure 3-18 shows the measurement results for the DDS phase noise measurement. The
spot-noise table lists the phase noise at the cardinal offset frequencies for the yellow trace.
The green trace, showing the phase noise hump near the 10 MHz offset frequency, was
made using a small packaged oscillator; whereas, the yellow trace was made using a
Rohde & Schwarz SMA100B signal generator as the source. The hump in the green trace
is the result of high AM noise from the test oscillator, showing the need for using test sig-
nals with low AM and broadband noise.

1EF100_2e Rohde & Schwarz 2-Port Residual Noise Measurements
43
3.7 Residual Noise Measurement of Frequency Synthesizers
Frequency synthesizers are important building blocks for many radar and communications
systems. The idea of residual phase noise of a synthesizer is to measure the phase noise
of the synthesizer's PLL excluding the contribution of the reference section of the synthe-
sizer. Knowing the residual noise of a synthesizer is important for synthesizer designers
that are trying to optimize a design or for system engineers that want to know how a syn-
thesizer in their design will affect overall system phase noise assuming that they employ a
system clock that acts as a reference for several system blocks. Lastly, one important
synthesizer residual noise measurement is for calibration laboratories where the residual
phase noise of off-the-shelf signal generators must be verified, as part of the instrument's
calibration process.
Fig. 3-19: Setup for measuring the Residual Noise of a Frequency Synthesizer
The following conditions apply for the synthesizer residual noise measurement shown in
Figure 3-19:
ı The two-converter method was used for this measurement.
ı The two synthesizers are assumed to be identical. If this is not a valid assumption,
the three-converter method must then be used.
ı The measured noise is the sum of the two synthesizers shown in Figure 3-19; there-
fore, 3 dB must be subtracted from the measurement results.

1EF100_2e Rohde & Schwarz 2-Port Residual Noise Measurements
44
ı The master synthesizer provides the LO signals for FSWP. Additionally, the master
synthesizer provides the reference clock to the synthesizer under test. Therefore, the
reference clock's noise is common mode to both the RF and LO inputs of FSWP's
mixers and is cancelled, leaving only the noise generated by the remaining sections of
the synthesizer under test.
ı Both synthesizers must be set to the same frequency.
Fig. 3-20: Residual Phase Noise of R&S SMA100 Signal Generator
Figure 3-20 shows the measured phase noise of two R&S SMA100B signal generators.
The SMA100B has three reference inputs: 10 MHz, 100MHz, and 1 GHz. Each of these
references can be shared with other generators or can be connected to customer house
references.
Measurement conditions:
ı For the above measurement, both of the signal generators were tuned to 10 GHz
ı The measurement noise floor was established by inserting a power splitter at the out-
put of master synthesizer and connecting one of the outputs to the FSWP's input and
the other to the LO splitter. Then a normal residual phase noise measurement was
made and saved to the cyan trace.
ı Three separate phase noise measurements were made with each of the three refer-
ences (10 MHz, 100 MHz, and 1 GHz) inter-connected between the two signal gener-
ators. The results of these measurements were saved on one screen to allow com-
parison.

1EF100_2e Rohde & Schwarz 2-Port Residual Noise Measurements
45
3.8 Extending Residual Noise Measurements above 18 GHz
As described in Section 2.1, FSWP's internal source and external LO connectors are lim-
ited to a frequency range of 10 MHz through 18 GHz. This frequency range can be ex-
tended above 18 GHz by using external mixers. One example is the Marki Microwave
MLIQ-1845L. The Marki MLIQ-1845L is a connectorized 18 to 45 GHz double-balanced
I/Q mixer. When used with FSWP, the mixer's I/Q outputs are connected to FSWP's base-
band inputs.
The simplest measurement setup, when using the Marki mixer, is for a residual noise
measurement of a small-signal amplifier. For this measurement the output of an external
signal source is split with one splitter path providing the LO signal for the mixer and the re-
maining splitter path driving the DUT, whose output is connected to the mixer's RF port.
Fig. 3-21: Amplifier Residual Noise Setup Using a Marki MLIQ-1845L Mixer
Test Conditions, for Figure 3-21:
ı For the measurement shown in Figure 3-12, a Marki Microwave MLIQ-1845L double-
balanced I/Q mixer was used to convert the amplifier's output down to base band
ı The signal generator's output is split to drive the DUT and the mixer's LO input, with
the DUT's output driving the mixer's RF input port

1EF100_2e Rohde & Schwarz 2-Port Residual Noise Measurements
46
ı The signal generator was tuned to 25 GHz and the generator's output level was ad-
justed to achieve the correct LO drive for the mixer
ı The attenuator at the DUT's input was adjusted to achieve the correct DUT drive level
ı A power meter is included to allow monitoring of the DUT drive level
ı The attenuator on the DUT's output was selected to prevent overdrive of the mixer.
FSWP's external mixer configuration menu is accessed by pressing the [INPUT / OUT-
PUT] hard key and selecting the {Base Band} tab, while in the Additive Phase Mode, as
shown below:
Fig. 3-22: FSWP External Mixer Menu
3.8.1 Using an External Mixer for Frequency Converter Measurements.
The Marki Mixer described in Section 3.8 may also be used for residual phase noise meas-
urements of frequency converters, using the two-converter method.

1EF100_2e Rohde & Schwarz 2-Port Residual Noise Measurements
47
Fig. 3-23: Frequency Converter Residual Phase Noise, Using an External Mixer
Figure 3-23 shows the connection diagram when using the Marki MLIQ1845L mixer for re-
sidual phase noise measurements of frequency converters. The considerations for a two-
converter measurement also apply when using an external mixer. The following items
should also be considered:
ı As with other two-converter measurements, the converters should be identical and the
measurement result will be the sum of the noise produced by both converters; there-
fore, 3 dB should be subtracted from the measurement
ı Attenuators and or amplifiers may be necessary to achieve proper mixer LO and RF
port drive levels
ı Measurement noise floor can be established by connecting the output of the source
splitter directly to the mixer's LO and RF ports, with appropriate attenuation to provide
the same signal levels that will be used for the final measurement
ı Other mixers may be selected to cover different frequency ranges.

1EF100_2e Rohde & Schwarz 2-Port Residual Noise Measurements
48
4 Conclusions
Although noise figure is one of the most common specifications for amplifiers and fre-
quency converters, it does not represent the true added noise of the device under anything
but small-signal conditions and is an average of the noise in carrier offsets within a 4 MHz
bandwidth. If you want to measure the added noise of a device, using noisy power sup-
plies or in compression, noise figure will reveal little regarding the device performance. In
addition, noise figure does not provide any information about the noise close to the carrier,
which may be of vital importance in many RF systems, such as, digital radios and radar
systems.
A residual phase noise measurement:
ı Provides detailed information pertaining to the additive noise of a two-port device over
a wide range of offset frequencies from the carrier
ı Provides an understanding of the device noise performance over a broad range of in-
put power, from small signal to deep compression
ı Can define large-signal noise figure.
In the past, residual phase noise measurements have been considered too difficult and
time consuming and have generally been avoided for this reason. Today, FSWP simplifies
residual noise measurements to the point that there is no longer an excuse for not measur-
ing residual noise (both AM and PM) of two-port devices.

1EF100_2e Rohde & Schwarz 2-Port Residual Noise Measurements
49
5 Bibliography
[1] Frequency, IEEE Standards Coordinating Committee 27 on Time and. IEEE
Standard 1139, Definitions of Physical Quantities for Fundamental Time and
Frequency. New York, New York : IEEE, 2009.
[2] Phase Noise and AM Noise Measurements in the Frequency Domain. Algie L Lance,
Wendell D Seal, and Frederik Labaar. Redondo Beach, California, USA : Milimeter
Waves, 1984. Vol 11, Page 239-289.
[3] Rohde & Schwarz. R&S FSWP Phase Noise Analyzer and VCO Tester, Product
Brochure. Munich Germany : Rohde & Schwarz, 2017.
[4] A 1 MHz to 50 GHz Direct Down-Conversion Phase Noise Analyzer with Cross-
Correlation. Feldhaus, Gregor and Roth, Alexander. York, UK : IEEE, April 2016.
European Frequency and Time Forum (EFTE), 2016.
[5] A Collapse of the Cross-Spectral Function in Phase Noise Metrology. Nelson, C.W.,
Hati, A. and Howe, D.A. Boulder, Colorado 80305, USA : National Institute of
Standards and Technology, 2014.
[6] FSWP Phase Noise Analyzer Specifications. Rohde & Schwarz. 4 Dec 2016,
Munich : s.n., 2016. FSWP_dat-sw_en_3607-2090-22_v0500.
[7] Pulse Phase Noise Application Note. Rohde & Schwarz. Munich : Rohde & Schwarz,
2016. 5.2016-1EF94_01E.
[8] Breitbarth, Jason and Koebel, Joe. Additive (Residual) Phase Noise Measurement
of Amplifiers, Frequency Dividers and ... Microwave Journal. 2008, 16 June 2008.
[9] Noise Figure vs. PM Noise Measurements: A Study at Microwave Frequencies. A.
Hati, D.A. Howe, F.L. Walls, and D. Walker. 2003. Proceedings of the 2003
International Frequency and Control Symposium.

1EF100_2e Rohde & Schwarz 2-Port Residual Noise Measurements
50
6 Ordering Information
Designation Type Order No.
Phase Noise Analyzer, 1 MHz to 8 GHz R&S®FSWP8 1322.8003.08
Phase Noise Analyzer, 1 MHz to 26.5 GHz R&S®FSWP26 1322.8003.26
Phase Noise Analyzer, 1 MHz to 50 GHz R&S®FSWP50 1322.8003.50
Options
Designation Type Order No. Retrofit-
table
Remarks
Cross-Correlation, 8 GHz R&S®FSWP-B60 1322.9800.08 yes for R&S®FSWP8;
contact service center
Cross-Correlation, 26 GHz R&S®FSWP-B60 1322.9800.26 yes for R&S®FSWP26;
retrofittable in factory
Cross-Correlation, 50 GHz R&S®FSWP-B60 1322.9800.50 yes for R&S®FSWP50;
retrofittable in factory
Cross-Correlation (low
phase noise),
8 GHz
R&S®FSWP-B61 1325.3719.08 yes for R&S®FSWP8;
contact service center
includes R&S®FSWP-B4
Cross-Correlation (low
phase noise), 26 GHz
R&S®FSWP-B61 1325.3719.26 yes for R&S®FSWP26;
retrofittable in factory
includes R&S®FSWP-B4
Cross-Correlation (low
phase noise), 50 GHz
R&S®FSWP-B61 1325.3719.50 yes for R&S®FSWP50;
retrofittable in factory
includes R&S®FSWP-B4
Additive Phase Noise
Measurements
R&S®FSWP-B64 1322.9900.26 yes frequency range 10 MHz to
8 GHz for R&S®FSWP8,
10 MHz to 18 GHz for
R&S®FSWP26 and
R&S®FSWP50;
R&S®FSWP-B60 or B61 op-
tion
required;
contact service center
High Stability OCXO R&S®FSWP-B4 1325.3890.02 yes user-retrofittable
Spectrum Analyzer, 10 Hz
to 8 GHz
R&S®FSWP-B1 1322.9997.08 yes for R&S®FSWP8;
retrofittable in factory
Spectrum Analyzer, 10 Hz
to 26 GHz
R&S®FSWP-B1 1322.9997.26 yes for R&S®FSWP26;
retrofittable in factory

1EF100_2e Rohde & Schwarz 2-Port Residual Noise Measurements
51
Designation Type Order No. Retrofit-
table
Remarks
Spectrum Analyzer, 10 Hz
to 50 GHz
R&S®FSWP-B1 1322.9997.50 yes for R&S®FSWP50;
retrofittable in factory
External Generator Control R&S®FSWP-B10 1325.5463.02 yes contact service center
Resolution Bandwidth > 10
MHz
R&S®FSWP-B8 1325.5028.26 no for R&S®FSWP8/26 with
R&S®FSWP-B1 option;
the signal analysis bandwidth
is defined by the R&S®FSWP-
B80 option, not by the
R&S®FSWP-B8 option.
Resolution Bandwidth > 10
MHz
R&S®FSWP-B8 1325.5028.02 no for R&S®FSWP50 with
R&S®FSWP-B1 option;
the signal analysis bandwidth
is defined by the R&S®FSWP-
B80 option, not by the
R&S®FSWP-B8 option;
export license required
High-pass Filter for Har-
monic Measurements
R&S®FSWP-B13 1325.4350.02 yes for R&S®FSWP8/26/50 with
R&S®FSWP-B1 option;
user-retrofittable
LO/IF Connections for ex-
ternal mixers
R&S®FSWP-B21 1325.3848.02 yes for R&S®FSWP26/50;
contact service center
RF Preamplifier, 100 kHz
to 8 GHz
R&S®FSWP-B24 1325.3725.08 yes for R&S®FSWP8 with
R&S®FSWP-B1 option;
contact service center
RF Preamplifier, 100 kHz
to 26.5 GHz
R&S®FSWP-B24 1325.3725.26 yes for R&S®FSWP26 with
R&S®FSWP-B1 option;
contact service center
RF Preamplifier, 100 kHz
to 50 GHz
R&S®FSWP-B24 1325.3725.50 yes for R&S®FSWP50 with
R&S®FSWP-B1 option;
contact service center
80 MHz Analysis Band-
width
R&S®FSWP-B80 1325.4338.02 yes for R&S®FSWP8/26/50 with
R&S®FSWP-B1 option;
user-retrofittable
Spare Solid State Drive
(removable hard drive)
R&S®FSWP-B18 1331.4313.02 yes user-retrofittable

1EF100_2e Rohde & Schwarz 2-Port Residual Noise Measurements
52

1EF100_2e Rohde & Schwarz 2-Port Residual Noise Measurements
53
Rohde & Schwarz
The Rohde & Schwarz electronics group offers inno-
vative solutions in the following business fields: test
and measurement, broadcast and media, secure
communications, cybersecurity, radiomonitoring and
radiolocation. Founded more than 80 years ago, this
independent company has an extensive sales and
service network and is present in more than 70 coun-
tries.
The electronics group is among the world market
leaders in its established business fields. The com-
pany is headquartered in Munich, Germany. It also
has regional headquarters in Singapore and Colum-
bia, Maryland, USA, to manage its operations in
these regions.
Regional contact
Europe, Africa, Middle East +49 89 4129 12345 [email protected] North America 1 888 TEST RSA (1 888 837 87 72) [email protected] Latin America +1 410 910 79 88 [email protected] Asia Pacific +65 65 13 04 88 [email protected]
China +86 800 810 82 28 |+86 400 650 58 96 [email protected]
Sustainable product design
ı Environmental compatibility and eco-footprint
ı Energy efficiency and low emissions
ı Longevity and optimized total cost of ownership
This application note and the supplied programs
may only be used subject to the conditions of use
set forth in the download area of the Rohde &
Schwarz website.
R&S® is a registered trademark of Rohde & Schwarz GmbH & Co.
KG; Trade names are trademarks of the owners.
Rohde & Schwarz GmbH & Co. KG
Mühldorfstraße 15 | 81671 Munich, Germany
Phone + 49 89 4129 - 0 | Fax + 49 89 4129 – 13777
PA
D-T
-M:
3573.7
380.0
2/0
2.0
5/E
N/