2 kinematics 2011 -...
TRANSCRIPT
Kinematics
John K. HorneUniversity of Washington
LO: extrapolate effects of physical conditions on the kinematics of ELH stages of fish
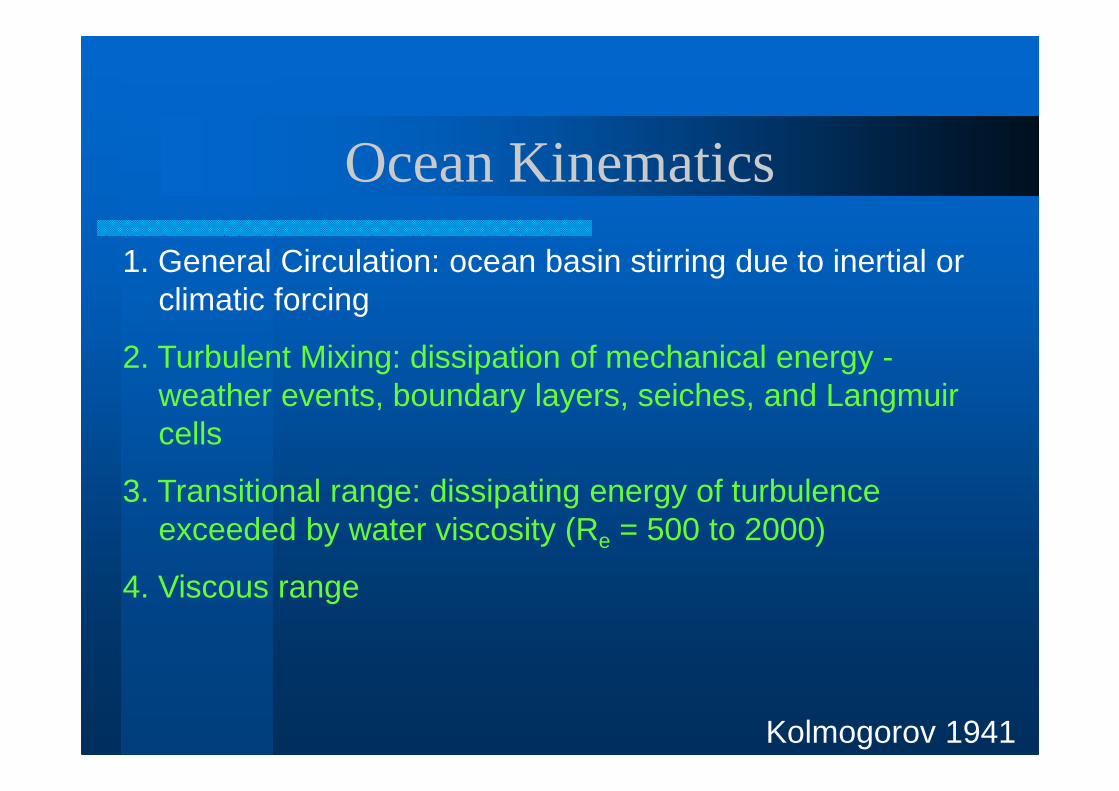
Ocean Kinematics
1. General Circulation: ocean basin stirring due to inertial or climatic forcing
2. Turbulent Mixing: dissipation of mechanical energy -weather events, boundary layers, seiches, and Langmuir cells
3. Transitional range: dissipating energy of turbulence exceeded by water viscosity (Re = 500 to 2000)
4. Viscous range
Kolmogorov 1941
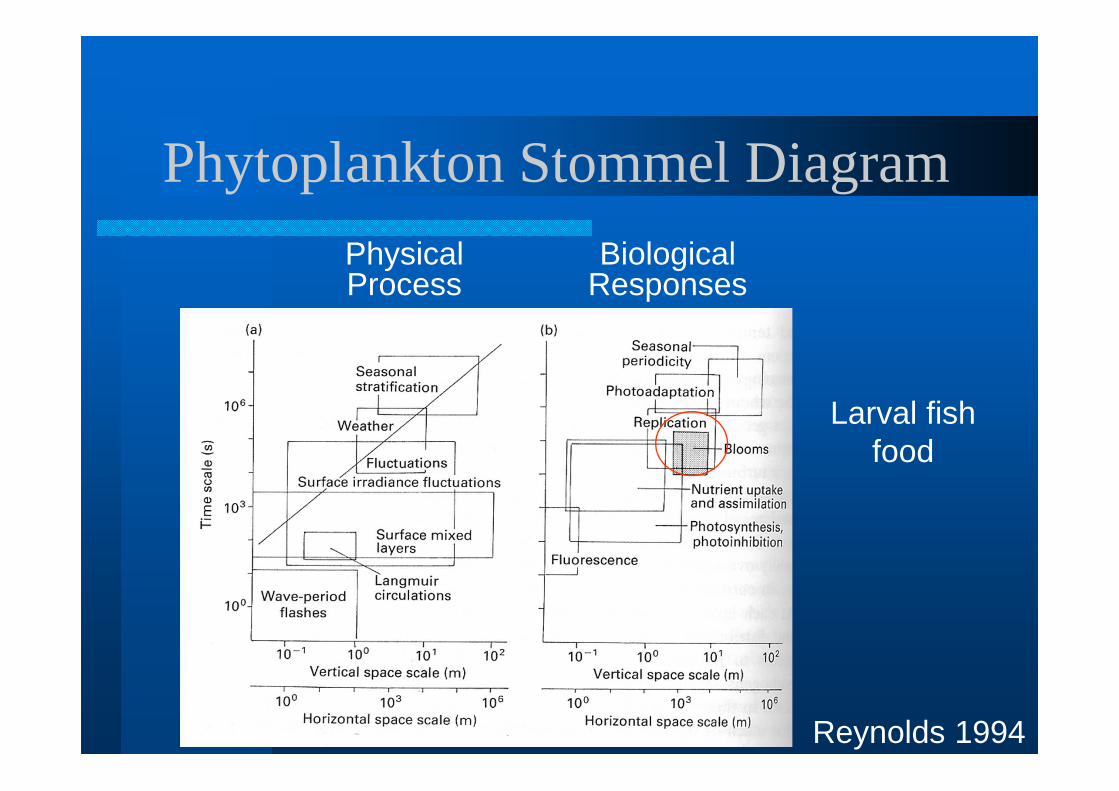
Phytoplankton Stommel Diagram
Reynolds 1994
Physical Process
Biological Responses
Larval fish food
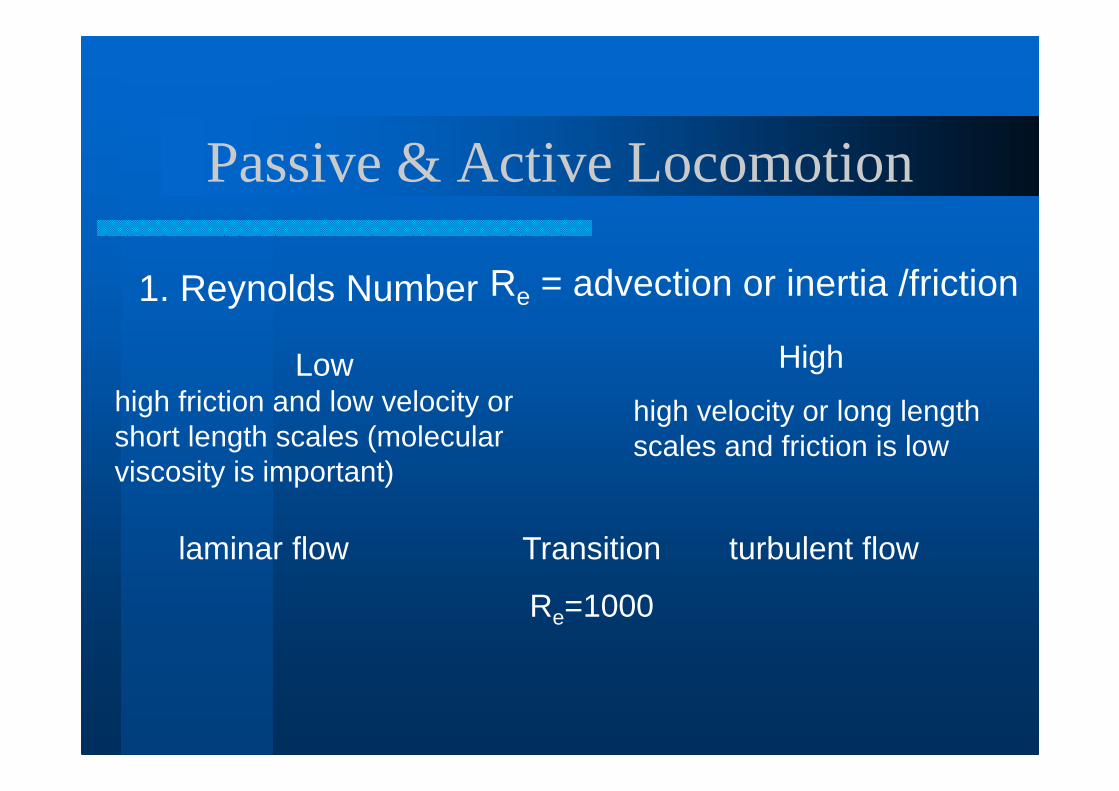
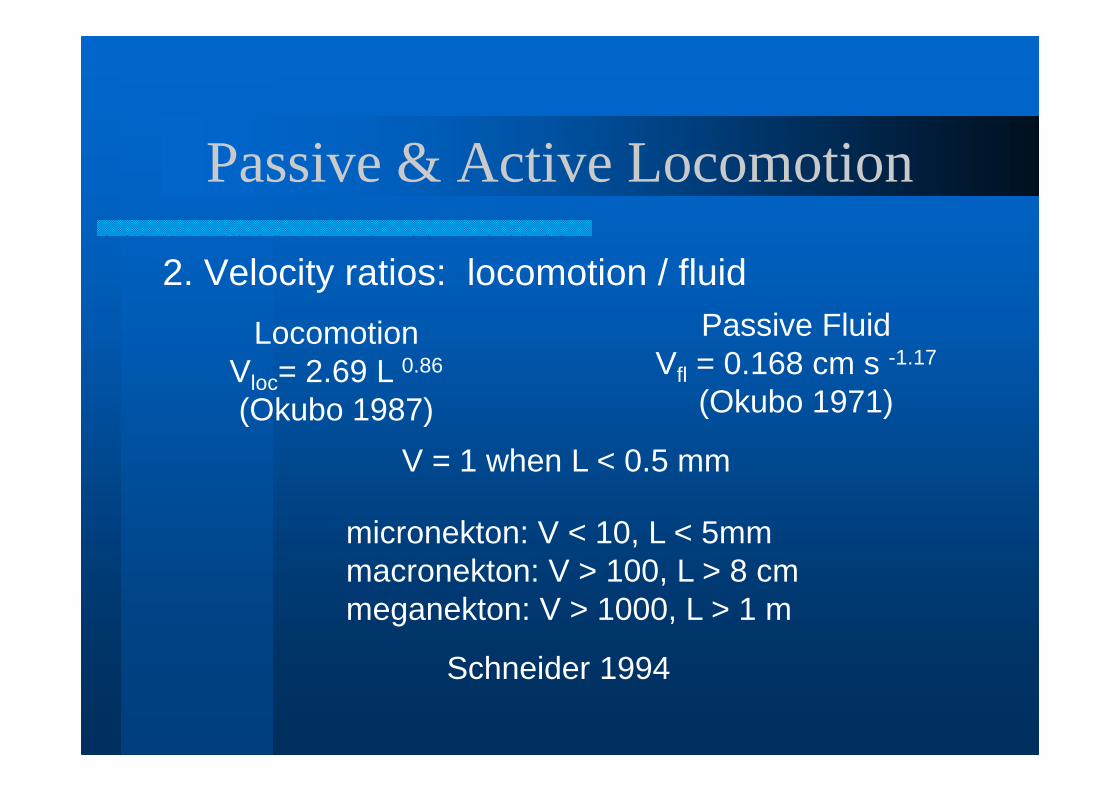
Passive & Active Locomotion
Re = advection or inertia /friction
Low high friction and low velocity or short length scales (molecular viscosity is important)
High
high velocity or long length scales and friction is low
Transition
Re=1000
laminar flow turbulent flow
1. Reynolds Number
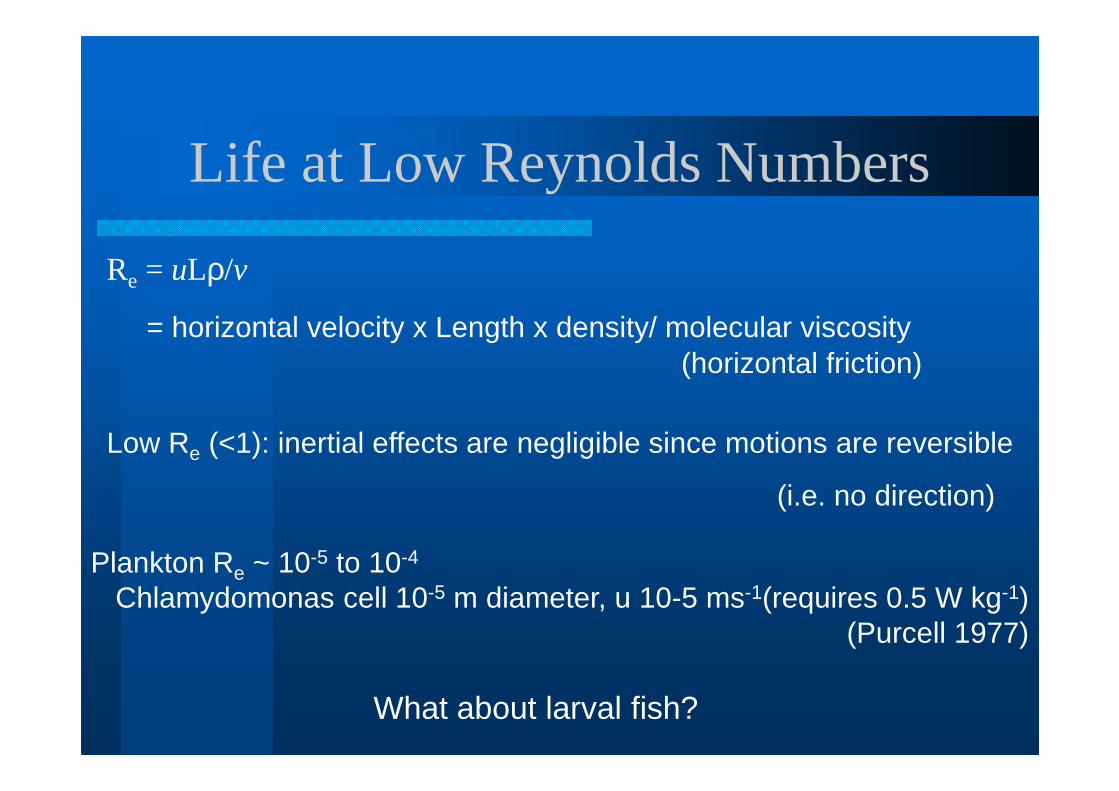
Life at Low Reynolds Numbers
Re = uLρ/v
= horizontal velocity x Length x density/ molecular viscosity (horizontal friction)
Low Re (<1): inertial effects are negligible since motions are reversible
(i.e. no direction)
Plankton Re ~ 10-5 to 10-4
Chlamydomonas cell 10-5 m diameter, u 10-5 ms-1(requires 0.5 W kg-1) (Purcell 1977)
What about larval fish?
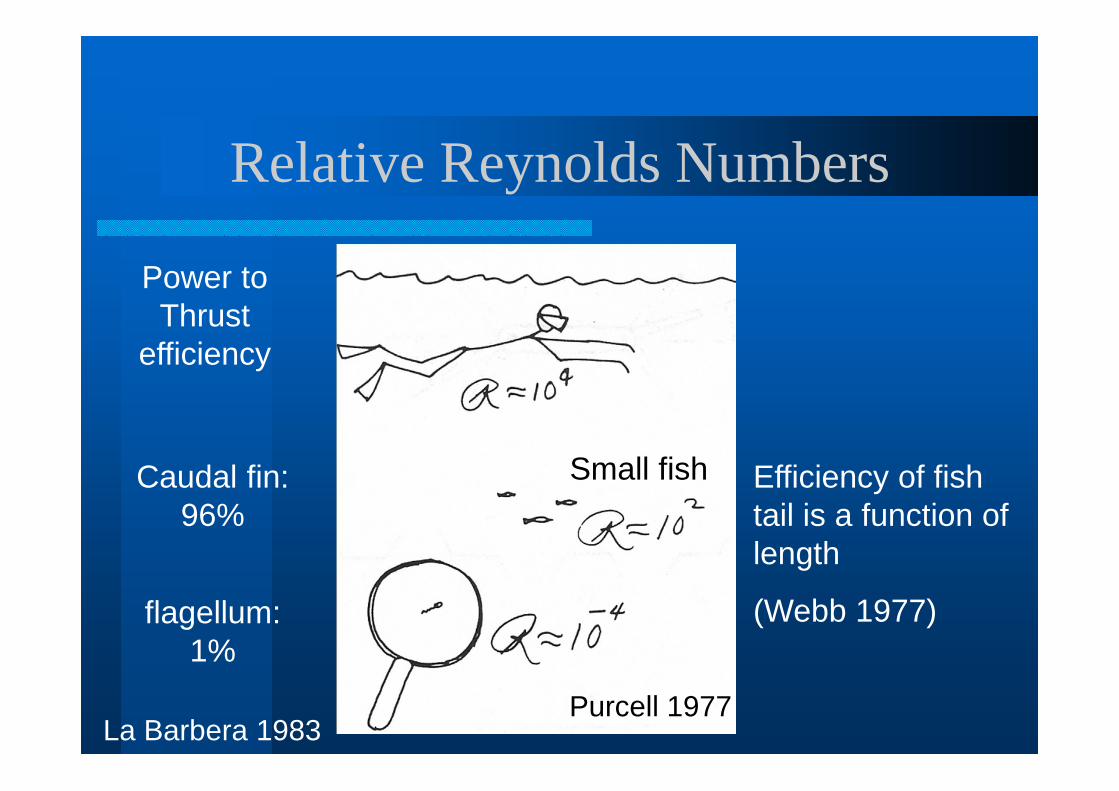
Relative Reynolds Numbers
Small fish
Purcell 1977
flagellum: 1%
Caudal fin: 96%
Power to Thrust
efficiency
La Barbera 1983
Efficiency of fish tail is a function of length
(Webb 1977)
Passive & Active Locomotion
2. Velocity ratios: locomotion / fluid
LocomotionVloc= 2.69 L 0.86
(Okubo 1987)
Passive FluidVfl = 0.168 cm s -1.17
(Okubo 1971)
V = 1 when L < 0.5 mm
micronekton: V < 10, L < 5mmmacronekton: V > 100, L > 8 cmmeganekton: V > 1000, L > 1 m
Schneider 1994
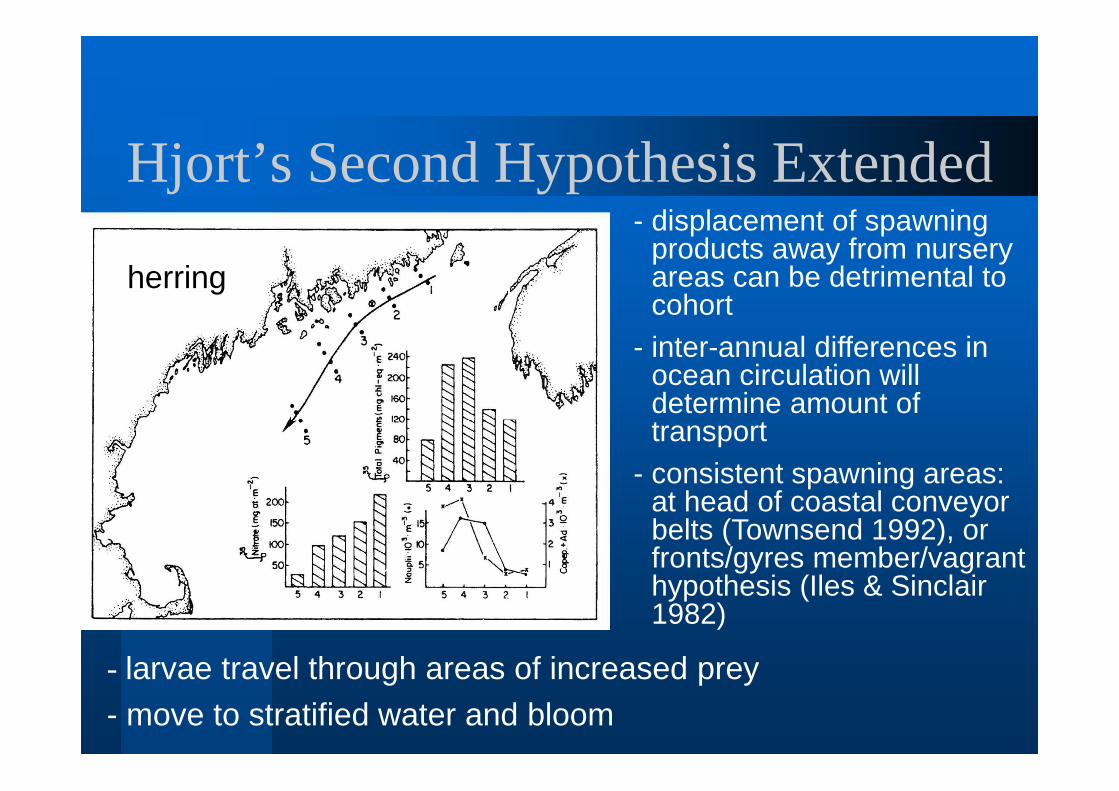
Hjort’s Second Hypothesis Extended- displacement of spawning
products away from nursery areas can be detrimental to cohort
- inter-annual differences in ocean circulation will determine amount of transport
- consistent spawning areas: at head of coastal conveyor belts (Townsend 1992), or fronts/gyres member/vagrant hypothesis (Iles & Sinclair 1982)
- larvae travel through areas of increased prey
- move to stratified water and bloom
herring
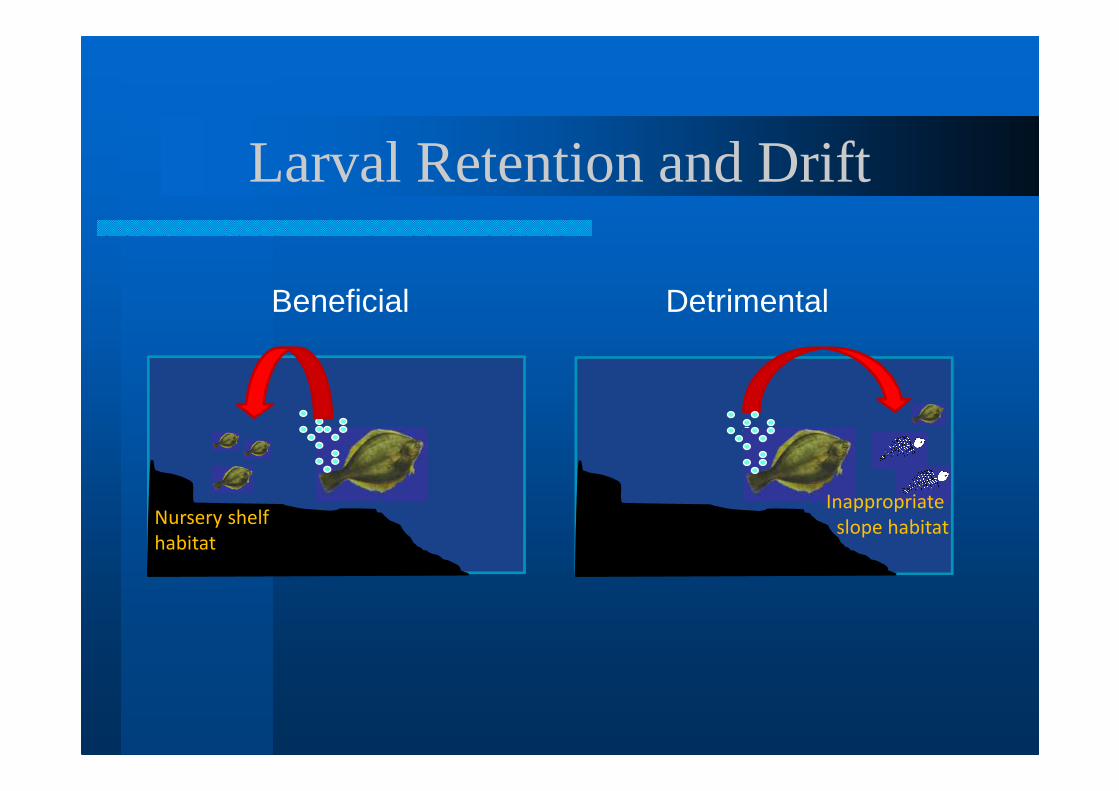
Larval Retention and Drift
Nursery shelf
habitat
Inappropriate
slope habitat
Beneficial Detrimental
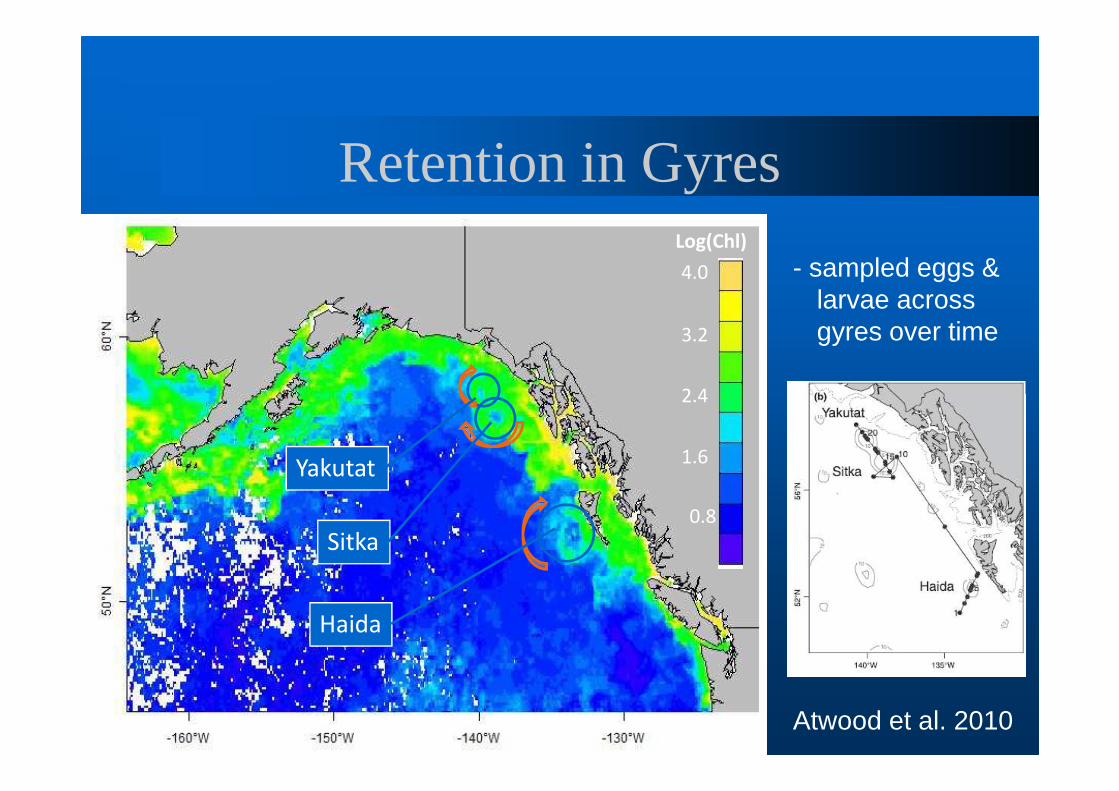
Retention in GyresLog(Chl)
4.0
3.2
2.4
1.6
0.8
Haida
Sitka
Yakutat
Atwood et al. 2010
- sampled eggs & larvae across gyres over time
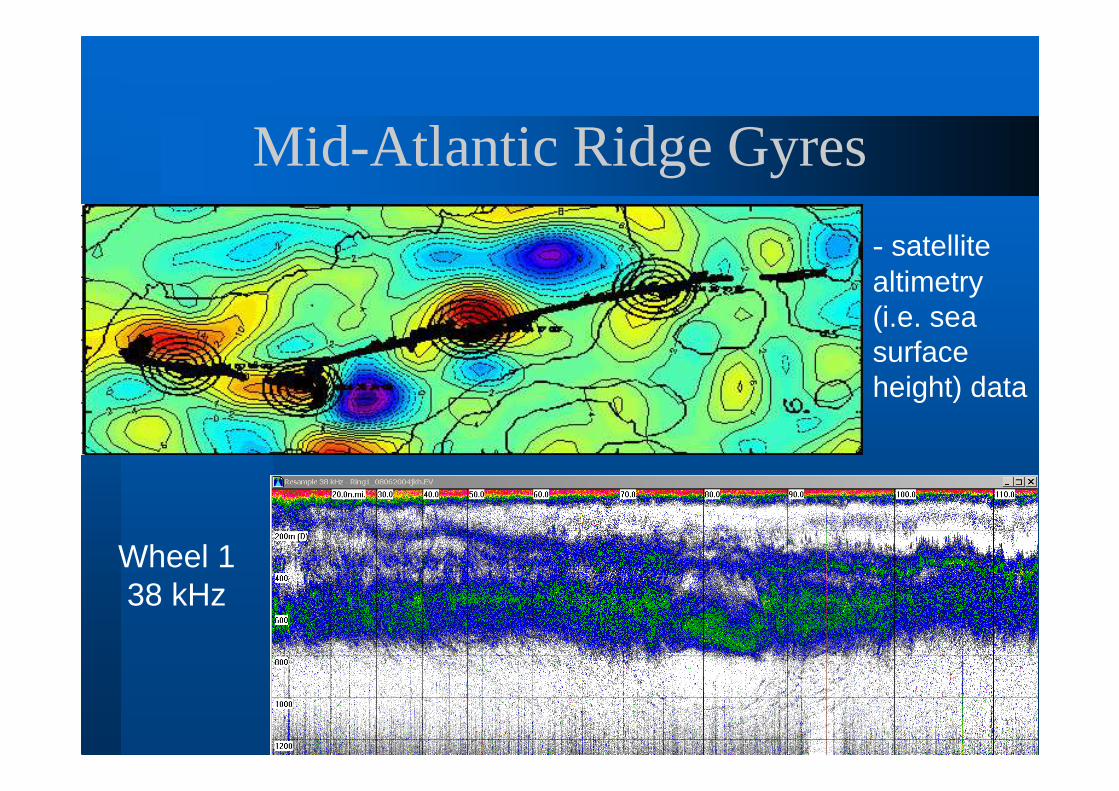
Mid-Atlantic Ridge Gyres
- satellite altimetry (i.e. sea surface height) data
Wheel 1 38 kHz
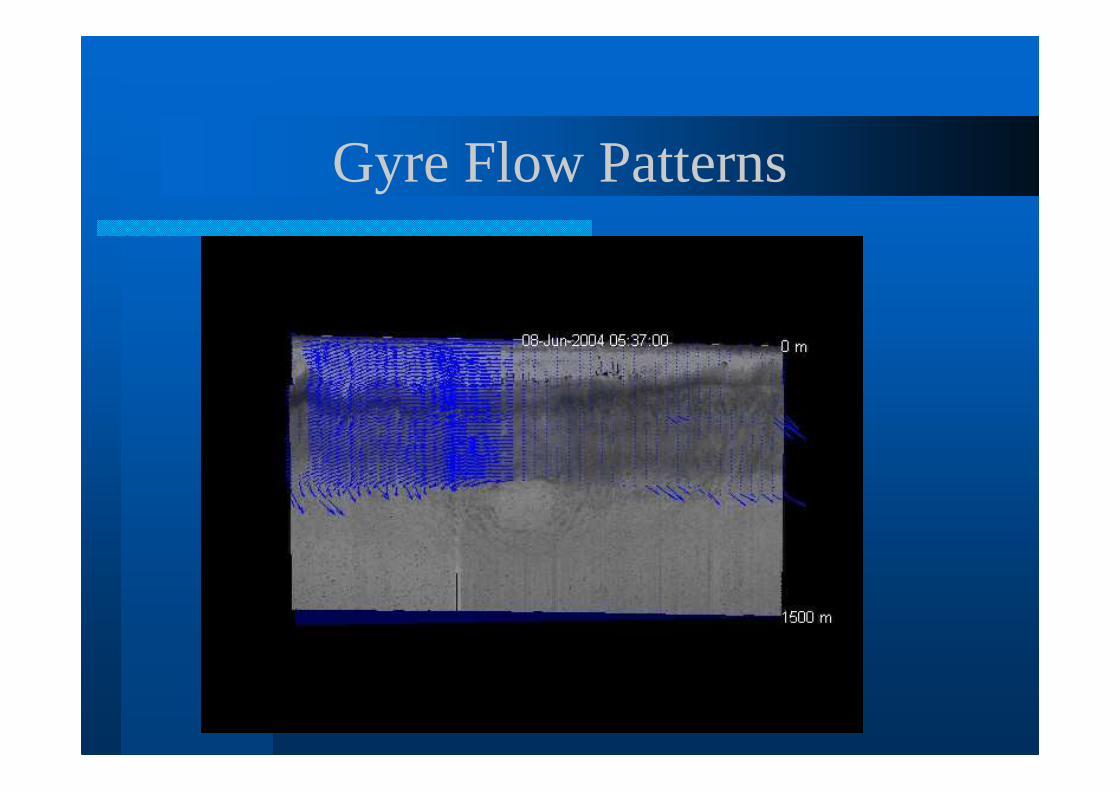
Gyre Flow Patterns
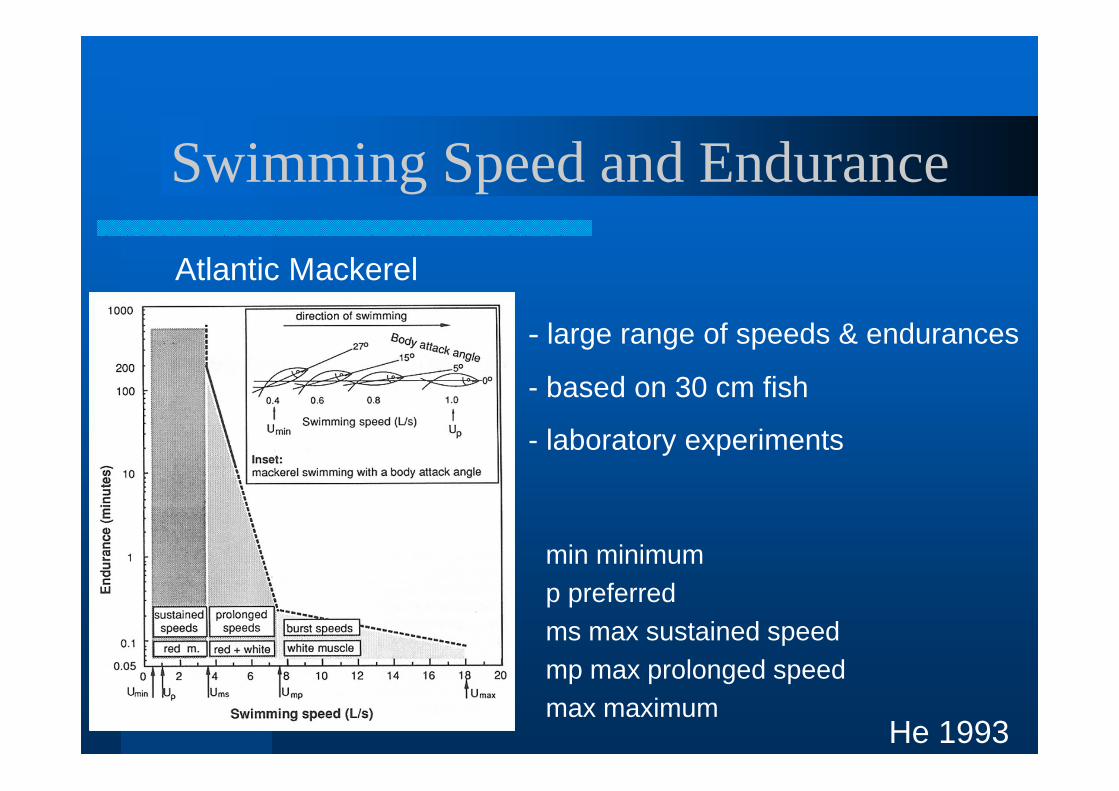
Swimming Speed and Endurance
- large range of speeds & endurances
- based on 30 cm fish
- laboratory experiments
He 1993
Atlantic Mackerel
min minimump preferredms max sustained speedmp max prolonged speedmax maximum
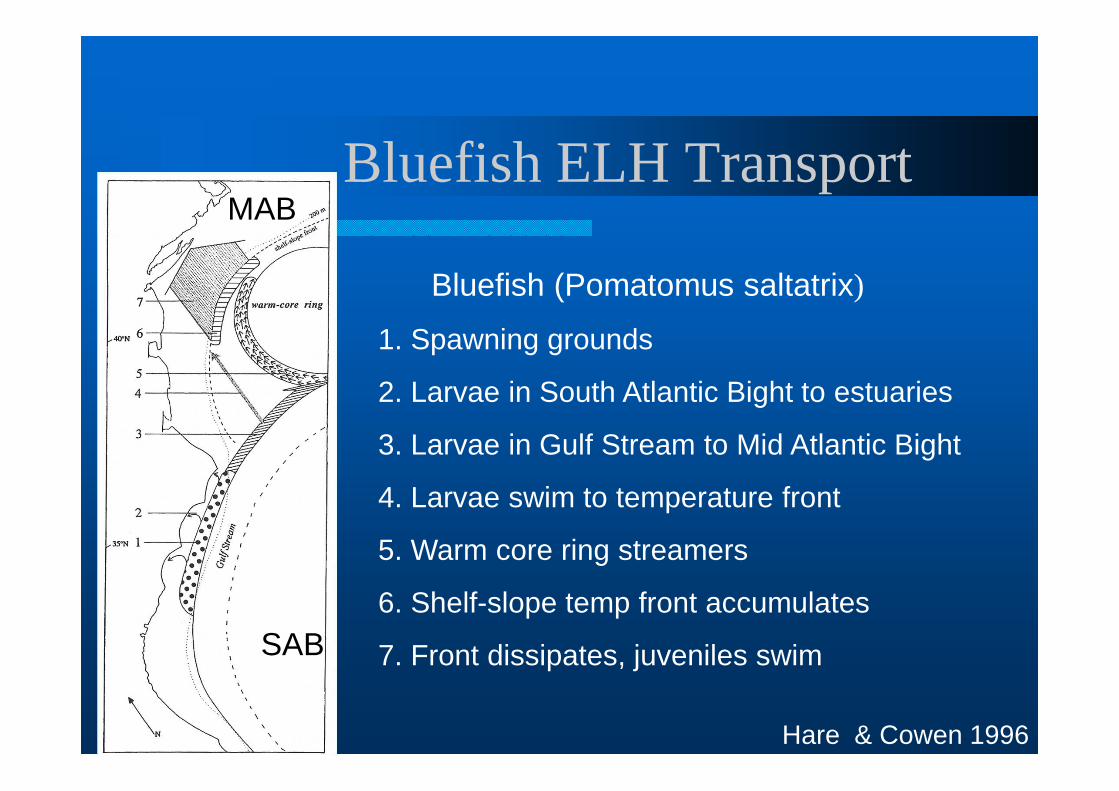
Bluefish ELH Transport
1. Spawning grounds
2. Larvae in South Atlantic Bight to estuaries
3. Larvae in Gulf Stream to Mid Atlantic Bight
4. Larvae swim to temperature front
5. Warm core ring streamers
6. Shelf-slope temp front accumulates
7. Front dissipates, juveniles swim
Bluefish (Pomatomus saltatrix)
SAB
MAB
Hare & Cowen 1996
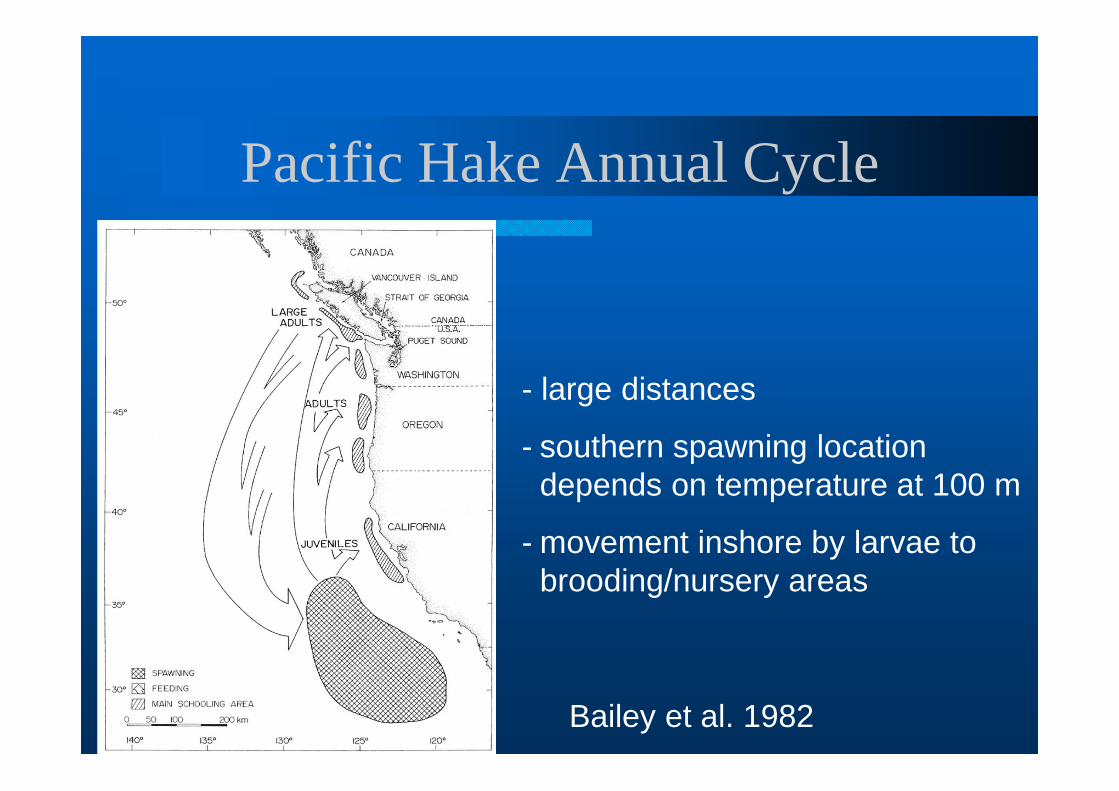
Pacific Hake Annual Cycle
- large distances
- southern spawning location depends on temperature at 100 m
- movement inshore by larvae to brooding/nursery areas
Bailey et al. 1982

Western
EasternBlock et al. 2005
- common feeding grounds
- separate spawning grounds
Bluefin Tuna Extreme Migration
Kinematic Influences on Surveys
Adults
- migration potentially adds multiplicative error that depends on speed of survey relative to migration
- minimize bias by repeating surveys with and against migration, then averaging survey values
ELH
- variability in density/abundance samples dependent on sample volume, sample resolution, patchiness in larvae
- patchiness balance among spawning location, egg batch size, advection, predation, time to motility
Kinematic Influences on Surveys
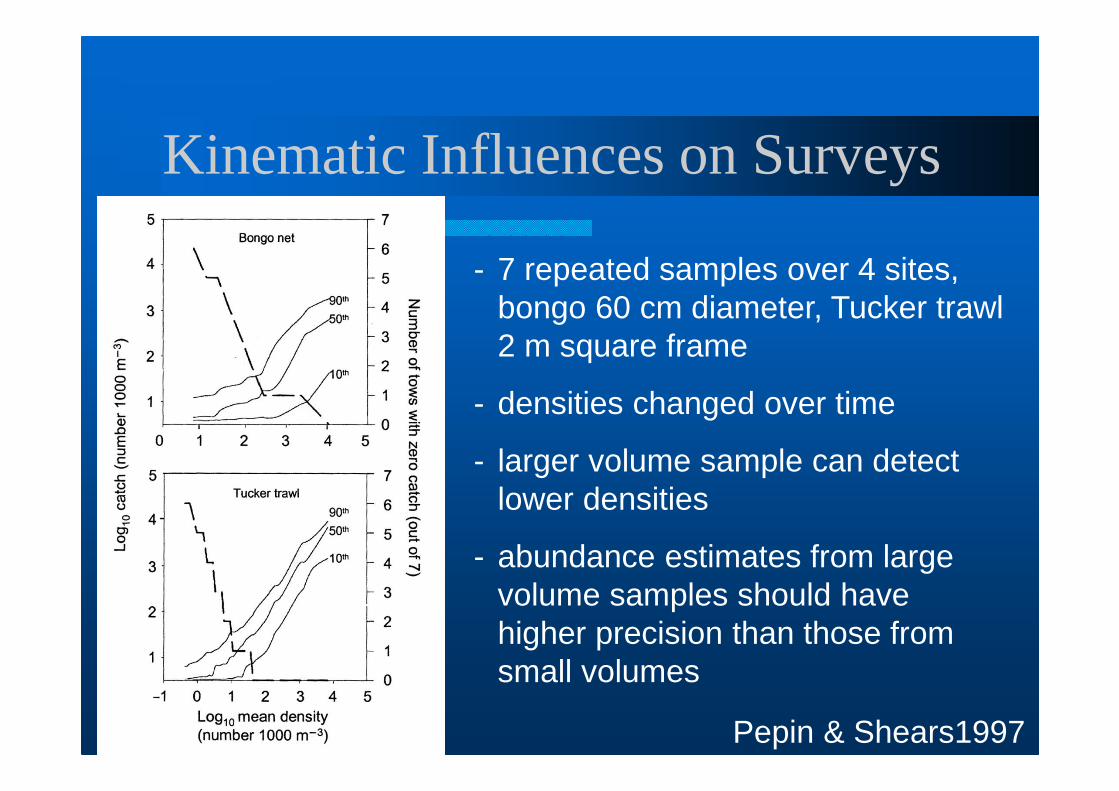
Pepin & Shears1997
- 7 repeated samples over 4 sites, bongo 60 cm diameter, Tucker trawl 2 m square frame
- densities changed over time
- larger volume sample can detect lower densities
- abundance estimates from large volume samples should have higher precision than those from small volumes
Kinematic Influences on Surveys
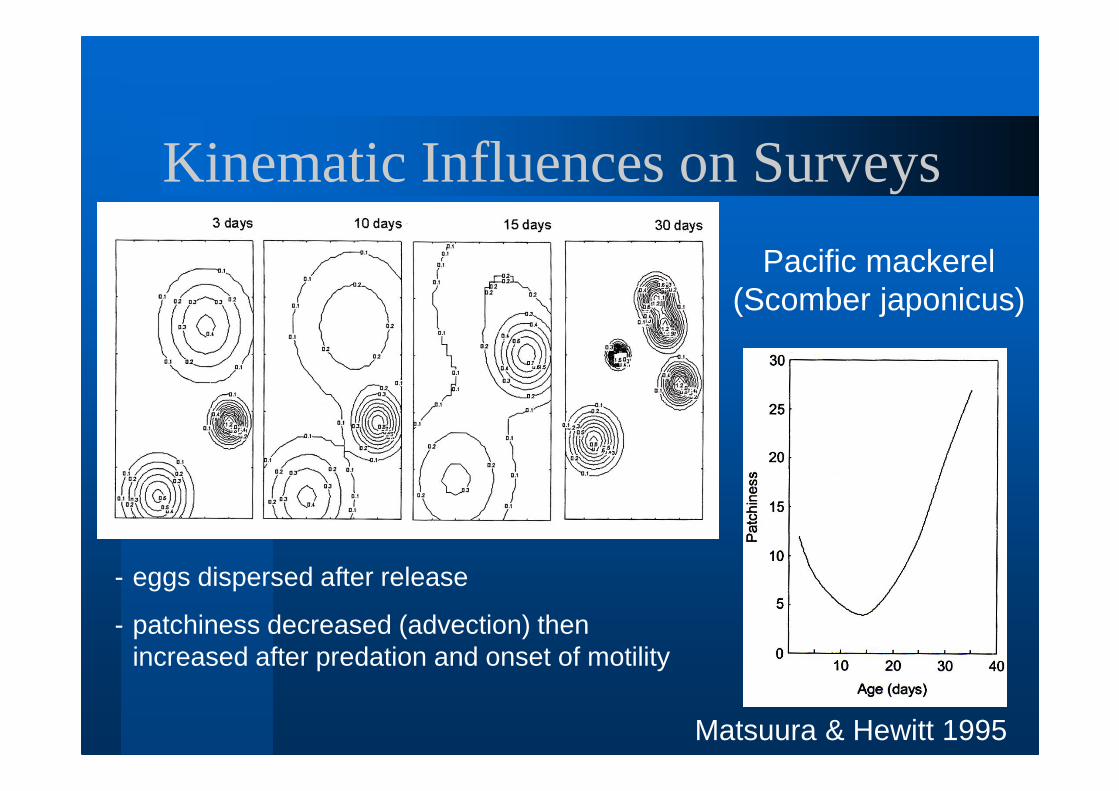
Matsuura & Hewitt 1995
- eggs dispersed after release
- patchiness decreased (advection) then increased after predation and onset of motility
Pacific mackerel (Scomber japonicus)