2 introduction - wiley-vch · troubleshooting hplc systems: a bench manual wiley-interscience, new...
TRANSCRIPT

Part III gives some hints on what can be done to avoid errors.Again this synopsis is very heterogeneous in character. This does notdiminish its value, of course.
Incompleteness is an inevitable feature of this book. I am gratefulfor all hints on other pitfalls and sources of error or on how to avoidthem.
Recommended Texts
Veronika R. MeyerPractical High Performance Liquid ChromatographyWiley, Chichester4th edition 2004
John W. Dolan and Lloyd R. SnyderTroubleshooting LC SystemsAster, Chester1989
Paul C. SadekTroubleshooting HPLC Systems: A Bench ManualWiley-Interscience, New York2000
Stavros KromidasPractical Problem Solving in HPLCWiley-VCH, Weinheim2000
Stavros KromidasMore Practical Problem Solving in HPLCWiley-VCH, Weinheim2004
Lloyd R. Snyder, Joseph J. Kirkland and Joseph L. GlajchPractical HPLC Method DevelopmentWiley-Interscience, New York2nd edition 1997
Norman DysonChromatographic Integration MethodsRoyal Society of Chemistry, London2nd edition 1998
2 Introduction

Part I
Fundamentals

1.1 Chromatography
In chromatography, a physical separation method, the components of amixture are partitioned between two phases. One of the phases stays inits place and is called the stationary phase, whereas the other moves in adefinite direction and is called the mobile phase.
According to the type of mobile phase we distinguish between gaschromatography, supercritical fluid chromatography, and liquid chro-matography.
The separation is based upon the different partition coefficients ofthe sample components between the two phases. It is helpful to dividethe chromatographic column into small hypothetical units, the so-called theoretical plates. Within each plate a new partition equilibriumis established. The narrower a theoretical plate, the more equilibriumprocesses can take place within a column of given length and the moredemanding the separation problems which can be solved.
The figure shows the separation of two compounds. One of theseprefers the mobile phase but also enters the stationary phase. For theother compound the preference is the other way round. Thanks to thislarge difference in their properties the two types of molecule can easilybe separated. They are transported through the column by the flow ofthe mobile phase and thereby reach zones where new equilibria areformed again and again.
In the drawing, such a theoretical plate has a height of approxi-mately 3 1/2 stationary phase particle diameters. This height dependson the packing quality of the column, on the mass transfer properties ofthe phases, and on the sample compounds involved. Plate height is afunction of the particle diameter of the stationary phase. For good col-umns, plate heights are equal to ca. 3 particle diameters irrespective ofthe particle size. A fine packing, e.g. with a 5-lmphase, gives four timesas many theoretical plates as does a 20-lm packing if identical columnlengths are compared. The column with the fine packing can thereforebe used for more difficult separation problems.
4 Fundamentals

Chromatography 5

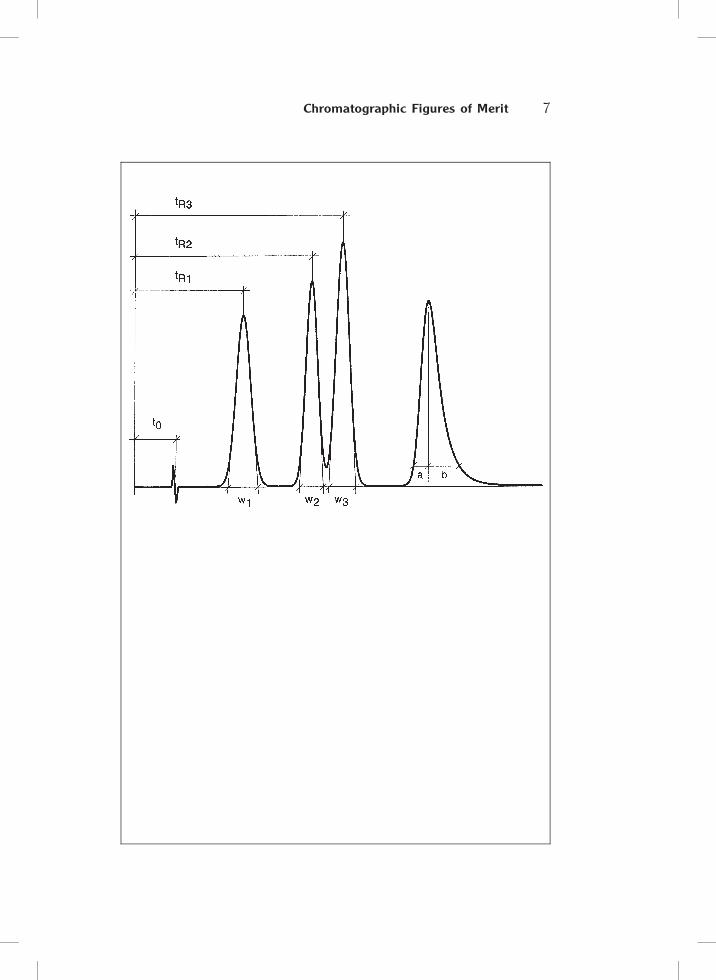
1.2 Chromatographic Figures of Merit
To judge a chromatogram it is necessary to calculate some data which can be
easily obtained. The integrator or data system yields the retention times, tR,
and peak widths, w; perhaps it is advisable to determine the peak width at
half height, w1=2. In addition the breakthrough time or ’dead time’, t0, must
be known although it can be a problem to measure it unambiguously. In
principle, the first baseline deviation after injection marks t0. Then the fol-
lowing data can be calculated:
1. Retention factor, k (formerly capacity factor, k0):
k ¼ tR � t0
t0
The retention factor is a measure of the retention of a peak. It depends
only on the phase system (the types of mobile and stationary phase) and on
the temperature.
2. Separation factor, a:
a ¼ k2
k1
Two compounds can be separated only if a is higher than 1.0 in the
selected phase system. For HPLC separations a should be 1.05 or higher
(! 1.3).
3. Theroetical plate number, N :
N ¼ 16� tR
w
�2
¼ 5:54� tR
w1=2
�2
¼ 2�� hPtR
AP
�2
where hP = peak height and AP = peak area. The plate number is a
measure of the separation performance of a column. (The equations given
here are in principle only valid for symmetrical peaks.)
From the plate number it is possible to calculate the height, H, of a
theoretical plate (e.g., in lm):
H ¼ Lc
N
where Lc = column length.
4. Tailing T (for asymmetric peaks):
T ¼ b
a
where a and b are determined at 10% of peak height.
6 Fundamentals
Chromatographic Figures of Merit 7

1.3 The Resolution of Two Peaks
The resolution of two adjacent peaks is defined as
R ¼ 2tR2 � tR1
w1 þ w2
¼ 1:18tR2 � tR1
w1=21 þ w1=22
At a resolution of 1.0 the baseline between the peaks is notreached! Complete resolution is only obtained at R = 1.5 or higher, de-pending on the height ratio of the peaks. The smaller a peak comparedwith its large neighbor the greater is the resolution necessary to sepa-rate them.
The resolution depends on the separation factor a, the theoreticalplate number N, and the retention factor k:
R ¼ 1
4ða� 1Þ
ffiffiffiffiN
p k
1þ k
This equation can be expressed in different forms, which are notof interest here. It is important to realize that the resolution is influ-enced by the three parameters. The separation factor has the largesteffect. If a separation needs to be improved it is well worth the effortof increasing a, although it is impossible to give a general proposal con-cerning how to do this. If the plate number is increased, the effect isonly by the factor
ffiffiffiffiN
p; if the column length is, e.g., doubled, and by this
also the plate number (at least in principle), the resolution will improveonly by
ffiffiffi2
p¼ 1:4: Increasing the retention factor only has a notable
influence on resolution if k was small to start with.The upper figure presents several pairs of peaks separated with
varying resolution. The graph below demonstrates how the resolutionincreases with increasing plate number for three different separationfactors.
8 Fundamentals

The Resolution of Two Peaks 9

1.4 Reduced Parameters
The judgement and comparison of HPLC columns is best done withreduced, dimensionless parameters. A test chromatogram is acquiredwhich enables the theoretical plate number, N, of the column to bedetermined from a suitable peak with low tailing. It is also necessaryto measure the breakthrough time, t0, with a refraction index peak orwith an otherwise suitable compound (for reversed-phase separations,e.g., with thiourea). The pressure drop, Dp, under the given conditionsis noted.
Then the following reduced parameters can be calculated:
1. Reduced plate height, h:
h ¼ H
dp¼ Lc
N � dph is a measure of the height of a theoretical plate as a multiple of
the particle diameter, dp. Lc is column length.
2. Reduced flow velocity, n:
n ¼ u � dpDm
¼ Lc � dpt0 � Dm
n is a measure of the flow velocity in relation to the particle dia-meter, dp, and the diffusion coefficient, Dm. In most cases Dm is notreally known but it can be assumed to be 1 � 10�9 m2 s�1 for small mo-lecules in water / acetonitrile and to 4 � 10�9 m2 s�1 for small moleculesin hexane.
3. Reduced flow resistance, f:
f ¼Dp � d2pLc � Z � u
¼Dp � d2p � t0
L2c � ZWith f the pressure drop can be described simply and clearly. It
is, however, necessary to know the viscosity, Z, of the mobile phase.Mixtures of water and organic solvents pass through a maximum ofviscosity!
Favorable numbers: h = 3n = 3f = 500 up to a maximum of 1000
10 Fundamentals

Reduced Parameters 11

1.5 The Van Deemter Curve
The separation performance of a column is not independent of the mo-bile phase flow rate. An optimum velocity, uopt, is observed where theperformance is highest. This relationship is described by the van Deem-ter curve which describes the height of a theoretical plate, H, as a func-tion of the linear flow velocity, u. At uopt the plate height, Hmin, is smal-lest, which means that the number of theoretical plates, N ¼ L=H, islargest. The peaks are narrowest and thus eluted with the largest pos-sible height; the resolution reaches a maximum. Any deviation from thevan Deemter optimum yields smaller peak heights and resolutions; yetthe optimum velocity is not identical for all compounds of a samplemixture.
It would be best to work at uopt. Practical separations are oftenperformed at higher speed, which gives shorter analysis times andusually only a moderate loss of separation performance. This is, how-ever, only true if mass transfer is fast, which is often not the case withspecial stationary phases and ion exchangers. Of course it is never ad-visable to work under conditions left of the van Deemter optimum. Inthis region the separation performance is very poor and the analysistime is long.
If the van Deemter curve is plotted with reduced parameters n andh the optimum is often at n = 3.
Chromatographic conditions:
Sample: 5 lL of a solution of thiourea, veratrole, acetophenoneand nitrobenzene
Column: 4.6mm � 7.5 cmStationary phase: Zorbax SB C-18, 3.5 lm (reversed phase C18)Mobile phase: water / ethanol 3 : 7Volume flow rate: 0.1 to 1.9 mL min�1 corresponding to u from
0.16 to 3.2 mm s�1
Detector: UV 268 nmOptimum: for nitrobenzene (curve) u � 1.3mm s�1
(0.8mL min�1), H � 8.5 lm;for veratrole and acetophenone u � 0.65 mm s�1
(0.4 mL min�1)
Reference: V.R. Meyer
12 Fundamentals

The Van Deemter Curve 13

1.6 Peak Capacity and Number of Possible Peaks
For the separation of complex mixtures it is necessary to have space foras many peaks as possible with adequate resolution throughout thechromatogram. This number is the larger the higher the number of the-oretical plates of the column and the longer one is willing to wait for thelast peak. In other words, N and k determine the so-called peak capa-city, n, of the column in use. Usually R = 1.0 is taken as the necessaryresolution between two adjacent peaks (! 1.3).
If the plate number were constant over the whole range of k valuesthe peak capacity would be defined as:
n ¼ 1þffiffiffiffiN
p
4lnð1þ kmaxÞ
At constant peak width, w, as could be the case with a very steepsolvent gradient, the peak capacity would be much higher:
n ¼ tRmax � t0
w
In practice neither plate numbers nor peak widths are constant.Nincreases with time because no chromatographic system has an idealbehavior; and even with gradient elution the peak widths increase gra-dually. Therefore the Number of Possible Peaks, NPP, is a more realisticvalue than the peak capacity, n:
NPP ¼ DtRwn � w1
lnwn
w1
with the retention time interval DtR covering peaks 1 to n (includingtheir widths) and peak widths w.
The figure presents a first peak at 2 min, or 120 s, of width 6.2 s(N = 6000) and a last at 3.33 min, or 200 s, of width 8.4 s (N = 9000).Thus the retention time interval runs from (120-3.1) s to (200+4.2) s ora span of 87.3 s. With these data NPP = 12 as shown in the computersimulation with peaks of resolution 1.0.
14 Fundamentals