2. informal support systems - world...
TRANSCRIPT

2. INFORMAL SUPPORT SYSTEMS
This chapter focuses on living arrangements of old people and intergenerational transfers with which they are involved, and briefly discusses formal care of the elderly. It uses evidence from Sri Lanka and other countries to assess how these arrangements may change with population aging, and the implications for policy. The structure of the chapter is as follows. The first section analyzes the living arrangements of old people, examining the levels and determinants of co-residence, and the preferences of Sri Lankan elderly concerning living arrangements. The second section examines the types of intergenerational transfers in kind support that occur within Sri Lankan families, including caring for the elderly requiring assisted living. The role of old people in the family, investigating the respect and authority enjoyed by old people is reviewed in the third section. Future expectations of support are discussed in the fourth section, while fifth section discusses formal support arrangements. The chapter concludes by summarizing policy implications.
A. LIVING ARRANGEMENTS
1.1 The majority of Sri Lankan elderly live with their children—only 6 percent live alone. As shown in Table A2.1, about 77 percent of elderly live with their children in either of two arrangements: with their spouse and children (40 percent) or only with their children (37 percent). Those elderly who do not co-reside with their children live either with their spouse (10 percent), alone (6 percent) or in other arrangements (4 percent). The share of Sri Lankan elderly co-resident with at least one child is higher than in the Philippines (70 percent), Thailand (71 percent) and Taiwan (69 percent), but is lower than for Singapore (85 percent – see Table A2.2).
Living without children 1.2 Elderly who live with their ‘spouse only’ comprise younger, well educated and the better off among the elderly population (Table A2.1). This profile is similar to that of the elderly who live with their spouse and their children and suggests that more educated (and therefore wealthier) elderly may prefer to live alone. Together with the evidence on living with children (see below), these results are suggestive of a life cycle effect for co-residence. When relative younger, elderly live with their spouse or spouse and child. As they age, lose their spouse (generally male, given longer life expectancy for women), and can no longer support themselves, they transition to co-residence with their children.1 It is important to note, however, that decisions to co-reside may also reflect the preferences of children. In Indonesia, Beard and Kunharibowo (2001) find that the needs of younger generation rather than preferences of older persons drive decisions to co-reside.
1 This inference on time trends is from cross-section data and needs therefore to be interpreted with care.

Living with children 1.3 Elderly who live only with their children comprise the more aged, widows, and those with less education (Figure 2.1). These elderly comprise a high share of those who never worked, widows, and those with somewhat worse health status (Table A2.1). In contrast, old individuals who live with their children and spouse comprise younger, healthier, more educated, and still working elderly (children in these households may still not have left home). Multivariate regressions confirm that these characteristics significantly increase the probability of living in either arrangement respectively (Table A2.3).
Figure 2.1: Living arrangement of old people by age, gender, and education (a) By age
0
10
20
30
40
50
60
70
living alone spouse only spouse &children
children spouse &others
other livingarrangement
60-69
70-79
80+
(b) By gender
0
10
20
30
40
50
60
70
living alone spouse only spouse &children
children spouse &others
other livingarrangement
male
female
(c) By education
0
10
20
30
40
50
60
living alone spouse only spouse &children
children spouse &others
other livingarrangement
no education
one to tw elve years
tw elve years above
Source: World Bank 2006 Sri Lanka Aging Survey (2007)
1.4 Similarly, elderly who live completely alone comprise a large share of older widowed women, with little education. Seventy five percent of elderly living alone are women, about two thirds are 70+, and a similar proportion is widowed (Table A2.4). Most have between 1-12+ years of education. Given advanced ages, and limited labor force participation among women, most are retired or those who have never worked and most report their income as inadequate. These elderly rate their health as fair/poor (vs. excellent, very good), with about two-thirds reporting mobility problems, or the presence of at least one chronic illness. 1.5 Among those living alone, women appear to more vulnerable than men. A much higher share of women living alone in Sri Lanka is widowed, has less education (and income) and reports worse health status than men (Table A2.4). This evidence is consistent with the characteristics of older women found in other Asian countries. Older women have worse health indicators than men. About half of all females aged 80 and above in Taiwan had difficulties performing at least one activity of daily living (ADL) and one instrumental activity of daily living (IADL) compared to 33 percent of elderly men (Bartlett and Wu, 2000). Older women (current cohort) are less educated), and consequently have lower income. For example, in Malaysia, 67 percent of older females have no formal education, compared to only 31 percent of older males (Tan and Ng, 2000). Older women are also less likely to be working or to have worked. In Indonesia, only 42 percent of older women (above 60) were working as compared to 65 percent of older men (Hugo, 2000. Households headed by widows in India are extremely poor, with income per capita 70 percent below the national average (Dreze, 1990). Worldwide, widows are more vulnerable than men are to income insecurity owing to their younger age at marriage, longer life expectancy, growing probability of divorce, lower rates of remarriage, labor force participation, inheritance, and ability to borrow (World Bank, 1994). Trends in living arrangements 1.6 Living arrangements in Sri Lanka are not likely to have changed much from the past. As shown in Figure 2.2, the living arrangements of a random sample of Sinhalese (aged 65 and older) in the Kandy Municipal Council area in 1992 shows remarkable similarity to the living arrangements shown in the data for 2005. While this result come from a particular region and tracks changes only over a decade, it indicates that these living arrangements are likely to have persisted over time.
Figure 2.2: Living arrangement of elderly, 1992 and current
05
1015202530354045
living alone spouse only spouse &children
children other livingarrangements
1992
current
Source: World Bank 2006 Sri Lanka Aging Survey, and Siddhisena (2004). Note: Data for 2006 are from 2006 Sri Lanka Aging survey (n=2336), data for 1992 are from a random sample of old people Sinhalese (>=65) in the Kandy Municipal Council area (n=149)
1.7 There has also been little change in living arrangements in some East Asian countries, but remarkable declines in co-residence in others (also in the US). Consistent with findings for Sri Lanka,

the percent of old people living with children in the Philippines, Thailand, and Taiwan has not changed much over time (Chan, 1998). For example in Thailand, between 1986 and 1995, there was only a 5 percentage point decrease in the share of children co-residency among the elderly (Table A2.2). However, in higher income Asian countries, such as Japan and South Korea, co-residence rates have declined sharply. In Japan, the percentage of people aged 65 and over co-residing with any child fell from 77 percent to 52 percent between 1970 and 1977 (Hermalin 1995; Knodel and Ofstedal 2002). In South Korea the percentage of older adults co-residing with a child fell from 78 percent in 1984 to 54 percent in 1994 (Kim 1999). Multiple generation households were also common in the United States at the turn of the century (Costa 1998), but as shown in Figure 2.3, co-residence rates have fallen throughout the century.2 Rising incomes and increased affordability of separate housing rather than changing social preferences for co-residence explain observed changes in US. The affordability of housing is also important for explaining the degree of co-residence in Asian countries. For example, the higher cost of housing can promote co-residence, as in the case of Malaysia and Singapore (DaVanzo and Chan, 1994; Chan, 1997).
Figure 2.3: Percentage of 65+ year old US males living with family, 1880-1990
20.7
72.3
0
10
20
30
40
50
60
70
80
1880 1900 1910 1920 1940 1950 1960 1970 1980 1990
Cor
esid
ence
rate
, %
Source: Costa (1998); Borsch-Supan et. al. (1992).
1.8 On the opposite side, the proportion of elderly living alone tends to be higher in richer countries, with four East Asian countries being outliers. Figure 2.4 shows that there is positive association between income per capita and the share of elderly living alone. Interestingly, three East Asian countries appear to be outliers. Despite relatively high incomes, a small proportion of older people live alone in Malaysia, Korea, Japan and Singapore. Results of cross-country regressions show that even after accounting for income and pension spending as a share of GDP, a dummy variable for Asian countries is significant. The coefficient for the Asia dummy suggests that sole residence rates are approximately 9 percentage points lower in Asian countries. This difference may be due to cultural differences that emphasize filial piety in the oft-mentioned Confucian tradition.3 Another possibility is
2 Schoeni (1998) qualifies these figures however, suggesting that a different measure – life-years spent in co-residence – is superior because it takes into account changes in life expectancy that have occurred throughout the century. Using this measure, the US rates of co-residence decline much less through 1940. Most of the decline takes place between 1940 and 1990. 3 Further support for cultural differences is evident in the historical evidence in pre-industrial England. Laslett (1985) presents data showing relative high rates of living alone among the elderly in the 18th century.

that this pattern reflects the relative immaturity or limited generosity of public pension schemes, (these same cultural factors may also influence these outcomes). Part of the reason for fewer people living alone in Singapore (or high co-residence rates) is probably a result of targeted public policies. Chan (1998) describes tax incentives and housing subsidies provided to children that live with their parents. In Singapore, these incentives are justified based on cultural or moral values encouraged by the government.
Figure 2.4: Percentage of persons over 60 living alone, selected countries
0
5
10
15
20
25
30
35
40
45
50
0 5000 10000 15000 20000 25000
Income per capita, $PPP-adjusted
Perc
enta
ge o
f old
livi
ng a
lone
Singapore
Hungary
JapanKorea
Poland
Malaysia
Source: Palacios, forthcoming.
1.9 Will Sri Lankan elderly continue to co-reside with their children if they are able to afford living separately? The aging survey explores the preferences of elderly with respect to living arrangements. As shown in Figure 2.5, only about half of all Sri Lankan elderly consider living which children to be the best living arrangement. About 45 percent of elderly—comprising a higher share of educated (and presumably wealthier) would prefer to live in alternate arrangements, either with their spouse only (12 percent) or in other situations (33 percent). In contrast, nearly 80 percent of all children believe that their parents should live with them. Though it is difficult to predict future living arrangements, these findings, together with the evidence presented in the previous sections suggest that as income and education increase, co-residence with children may decline in Sri Lanka.
B. INTERGENERATIONAL TRANSFERS (CASH AND IN-KIND)
1.10 Co-residence is only one way in which Sri Lankan children support their parents. Cash and in kind transfers are also used by children to provide support to the elderly. About half of all Sri Lankan elderly receive cash assistance as the primary source of income (Table A2.5). A much larger share (about three quarters) receives food and in kind-transfers, while slightly less than a third report receiving household help from their children. A very small share of elderly also report receiving emotional support.

Figure 2.5: Opinions from old people and adult children on the best living arrangement
for the old people
0102030405060708090
Withspouse
With son Withdaughter
Withchildren
Other
Old peopleAdult children
Source: World Bank 2006 Sri Lanka Aging Survey. Note: Sample of old people included 2413 persons, and of adult children 609 persons.
Cash Transfers 1.11 Sri Lankan elderly receive cash support from a variety of sources, both public and private. According to World Bank 2006 Sri Lanka Aging Survey, the elderly report receiving cash transfers over the past month ranging from about Rs. 2,000 (US$20) to Rs. 9,999 (US$98). Government assistance is also important for the elderly. According to the same source, for a significant share—nearly a third of all elderly—non-pension government assistance is some source of support, while a much smaller share—about a tenth of the elderly —receive pensions as their major source of income. Not all elderly Sri Lanka are dependent on transfers from others. About a fifth of the Sri Lankan elderly rely on agricultural activity as a major income source (World Bank 2006 Sri Lanka Aging Survey). As shown in Table 2.1, the share of Sri Lankan elderly receiving money from children (about 50 percent), is much lower compared in Singapore (85 percent), Philippines (94 percent) and Thailand (87 percent).
Table 2.1: Sources of support in five Asian countries Source of support Singaporea Philippinesb Thailandc Taiwand Sri Lankae
Co-reside with at least one child
85 70.4 70.9 69.0 76.8 (n=2286)
From any child Food, clothing 84.5 63.3 89.2 12.2 77.8 Money 84.6 94.1 87.0 - 48.9 Emotional support - 18.8 - - 12.9 From non-co-resident children: Daily contact 8.8 14.1 80.6 26.2 4.39 Weekly 54.7 6.6 88.8 83.8 13.3 Sources: Chan (1999) a 1995 National Survey of Senior Citizens, Singapore b 1996 Philippine Old people Survey c 1995 Survey of the Welfare of the Old people in Thailand d 1996 Survey of Health and Living Status of the Old people in Taiwan e 2005/2006 Sri Lanka Aging Survey (among old people with at least one child, N=2286)

1.12 Old people receiving pension income are less likely to receive other transfers from their family members. The receipt of pension income decreases the probability of receiving monetary support from family members in the last 12 months (Table A2.6). Old people who receive a pension are only 40 percent as likely to receive a money transfer compared to old people who do not receive a pension. This finding is consistent with international experience. In countries with mature pension systems (e.g., UK, US, Germany), pensions are the major source of income for the elderly, and the elderly receive virtually no support from their children (Table 2.2). This suggests that formal social security may displace informal support for some Sri Lankan elderly. For poor families, however, this substitution would release resources for other needs, for example, for the care of children.
Table 2.2: International comparison of major sources of income of old people Philippines Thailand Taiwan Singapore United
States United Kingdom
Germany
Work 30.0 37.9 20.4 17.6 20 13 2
Pension, retirement, CPF
9.1 2.3 29.2 2.2 94 100 98
Income from investments
1.9 4.4 5.9 1.8 -- -- --
Family business 4.6 -- 1.6 -- -- -- --
Agriculture 23.3 -- 4.0 -- -- -- --
Children or other relatives
31.1 55.4 36.5 76.6 -- -- --
Other -- -- 2.4 1.8 -- -- --
Source: Hermalin (2002).
1.13 Women are more likely than men to receive monetary transfers from their children. Evidence from Sri Lanka and other countries reveals that children are more likely to provide income to their mothers than to their fathers. The top line in Figure 2.6 is an average of the percentage of older women in four Asian countries that report that their children are their main source of income. There is evidence of similar patterns Singapore.4 This result may be due to the combination of altruism and greater need for income support among older women with lower pensions and few assets. Since women outlive men, the very old are more likely to be women. Typically, there are about 50 percent more females aged 75 and over than males in the population. The fact that support increases with age is not surprising since productivity declines and need increases during the aging process. 1.14 Transfers appear to be targeted to the neediest and those with more children. A higher share of retired elderly or those not working receives transfers from their children (Table A2.6). Children also provide transfers to those in poor health. The disabled are more likely to receive transfers than those who are not disabled. Elderly with four or more children, residing with their children are more likely to receive transfers. While not conclusive, these results suggest that the family sends transfers to the neediest elderly family members. As shown by World Bank (2007), families with more children are 4 Chan (1998) reports that 48 percent of men and 79 percent of women over age 55 report that children are their main source of income. Very old women were most likely to depend on children.

poorer in Sri Lanka. This may explain why they receive more transfers (aside from social security motive). Figure 2.6: Percentage of elderly reporting children as main source of income by age, unweighted average for
China (urban), Indonesia, Thailand and Sri Lanka
0
10
20
30
40
50
60
70
60-64 65-69 70-74 75-79 80-84
Age
Repo
rting
chi
ldre
n as
main
sour
ce o
f inc
ome %
Average (males)
Average (females)
Source: Palacios (forthcoming).
In-Kind Support 1.15 The main in kind support provided to the elderly in Sri Lanka is food, clothing or other material goods from family members, followed by household help (Table A2.5). The share of elderly reporting receipt of food/material goods in Sri Lanka (about 80 percent) is roughly the same as in Thailand and Singapore, but considerably higher than in Philippines and Taiwan. Once again, the more children an individual has, the more he or she is likely to receive material food or material goods from children. About eighty percent of old people with 4+ children receive food/material goods compared to about 60 percent of elderly with one child. In kind support is also higher for those with physical disabilities. Household help is the second most important type of in kind support for the elderly. Here again those in poor health report a higher incidence of support from their children. Thirty-six percent of old people who report at least one ADL or IADL limitation receive housework help compared to less than thirty percent of old people without mobility problems. Thus, as in the case of cash transfers, there is some evidence that in-kind help is received by more vulnerable elderly.
1.16 Emotional support is the least common assistance provided to the elderly. As shown in Table 2.1, only 13 percent of Sri Lankans report emotional support as the main support received from family members, somewhat lower than in the Philippines (19 percent). Contact with non-resident children, another indicator of emotional support, is also relatively low in Sri Lanka. Only 4 percent of older Sri Lankans report daily contact with a non-co-resident child. A slightly higher percentage, 13 percent, report weekly contact with their children. In comparison, the elderly in Singapore Philippines, Thailand and Taiwan have much higher levels of daily contact with their children. However, the Sri Lankan data does not control for the proximity of children. Children may not live very close to their parents in Sri Lanka relative to other countries.

Caring for the Elderly 1.17 Some of old people in Sri Lanka need help performing daily activities, either basic activities of daily living (ADL) such as eating, dressing, toileting, and bathing, or instrumental activities of daily living (IADL) such as cooking, shopping, housework and traveling. 1.18 Children, spouses or sons/daughters in law assist those elderly that require support with basic activities of daily living (ADL). On average, one fifth of old people is receiving such support – 13 percent among the aged 60-69 and 46 percent of those older than 60 (Table 2.3). Those aged from 60-69 years have access to their spouses, children, and sons/daughters in-law for ADL support. However, as elderly outlive their spouses (at ages 80 above) the burden shifts to primarily children and daughters/sons in-laws. Grandchildren also provide physical care for old people with disabilities, particularly in the case of elderly women. Those old people without children receive support from spouses (5 percent), siblings (6 percent) and other relatives (7 percent).
Table 2.3: Percent of old people receiving ADL support, by type of provider and age of older parent Percent By age of older parent By gender of older parent
ADL support indicators 60-69 70-79 80+ Male Female
Receive any ADL support
Yes 20.2 13.4 21.1 45.7 17.4 22.4
No 79.8 86.6 78.9 54.3 82.6 77.6
Providers of ADL support
Children 13.0 8.0 14.5 29.1 11.0 14.7
Spouse 4.2 4.8 3.8 2.5 8.1 0.9
Son/daughter-in-law 5.2 2.2 5.3 17.5 2.3 7.5
Grandchildren 2.3 0.9 1.8 10.7 1.4 3.2
Siblings 0.6 0.7 0.8 0.0 0.5 0.8
Other relatives 0.6 0.4 0.7 0.8 0.4 0.7
Source: World Bank 2006 Sri Lanka Aging Survey. Note: Data are weighted to account for more than 1 old people selected by household and stratified sampling by age. 1.19 Old people also receive help from their families to navigate through their external environment – IADL support, which also increases as they age. Almost half of all elderly (44 percent) received help for going to the doctor, marketing, shopping, visiting friends, or using public transportation (Table 2.4). Older women are more likely (54 percent) to report receiving IADL support compared to men (32 percent)—perhaps, again, because they are older on average. As with ADL support, children are the main providers of support. Only 35 percent of older parents aged 60-69 receive IADL support as compared to 67 percent of older parents aged 80+ years.

1.20 Primary caregivers of the elderly are women ‘sandwiched’ between caring for their spouse and children and the elderly. Primary caregivers (vs. non-primary care providers) are typically middle-aged (35-54), female, currently married, employed or homemakers, and have 1-12 years of education (Table A2.7). Family care-givers of elderly in other countries also tend to be women with childcare responsibilities. For example, in Taiwan, 72 percent of primary care-givers are females, 85 percent are married, and over 90 percent live with the older disabled person (Bartlett and Wu, 2000). Perhaps not surprisingly, female primary care givers report more worries and stress in daily life (53%) relative to male caregivers (37%), with family worries being the primary source of stress for women caregivers (vs. financial worries for male caregivers).5 Providing support for the elderly potentially increases the opportunity costs of forgone labor force participation for these care-givers.
Table 2.4: Percent of old persons receiving IADL support by gender of the older adult IADL support indicators
Percent By age of older parent By gender of older parent
60-69 70-79 80+ Male Female Receive any IADL support
Yes 44.1 34.8 49.1 66.7 31.8 54.3 No 55.9 65.2 50.9 33.3 68.2 45.7
Providers of IADL support
Children 31.6 22.4 37.9 49.8 21.3 40.2 Spouse 6.2 8.9 4.0 1.9 8.9 3.9 Son/daughter-in-law 6.6 3.6 8.1 14.4 3.0 9.6 Grandchildren 3.5 2.1 4.0 7.5 1.5 5.1 Siblings 0.5 0.7 0.3 0.0 0.5 0.5 Other relatives 1.0 1.2 0.9 0.8 0.5 1.5
Source: World Bank 2006 Sri Lanka Aging Survey.
Support from the Elderly 1.21 The support from children to elderly is not one way. About half of the elderly—46 percent—provide childcare for their grandchildren, consistent with evidence from the Philippines (38 percent), Thailand (32 percent) and Taiwan (23 percent) (Biddlecom, Chayovan and Ofstedal, 2002). Almost all old people interviewed, 99 percent, said that they enjoyed providing childcare, and 80 percent believe it is their duty to take care of their grandchildren. Old people also provide help in kind such as housework or cooking help (18 percent) or provide food/clothes (8 percent) to family members. A smaller percentage of old people, 7 percent, provided money to their family members in the last twelve months (Table 2.5). However, after age 79, probably because of ill health, very few parents provide any kind of transfer to their children.
5 A higher share of male caregivers report stress (10%) relative to male non –care givers (6%).

Table 2.5: Percent of old people providing transfers to adult children within previous 12 months,
by age Type of transfer Percent providing 60-69 70-79 80+ Money 6.7 6.7 5.5 5.2 Housework help 17.8 18.9 18.5 11.0 Food or material goods 8.1 11.5 5.9 0.9 Child care 45.9 46.1 50.5 29.3 Source: World Bank 2006 Sri Lanka Aging Survey. Note: Sample is old people with at least one child by birth. 1.22 Monetary transfers provided by the elderly to their children are lower in Sri Lanka than in other Asian countries. In the Philippines and Thailand, the percentage of elderly providing monetary transfers to their children is much higher. Nearly 67 percent and 55 percent of elderly provide cash transfers to their children (Biddlecom, Chayovan and Ofstedal, 2002). The share of elderly providing transfers to their children in Taiwan is more similar to Sri Lanka, where only 10 percent, of old people, provide monetary transfers to their children.
C. RESPECT AND AUTHORITY WITHIN HOUSEHOLD AND SOCIETY
1.23 Aside from cash and in-kind transfers, the respect with which families and societies treat the elderly, and the ability of the elderly to influence allocation decisions (within the family) or public policy (in society), is also an important indicator of elderly welfare.
1.24 Old people determine their own basic needs, but they are not involved in major financial decisions. The involvement of elderly in household decisions is one measure of the respect accorded to them within the family. The World Bank 2006 Sri Lanka Aging Survey finds that about two thirds of older adults discuss important matters in their families. This corroborates Siddhisena’s (2005) observation that old people in Sri Lanka are consulted when important family events take place. Similarly, a large percentage of old people have a say in domestic decisions relating to expenditure on their own clothes and food eaten at home (Table 2.6). However, the participation in more important decisions like large expensive purchases for the household and monthly savings is limited. The decision-making power with respect to these matters seemed to rest with the children (predominantly male child).
Table 2.6: Level of participation in family decision making process
Expenditures Elder Spouse Son/ daughter/ daughter-in-law/ grand child
Not applicable
Food eaten at home 37.5 21.5 39.0 0.9 Your clothes 41.9 10.8 44.8 1.6 Expensive purchases for the household (i.e., refrigerator or TV) 15.3 6.5 45.9 29.2 Money for monthly savings 19.4 6.0 28.8 42.2
Source: World Bank 2006 Sri Lanka Aging Survey.
1.25 However, elderly heads of households with access to income or assets influence household decisions (Sivamurthy, 2001). Being the head of a household allows individuals to influence intra-household allocation decisions. A large share of elderly in Sri Lanka report that they (59 percent) or their spouse (15 percent) are the head of household. The likelihood of headship is significantly higher if the
elderly individual is presently working, receives a pension, or owns a house (see Table A2.8). Thus, the access to outside income is important for the elderly to influence household decisions.
1.26 In focus group interviews, the elderly report a declining respect for their age group in broader society. The elderly noted that globalization (access to computers, TV) has changed for the worst the way children behave towards them. The previous mode of behavior—respects for teachers and parents—has changed. Today, children show little respect towards authority figures, such as the elderly (Box 2.1). Some elderly reported that increasing alcoholism in society has also changed for worse the way in which families behave with each other and towards the elderly.
1.27 The elderly also do not appear to be very influential in society. The extent of participation of older persons in a community is one measure of social integration of elderly. In Sri Lanka, only half of all elderly belong to an organizations and groups including political parties, village development societies, and senior citizen’s clubs. However, the social groups with the highest participation of elderly are the death donation society (27 percent), Samurdhi (14 percent) and religious organizations (11 percent). The elderly have very limited participation in more influential groups like the village development society, agricultural society and political parties. Thus, while the elderly participate in some social organizations, they do not participate in those that drive the political or social agenda.
1.28 Nevertheless, elderly Sri Lankans are generally satisfied with the respect accorded them among families and friends. Sri Lankan elderly feel that they are important to their families (92 percent) and friends (80 percent). When asked about their satisfaction with their family life, 80 percent report being extremely happy, very happy or somewhat happy. This situation does not always prevail in East Asian societies. In Hong Kong, Republic of Korea, and Singapore, suicide rates among older persons aged 75+ are four to eight times higher than among those aged 15-24. In fact, Hong Kong has one of the highest suicide rates among older persons in the world (Phillips, 2000; Ruzicka, 1998).
Box 2.1: Voices of old people suggest a decline in their respect and authority The general feeling among old people is that old people as a group are losing positions within their families. In line with classic modernization theory, old persons lose their authority and decision-making power in modernizing households. Exposure to western values is often cited as a primary reason for this change. Focus groups reveal the following sentiments. “In the old days, there was a head of family in each family. All others members are under him and his decision is final in all matters. Today that structure has vanished and the young do not see any reason to seek advice from old persons. The younger generation spends more time on TV and they model themselves according to what they see. They generally watch programs which do not set good examples (FGD_Group 1, educated males, urban).” “There are quite a lot of difference between our young days and today. When I see my teachers, even now, if it is in a bus I get up even without my knowing. But today’s youngsters do not care much about respect. They are more knowledgeable because of computer and other things. When we go on the road, there may be young boys and girls talking to each other blocking the way. But they will not move and give room for us to pass. We have to go around them. If we ask them to move they make jest of us (FGS_Group 2, educated females, urban).” “I have the same feeling. When getting old, young generation declines to accept us. Care or respect to the older people is weak among some youngsters. Even our children behave with us in this way.” (Kandy, rural, educated males)

D. EXPECTATIONS OF FUTURE SUPPORT
1.29 The overwhelming majority of elderly (95 percent) in Sri Lanka consider that children are responsible for taking care of parents during old age (Table 2.7). Very few (5 percent) of old people view themselves as primarily responsible for care in old age. Within this group there are some variations by demographic characteristics. Older males are more likely to view themselves as primarily responsible for their welfare in old age (4 percent) compared to females (2 percent). Old people with twelve or more years of education (and presumably more income) consider themselves responsible for their own welfare in old age, supporting earlier results that better educated (and presumably wealthier) elderly will likely prefer not to co-reside with their children in the future. 1.30 The elderly are very confident (albeit not fully) of obtaining support from their families for their main needs in the future. The main worries of the elderly relate, in order of importance, to financial matters, inter-family relationships and health. However, virtually all elderly believe they would receive some type of cash or in kind support in case they fell ill, while a slightly lower share of elderly is confident of financial support in case of need (87 percent). Finally, a fairly large share of elderly believes that someone would be available to talk to them about any problem they may confront. In most of these cases, the elderly report that they would rely on their child, spouse, and then son and daughter in law (in that order) for support.
Table 2.7: Attitudes of old people and adult children on who should be primarily responsible for taking care
of parents during old age Independent Children Others (Total number in
sample)
Report of adult children
Total (n=609) 0.1 99.9 0.0 609
Report of old person
Total (n=2413) 2.6 95.6 1.9 2413
Gender
Males 3.7 94.6 1.7 1063
Females 1.6 96.4 2.0 1350
Educational level
No education 1.9 94.9 3.3 352
1-12 years 2.2 96.3 1.5 1914
12+years 8.7 88.3 3.0 147
Source: World Bank 2006 Sri Lanka Aging Survey.
1.31 The expectation that children will provide financial support in old age is also the case in other Asian countries. Evidence from Indonesia, Republic of Korea, Philippines, Taiwan, and Thailand, suggests that a very high share of old people expect that their children will take care of them in old age (Table 2.8). Between 85-89 percent of older adults, expect financial help from their children in old age in
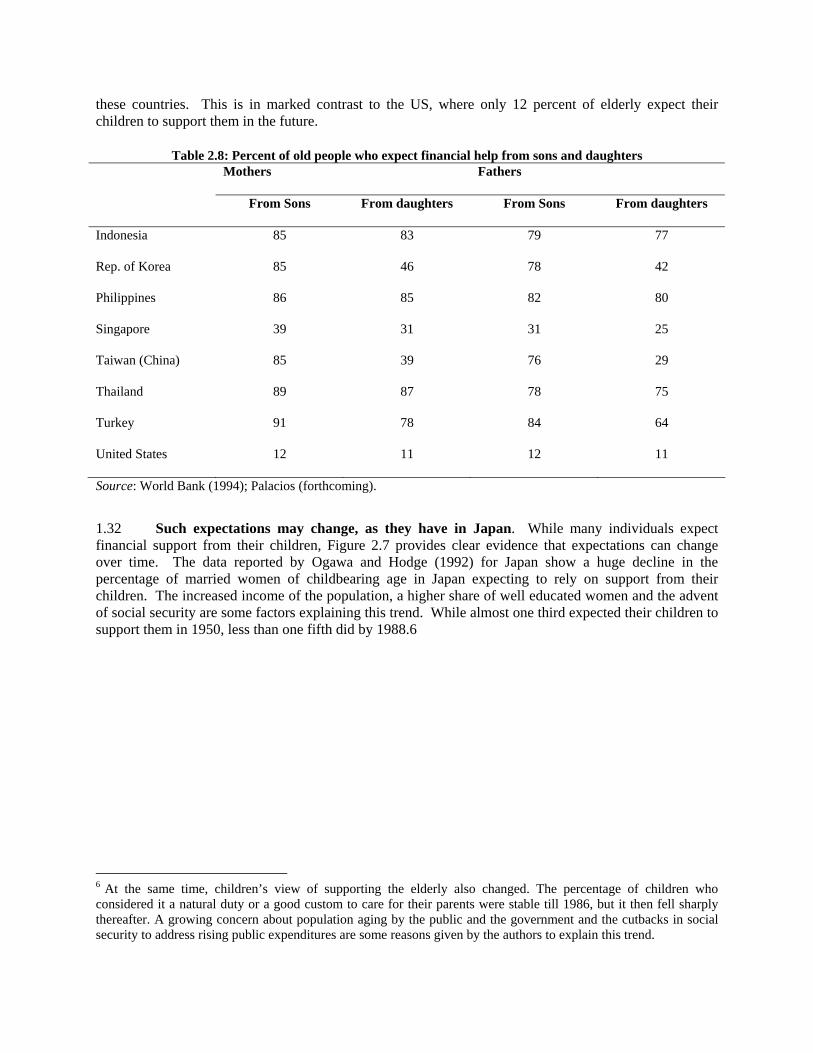
these countries. This is in marked contrast to the US, where only 12 percent of elderly expect their children to support them in the future.
Table 2.8: Percent of old people who expect financial help from sons and daughters Mothers Fathers
From Sons From daughters From Sons From daughters
Indonesia 85 83 79 77
Rep. of Korea 85 46 78 42
Philippines 86 85 82 80
Singapore 39 31 31 25
Taiwan (China) 85 39 76 29
Thailand 89 87 78 75
Turkey 91 78 84 64
United States 12 11 12 11
Source: World Bank (1994); Palacios (forthcoming).
1.32 Such expectations may change, as they have in Japan. While many individuals expect financial support from their children, Figure 2.7 provides clear evidence that expectations can change over time. The data reported by Ogawa and Hodge (1992) for Japan show a huge decline in the percentage of married women of childbearing age in Japan expecting to rely on support from their children. The increased income of the population, a higher share of well educated women and the advent of social security are some factors explaining this trend. While almost one third expected their children to support them in 1950, less than one fifth did by 1988.6
6 At the same time, children’s view of supporting the elderly also changed. The percentage of children who considered it a natural duty or a good custom to care for their parents were stable till 1986, but it then fell sharply thereafter. A growing concern about population aging by the public and the government and the cutbacks in social security to address rising public expenditures are some reasons given by the authors to explain this trend.
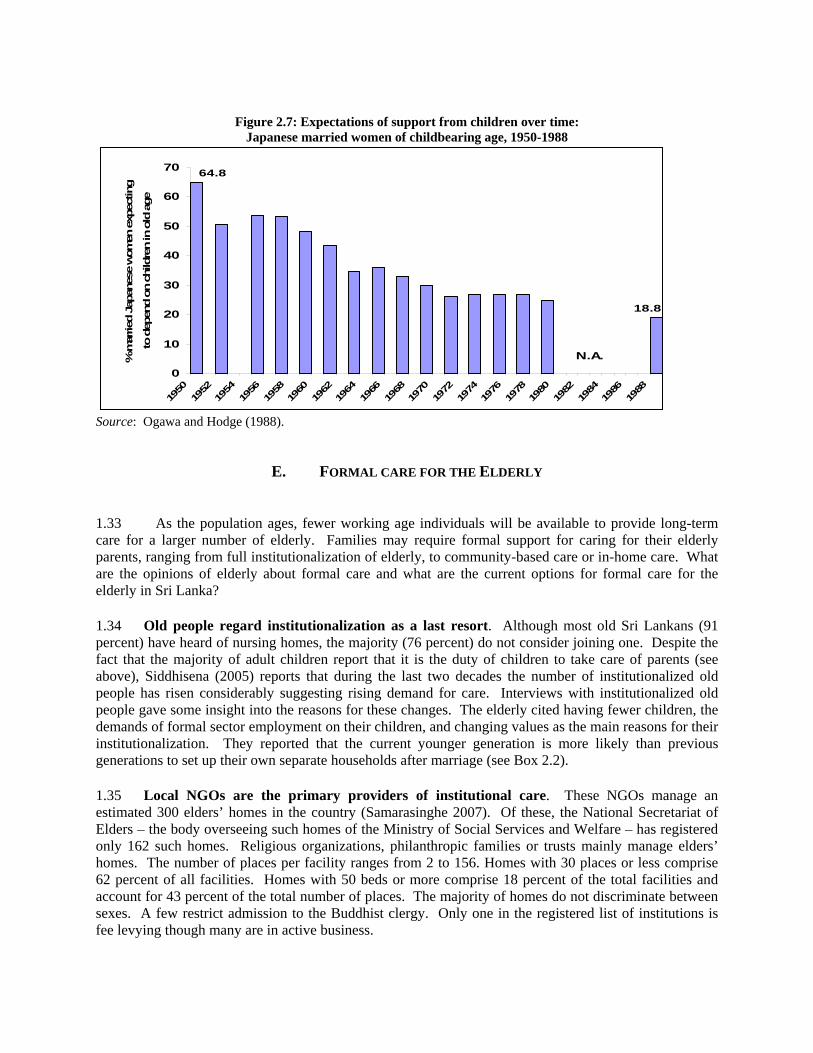
Figure 2.7: Expectations of support from children over time:
Japanese married women of childbearing age, 1950-1988
18.8
64.8
0
10
20
30
40
50
60
70
1950
1952
1954
1956
1958
1960
1962
1964
1966
1968
1970
1972
1974
1976
1978
1980
1982
1984
1986
1988
% m
arrie
d Ja
pane
se w
omen
exp
ectin
g
to d
epen
d on
chi
ldre
n in
old
age
N.A.
Source: Ogawa and Hodge (1988).
E. FORMAL CARE FOR THE ELDERLY
1.33 As the population ages, fewer working age individuals will be available to provide long-term care for a larger number of elderly. Families may require formal support for caring for their elderly parents, ranging from full institutionalization of elderly, to community-based care or in-home care. What are the opinions of elderly about formal care and what are the current options for formal care for the elderly in Sri Lanka? 1.34 Old people regard institutionalization as a last resort. Although most old Sri Lankans (91 percent) have heard of nursing homes, the majority (76 percent) do not consider joining one. Despite the fact that the majority of adult children report that it is the duty of children to take care of parents (see above), Siddhisena (2005) reports that during the last two decades the number of institutionalized old people has risen considerably suggesting rising demand for care. Interviews with institutionalized old people gave some insight into the reasons for these changes. The elderly cited having fewer children, the demands of formal sector employment on their children, and changing values as the main reasons for their institutionalization. They reported that the current younger generation is more likely than previous generations to set up their own separate households after marriage (see Box 2.2). 1.35 Local NGOs are the primary providers of institutional care. These NGOs manage an estimated 300 elders’ homes in the country (Samarasinghe 2007). Of these, the National Secretariat of Elders – the body overseeing such homes of the Ministry of Social Services and Welfare – has registered only 162 such homes. Religious organizations, philanthropic families or trusts mainly manage elders’ homes. The number of places per facility ranges from 2 to 156. Homes with 30 places or less comprise 62 percent of all facilities. Homes with 50 beds or more comprise 18 percent of the total facilities and account for 43 percent of the total number of places. The majority of homes do not discriminate between sexes. A few restrict admission to the Buddhist clergy. Only one in the registered list of institutions is fee levying though many are in active business.
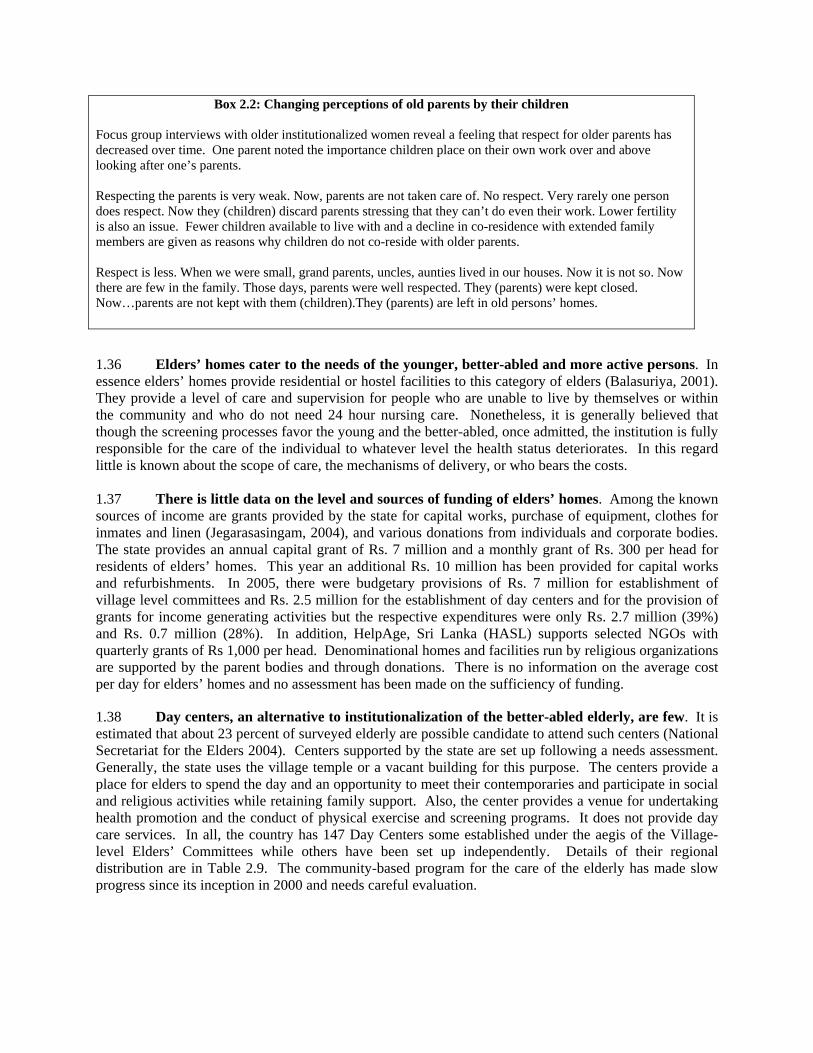
Box 2.2: Changing perceptions of old parents by their children Focus group interviews with older institutionalized women reveal a feeling that respect for older parents has decreased over time. One parent noted the importance children place on their own work over and above looking after one’s parents. Respecting the parents is very weak. Now, parents are not taken care of. No respect. Very rarely one person does respect. Now they (children) discard parents stressing that they can’t do even their work. Lower fertility is also an issue. Fewer children available to live with and a decline in co-residence with extended family members are given as reasons why children do not co-reside with older parents. Respect is less. When we were small, grand parents, uncles, aunties lived in our houses. Now it is not so. Now there are few in the family. Those days, parents were well respected. They (parents) were kept closed. Now…parents are not kept with them (children).They (parents) are left in old persons’ homes. 1.36 Elders’ homes cater to the needs of the younger, better-abled and more active persons. In essence elders’ homes provide residential or hostel facilities to this category of elders (Balasuriya, 2001). They provide a level of care and supervision for people who are unable to live by themselves or within the community and who do not need 24 hour nursing care. Nonetheless, it is generally believed that though the screening processes favor the young and the better-abled, once admitted, the institution is fully responsible for the care of the individual to whatever level the health status deteriorates. In this regard little is known about the scope of care, the mechanisms of delivery, or who bears the costs. 1.37 There is little data on the level and sources of funding of elders’ homes. Among the known sources of income are grants provided by the state for capital works, purchase of equipment, clothes for inmates and linen (Jegarasasingam, 2004), and various donations from individuals and corporate bodies. The state provides an annual capital grant of Rs. 7 million and a monthly grant of Rs. 300 per head for residents of elders’ homes. This year an additional Rs. 10 million has been provided for capital works and refurbishments. In 2005, there were budgetary provisions of Rs. 7 million for establishment of village level committees and Rs. 2.5 million for the establishment of day centers and for the provision of grants for income generating activities but the respective expenditures were only Rs. 2.7 million (39%) and Rs. 0.7 million (28%). In addition, HelpAge, Sri Lanka (HASL) supports selected NGOs with quarterly grants of Rs 1,000 per head. Denominational homes and facilities run by religious organizations are supported by the parent bodies and through donations. There is no information on the average cost per day for elders’ homes and no assessment has been made on the sufficiency of funding.
1.38 Day centers, an alternative to institutionalization of the better-abled elderly, are few. It is estimated that about 23 percent of surveyed elderly are possible candidate to attend such centers (National Secretariat for the Elders 2004). Centers supported by the state are set up following a needs assessment. Generally, the state uses the village temple or a vacant building for this purpose. The centers provide a place for elders to spend the day and an opportunity to meet their contemporaries and participate in social and religious activities while retaining family support. Also, the center provides a venue for undertaking health promotion and the conduct of physical exercise and screening programs. It does not provide day care services. In all, the country has 147 Day Centers some established under the aegis of the Village-level Elders’ Committees while others have been set up independently. Details of their regional distribution are in Table 2.9. The community-based program for the care of the elderly has made slow progress since its inception in 2000 and needs careful evaluation.

Table 2.9: Distribution of day centers for elderly, by province Province Number
of day centers Western 31 Southern 21 Central 27 North-Western 12 North-Central 32 North-Eastern 05 Sabaragamuwa 15 Uva 04 Total 147
Source: Samarasinghe (2007). 1.39 Attempts to introduce trained volunteers has met with little success in spite of the prospective trainees being selected by the Village-level Elders Committees from members of their community and receiving a stipend of Rs.1,000 per month from HASL. The certificate they receive is their passport to the labor market. There are no formal arrangements for professional support from either the Department of Health or the Department of Social Welfare. Nor are their programs for developing the skills of care givers. 1.40 According to available data there are no institutions providing specialized, long-term 24 hour or intermediate care that are specially geared to support those with problems of mobility and difficulties in performing ADL. In a way, a small number of institutions, which are generally a more expensive form of long-term care, make it easier to develop more cost-effective, long-term care options for the elderly. However, for now, the responsibility of providing care to this category of elderly seems to still lie with the household.
F. POLICY RECOMMENDATIONS
1.41 This chapter documents that most Sri Lankans live with their children in old age, but that the family support system is showing some signs of being strained. Parents support their children when the latter are young while children take care of their parents when they grow old. Parents also continue to support their children in old age, mainly through child care, but also material support. Most children and elderly are satisfied with these arrangements and expect them to continue. Despite this optimistic assessment, traditional family support systems are already strained. Primary-care givers, mainly women, are facing increasing stress in caring for the elderly, while also working and taking care of their own families. For some families institutionalization is already an option and this type of care has reportedly increased. 1.42 These strains will likely increase as the population ages and the number of elderly per working member increases. An aging population tends to have higher health care requirements because of higher demand for ambulatory, inpatient and chronic care, including care for mental illnesses, in later years. As people live longer and have less ability to carry out daily activities in later life, the demand for long-term care will increase. Unless measures are taken, this could impose a high opportunity cost in terms of forgone income for younger care givers, and raise the cost of health care. While future trends are difficult to predict with full certainly, future

increases in income and education in the working age population may also reduce the preference for co-residence among Sri Lankan elderly. Sri Lanka could start to put in place cost effective long term care systems to provide greater support to the elderly and their children. In this respect, Sri Lanka can consider the following options for strengthening support to the family and community. The issue related to the impact of aging on public health system is taken up in chapter 4. 1.43 Strengthening of incentives for families to continue to provide support to the elderly. Without some kind of support, smaller and overburdened (generally female) care giving population may opt for more expensive longer term support, e.g., institutional care. Societies such as Sri Lanka may wish to encourage co-residence, but without distorting incentives for families to live together or provide financial support. Incentives to care givers are provided in many countries. For example, Singapore and Malaysia provide tax and housing subsidies to encourage co-residence or quasi co-residence (living in close proximity to parents). These policies have indeed proved effective in supporting family support by rewarding caregivers. In Japan, tax incentives are also provided although co-residence has continued to decline. in Nordic countries, informal care givers receive pension credits. The exact model for Sri Lanka would have to be developed carefully taking into account the country context. 1.44 Improving provision of social welfare and care services to provide cost effective community-based care of elderly. Supporting elderly to live their lives with their children and families in the communities would help reduce the burden on children, particularly working women. Sri Lanka should invest in developing models and approaches for providing community and home-based support services for the sick and frail elderly. These services which include psychosocial support, rehabilitation service for disabled, IADL and ADL support, and nursing, if provided within the community, would allow the country could reduce the demand for expensive institutional care, and enable the elderly to continue to live and participate in the community. However, there is currently no consensus on affordable models of care, including the mode of financing as well as delivery (e.g., though public private partnerships). Alternate models of services need to be piloted and evaluated, building on the experience of recent projects, and scaled up once successful. 1.45 The government should also explore ways to increase capacity of nursing homes for old people. Although institutionalization is regarded as a last resort by old people, and is the option of last resort given that experience from around the world suggests it is the most expensive care option, the demand for such facilities will rise for a small proportion of the population that is severely disabled, or requires chronic care that is not be possible to provide through family- or community-based care. Options for cost-effective ways to provide institutionalized care will need to be considered, including modes of financing and delivery. 1.46 Elderly living alone (mainly widowed women) warrant specific policy attention. Elderly women require targeted support from social welfare and care services—including psychosocial support, health needs, and assistance for ADL/IADL limitations needs. Elderly women not covered by the pension system may require cash transfer support through the safety net or through social pensions, an issue taken up in the next chapter. 1.47 Reducing the burden on the family and providing for a healthy and productive aging in Sri Lanka also involves actions in three other areas, which will be covered in the following chapters:
• Providing fiscally sustainable mechanisms to allow formal and informal workers to smooth consumption over the lifetime need consideration. In the absence of formal social security systems, Sri Lankan individuals smooth their consumption through family arrangements. These arrangements mean that many elderly continue to work (as childcare providers or informal sector workers – see labor chapter) until their health fails them. A financially viable formal social security system that allows the elderly to smooth their consumption over their lifetime could help them enjoy more leisure and better health in old age. We discuss the feasibility of this option in Chapter 3.
• Improving the health of the elderly will also be critical to enable elderly to live more
productive lives and reduce the burden of care on families, a topic taken up in the Chapter 4. Promoting a healthier elderly population will be the most effective way to ensure better health and lower expenditures of long term care. Measures such as life style changes especially promotion of regular exercise and control of diet and weight are important. Equally important is ensuring the public health system is sufficiently ready to take on the challenge of the health needs of an aging population.
• Similarly, creating conducive labor market conditions would provide more workers
access to formal sector employment and thus also reduce reliance on informal support, because such access would no only ensure expanded social security coverage but also increase productivity of old workers, the point further discussed in Chapter 5.
ANNEX 2.1: TABLES
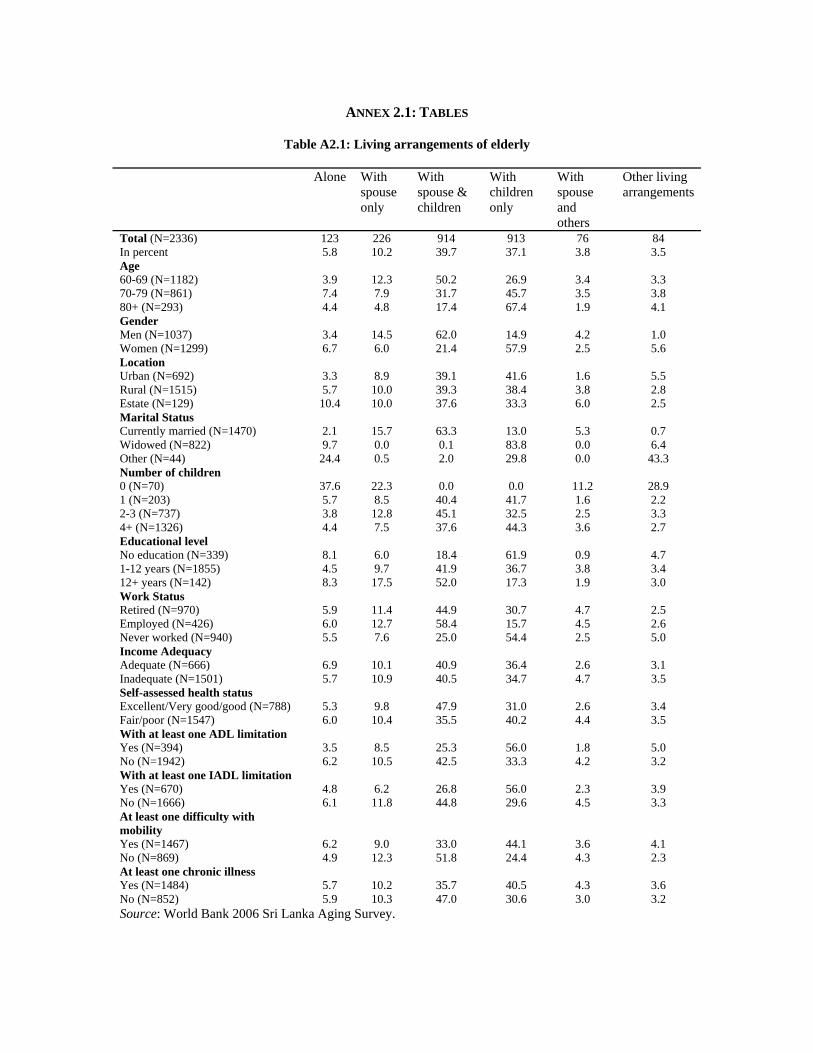
Table A2.1: Living arrangements of elderly
Alone With spouse only
With spouse & children
With children only
With spouse and others
Other living arrangements
Total (N=2336) 123 226 914 913 76 84 In percent 5.8 10.2 39.7 37.1 3.8 3.5 Age 60-69 (N=1182) 3.9 12.3 50.2 26.9 3.4 3.3 70-79 (N=861) 7.4 7.9 31.7 45.7 3.5 3.8 80+ (N=293) 4.4 4.8 17.4 67.4 1.9 4.1 Gender Men (N=1037) 3.4 14.5 62.0 14.9 4.2 1.0 Women (N=1299) 6.7 6.0 21.4 57.9 2.5 5.6 Location Urban (N=692) 3.3 8.9 39.1 41.6 1.6 5.5 Rural (N=1515) 5.7 10.0 39.3 38.4 3.8 2.8 Estate (N=129) 10.4 10.0 37.6 33.3 6.0 2.5 Marital Status Currently married (N=1470) 2.1 15.7 63.3 13.0 5.3 0.7 Widowed (N=822) 9.7 0.0 0.1 83.8 0.0 6.4 Other (N=44) 24.4 0.5 2.0 29.8 0.0 43.3 Number of children 0 (N=70) 37.6 22.3 0.0 0.0 11.2 28.9 1 (N=203) 5.7 8.5 40.4 41.7 1.6 2.2 2-3 (N=737) 3.8 12.8 45.1 32.5 2.5 3.3 4+ (N=1326) 4.4 7.5 37.6 44.3 3.6 2.7 Educational level No education (N=339) 8.1 6.0 18.4 61.9 0.9 4.7 1-12 years (N=1855) 4.5 9.7 41.9 36.7 3.8 3.4 12+ years (N=142) 8.3 17.5 52.0 17.3 1.9 3.0 Work Status Retired (N=970) 5.9 11.4 44.9 30.7 4.7 2.5 Employed (N=426) 6.0 12.7 58.4 15.7 4.5 2.6 Never worked (N=940) 5.5 7.6 25.0 54.4 2.5 5.0 Income Adequacy Adequate (N=666) 6.9 10.1 40.9 36.4 2.6 3.1 Inadequate (N=1501) 5.7 10.9 40.5 34.7 4.7 3.5 Self-assessed health status Excellent/Very good/good (N=788) 5.3 9.8 47.9 31.0 2.6 3.4 Fair/poor (N=1547) 6.0 10.4 35.5 40.2 4.4 3.5 With at least one ADL limitation Yes (N=394) 3.5 8.5 25.3 56.0 1.8 5.0 No (N=1942) 6.2 10.5 42.5 33.3 4.2 3.2 With at least one IADL limitation Yes (N=670) 4.8 6.2 26.8 56.0 2.3 3.9 No (N=1666) 6.1 11.8 44.8 29.6 4.5 3.3 At least one difficulty with mobility
Yes (N=1467) 6.2 9.0 33.0 44.1 3.6 4.1 No (N=869) 4.9 12.3 51.8 24.4 4.3 2.3 At least one chronic illness Yes (N=1484) 5.7 10.2 35.7 40.5 4.3 3.6 No (N=852) 5.9 10.3 47.0 30.6 3.0 3.2 Source: World Bank 2006 Sri Lanka Aging Survey.
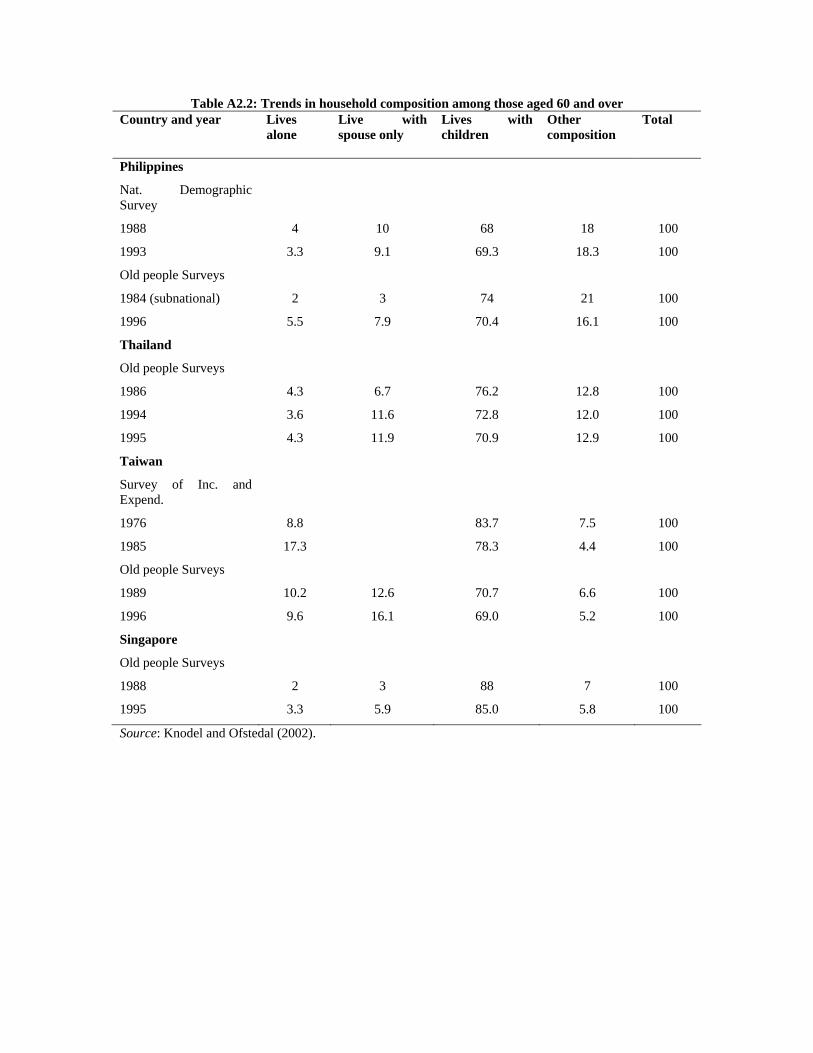
Table A2.2: Trends in household composition among those aged 60 and over Country and year Lives
alone Live with spouse only
Lives with children
Other composition
Total
Philippines
Nat. Demographic Survey
1988 4 10 68 18 100
1993 3.3 9.1 69.3 18.3 100
Old people Surveys
1984 (subnational) 2 3 74 21 100
1996 5.5 7.9 70.4 16.1 100
Thailand
Old people Surveys
1986 4.3 6.7 76.2 12.8 100
1994 3.6 11.6 72.8 12.0 100
1995 4.3 11.9 70.9 12.9 100
Taiwan
Survey of Inc. and Expend.
1976 8.8 83.7 7.5 100
1985 17.3 78.3 4.4 100
Old people Surveys
1989 10.2 12.6 70.7 6.6 100
1996 9.6 16.1 69.0 5.2 100
Singapore
Old people Surveys
1988 2 3 88 7 100
1995 3.3 5.9 85.0 5.8 100
Source: Knodel and Ofstedal (2002).
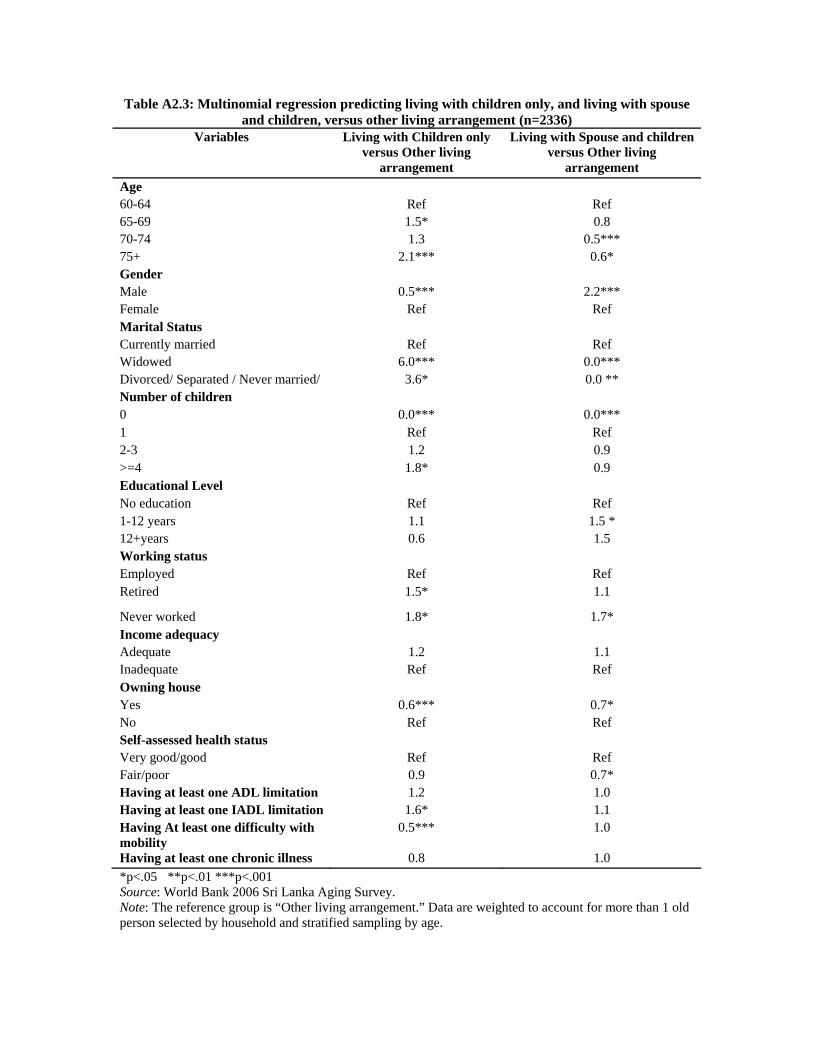
Table A2.3: Multinomial regression predicting living with children only, and living with spouse and children, versus other living arrangement (n=2336)
Variables Living with Children only versus Other living
arrangement
Living with Spouse and children versus Other living
arrangement Age 60-64 Ref Ref 65-69 1.5* 0.8 70-74 1.3 0.5*** 75+ 2.1*** 0.6* Gender Male 0.5*** 2.2*** Female Ref Ref Marital Status Currently married Ref Ref Widowed 6.0*** 0.0*** Divorced/ Separated / Never married/ 3.6* 0.0 ** Number of children 0 0.0*** 0.0*** 1 Ref Ref 2-3 1.2 0.9 >=4 1.8* 0.9 Educational Level No education Ref Ref 1-12 years 1.1 1.5 * 12+years 0.6 1.5 Working status Employed Ref Ref Retired 1.5* 1.1
Never worked 1.8* 1.7* Income adequacy Adequate 1.2 1.1 Inadequate Ref Ref Owning house Yes 0.6*** 0.7* No Ref Ref Self-assessed health status Very good/good Ref Ref Fair/poor 0.9 0.7* Having at least one ADL limitation 1.2 1.0 Having at least one IADL limitation 1.6* 1.1 Having At least one difficulty with mobility
0.5*** 1.0
Having at least one chronic illness 0.8 1.0 *p<.05 **p<.01 ***p<.001 Source: World Bank 2006 Sri Lanka Aging Survey. Note: The reference group is “Other living arrangement.” Data are weighted to account for more than 1 old person selected by household and stratified sampling by age.
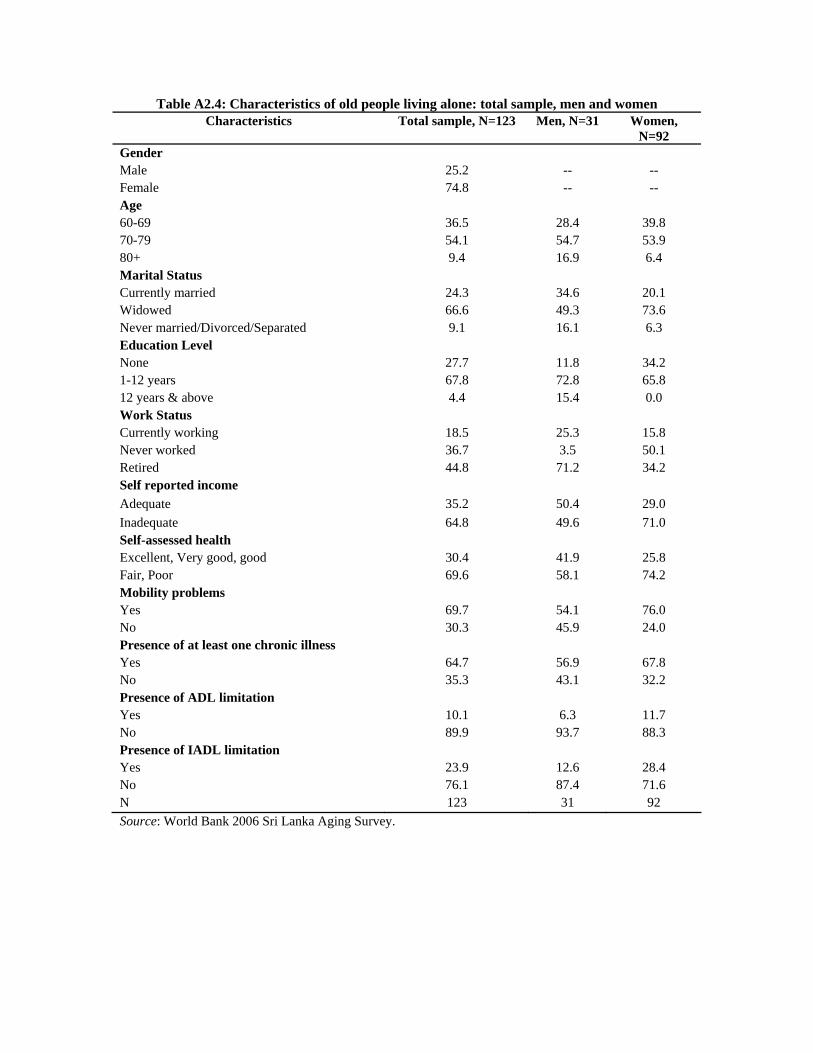
Table A2.4: Characteristics of old people living alone: total sample, men and women Characteristics Total sample, N=123 Men, N=31 Women,
N=92 Gender Male 25.2 -- -- Female 74.8 -- -- Age 60-69 36.5 28.4 39.8 70-79 54.1 54.7 53.9 80+ 9.4 16.9 6.4 Marital Status Currently married 24.3 34.6 20.1 Widowed 66.6 49.3 73.6 Never married/Divorced/Separated 9.1 16.1 6.3 Education Level None 27.7 11.8 34.2 1-12 years 67.8 72.8 65.8 12 years & above 4.4 15.4 0.0 Work Status Currently working 18.5 25.3 15.8 Never worked 36.7 3.5 50.1 Retired 44.8 71.2 34.2 Self reported income Adequate 35.2 50.4 29.0 Inadequate 64.8 49.6 71.0 Self-assessed health Excellent, Very good, good 30.4 41.9 25.8 Fair, Poor 69.6 58.1 74.2 Mobility problems Yes 69.7 54.1 76.0 No 30.3 45.9 24.0 Presence of at least one chronic illness Yes 64.7 56.9 67.8 No 35.3 43.1 32.2 Presence of ADL limitation Yes 10.1 6.3 11.7 No 89.9 93.7 88.3 Presence of IADL limitation Yes 23.9 12.6 28.4 No 76.1 87.4 71.6 N 123 31 92 Source: World Bank 2006 Sri Lanka Aging Survey.

Table A2.5: Percent of old people receiving transfers from adult children Characteristics of older
parent Monetary transfers
Housework help
Food/material goods
Emotional support
Total receiving 48.9 30.6 77.8 12.9 Age 60-69 48.3 30.7 73.2 10.6 70-79 50.1 30.7 82.1 15.3 80+ 47.3 30.0 83.4 14.4 Gender Male 46.1 25.0 76.7 9.3 Female 51.2 35.3 78.8 15.8 Marital Status Currently married 48.1 27.3 76.8 11.8 Widowed 50.8 36.8 79.7 14.8 Div/sep/ Never Married 21.3 16.2 75.1 13.2 Number of children 1 31.6 33.8 58.3 10.2 2-3 44.2 29.2 74.3 12.4 4+ 54.5 31.0 83.1 13.6 Living arrangement Living Alone * 47.9 17.1 78.6 8.0 Living with spouse only 46.8 16.1 71.4 5.7 Living with spouse & children 48.5 29.9 77.0 12.1 Living with children 51.0 39.9 82.6 16.8 Living with spouse and others 48.7 10.3 74.4 7.0 Other living arrangements 39.8 12.4 56.4 13.7 Work status Working 35.9 24.0 69.3 8.3 Retired 49.5 30.1 77.8 12.2 Never worked 54.1 34.3 81.9 15.5 Self-assessed health status Excellent/very good/good 47.2 29.0 76.3 10.9 Fair/poor 49.7 31.4 78.6 13.8 Presence of at least one ADL limitation Yes 45.3 36.4 78.4 16.3 No 49.6 29.4 77.2 12.2 Presence of at least one IADL limitation Yes 50.0 35.5 82.6 17.6 No 48.4 28.6 75.9 10.9 At least one mobility difficulty Yes 52.5 30.9 79.6 15.2 No 42.2 30.2 74.7 8.6 At least one chronic illness Yes 50.8 31.9 79.2 14.8 No 45.2 28.1 75.3 9.1 Urban location Urban 52.6 29.5 77.6 15.1 Rural 48.7 31.6 80.1 13.2 Estate 43.6 19.9 49.5 3.3 Source: World Bank 2006 Sri Lanka Aging Survey. Note: n=2286, sample is old people with at least one child by birth.
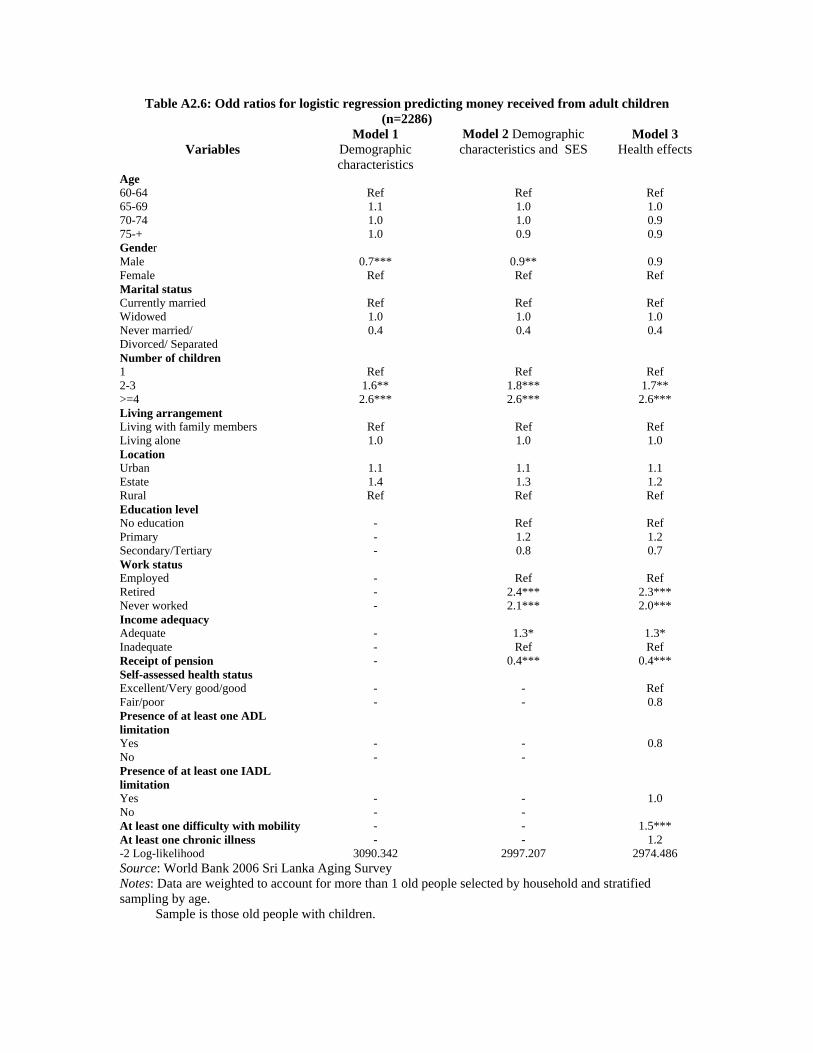
Table A2.6: Odd ratios for logistic regression predicting money received from adult children (n=2286)
Variables
Model 1 Demographic characteristics
Model 2 Demographic characteristics and SES
Model 3 Health effects
Age 60-64 65-69
Ref 1.1
Ref 1.0
Ref 1.0
70-74 75-+
1.0 1.0
1.0 0.9
0.9 0.9
Gender Male 0.7*** 0.9** 0.9 Female Ref Ref Ref Marital status Currently married Ref Ref Ref Widowed 1.0 1.0 1.0 Never married/ Divorced/ Separated
0.4 0.4 0.4
Number of children 1 Ref Ref Ref 2-3 1.6** 1.8*** 1.7** >=4 2.6*** 2.6*** 2.6*** Living arrangement Living with family members Ref Ref Ref Living alone 1.0 1.0 1.0 Location Urban 1.1 1.1 1.1 Estate 1.4 1.3 1.2 Rural Ref Ref Ref Education level No education - Ref Ref Primary - 1.2 1.2 Secondary/Tertiary - 0.8 0.7 Work status Employed - Ref Ref Retired Never worked
- -
2.4*** 2.1***
2.3*** 2.0***
Income adequacy Adequate - 1.3* 1.3* Inadequate - Ref Ref Receipt of pension - 0.4*** 0.4*** Self-assessed health status Excellent/Very good/good - - Ref Fair/poor - - 0.8 Presence of at least one ADL limitation
Yes - - 0.8 No - - Presence of at least one IADL limitation
Yes - - 1.0 No - - At least one difficulty with mobility - - 1.5*** At least one chronic illness - - 1.2 -2 Log-likelihood 3090.342 2997.207 2974.486 Source: World Bank 2006 Sri Lanka Aging Survey Notes: Data are weighted to account for more than 1 old people selected by household and stratified sampling by age. Sample is those old people with children.
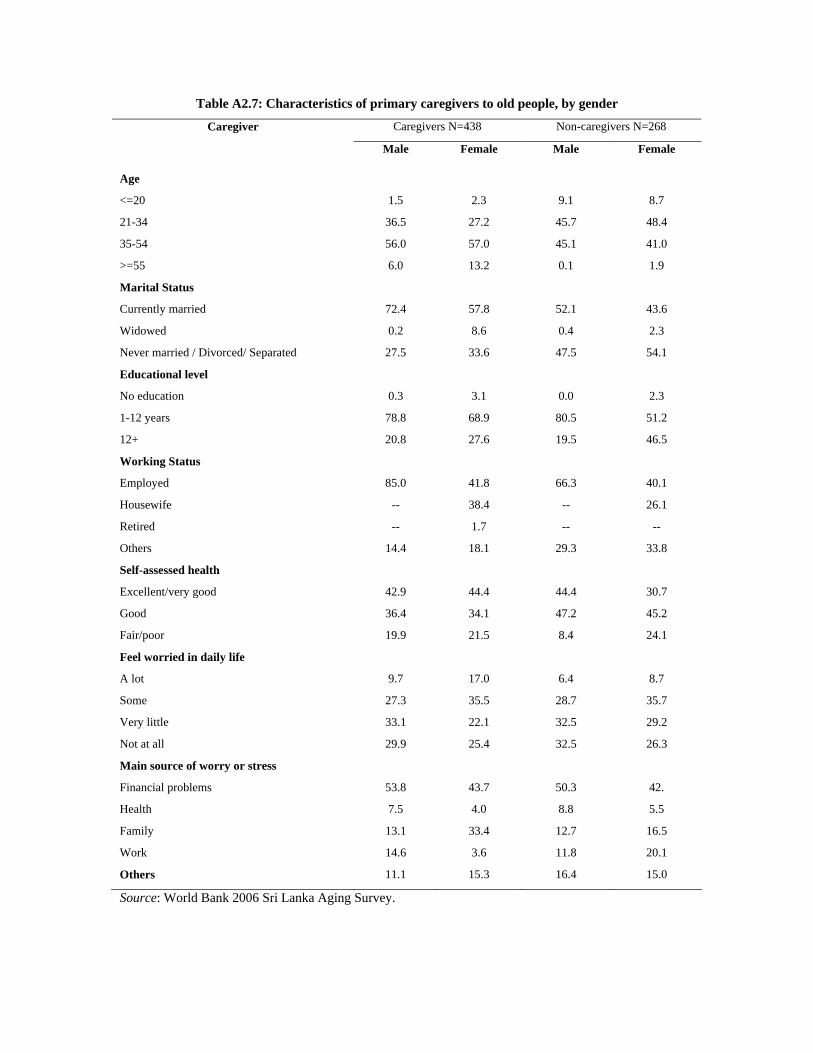
Table A2.7: Characteristics of primary caregivers to old people, by gender
Caregiver Caregivers N=438 Non-caregivers N=268
Male Female Male Female
Age
<=20 1.5 2.3 9.1 8.7
21-34 36.5 27.2 45.7 48.4
35-54 56.0 57.0 45.1 41.0
>=55 6.0 13.2 0.1 1.9
Marital Status
Currently married 72.4 57.8 52.1 43.6
Widowed 0.2 8.6 0.4 2.3
Never married / Divorced/ Separated 27.5 33.6 47.5 54.1
Educational level
No education 0.3 3.1 0.0 2.3
1-12 years 78.8 68.9 80.5 51.2
12+ 20.8 27.6 19.5 46.5
Working Status
Employed 85.0 41.8 66.3 40.1
Housewife -- 38.4 -- 26.1
Retired -- 1.7 -- --
Others 14.4 18.1 29.3 33.8
Self-assessed health
Excellent/very good 42.9 44.4 44.4 30.7
Good 36.4 34.1 47.2 45.2
Fair/poor 19.9 21.5 8.4 24.1
Feel worried in daily life
A lot 9.7 17.0 6.4 8.7
Some 27.3 35.5 28.7 35.7
Very little 33.1 22.1 32.5 29.2
Not at all 29.9 25.4 32.5 26.3
Main source of worry or stress
Financial problems 53.8 43.7 50.3 42.
Health 7.5 4.0 8.8 5.5
Family 13.1 33.4 12.7 16.5
Work 14.6 3.6 11.8 20.1
Others 11.1 15.3 16.4 15.0
Source: World Bank 2006 Sri Lanka Aging Survey.

Table A2.8: Logistic regression estimates of determinants of headship of household
Independent Variable
Coefficient Age 0.93** Sex (male) 1.56* Marital status Widowed Currently married 2.89** Work status Retired Presently working 2.02* Never worked 1.26 Pension 2.75** Income from business or agriculture 1.56 Assistance from children 0.86 Ownership of residential house 6.54** N 1849 -2 log likelihood 1538.26 Source: Own calculations based on World Bank 2006 Sri Lanka Aging Survey. Note: * p<0.05 **p<0.01