2 enhanced anaerobic degradation of palm oil …umpir.ump.edu.my/7240/1/cd6702.pdf · the...
TRANSCRIPT

2
ENHANCED ANAEROBIC DEGRADATION OF PALM OIL MILL
EFFLUENT USING BUTYRATE, CaO-CKD AND DENITRIFYING SULFIDE
REMOVAL
RUMANA GHUFRAN
Thesis submitted in fulfillment of the requirements
For the award of degree of
Doctor of Philosophy
(Civil Engineering)
Faculty of Civil Engineering and Earth Resources
UNIVERSITY MALAYSIA PAHANG
November 2012

vi
ABSTRACT
During this research three experiments were performed. In the first experiment
Palm oil Mill Effluent (POME) with concentrated butyrate was treated in a 4.5 L
upflow anaerobic sludge blanket reactor (UASBR), run over a range of influent
concentrations (16.5-46.0 g-COD L-1
), chemical oxygen demand (COD) loading
rates (1.5-11.5 g CODL-1
d-1
) and 11-4 days hydraulic retention time (HRT) at
37 °C by maintaining pH between 6.5-7.5. The process consistently removed 97-
99% of COD at loading rates up to 1.5-4.8 g COD L-1
d-1
by varying HRT (11-7.2
days). The conversion of acetate to methane appeared to be rate limiting step.
Maximum biogas (20.17 LL-1
d-1
) and methane production (16.2 LL-1
d-1
) were
obtained at COD loading rate of 4.80 gL-1
d-1
and HRT of 7.2 days. The biogas and
methane production were higher in the presence of butyrate compared to control.
The methane content of the biogas was in the range of 70-80% throughout the
study while in control it was 60-65%. Finding of this study clearly indicates the
succesful treatment of POME with butyrate in UASBR. In the second experiment,
calcium oxide-cement kiln dust (CaO-CKD) was used to enhance the granulation
process. The granulation process in POME using CaO-CKD provided an
attractive and cost effective treatment option. In this study the efficiency of CaO-
CKD at doses of 1.5 to 20 gL-1
was tested in batch experiments and found that 10
g of CaO/L caused the greatest degradation of VFA, butyrate and acetate. An
upflow anaerobic sludge blanket (UASB) reactor was operated continuously at
35 ºC for 150 days to investigate the effect of CaO-CKD on sludge granulation
and methanogenesis during start-up. The treatment of POME emphasized the
influence of varying organic loading rates (OLR). Up to 94.9% of COD was
removed when the reactor was fed with the 15.5 to 65.5 g-COD gL-1
at an OLR of
4.5-12.5 Kg-CODm-3
d-1
, suggesting the feasibility of using CaO in an UASB
process to treat POME. The ratio of volatile solids/total solids (VS/TS) and
volatile fatty acids in the anaerobic sludge in the UASB reactor decreased
significantly after long-term operation due to the precipitation of calcium
carbonate in the granules. Granulation and methanogenesis decreased with an
increase in the influent CaO-CKD concentration. In the third experiment, the
inhibitory effects of 134.82-771.9 mgL-1
d-1
of sulfide loading rate (SLR) and
58.79-337.56 mgL-1
d-1
of nitrate loading rate (NLR) on methanogenesis were
investigated in a mixed methanogenic culture using butyrate as carbon source. A
novel strategy was adopted to cultivate mature granules using anaerobic sludge of
palm oil mill effluent (POME) as seed sludge, incubated in DSR medium to
acclimate the denitrifiers. Biological denitrification was used to eliminate carbon,
nitrogen and sulfur in an anaerobic granular bed reactor (AGBR) of 4.5 L by
varying hydraulic retention time from 35.6-6.2 days. The maximum nitrate and
sulfide removal efficiencies were observed up to SLR and NLR of 188.42
mgL-1
d-1
and 82.39 mgL-1
d-1
respectively. Maximum VFA removal of 82% was
obtained on SLR and NLR of 230 mgL-1
d-1
and 100.62 mgL-1
d-1
.

vii
ABSTRAK
Dalam ini tiga eksperimen telah dijalankan. Dalam eksperimen pertama sisa
efluen kelapa sawit berkandungan butyrate telah dirawat di dalam reaktor
berisipadu 4.5 L yang menggunakan reaktor laluan ke atas tanpa oksigen (UASB),
mempunyai julat influen COD (keperluan oksigen kimia) di antara 16.5 ke 46.0
gL-1
, kadar kemasukan COD di antara 1.5-11.5 gCOD L-1
d-1
dan nilai tahanan
hidraulik di antara 11-4 hari pada suhu 37 oC serta pH kawalan di antara 6.5 ke
7.5. Proses rawatan menggunakan UASB mampu mengurangkan 97%-99% COD
pada kadar kemasukan 1.5-4.8 gCOD L-1
d-1
dengan variasi masa tahanan antara
7.2 ke 11.2 hari. Jumlah maksimum gas bio terhasil adalah 20.17 LL-1
d-1
dan gas
metana adalah 16.2 LL-1
d-1
pada kadar kemasukan COD 4.80 g L-1
d-1
dan masa
tahanan (HRT) 7.2 hari. Penghasilan gas bio dan mentana adalah lebih tinggi
dalam kehadiran butyrate berbanding sampel kawalan. Jumlah mentana di dalam
gas bio adalah di antara 70% ke 80% sementara sampel kawalan adalah 60% ke
65%. Hasil kajian ini jelas menunjukkan kejayaan rawatan POME menggunakan
butyrate dalam UASBR. Dalam kajian yang kedua, kalsium oksida-tanur habuk
simen (CaO-CKD) telah digunakan untuk meningkatkan proses granulasi. Proses
granulasi dalam sisa efluen kelapa sawit menggunakan CaO-CKD menunjukkan
rawatan pilihan yang menarik dan lebih murah. Dalam kajian ini keberkesanan
CaO-CKD pada kadar di antara 1.5 gL-1
ke 20 gL-1
telah diuji dalam eksperimen
berasingan dan didapati bahawa 10 g CaO/L mampu menghasilkan degradasi
VFA, butyrate dan acetat. Reactor laluan ke atas tanpa oksigen telah beroperasi
secara berterusan pada suhu 35 oC selama 150 hari dalam usaha untuk mengkaji
kesan CaO-CKD ke atas granulasi kumbahan dan proses metanogenesis. Rawatan
POME ini menumpukan kepada pengaruh variasi OLR(kadar muatan organik)
yang mana didapati 94.9% COD telah dikurangkan semasa reaktor diberi
kemasukan COD di antara 15.5 to 65.5 g-COD gL-1
pada kadaran OLR 4.5-12.5
Kg-CODm-3
d-1
. Ini jelas menunjukkan keberkesanan penggunaan CaO pada
UASB dalam merawat POME. Kadar pepejal mudah ruap kepadah jumlah pepejal
(VS/TS) dan VFA dalam reaktor UASB dedapati menurun secara signifikan pada
operasi jangka panjang. Ini disebabkan oleh pemendapan kalsium karbonat dalam
granul. Proses granulasi dan metanogenesis berkurangan dengan pertambahan
influen yang mempunyai CaO-CKD. Dalam eksperimen ketiga, kesan perencatan
sulfide 134.82-771.9 mgL-1
d-1
(SLR) dan kadar kemasukan nitrat 58.79-337.569
mgL-1
d-1
(NLR) ke atas metanogenesis di kaji di dalam kultur campuran
metanogenik menggunakan butyrate sebagai sumber carbon. Granul yang matang
dikultur menggunakan kumbahan POME tanpa oksigen sebagai benih kumbahan.
Bahan ini di inkubator dalam media DSR bertujuan menyesuaikan bahan bakteria
pengurang nitrat. Pengurangan nitrat secara biologi digunakan untuk
menggurangkan kandungan karbon, nitrogen dan sulfur di dalam reaktor granular
tanpa oksigen (AGBR) melalui variasi masa tahan hidraulik antara 35.6 ke 6.2
hari. Keberkesanan pengurangan nitrat dan sulfida dilihat berlaku kepada SLR
dan NLR sehingga 188.42 mgL-1
d-1
dan 82.39 mgL-1
d-1
.

viii
TABLES OF CONTENTS
Page
STATEMENT OF AWARD OF DEGREE i
SUPERVISOR’S DECLARATION ii
STUDENT’S DECLARATION iii
DEDICATION iv
ACKNOWLEDGEMENTS v
ABSTRACT vi
ABSTRAK vii
TABLE OF CONTENTS viii
LIST OF TABLES xiv
LIST OF PLATES xv
LIST OF FIGURES xvi
LIST OF SYMBOLS/ABBREVIATIONS xix
LIST OF APPENDICES xviii
CHAPTER 1 INTRODUCTION (1-15)
1.1 Introduction 1
1.1.1 Research Background 1
1.1.2 Palm Oil Industry in Malaysia 1
1.1.3 Palm Oil Mill effluent 2
1.2 ENVIRONMENTAL REGULATIONS OF POME
DISCHARGE
4
1.2.1 POME rules in Malaysia 4
1.3 CEMENT KILN DUST 5
1.4 PROBLEM STATEMENT 10
1.5 RESEARCH OBJECTIVES 12
1.5.1 Main Objectives 12

ix
1.5.2 Specific Objectives 12
1.6 SCOPE OF RESEARCH 13
1.7 Thesis Outline 15
CHAPTER 2 LITERATURE REVIEWS (16-63)
2.1 ANAEROBIC PROCESSES 16
2.2.1 Palm oil mill flow description 17
2.2.2 Sterilization of fresh fruit bunches 18
2.2.3 Stripping, digestion and pressing of fruits 18
2.2.4 Clarification 19
2.2.5 Kernel oil recovery 19
2.2.6 Kernel extraction and drying 19
2.2.7 Palm Oil Mill Effluent Characteristics 22
2.3 ANAEROBIC DIGESTION 29
2.3.1 Hydrolysis 27
2.3.2 Acidogenesis 31
2.3.3 Acetogenesis 31
2.3.4 Methanogenesis 32
2.4 DSR Process 33
2.5 Applicability of Anaerobic Treatment 37
2.6 Up-flow Anaerobic Sludge Blanket Reactor 45
2.6.1 Advantage of an UASBR 46
2.6.2 Limitations of an UASB reactor 47
2.6.3 Related past studies on UASB with different kind of
wastewater
47
2.7 Structure of Granule 51
2.8 MECHANISM OF GRANULE AGITATION
INSIDE A UASB REACTOR
53

x
2.9 Factors governing the granulation process 56
2.9.1 Temperature 56
2.9.2 pH and alkalinity 58
2.9.3 Organic loading rate (OLR) 58
2.9.4 Shear due to upflow and gas production 59
2.9.5 Divalent metal ion 60
2.9.6 Extracellular polymers 61
2.10 SUMMARY OF REVIEW
62
CHAPTER 3 MATERIALS AND METHODS (64-99)
3.1 INTRODUCTION 64
3.2 SAMPLE COLLECTION 64
3.2.1 POME Sample Collection 64
3.3 CKD Sample Collection 66
3.4 Flow Chart 66
3.5 REACTOR SETUP 68
3.5.1 UASBR construction 68
3.5.2 AGBR construction 66
3.6 POME Analysis 73
3.6.1 SEED SLUDGE FORMATION 73
3.6.1.1 Seed Sludge Formation for POME (Butyrate) 73
3.6.1.2 Specific Methanogenic Activity Test 74
3.6.1.3 CKD Analysis 75
3.6.1.4 Slacking and calcium oxide 76
3.6.1.5 Batch Experiments 77
3.6.1.6 Seed Sludge Formation for DSR process and Carbon
Methanogenesis
78

xi
3.7 KEY FACTORS CALCULATIONS APPLICABLE
DURING EXPERIMENT
79
3.7.1 The F/M Ratio 79
3.7.2 The Hydraulic Retention Time 80
3.7.3 The Flow Rate 82
3.7.4 The Upflow Velocity 82
3.8 REACTOR OPERATION 83
3.8.1 Reactor Operation: COD and HRT (Butyrate) 83
3.8.2 Reactor Operation (CKD) 84
3.8.3 Reactor operation (AGBR) 85
3.9 ANALYTICAL METHODS 87
3.9.1 Biochemical Oxygen Demand (BOD) Determination 87
3.9.2 Chemical Oxygen Demand (COD) Determination 88
3.9.3 Total Nitrogen (TN) Determination 89
3.9.4 Total Kjeldahl nitrogen (TKN) Determination 89
3.9.5 NOx, Sulfide and Ammonium ion Determination 90
3.9.6 Total phosphorus (TP) Determination 90
3.9.7 Volatile Fatty Acids (VFA) Determination 91
3.9.8 Total Solids (TS) 91
3.9.9 Total Suspended Solids (TSS) 92
3.9.10 Volatile Suspended Solids (VSS) Determination 93
3.9.11 Mixed Liquor Suspended Solids (MLSS) 94
3.9.12 Mixed Liquor Volatile Suspended Solids (MLVSS) 94
3.9.13 Sludge Volume Index (SVI) 95
3.9.14 pH and Alkalinity 96
3.9.15 Oil and grease Determination 96
3.9.16 Gas Production Measurement 97
3.9.17 Biogas Composition 98

xii
CHAPTER 4 RESULTS AND DISCUSSTION (100-155)
4.1 INTRODUCTION 100
4.2 CHARACTERIZATION OF POME 100
4.3 CHARACTERIZATION OF CKD 102
4.4 Anaerobic degradation of POME 103
4.4.1 Characterization of control digester 103
4.4.2 pH and Temperature 103
4.4.3 COD Removal Efficiency 105
4.4.4 Volatile Fatty Acid (VFA) and Alkalinity 106
4.4.5 TSS and VSS 107
4.4.6 Biogas and Methane Production 108
4.5 Anaerobic degradation of POME with butyrate 110
4.5.1 pH and Temperature 110
4.5.2 COD Removal Efficiency 113
4.5.3 Volatile Fatty Acid 116
4.5.4 Alkalinity and VFA: Alk ratio fraction in UASBR 119
4.5.5 TSS and VSS 120
4.5.6 Biogas and Methane Production 121
4.5.7 Theoretical Mechanism of Butyrate Degradation in
POME
121
4.6 Role of calcium oxide in sludge granulation and
methanogenesis for the treatment of POME
127
4.6.1 Batch test experiment 127
4.6.2 COD removal 129
4.6.3 Reactor VSS and MLVSS concentration 132
4.6.4 CaO-CKD addition for granulation 134
4.6.5 SMA activity and Biogas 140
4.6.6 Scanning electron microscope observations 144

xiii
4.7 DENITRIFYING SULPHIDE REMOVAL AND
CARBON METHANOGENESIS IN A
METHANOGENIC CULTURE ACCLIMATIZED
INTO DSR GRANULES
145
4.7.1 Granulation and Reactor Performance 145
4.7.2 Results and discussion of DSR process 147
CHAPTER 5 CONCLUSION AND RECOMMENDATIONS (156-160)
5 CONCLUSION 156
5.1 Anaerobic degradation of POME with Butyrate 156
.2 Role of CaO in POME sludge granulation and
methanogenesis
157
5.3 Denitrifying sulfide removal and Carbon
methanogenesis
157
5.4 Recommendation for further study 158
6 Published papers 160
CHAPTER 6 REFERENCES (161-196) 161

xiv
LIST OF TABLES
Table No. Title Page No.
1.1 Effluent discharge standards for crude palm oil mills
(Environmental Quality Act 1974, 2005)
5
1.2 Characteristics of CKD 9
2.1 Measured Parameters of Effluent Characteristics from
Previous Studies
24
2.2 Malaysian production of crude palm oil in 2008 and 2009 25
2.3 Fatty acids, amino acids and mineral contents of raw POME
(Source: Habib et al. 1997)
27
2.4 Advantages and disadvantages of anaerobic processes
compared to aerobic processes
38
2.5 Performance of various anaerobic treatment methods on
POME treatment
40
3.1 Specifications of UASB reactor 69
3.2 Specifications of AGB reactor 71
3.4 Trace mineral components
86
4.1 Physico-chemical properties of raw POME
101
4.2 Characteristics of CKD
102
4.3 Biomass quantities (VSS &TSS) in UASB reactor and
effluent (control)
105
4.4 Results of control experiment obtained at each loading after
steady state condition during anaerobic treatment
109
4.5 Biomass quantities (VSS &TSS) in UASB reactor and
effluent (POME with butyrate)
111

xv
4.6 Rate of biogas production during anaerobic digestion at
37 oC (mesophilic) and 65
oC (thermophilic) temperature
with HRT of 30 days
113
4.7 Experimental results obtained at each loading after steady
state condition during anaerobic treatment (POME with
butyrate)
114
4.8 Chemical analysis parameters of POME effluent treated at
various CaO-CKD g/L dosages during fermentation time of
150 days in fermentation reactor
128
4.9 Effect of CaO-CKD in g/L on various parameters in POME
at different fermentation batch reactor using butyrate as
carbon source for the biomass
135
4.10 Profile of biomass during various dosage of CaO-CKD in
UASB reactors after 150 days
137
4.11 Effect of (10 g/L CaO) on SMA (mg-CH4-COD/mg-VSS d)
using butyrate as substrate for energy sources for the
growth of biomass in the UASB reactor
143
4.12 Variation of substrates loading rates and HRT in AGBR 150
LIST OF PLATES
Plate No. Title Page No.
1.1 Palm oil mills (a, b) and Palm oil mill effluent (c, d) 3
3.1 Sample collection point of raw POME 65
3.2 POME samples collected from KLSH-Palm Oil Mill 65
3.3 (a) CKD collection site (b) Heap of CKD (c, d) SEM images
of CKD
66

xvi
LIST OF FIGURES
Figure No. Title Page No.
1.1 World palm oil production 2008 (MPOB) 2
1.2
Flow diagram showing inputs and outputs in the cement
manufacturing process
7
1.3 Photograph of a rotatory kiln, cooled Clinker and CKD 8
2.1 Anaerobic degradation of complex polymers materials 17
2.2 A typical flow diagram of a palm oil mill 21
2.3 Processes involved in oil palm industry 22
2.4 Schematic representation of the course of anaerobic
methane generation from complex organic substances
showing scanning electron micrographs of individual
microorganisms involved
30
2.5 Forms of nitrogen in wastewater 34
2.6 Degradation processes associated with nitrogen elimination 35
2.7 Flow diagram for anaerobic conversion of biomass to
methane associated with DSR
37
2.8 Up-flow anaerobic sludge blanket reactor 46
2.10 (a) Granule composition as proposed by Mc Leod et al.
(b) Schematic representation of the multi-layer model (Liu
et al. 2003)
53
2.9 Granules rising due to the upflow velocity and biogas
attachment
54
2.11 (a) Granule collision, (b) Entrapped biogas 56
3.1 Flow chart of different phases of experimental study 67
3.2 Experimental setup of UASBR 70
3.3 Schematic diagram of AGB reactor used in the experiment 72

xvii
3.4 Schematic diagram of semi-batch column reactor 78
3.5 Water displacement method for biogas measurement 98
4.1 Effect of temperature on acidification (John N. Lester,
1988)
112
4.2 Effluent acetic and butyric acid concentrations during the
start-up period
117
4.3 Effect of COD loading rate on effluent VFA concentration 118
4.4 Course of biogas production with butyric acid reduction in
the Effluent
121
4.5 Effect of COD loading rate on methane production with
time
122
4.6 Theoretical pathway of butyrate degradation in POME and
generation of one molecule of ATP by substrate level
phosphorylation
126
4.7 Operational parameters and performance of the UASB
reactors at various doses of CaO-CKD: COD removal
efficiencies of R1 (control), R2, R3 R4, R5 and R6
130
4.8 Operational parameters and performance of the UASB
reactors at various doses of CaO-CKD: VFA concentrations
of R1 (control), R2, R3 R4, R5 and R6
131
4.9 Operational parameters and performance of the UASB
reactors at various doses of CaO: effluent VSS
concentrations of R1 (control), R2, R3; and R4, R5, and R6
131
4.10 Operational parameters and performance of the UASB
reactors at various doses of CaO: effluent MLVSS
concentrations of R1 (control), R2, R3; and R4, R5, and R6
134
4.11 Biomass development during different days of start-up and
UASB reactor height
136
4.12 (a) SEM micrograph of bisected granules; (b) Outer surface
of the granule; (c) Scanning electron micrgraphs of the
granule: Archaea (Methanosarcina sp.) showing the
arrangement of bacterial cells in granule surrounded by
extracellular polymeric substances (EPS), the seed sludge
and granules sampled on day 150
139

xviii
4.13 SEM micrograph are showing smooth surface of granule
with a large opening cavities likely for biogas escape (a)
Control- WD 4.0 mm, scale 200 μm (b) WD 4.0 MM, scale
200 μm at 60 days; (c) (WD 4.5 mm, scale 200 μm at 90
days); (d) (WD 4.5 mm, scale 200 μm at 150 days)
140
4.14 Operational parameters and performance of the UASB
reactors: CH4 production concentrations of R1, R2 and R3
and R4, R5, and R6
142
4.15 Incubated granules from the AGB reactor. (a,b) SEM
micrographs of Granules; (b) SEM micrograph of surface of
granule; (b) Enlarged view of of granular surface showing
irregular and randomly distributed cavities likely for biogas
escape
146
4.16 Effect of sulfide loading rates (mgL-1
d-1
) on effluent S2-
concentration (mgL-1
) as a function of time
147
4.17 Effect of nitrate loading rates (mgL-1
d-1
) on effluent NO3- 148
4.18 NH4+ production and nitrite consumption corresponding to
different loading rates as a function of time
148
4.19 VFA consumption corresponding to different loading rates
as a function of time
151
4.20 Course of biogas production with VFA reduction
corresponding to different loading rates as a function of
time
152

xix
LIST OF ABBREVIATIONS
AD Anaerobic degradation
AFBR Anaerobic fluidized bed reactor
AGBR Anaerobic granular bed reactor
Al2O3 Alumina
BOD Biochemical oxygen demand
BuLR Butyrate loading rate
CaCl2 Calcium chloride
CaO Calcium Oxide
CaCO3 Calcium carbonate
Ca(OH)2 Calcium hydroxide
CH3COOH Acetic acid
CH4 Methane
CKD Cement kiln dust
CO2 Carbon dioxide
CoCl2.6H2O Cobalt (II) chloride hexahydrate
COD Chemical oxygen demand
CPO Crude palm oil
CSTR Continuous stirrer tank reactor
CuCl2.2H2O Copper (II) chloride dehydrate
DNRA Dissimilatory nitrate reduction to ammonium
DOE Department of Environment
DSR Denitrifying sulfide removal
EFB Empty fruit bunch

xx
EQA Environmental Quality Act
F/M Food to micro-organism ratio
FeCl2.4H2O Iron(II) chloride tetrahydrate
Fe2O3 Ferric oxide
FFA Free Fatty Acids
FFB Fresh fruit bunch
FFR Fix film reactor
Ha Hectare
H2S Hydrogen sulfide
H2SO4 Sulfuric acid
H3BO3 Boric acid
GHG Green house gas
GSL Gas-solid-liquid
HRT Hydraulic retention time
KMnO4 Potassium Permanganate
KH2PO4 Potassium dihydrogen phosphate
KSLH Kilang Sawit Lepar Hiller
K2O Potassium oxide
LCFAs Long chain fatty acids
MPOB Malaysia palm oil board
MgCl2 Magnesium chloride
MgO Magnesium oxide
MPa Mega Pascal
MW Megawatt
MnCl2.4H2O Manganese(II) Chloride Tetrahydrate

xxi
N2 Nitrogen
NaHCO3 Sodium bicarbonate
Na2MoO4.2H2O Sodium molybdate dihydrate
NaOH Sodium Hydroxide
NH4Cl Ammonium chloride
NLR Nitrate loading rate
NO3- Nitrate
NO2-
Nitrite
NGOs Non-governmental organizations
NiCl2.6H2O Nickel (II) chloride, hexahydrate
NO Nitric oxide
NO2 Nitrogen dioxide
NOx Nitrogen oxide
OLR Organic loading rate
P Phosphorous
Pa Pascal
POME Palm oil mill effluent
PO43-
Phosphate
PVC Polyvinyl chloride
Q Flow rate
RE Renewable energy
SCOD Soluble chemical oxygen demand
SD Standard deviation
SE Standard error

xxii
SCOD Soluble chemical oxygen demand
SiO2 Silicon dioxide
SO3 Sulfur trioxide
SLR Sulfide loading rate
SRT Sludge retention time
SS Suspended solids
TKN Total Kjeldahl nitrogen
TN Total nitrogen
TP Total phosphorous
TS Total solids
TSS Total suspended solids
UASFF Upflow anaerobic sludge fixed film reactor
UASBR Upflow anaerobic sludge blanket reactor
USDA United States Department of Agriculture
VFA Volatile fatty acid
VS Volatile solids
VSS Volatile suspended solids
ZnCl2 Zinc chloride

xxiii
LIST OF APPENDICES (197-221)
Appendix
No.
Title Page No.
A1 POME Generation Rates in Different Seasons 197
A2 POME Characteristics in Palm Oil Mill Processing Time 198
B1 Physico-Chemical Properties of POME and Compared With
Various Wastewaters Treatment Process
199
B2 Fatty acids, amino acids and mineral contents of raw POME 201
B3 Potential biogas production from different classes of
substrates
203
B4 Reactions involved in Syntrophic Metabolisma 204
B5 Gibbs free energy changes at 25 oC for the (possible)
reactions involved in syntrophic conversion of oleate and
palmitate during methanogenic decompositiona
207
C1 Results of control experiment obtained at each loading after
steady state condition during anaerobic treatment
208
C2 Experimental results obtained at each loading after steady
state condition during anaerobic treatment (POME with
butyrate)
210
C3 Biomass quantities VSS &TSS in UASB reactor & effluent 213
C4 Chemical analysis parameters of POME effluent treated at
various CaO-CKD g/L dosages during fermentation time of
150 days in fermentation reactor
216
C5 Effect of CaO-CKD in g/L on various parameters in POME
at different fermentation batch reactor using butyrate as
carbon source for the biomass
217
C6 Profile of biomass during various dosage of CaO-CKD in
UASB reactors after 150 days
218
C7 Effect of (10 g/L CaO) on SMA (mg-CH4-COD/mg-VSS d)
using butyrate as substrate for energy sources for the growth
219

xxiv
of biomass in the UASB reactor
C8 Effect of variation of substrates loading rates and HRT on
removal efficiencies in AGBR
220

1
CHAPTER 1
INTRODUCTION
1.1 INTRODUCTION
This chapter includes a brief description of Palm oil industry in Malaysia, Palm
oil mill effluent (POME) and Cement kin dust (CKD). The last part of this chapter
describes effluent discharge standards along with the problem statement, objectives and
the scope of study.
1.1.1 Research Background
1.1.2 Palm Oil Industry in Malaysia
Over the last 30 years, Malaysian palm oil industry has grown rapidly to become
the world's second largest producer of palm oil (Lam and Lee, 2011). The total
productions of CPO in 2008 and 2009 are 17,734,441 and 16,044,874 tonnes,
respectively (MPOB, 2008a, 2009). The high production of crude palm oil prompts the
palm oil industry to become an important contributor to Malaysia's GDP. In year 2008,
the total export of palm oil and derived products raked RM 64,808 million (USD 20,268
million), or 9.8% of the total national revenue (Yusof and Yew, 2009). Simultaneously,
from merely 54,000 ha in the early 1960s, the oil palm plantation area has gradually
increased to 1.8, 3.5, 3.8, 4.2 and 4.3 million hectares in 1990, 2001, 2003, 2005 and
2007, representing 56% of the total agricultural land and 11.75% of the country’s total
land area. As of 2009, there were 416 palm oil mills operating in Malaysia, 249 mills
2
from Peninsular Malaysia and 167 from Sabah and Sarawak. There were 120 mills with
total capacity 29,893, 200 tonnes FFB per year located in Sabah alone. Total of
17,564,937 Metric Tons (MT) crude palm oil produced in year 2009 and 31.03% of
total CPO was produced in Sabah (MPOB, 2009). Such a high percentage was mainly
attributed to the largest oil palm planted state amounting for 1.36 million hectares or
29% of the total planted area in the country (Wahid, 2010). The oil palm planted area in
2011 increased 3% y/y to 5mn hectares due to increase in planted area in Sabah and
Sarawak. CPO production in 2011 increased 11.3% y/y to reach a record-high of
18.9mn. Today, Malaysia and Indonesia account for about 87 percent of world
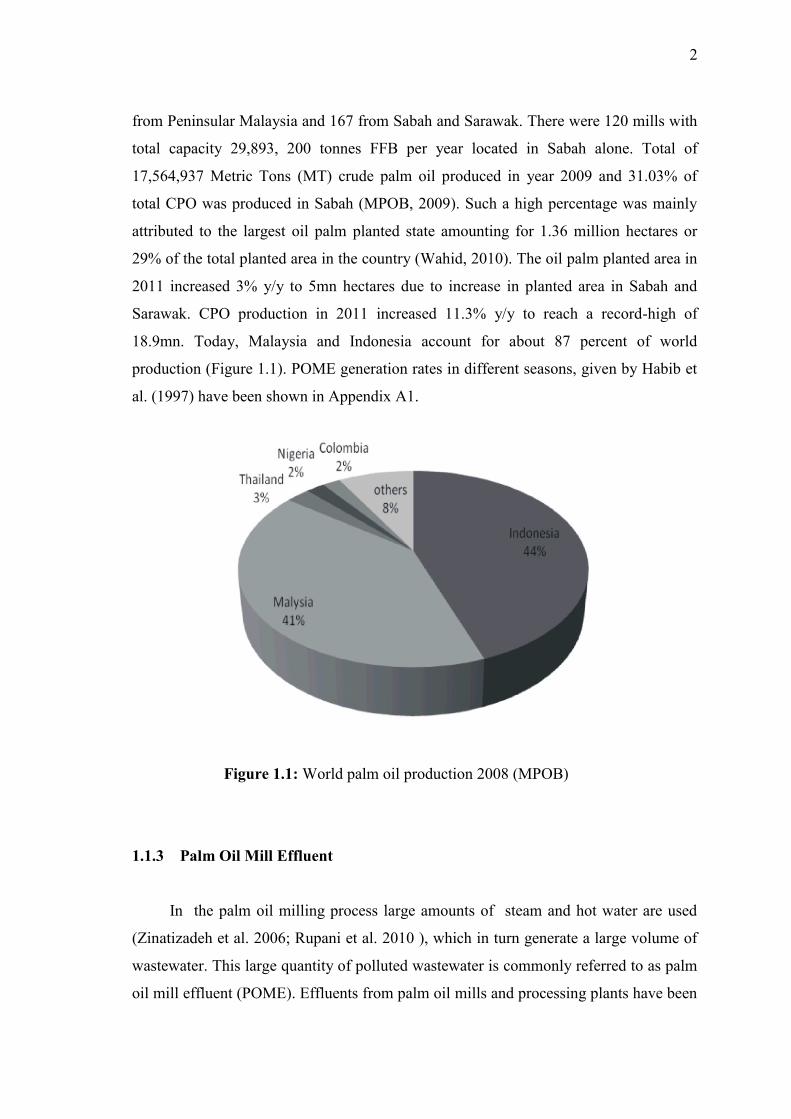
production (Figure 1.1). POME generation rates in different seasons, given by Habib et
al. (1997) have been shown in Appendix A1.
Figure 1.1: World palm oil production 2008 (MPOB)
1.1.3 Palm Oil Mill Effluent
In the palm oil milling process large amounts of steam and hot water are used
(Zinatizadeh et al. 2006; Rupani et al. 2010 ), which in turn generate a large volume of
wastewater. This large quantity of polluted wastewater is commonly referred to as palm
oil mill effluent (POME). Effluents from palm oil mills and processing plants have been

3
identified as the major cause of the rapid deterioration of the biosphere and the
environment in the past and in recent times (Plate 1.1). POME is generated mainly from
the oil extraction, washing, and cleaning processes (sterilizer, hydrocyclone and
centrifuge effluent in the mill palm). Characteristics of POME during palm oil mill
processing time are shown in Appendix A2. Discharge of un-treated effluent into water
streams may cause considerable environmental problems (Lam and Lee, 2011), due to
the its high value of BOD (25,000 mg L-1
), COD (75 g L-1
), oil and grease (8.5 g L-1
),
total solids (45 g L-1
), and suspended solids (21 g L-1
) (Ma, 1995, 2000).
Based on palm oil production in 2005 (14.8 million tonnes), an average of about
53 million m3 POME is being produced per year in Malaysia (Lorestani, 2006). Thus, it
was estimated that in year 2009, 43.8 million m3 (11,600 million gallon) of POME was
generated from Malaysian palm oil mills base on the total crude palm oil production of
17.56 million tonnes (Malaysian Palm Oil Board, 2010).
The palm oil mill industry in Malaysia has thus been identified as that which
discharges the largest pollution load into water bodies and the environment throughout
the country (Wu et al. 2010). This adverse environmental effect from the palm oil
industry cannot be ignored. Thus, there is an urgent need to find an efficient and
practical approach to preserve the environment while maintaining the economy in good
condition.
Plate 1.1. Palm oil mills (a, b) and Palm oil mill effluent (c, d).
a b c d

4
1.2 ENVIRONMENTAL REGULATIONS OF POME DISCHARGE
1.2.1 POME rules in Malaysia
The Department of Environment (DOE, 1999) of the government of Malaysia
issued POME (management and handling) rules in the year 2000. The highlighting
agenda of EQA was to set acceptable standards for the emission and discharge or
deposits of pollutants into the environment rather than prevention, with an exception
given to the necessities on environmental impact measurements. The environmental
restrictions in palm oil industry were decided to be a necessary licensed approach that
would permit close control of individual factories. On the basis of prevailing
environmental circumstances, environmental restrictions also provide a mechanism for
permitting variable effluent standards. . The environmental quality regulations for the
crude palm oil industry were the first set of regulations promulgated under the
Environmental Quality Act (EQA), 1977 for control of industrial pollution source
(Thani et al. 1999), enforced by the Department of Environment, (DOE). Therefore,
palm oil mill owners have to obtain the license for factories operation that includes
ensuring acceptable condition of effluent discharge, proper waste disposal and air
emission control throughout the operation (Environmental Quality Act 1974, 2005).
The proper management, treatment, and disposal of POME must be ensured and
existing facilities must be upgraded for the acceptable discharge to rivers and streams.
As per the provision, DOE has been assigned to monitor the implementation of these
rules, and the MPOB will be required to submit annual reports regarding the status of
POME in their areas to the DOE. These rules are applicable to MPOB in Malaysia,
which is responsible for POME management. In addition, there are EQA by different
industries such as the FELDA. These EQA also deal with environmental pollution
caused by improper disposal of POME.
The Malaysian Government proposed and legalized standards for POME
discharge into water courses. Since then, palm oil mills are required to treat their POME