2. cost meeting discussion document jun 15
DESCRIPTION
ddTRANSCRIPT

Confidential Document
Cost Review Meeting Discussion Document (Main Slides: 3 - 19)
Cost Management & Review – CS& P
10th Jul’15
Board Room

2 Cost Management & Review Corporate Strategy & Planning 2
Performance: Jun’15 w.r.t ABP

3 3 Cost Management & Review Corporate Strategy & Planning
Production & Sales Performance w.r.t ABP: Jun’15
895 839 825
782 835
771 786
716 600
700
800
900
1000
HM CS WSS Sales
KT
ABP Actual
HM Pooling : ABP 21 KT, Act 32 KT
Hot Metal Crude Steel Saleable Steel & Sales
Main Reasons for variance w.r.t.
ABP
Jun’15:
H Blast Furnace-
Tuyere cooler repair- 15 Kt
Power dip- 10 kt
Lower agglomerate- 7 kt
I Blast Furnace-
Power dip– Impact 12 kt
Lower agglomerate- 5 kt
Rrescheduled MSD -30 kt
Main Reasons for variance w.r.t. ABP:
Jun’15:
Total shortfall 68 Kt:
LD#1 4 Kt
LD#2 44 Kt
LD#3 20 Kt
WOI including power failure: 22 Kt
Plant outages & interruptions: 46 Kt
Main Reasons for shortfall wrt ABP
Rescheduling of shutdown at LD#3.
HSM restricted production (ABP 350 kt act 341
kt) – roughing mill motor issue.
Crude Steel Stock (as on 30.06.15 in Kt):
Slab ABP- 23: Actual - 73
Billet ABP- 109 : Actual – 96
60 kt
39 kt 66 kt
68 kt

4 4 Cost Management & Review Corporate Strategy & Planning
Cost Performance: Jun’ 15 vs. ABP & Target
21489
26885
13561
19503
22489
27885
13497
19374 22031
27353
0
5000
10000
15000
20000
25000
30000
HM CS WSS Despatch
Rs.
/t
Target ABP Actual
129 Rs./t
64 Rs./t
W.r.t target 468 Rs./t
532 Rs./t
W.r.t target 542 Rs./t
458 Rs./t

5 Cost Management & Review Corporate Strategy & Planning 5
Stage wise Prod & cost variance analysis – Jun’15 (ABP vs. Act.)
May'15 Act.
Particulars
Jun'15 ABP Jun'15 Act. Var. (Act over
ABP)
Prodn Kt
Cost Rs/t
Prodn Kt
Cost Rs/t
Prodn Kt
Cost Rs/t
Prodn Kt
Cost Rs/t
Raw Materials
1388 1348 OMQ (Total) 1402 1195 1345 1471 -57 276
195 3115 WB (Own Coal) 190 2737 191 2936 1 199
56 12540 Jharia (Own
Coal) 64 8458 55 11477 -9 3019
29 7302 Jharia (BCCL
Coal) 28 7288 31 8654 3 1366

6 Cost Management & Review Corporate Strategy & Planning 6
May'15 Act.
Particulars
Jun'15 ABP Jun'15 Act. Var. (Act over ABP)
Prodn Kt
Cost Rs/t
Prodn Kt
Cost Rs/t
Prodn Kt
Cost Rs/t
Prodn Kt
Cost Rs/t
Iron Making
891 12799 Hot Metal 895 13561 835 13497 -60 -65
Steel Making Production & Conversion Cost
285 5654 LD1- Billet 274 5905 271 5418 -4 -487
338 5718 LD2- Slab 349 5683 305 5784 -44 101
213 6011 LD3- Slab 216 6407 196 6657 -20 250
LP - Mills Production & Conversion Cost
36 3374 WRM 32 4142 34 3164 2 -979
37 2571 MM 35 2696 38 2407 2 -289
78 1967 NBM 52 2937 75 2068 23 -869
FP - Mills Production & Conversion Cost
240 2101 HSM - HR (Gross) 350 1937 341 1790 -9 -147
208 2494 TSCR - HR (Gross) 211 2552 192 2514 -18 -38
157 4890 CRM 164 5398 151 5183 -13 -215
Overall Works Saleable Cost
278 19754 LP Saleable 271 20871 266 20233 -5 -638
446 22579 FP Saleable 555 23280 520 22950 -34 -329
725 21494 WSS 825 22489 786 22031 -39 -458
Stage wise Prod & cost variance analysis – Jun’15 (ABP vs. Act.)
June over May

Cost Management & Review Corporate Strategy & Planning 7
MAJOR KPIs – PLAN v/s ACTUAL
KPI UNIT FY’15 June ’15 April – June 15
ACT ABP ACT VAR ABP ACT VAR
POWER COST
Rs/Mwh
Rs Cr
3850
1441
3959
133
4014
124
55
9
3996
399
3905
368
91
31
OXYGEN COST Rs/T
Rs Cr
2666
478
2643
45
2623
39
20
6
2661
132
2633
118
28
14
MAINTENANCE
COST
Rs/Tss
Rs Cr
1284
1165
1416
117
1307
103
109
14
1300
308
1232
275
68
33
Power Rate Kwh/tss 406 394 381 13 406 408 2
Specific
Energy
Consumption
Gcal/tcs 6.012 5.915 5.802 0.113 5.876 5.782 0.094

Cost Management & Review Corporate Strategy & Planning
R1: Plant outage / Process disturbance : Crude Steel production loss at LD1 - 4 kt + LD2 - 49 kt = 53kt.
(Including impact of WOI - 22kt) .
R2 : Loss of production at Sinter Plant & Pellet Plant : (SP2) Breakdown in combustion air fan, interlock by
pass leading to belt failure & high nos. of
interruptions (8 kt)
(SP4) primarily due to sinter cooler breakdown (13kt)
(PP) due to voltage dip, gas shortage & dryer #1
discharge belt failure (17kt)
R3 : Demurrage Charges (Rs. 16 Crs.): Vessel: Rs.10.03 crs; Rail: Rs. 3.09 crs; EOL Rs.3.03 Crs.
R4 : Iron ore Mine :
i. Usage of bought out Iron ore : 104 kt - Rs. 49 Crs.
Opportunity loss: Jun’15 Rs. 114 Crs.
Internal factors: - Rs 65 Crs. External Factors
( Raw material ):-Rs 49 Crs.
47 2
16 65
49 114
0
20
40
60
80
100
120
R1 R2 R3 Sub Total R4 Total
Pooling (kt)
ABP : 21 MBP : 10 Act : 32 LD1 LD2 LD3 Total
ABP 274 349 216 839
MBP 274 354 194 822
Actual 271 305 196 771
Gap wrt ABP -4 -44 -20 -68
Gap wrt MBP -4 -49 2 -51
Crude steel prodn.(kt)

Cost Management & Review Corporate Strategy & Planning
Opportunity loss: (Rs. Crs).
72 112
366
480
618
159
85 77 57 56 49
75 45
52
45
53
56
58 55 56 46 65
0
100
200
300
400
500
600
700
800
Aug Sep Oct Nov Dec'14 Jan'15 Feb'15 Mar'15 Apr'15 May'15 Jun'15
External factors Internal factors
Total : 672
Total : 215
Total : 143 Total : 132
Total : 147
Total : 525
Total : 418
Total : 157
Total : 112 Total : 101
1) Total opportunity loss reducing due to
resumption of iron ore mines operation.
2) Opportunity loss due to internal factors
remain unchanged ( Rs. 50-55 Crs pm )
Total : 114

Cost Management & Review Corporate Strategy & Planning 10 Cost Management & Review Corporate Strategy & Planning
Production & Sales Performance: Q1 FY16 vs. ABP & Target
2654 2429 2372 2253
2588 2345 2229 2144
600
1100
1600
2100
2600
3100
HM CS WSS Sales
KT
ABP Actual
HM Pooling : ABP 124 KT, Act 145 KT
Hot Metal Crude Steel Saleable Steel & Sales
Main Reasons for variance w.r.t.
ABP
Jun’15:
Power dip (~15 Kt)
H BF Tuyere cooler repair (15 Kt)
Plant outage & interruptions (36 Kt)
Main Reasons for variance w.r.t. ABP:
Jun’15:
Primarily in LD#2 (Plant outages /
interruptions & WOI)
Main Reasons for shortfall wrt ABP
Lower crude steel (84 Kt).
Break down at HSM
Crude Steel Stock (as on 30.06.15 in Kt):
Slab ABP- 23: Actual - 73
Billet ABP- 109 : Actual - 96
66 kt
143 kt 109 kt 84 kt

Cost Management & Review Corporate Strategy & Planning 11 Cost Management & Review Corporate Strategy & Planning
Cost Performance: Q1 FY16 vs. ABP & Target
21724
26944
13704
19735
22724
27944
13227
19025 21817
26943
0
5000
10000
15000
20000
25000
30000
HM CS WSS Destatch
Rs.
/t
Target ABP Actual
711 Rs./t
477 Rs./t
W.r.t target 93 Rs./t
907 Rs./t
1001 Rs./t
Reached Target

12 12 Cost Management & Review Corporate Strategy & Planning
Projection- Jul’15

13 13 Cost Management & Review Corporate Strategy & Planning
Jul’15 : Production Projection (1/2)
ABP Proj. VAR.
835 Hot Metal Kt 887 898 11
271 LD#1 Kt 284 284 0
305 LD#2 Kt 329 347 18
196 LD#3 Kt 231 231 0
34 WRM Kt 28 37 9
38 MM Kt 37 37 1
75 NBM Kt 78 53 -25
341 HSM (Gross) Kt 255 290 35
192 TSCR (Gross) Kt 225 225 0
151 CRM Kt 16 89 72
786 WSS Kt 759 789 30
Jun
ActFacilities UoM
Jul-15

14 14 Cost Management & Review Corporate Strategy & Planning
Jul’15: Projection (Stage wise Incremental Cost) (2/2)
ABP Proj. VAR.
13497 Hot Metal Rs/t 13511 12960 -551
5418 LD#1 Rs/t 5783 5768 -15
5784 LD#2 Rs/t 5939 5517 -422
6657 LD#3 Rs/t 6373 5874 -498
3164 WRM Rs/t 4335 3285 -1050
2407 MM Rs/t 2675 2590 -85
21 NBM Rs/t 2315 3361 1046
1790 HSM (Gross) Rs/t 2283 2121 -162
2514 TSCR (Gross) Rs/t 2469 2348 -121
5183 CRM Rs/t 24489 7932 -16557
22031 WSS Rs/t 22076 21479 -596
Jun
ActFacilities UoM
Jul-15

15 Cost Management & Review Corporate Strategy & Planning 15
Quarter wise Production & Cost Trend

16 Cost Management & Review Corporate Strategy & Planning 16
Production Trend- Q1 FY’16: WSS production is lower by 143 Kt Q2 proj. as per ABP
2528 2676 2654 2588 2650 2661
867 892 895
887 894 869 862 891 835
898 894 869
Q1 FY'15 Q4 FY'15 Q1 ABPFY16
Apr'15 May'15 Jun'15 Q1 FY16 Jul'15 Aug'15 Sept'15 Q2'15ABP
Q2'15Proj
Kt
ABP Act./Proj.
2334 2441 2430 2345 2513 2531
788 802 839
844 870 799 738 836 771
862 870 799
Q1 FY'15 Q4 FY'15 Q1 ABPFY16
Apr'15 May'15 Jun'15 Q1 FY16 Jul'15 Aug'15 Sept'15 Q2'15ABP
Q2'15Proj.
Kt
ABP Act./Proj.
CS
2250 2389 2372 2229 2420 2412
769 778 825
759
854 806
718 725 786
789
818 805
Q1 FY'15 Q4 FY'15 Q1 ABPFY16
Apr'15 May'15 Jun'15 Q1 FY16 Jul'15 Aug'15 Sept'15 Q2'15ABP
Q2'15Proj.
Kt
ABP Act./Proj.
WSS
HM

17 Cost Management & Review Corporate Strategy & Planning 17
WSS Cost Trend –FY’16 Q1 cost lower than ABP Rs. 907, but higher than target by 93/t
22198
21198
22724
21724 21817 22278
21278 21714
22670 23026 22489
22076 22484 22250
21924 21494 22031
21529 21611 22000
FY'16ABP
Fy16Target
Q1FY'16ABP
Q1 FY16Target
Apr'15 May'15 Jun'15 Q1FY'16Act
Jul'15 Aug'15 Sept'15 Q2'15ABP
Q2'15Target
Q2'15Proj.
Rs/
tss
ABP Target
Impact of MMDR act has been included in WSS cost
from Apr’15 onwards
* Does not include DMF impact Rs. 75 crs (~700-800/t), but taken in despatch cost
Actual

18 Cost Management & Review Corporate Strategy & Planning 18
FY16 Operating profit commitment to Board
2000
ABP Additional target Commitment toBoard
Operating Profit (Rs. Crs.)
(Rs. 2000/t)
H1 FY16: Expected shortfall: Rs. 250-300/t Make up target for Q2 to achieve Board commitment: Rs. 500-600/t
H2 FY16: Based on current projection: HRC price drop by $40-50/t New MMDR Act, 2015: ~Rs. 1200/t
Shortfall: ~Rs. 2000/t
1
2
Gap wrt Target

19 Cost Management & Review Corporate Strategy & Planning 19
Key items for discussion: Q2 FY16
Production 1. Plant Availability:
Headroom by 10-15%. 2. Operational efficiency
1
2 Monsoon
Moisture in raw materials Longer recovery time Raw materials supply disruptions Adverse impact on Production & KPIs
3 High Imported Coal stock
Imported coal inventory as on 30th June ‘15 was 1.6 MnT (118 days consumption), significantly higher compared to FY13- FY14 700-800 KT (60-70 days)
Adverse impact on profitability : Rs. 60-80 Crs. p.a.
Counter measures to mitigate the impact
Action plan to be checked. Part of Agenda item.
Current rate of production is not adequate (lower by ~7%) to achieve
2.53 MnT of crude steel production in Q2 FY16
Expediting improvement projects implementation through SHIKHAR 25
20 20 Cost Management & Review Corporate Strategy & Planning
End of main discussion document
Thank you… Back up in subsequent slides

21 Cost Management & Review Corporate Strategy & Planning 21
13561 276 108 102 64 399 215 13497
R1 R2 R3 R4 R5 R6
R1: Higher captive iron ore price (ABP: Rs. 1605/t , Act: Rs. 1845/t)
R2: Impact of lower HM production (ABP : 895 kt , Act : 835 kt)
R3:Higher captive coal price - Jharia: Rs. 2171/t , WB: Rs. 104/t (Jharia - ABP: Rs. 8676/t , Act: Rs. 10727/t ; WB – ABP: Rs. 3318/t, Act: Rs. 3423/t)
R4:Higher flux consumption (ABP: 182 kg/thm, Act: 221 kg/thm)
R5: Lower usage of purchased iron ore (ABP: 146 kt, Act: 104 kt)
R6: Lower requirement of imported coal (ABP: 504 kt, Act: 456 kt)
AB
P
Hot Metal Cost variation (ABP vs Actual): Jun’15 (Rs./thm)
Cost is lower by Rs. 65/thm
Low
er U
sage
of
Pu
rch
ased
Met
allik
s
Hig
her
Cap
tive
C
oal
Pri
ce
AC
TUA
L
Hig
her
Flu
x C
on
sum
pti
on
Hig
her
Cap
tive
Ir
on
Ore
Pri
ce
Imp
act
of
Low
er
pro
du
ctio
n
Low
er R
equ
irem
ent
of
Imp
ort
ed C
oal
22 Cost Management & Review Corporate Strategy & Planning 22
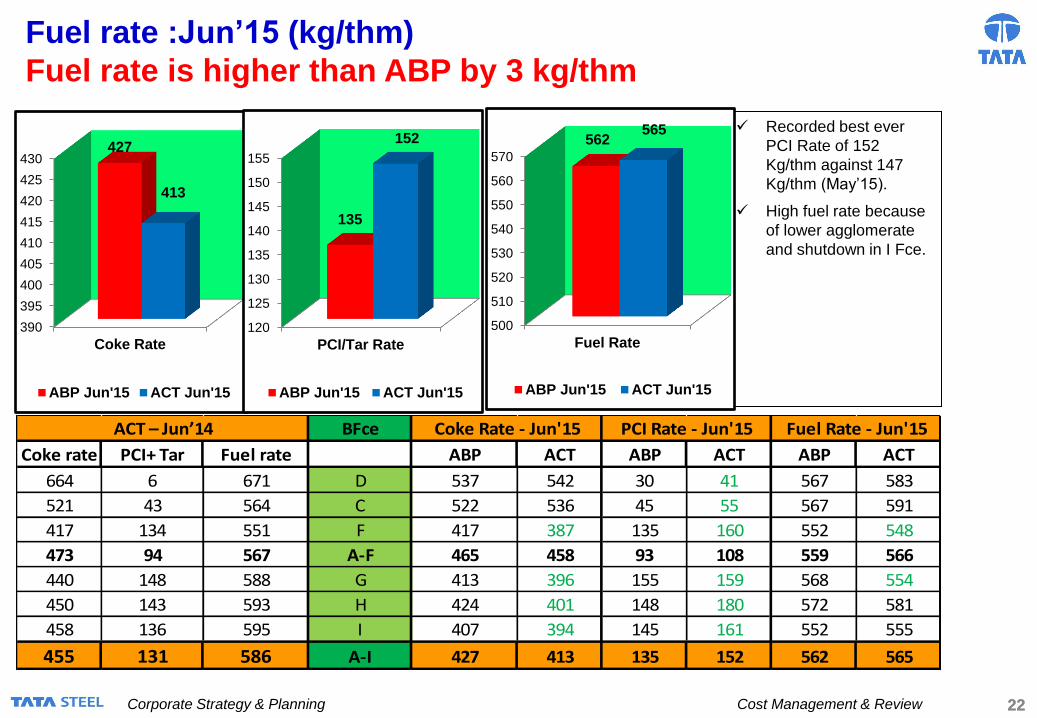
Fuel rate :Jun’15 (kg/thm)
Fuel rate is higher than ABP by 3 kg/thm
Recorded best ever
PCI Rate of 152
Kg/thm against 147
Kg/thm (May’15).
High fuel rate because
of lower agglomerate
and shutdown in I Fce.
390
395
400
405
410
415
420
425
430
Coke Rate
427
413
ABP Jun'15 ACT Jun'15
120
125
130
135
140
145
150
155
PCI/Tar Rate
135
152
ABP Jun'15 ACT Jun'15
500
510
520
530
540
550
560
570
Fuel Rate
562 565
ABP Jun'15 ACT Jun'15
BFce
Coke rate PCI+ Tar Fuel rate ABP ACT ABP ACT ABP ACT
664 6 671 D 537 542 30 41 567 583
521 43 564 C 522 536 45 55 567 591
417 134 551 F 417 387 135 160 552 548
473 94 567 A-F 465 458 93 108 559 566
440 148 588 G 413 396 155 159 568 554
450 143 593 H 424 401 148 180 572 581
458 136 595 I 407 394 145 161 552 555
455 131 586 A-I 427 413 135 152 562 565
Fuel Rate - Jun'15ACT – Jun’14 Coke Rate - Jun'15 PCI Rate - Jun'15

23 23 Cost Management & Review Corporate Strategy & Planning
Coke Cost Jsr Plant : June’15 (Rs.828/t lower than ABP)
Lower cost due to favorable domestic coal blend (ABP : 38%, ACT :47%)
Coke Yield (BF+Nut)
Prod'n Tons Coal Tar (631) (682) (51) ABP 68.9%
ABP 269480 Coke Breeze (605) (637) (32) Act 68.7%
Act 264676 CO gas credit (2425) (2629) (204) Impact 29
Impact 39 Total -3,660 -3,947 -286
Rs./ton
ABP - June'15 10,727
ACT - June'15 9,898
Adv/Fav() -828
variance variance Coal Mix (748)
Wages 43 Fuel cost -149 Coal Price 253Stores & Refactory 38 Utilities 15 Coal H'ndlng (8)
Maint -86 Misc exps 32 Total -503
Total Impact -5 Total Impact -102
Coal
BlendABP % Act %
ABP
Price/t
Act
Price/t
Price
Var'nce
Mix
VariancJamadoba Coal 8% 8% 9,448 12,208 300 46W Bokaro Coal 30% 39% 3,587 3,756 96 461Imp Semi Soft 35% 26% 9,460 9,333 -54 -1,278HCC 27% 27% 9,975 9,750 -88 22
100% 100% 7835 7510 253 -748
Prod'n Impact(BF+Nut)
Coal CostFixed cost Fuel & Utilities
Credits

24 24 Cost Management & Review Corporate Strategy & Planning
HMC Gross Coke cost : Jun’15 (Rs.1003/t higher than ABP)
Higher cost mainly due to higher imported coal in blend.

25 25 Cost Management & Review Corporate Strategy & Planning
Change
Qty (kt) Blend % Qty (kt) Blend % Blend %
Jharia 87 11% 69 10% -2%
West Bokaro 174 23% 198 27% 5%
Total Captive (A) 261 34% 267 37% 3%
SS (Imported) 170 22% 140 19% -3%
HCC (Imported) 202 26% 178 25% -2%
Total Imported Coking Coal (B) 372 49% 318 44% -5%
PCI 132 17% 137 19% 2%
Total Imported non-Coking Coal (C) 132 17% 137 19% 2%
Total Imported Coal (B+C) 504 66% 456 63% -3%
Total Coal (A+B+C) 765 100% 723 100% 0%
Wet CoalABP-Jun'15 ACT-Jun'15
# Jharia coal supply was lower by 5 kt (ABP : 92 kt, Act :87 kt),
W Bokaro coal supply higher by 5 kt (ABP : 190 kt, Act :195 kt).
#
Coal Blend : Jun’15 Favorable coal blend : Higher Captive coal availability.

26 26 Cost Management & Review Corporate Strategy & Planning
Sinter Cost variation : Jun’15 (ABP vs ACT) (Lower than plan by Rs. 153/tns)
*Use of purchased
iron ore –
ABP:146 kt,
Act:101 kt
*

27 27 Cost Management & Review Corporate Strategy & Planning
Pellet Cost variation : Jun’15 (ABP vs ACT) (Lower than plan by Rs.82/t)
Cons Rate Cons Rate Cons Rate Cons Rate
kg/t Rs/t kg/t Rs/t GCL/t Rs/GCL Kg/t Rs/t
ABP 1135 1699 31 1300 48 1680 73 4358
Act. 1066 1838 21 1300 58 1578 73 4178
Impact (Rs/t) -116 149 13 0 16 (6) (1) (13)
Net Impact (Rs/t) 33 13 10 (14) (82)
Production(KT) Rs/t
ABP 520 ABP 3368
Act. 443 Act. 3285
Production
variance(77) Adv(+)/Fav(-) (82)
3 0 (45)
Stores&
RefractoryMaint
Fixed Cost-
Price
Impact
Fixed Cost-
Qty Impact
Cons Rate Cons Rate
KWH/t Rs/KWH Rs/tnp Rs/tnp Rs/tnp Rs/tnp kg/t Rs/t
ABP 49.0 3971 45 230 315 268 103 3341
Act. 49.2 4014 31 163 270 315 90 3276
Impact (Rs/t) 1 2 (14) (67) (45) 47 (42) (6)
Net Impact (Rs/t) 3 2 (48)
PowerSolid Fuel + Coal
Tar+Others
Fe Bearing Material Return Fines CO Gas Flux

28 28 Cost Management & Review Corporate Strategy & Planning
A-I Blast Fce Cost variation : Jun’15 (ABP vs ACT) (Lower than plan by Rs.65/thm)
Prices ABP Act
Power Utility Sinter 4269 4075
Rate Rate Cons Rate Cons Rate Cons Rate Pellet 3368 3287
Rs./thm Rs./thm Kg/t Rs./t GCL/t Rs./GCL Kg/t Rs./t Sz Ore 1763 2333
ABP 140 416 172 1,651 0.50 350 1,576 3,491
Act 113 423 135 2,426 0.48 339 1,604 3,404 Cons(Kg/thm) ABP Act
(61) 105 (6) (5) 95 (140) Sinter 724 653
Net Impact (27) 7 44 (12) (46) Pellet 567 583
Lump ore 285 368
Total 1576 1604
Rs./thm
ABP 895 ABP 13,561
ACT 835 ACT 13,497
Production
variance 60 Adv(+)/Fav(-) (65)
Lower fixed cost 36
Rs./thm Rs./thm Rs./thm Cons Rate Cons Rate Prices ABP Act
Kg/t Rs./t Kg/t Rs./t
ABP (389) ABP 440 ABP 363 ABP 16 2,582 562 11,183 Coke 11920 11390
Act (377) Act 426 Act 439 Act 40 2,678 565 10,768 PCI 8692 8865
61 4 28 (234) Tar 17250 17400
12 Net Impact (15) 76 65 (206) Total 11183 10768
Rs./t
Rs./t
Industrial Gases Gaseous Fuel Fe Bearing Mat
Production Impact (KT)
Stores & Refractory + SS Maint. FuelFluxBF Gas Credit
Plan Act
Sinter 46% 40.72%
Lump 18% 20%
Pellet 36% 36%
Agglomerate 82% 77%
Kg/t ABP ACT
Coke Rate 427 413
PCI+Tar 135 152
Fuel Rate 562 565

29 29 Cost Management & Review Corporate Strategy & Planning
LD#1: Cost Analysis Jun’15 (ABP vs. Actual)
(13) (81) (26)
274
Cons
(kg/t)
Rate
(Rs/t)
Cons
(kg/t)
Cons
(kg/t)
Cons
(kg/t)
Rate
(Rs/t)271
ABP 1040 13561 65 76 20.0 53982
Actual 1043 13497 54 71 19.4 42048
Impact
(Rs/t)38 (51) (144) (44) (35) (9)
Net Impact
(Rs/t)(13) (26)
HM+Scrap Consn.(kg/t)
ABP 1105
Actual 1097 Rs/t
19466
18914
(551)
(67) (176) 4 (41) (10) 18 81 18
Stores R&M PowerFuel &
Gases
LS from
LD 3Others
Scrap
Credit
Fixed
CostRs. Cr.
Cons
(kg/t)
Rate
(Rs/t)Rs/t Rs/t Rs/t Rs/t Rs/t Rs/t Rs/t Rs/t Rs/t
ABP 6.80 66912 329 335 373 348 430 -590 710 19 5905
Actual 6.42 66130 262 159 378 307 401 -510 729 20 5418
Impact
(Rs/t)-25 (5) (67) (176) 4 (41) (10) (29) 81 18 0.03 (487)
Major Reasons in detail :
Consn. -301
R1: Credit for Muck returned to IBMD, which was booked as scrap cons in earlier months: 3.5 Kg/tcs Price -201 Lower HM Si - 1.5 Kg/tcs ( Pan - 0.92, Act 0.87 ) Volume 15 Scrap : Lower Scrp cons in overall mix : HM has higher Fe than Scrap - 1 Kg/tcs , Lower Slag Fe - 0.5 Kg/tcs Total -487
R3: Lower HM Si by 0.05 ^% - 3.5 Kg/tcs, Usage of LF Slag - Net Lime cons lower by 0.5 Kg/tcs
R6: Charging for 90 tons of tundish material not charged in June as MR was put up late : 0.32 Kg/tcs
R7: Electrodes could not be charged - as reservation was made late : 17 Rs/t. Will be a cost spillover to July
R8: Lower Vol- 4 Rs/t F , Exp - 180 Rs/t A - R & M Exp of 4.80 crs deferred to Sep 15 (B scheme of ID fan impeller of Rs 3.40 Crs
and normal expenditure of Rs 1.40 Crs )
R13: Better Yield
R14: Lower volume - 10 Rs/t , Higher exp ( GW )- 8 Rs.t
Cons
(kg/t)
(154)
9283
(27) (81)
(10) 17
0.80
1.10
Production (Kt)
DS Compound
Actual
Actual
Actual
ABP
ABP
LD 1 Billet
Works Cost
Var.
(17)
(154) (27)
Rate
(Rs/t)
Rate
(Rs/t)
Rate
(Rs/t)
592361549315311
Hot Metal Scrap Consumed Lime Ferro Alloys ABP
9047 61039
(551)
(47)
(5) (487)
Refractories
Var.
LD 1 Billet
Conversion Cost
R1 R2 R3 R4
R6 R7 R8 R9 R10 R11 R13R12 R14
R5

30 30 Cost Management & Review Corporate Strategy & Planning
LD#2 & SC: Cost Analysis Jun’15 (ABP vs. Actual)
88 56 (169) (139)
Scrap Credit Prodn :
ABP 349
Act. 305
ABP 1039 13561 70 66 10.18 125573 -442 -44
Act. 1051 13497 71 75 9.52 116439 -581
Impact (Rs/t) 155 (67) 22 88 (82) (87)
Net Impact
(Rs/t)88 (169) (139)
Yield Impact (3)
HM + Scrap:-
ABP 1109
Act. 1122 Rs/t
19244
19281
36
38 15 35 (49) 97
Stores R&M PowerFuel &
GasesFixed Cost
Cons
(kg/t)
Rate
(Rs/t)Rs/t Rs/t Rs/t Rs/t Rs/t Rs cr Rs/t
ABP 5.65 75823 207 195 223 374 568 20 5683
Act. 6.28 70469 245 210 258 326 666 20 5784
Impact (Rs/t) 14 38 15 35 (49) 97 0 101
Major Reasons in detail :
Cons 125
Vol 124
Price/ Exp (148)
R7 Rs 1.5 Crs was spend more than plan in June, however YTD cost is lower than plan (ABP Rs 21 Crs Act : Rs 20 Crs) Total 101
R9 & R12 Higher due to lower Vol Impact
HM Scrap
94
(45)
Rate
(Rs/t)
94
Rate
(Rs/t)
Cons
(kg/t)
Rate
(Rs/t)
Lime Ferro Alloys
LD 2 Slab
Works Cost
16053
16533
34
56
9834
9914
Rate
(Rs/t)
Cons
(kg/t)
Rate
(Rs/t)
Cons
(kg/t)
Cons
(kg/t)
6
14
36
RefractoriesLD 2 Slab
Conversion Cost
ABP
Var.
Others
Rs/t
(45)Act.
Var.
ABP
Act.
101
R3 Impact of higher HM P (20% increase in HM P >0.18) : 2.5 kg/tcs, Higher HM Si (0.78%): 1 kg/tcs, Capoff 0.5 kg/tcs,
V1 high life 1.5kg/t
R6 0.55 Kg/tcs :Vessel Relining bricks & Ladle bricks excess drwan in June'15 to be set off with July'15
0.08 Kg/tcs :a) Increase in DS lance Consumption due to increase in chokage of lances : 0.01 Kg/tcs
b) Increase in LF bush & lances Consumption due increase in LF failures : 0.03 Kg/tcs
c) Increase in Vessel Maintenance due to vessel #1 (running at 4450 Heats) : 0.04 Kg/tcs
R8 Lower Vol Impact Rs28/t (A) & Expenditure by Rs13/t (F) (R & M B scheme of Vessel # 1 Hood of Rs 0.80 Crs not charged
due to deferement of hood change to Jan'16
506
551
R1 R2 R3 R4 R5
R6 R7 R8 R9 R10 R11 R12

31 31 Cost Management & Review Corporate Strategy & Planning
LD#3 & TSC: Cost Analysis Jun’15 (ABP vs. Actual)
(483) (89) 227
Scrap Credit Prodn :
Cons
(kg/t)
Rate
(Rs/t)
Cons
(kg/t)
Cons
(kg/t)
Cons
(kg/t)
Rate
(Rs/t)Rs/t ABP 216
ABP 1048 13561 70 81 10.21 132617 -599 Act. 196
Act. 1018 13497 99 77 10.25 123405 -372 Gap -20
Impact (Rs/t) (418) (65) 462 (37) 6 (94)
Net Impact (Rs/t) (483) (89) 227
Yield Impact (1)
HM + Scrap:-
ABP 1118
Act. 1117 Rs/t
19968
20154
185
75 90 40 (31) 127
Stores R&M PowerFuel &
GasesFixed Cost Rs cr
Cons
(kg/t)
Rate
(Rs/t)Rs/t Rs/t Rs/t Rs/t Rs/t Rs/t
ABP 5.97 79664 420 319 298 335 651 14 6407
Act. 5.91 74516 496 409 338 304 778 15 6657
Impact (Rs/t) (35) 75 90 40 (31) 127 1.2 250
Major Reasons in detail :
R3 Due to low HM Si lead to lower consumotion of lime. Operating at lower basicity as vessels are new lead to lower consumption of lime Cons 223
R7 Mould woth Rs 1.5 Crs planned for May has been changed in June'15 Vol 106
Price/ Exp (79)
Total 250
R9 Due to consumption Rs 36/t (A) & due to rate Rs 4/t(A)
R12 Due to higher expenditure Rs 61/t & due to lower voluume Rs 65/t
(115)
Ferro Alloys
Rs/t
607
491
ABP
R8 Mech -Expenditure related to operation of 1.07 Crs was wrongly charged in mechanical , which will be reversed in July
IEM - Preponement of R & M B scheme of Crane drive fan, FDA revival spare , Fire coating & WCC Hose of Rs 0.38 Crs and
higher normal expenditure of Rs 0.11 Crs due to charging of Crane servise (track rail & DSL) & Rope which was not in plan
Var.
HM Scrap Lime
(35)
Refractories
Rate
(Rs/t)
Rate
(Rs/t)
(1) (44)
(81)
Others
(115)
(81)461
ABP
Act.
Act.
Var.
15570 9950
15559 9379
250
LD 3 Slab
Conversion Cost
461
185
LD 3 Slab Works Cost
R1 R2 R3 R4 R5
R6 R7 R8 R9 R10 R11 R12

32 32 Cost Management & Review Corporate Strategy & Planning
WRM(E): Cost Analysis Jun’15 (ABP vs. Actual)
(22)
ABP 32.0
Yield %Cons
(kwh/t)Actual 34.4
ABP 97.52% 121
Actual 97.52% 121
Impact(Rs/T) 0 (1)Net Impact
(Rs/T)
Rs/t
25008
23575
(1433)
(11) (797) (23) (64)
Stores R&MFuel &
GasesOthers Rs Cr.
Rs/t (Rs/t) Rs/t Rs/t Rs/t
ABP 290 1172 339 481 4.1 4142
Actual 279 375 316 417 4.2 3164
Impact
(Rs/T)(11) (797) (23) (64) 0.11 (979)
Major Reasons in detail :
Consn. 10
R5: Higher Vol 81 Rs/t F , Lower Spend 715 F ( R & M B schemes of Electrical and Price -819
maintenance not carried out due to deferment of MSD - 1.70 crs) Volume -170
R8: Higher Volume - 88 Rs/t F , Higher Exp 33 A Total -979
ABP
(466) 5
(55) (979)
Actual
Rate
(Rs/t)
Rate
(Rs/KWh)
Var.
(465) 5 (22)
(1433)
Rs/t
WRM Works Cost
20866 3.97 -425
20411 4.01 -447
(465) 5 Production (Kt)
Power Scrap Credits
(55) Var.
Fixed Cost WRM Conversion Cost
1274 ABP
1219 Actual
Rs/t
R5 R6 R7 R8
R2R1 R3
R4

33 33 Cost Management & Review Corporate Strategy & Planning
MM: Cost Analysis Jun’15 (ABP vs. Actual)
27
ABP 35
Yield %Cons
(kwh/t)Actual 38
ABP 97.26% 61Actual 97.27% 45Impact (Rs/T) (3) (62)Net Impact
(Rs/T)
Rs/t2166120800
(861)
(62) (22) (46) (46)
Stores R&M Fuel &
GasesOthers Rs Cr.
Rs/t Rs/t Rs/t Rs/t Rs/tABP 165 344 534 358 3.3 2696Actual 103 322 488 312 3.3 2407
Impact (62) (22) (46) (46) 0.0 (289)
Major Reasons in detail :
Cons -65
R2: Reversal of excess energy consmption, wrongly booked last month. Price -141
R4: Extra charging of packaging bills of last month , reversed : 30 Rs/t F Volume -84
R5 / R 8 : Favourable Volume impact Total -289
(861)
(589) 2
(591) (60) 27
18393
Rate
(Rs/t)
Rate
(Rs/KWh)Rs/t
18966 3.97 -4184.01 -391
(591) (60) Production (Kt)
Power Scrap Credits
MM Works Cost
ABPActualVar.
(63) (289)
Fixed Cost MM Conversion Cost
Rs/t937 ABP874 Actual(63) Var.
R5 R6 R7 R8
R2R1 R3
R4

34 34 Cost Management & Review Corporate Strategy & Planning
NBM: Cost Analysis Jun’15 (ABP vs. Actual)
14
ABP 52
Yield %Cons
(kwh/t)Actual 75
ABP 96.60% 105Actual 96.60% 93Impact (Rs/T) (0) (49)Net Impact
(Rs/T)
Rs/t2190320505
(1398)
(57) (188) (29) (360)
Stores R&M Fuel &
GasesOthers Rs. Cr.
Rs/t Rs/t Rs/t Rs/t 3.45 Rs/t
ABP 231 440 382 540 3.59 2937Actual 174 253 353 180 2068Impact
(Rs/T)(57) (188) (29) (360) 0.14 (869)
Major Reasons in detail : Cons . -49
R2/R4/R5/R7/R8: Favourable impact of higher volume ( Postponment of SD to July ) Price -481
Volume -339
Total -869
(548) 4
664
Rs/t
ABP
(548) (45) Production (Kt)
Power
ABP
Rate
(Rs/t)
Scrap Credits
(1398)
18966 3.97
Rs/t
NBM Works Cost
-404
(548) (45)
18436 4.01
Rate
(Rs/kwh)
14
-390
NBM Conversion Cost
Actual
Fixed Cost
Var.
(869)
479 Actual
Var.
(185)
(185)
R5 R6 R7 R8
R2R1 R3
R4

35 35 Cost Management & Review Corporate Strategy & Planning
HSM: Cost Analysis Jun’15 (ABP vs. Actual)
(7) (17) (1) (1)
Prodn :
Yield Cons Rate Cons Rate ABP 350
(%) (Gcal/t) (Rs/GCal) (kwh/t) (Rs/kwh) Act. 341
ABP 98.20% 0.272 1097 87 3.97 -9
Act. 98.21% 0.272 1073 82 4.01
Impact (Rs/t) (2) (0) (7) (21) 3
Net Impact (Rs/t) (7) (17)
Yield Impact (2)
Rs/t
ABP 21181
Act. 20935
Var. (246)
(43) 24
Stores R&M Rs cr
Rs/t Rs/t Rs/t
ABP 89 319 14 ABP 1937
Act. 46 343 14 Act. 1790
Impact (Rs/t) (43) 24 (0.2) Var. (147)
Major Reasons in detail : Cons (15)
Vol 21
Price/ Exp (154)
Total (147)
HSM Conversion Cost
412
HSM Works Cost
Rolls
(246)
(54) (147)
Rs/t
161
-216
(1)
Rate
(Rs/t)
19244
19145
(101)
417
Input Slab Fuel Power
Packing Fixed Cost
6 (25)
Credits
Rs/t
(25)
Others
136
Rs/t
(103)
-215
(103)
41 53
Rs/t Rs/t
95 78
R10 Due to lower volume
R6 Due to lower volumes Rs13/t and Rs 11/t due to clearing pending service bills
(54) (25) 6(25)
R5 R6 R7 R8 R10
R2R1 R3 R4
R9

36 36 Cost Management & Review Corporate Strategy & Planning
TSC Rolling: Cost Analysis Jun’15 (ABP vs. Actual)
(40) 6 18
Cons. Cons Rate Cons Rate Prodn:
(Kg/t) (Gcal/t) (Rs/GCal) (kwh/t) (Rs/kwh) ABP 211
ABP 97.53% 0.199 1363 115 3.97 Act. 192
Act. 98.20% 0.185 1253 115 4.01
Impact (Rs/t) (139) (19) (20) 1 5
Net Impact (Rs/t) (40) 6
Yield Impact 3
Rs/t
ABP 22520
Act. 22645
Var. 125
(42) 53 (5) 13
Stores R&M Rs cr
Rs/t Rs/t Rs/t
ABP 105 281 14 ABP 2552
Act. 62 334 14 Act. 2514
Impact (Rs/t) (42) 53 (0.0) Var. (38)
Major Reasons in detail :
Cons (138)
Vol 99
Price/ Exp 2
R7 Due to two new rolls that has been drawn, howevr YTD cost is as per plan. Total (38)
R10 Due to lower volume
CreditsRate
(Rs/t) Rs/t
TSCR Conversion
Cost
27 18
125
TSCR Works Cost
31 63 (38)
27
165 666
196 729
Rolls Fixed Cost
19968 -117
20130 -98
165
Input Fuel Power
R6 Due to Entry guide & Exit Guide of finishing stands F#1 to F#6 of Rs 0.70 Crs charged in June which was plan in
May and higher normal expenditure of Rs 0,26 Crs due to shut down
120
115
(5)
Others
Rs/t
97
110
1331 63
Rs/t Rs/t
Packing
Rs/t
R5 R6 R7 R9 R10
R2R1 R3 R4
R8

37 37 Cost Management & Review Corporate Strategy & Planning
CRM: Cost Analysis Jun’15 (ABP vs. Actual)
(27) 20 57
Prodn:
Cons. Cons Rate ABP 164
(Kg/t) (Kg/t) (Rs/kwh) Act. 151
ABP 1040 6.73 3.97 Gap (13)
Act. 1037 6.38 4.01
Impact (Rs/t) (61) (49) 5
Net Impact (Rs/t) 20
Yield Impact (23)
Overall Yield
ABP 95.58%
Act. 95.88% Rs/t
ABP 26785
Act. 25934
Var. (850)
81 (265) (13) (50) (33) (33)
Stores R&M Fuel &
GasesRolls
Packing &
DespatchOthers Rs cr
Rs/t Rs/t Rs/t Rs/t Rs/t Rs/t Rs/t
ABP 366 1164 343 155 400 215 20 ABP 5398
Act. 447 899 330 105 367 182 20 Act. 5183
Impact (Rs/t) 81 (265) (13) (50) (33) (33) 0.4 Var. (215)
Major Reasons in detail :
Cons (31)
R3 Lower volume impact Vol 216
Price/ Exp (400)
Total (215)
R11 Due to higher expenditure on account of GW Rs 24/t & Rs109/t due to lower volume
R5 Due to extra charging of Industrial Chemical caustic soda, being Rs39/t
Unplanned charging of Weblogic Licenses Rs12/t,
Clearing of old service bills, being Rs29/t
R6 Mech - R & M B scheme of SPM Gear Box of Rs 2.80 Crs not consumed due to delay in delivery
IEM - EDT upgrade material of Rs 3.66 Crs delivery delayed by 20 days. Will reach Jamshedpur by July
-753
CreditsRate
(Rs/t) Rs/t
Rate
(Rs/t)
146380
22
HR Zinc Power
142989
CRM Conversion Cost
Rs/t
(720) 57
(850)
CRM Works Cost
133
(27)
(215)
(720)
133
Cons
(kwh/t)
125
128
15
1206
1338
Fixed Cost
21387
20751 -696
(658)
R5 R6 R7 R8 R9
R2R1 R3 R4
R10 R11

38 38 Cost Management & Review Corporate Strategy & Planning
LD3 TSCR (Combined): Cost Analysis Jun’15 (ABP vs. Actual)
(129) ###
Scrap Credit Ferro Alloys Rolls Packing
Cons
(kg/thr)
Rate
(Rs/t)
Cons
(kg/thr)Rs/thr
Cons
(kg/thr)
Rate
(Rs/t)Rs/thr Rs/thr Prodn :
ABP 1146 13686 83 -731 10.46 132617 165 120 ABP 211
Act. 1137 13680 79 -477 10.44 123405 196 115 Act. 192
Impact (Rs/t) (122) (7) (43) (3) (96)
Net Impact (Rs/t) (129) 253 (100) 31 (5)
Yield Impact (2)
Rs/t
22520
22668
148
32 142 (74) 0 ### 188
Stores R&MFuel &
GasesOthers Fixed Cost
Cons
(kg/thr)
Rate
(Rs/t)Rs/thr Rs/thr Rs/thr
Cons
(kwh/thr)
Rate
(Rs/Mwh)Rs/thr Rs/thr Rs/t
ABP 6.12 79664 535 609 615 192 3,971 719 1334 8959
Act. 6.02 74516 567 751 541 201 4,014 611 1522 9171
Impact (Rs/t) (39) 32 142 (74) 45 (109) 188 213
Major Reasons in detail : Cons 63
Vol 208
Price (58)
Total 213
(88) (88)
HM+Scrap Lime
(45)
253
(88)
148
LD 3 TSCR Works
Cost
Rate
(Rs/t)
9950
9379
ABP
Act.
Var.
(39) 213
Act.
Var.
PowerRefractoriesLD 3 TSCR
Conversion Cost
ABP
R1 R4 R5 R6
R7 R8 R9 R10 R12 R13R11
R2 R3

39 39 Cost Management & Review Corporate Strategy & Planning
^
(ABP V ACT)
(Variance Rs./t 275 ADV)
-1 18 13 38
Plan
(Rs L)
Act
(Rs L)
Var
(Rs/t)
Plan
(Rs L)
Act
(Rs L)
Var
(Rs/t)
Plan
(Rs L)
Act
(Rs L)
Var
(Rs/t)
Plan
(Rs L)
Act
(Rs L)
Var
(Rs/t)
1161 1033 -1 3021 2437 18 482 269 13 1453 811 38
10 33 15 51
11 15 2 13
Rs/t -275
PLAN 1195
ACTUAL 1471
VARIANCE -275
30 -13 49 -410
Plan
(Rs L)
Act
(Rs L)
Var
(Rs/t)
Plan
(Rs L)
Act
(Rs L)
Var
(Rs/t)
Plan
(Rs L)
Act
(Rs L)
Var
(Rs/t)
Plan
(Rs L)
Act
(Rs L)
Var
(Rs/t)
1459 906 30 985 1023 -13 0 -606 49 8194 12258 -410 Expenditure 270
34 3 410 Volume 56
4 10 Change in WIP 49
Exp. Var. Exp. Var.
OMQ : Iron Ore Cost : June '15
Vol. Var.
Vol. Var.
Vol. Var.
Vol. Var.
Contracts & repairs Depreciation Change in WIP
Stores Power Others
Exp. Var. Exp. Var. Exp. Var. Exp. Var.
Wages
Vol. Var. Vol. Var.
Royalty, DMF & NMET
Exp. Var.
R1 R2 R3 R4
R5 R6 R7 R8
KPI Plan Act
Total Spend ( Rs Crs) 168 181
Total Despatch (LT) 14.02 12.32 *
* Lower despatches due to lower offtake of fines ore at JSR Works.

40 40 Cost Management & Review Corporate Strategy & Planning
^ ^
OMQ : Iron Ore Cost : June ’15 (ABP V
ACT)
(Variance : Rs. 275/T ADV)
R2: Stores (Rs 33/t F): Consumption lower than plan at Noamundi & Joda processing plant (P: Rs
14.91 Crs ,A: Rs.9.41 Crs)
R3: Power (Rs 15/t F): Consumption lower than plan at Noa processing plant (P: Rs 2.12 Crs , A:
Rs.1 .62Crs).
R4: Others (Rs 51/t F): Lower expenditure on GA/TM at OMQ (P: Rs 9 Crs, A: Rs. 5.8 Crs)
R5: Contracts & Repairs (Rs 34/t F): Lower spend by Noamundi & Joda processing plant & Mining
(P: Rs 10.26 Crs, A: Rs.5.20Crs) as the ordering is in process.
R7: Change in WIP (Rs 49/t F): Inventory impact by Rs. 6 Cr for increase in inventory due to lower
offtake of ore at Works.
R8: Royalty, DMF & NMET (Rs. 410 /t A) :
a. Royalty ( Rs. 92 /t F) : Decrease in IBM declared market rates for fines for mines in Orissa :
Plan : Lumps Rs 4932 /t, Fines Rs 2454 /t , Act : Lumps Rs 4001 /t, Fines Rs 2150/t &
Jharkhand : ABP: : Lumps Rs 4777 /t , Fines Rs 3259 /t, Actual : : Lumps Rs 3608 /t , Fines Rs
2643 /t
b. DMF & NMET (Rs. 502 /t A) : Provision taken for DMF@ 100% royalty and NMET @ 2% of royalty
as per new MMDR act of Rs 61.89 Crs is not in the plan.
Reasons for Expenditure Variance

41 41 Cost Management & Review Corporate Strategy & Planning
KPI Plan Act
Total Spend ( Rs Crs) 92.74 88.98
Total Despatch ( LT) 1.90 1.91
(ABP V ACT)
(Variance Rs./t 198 ADV)
2 -1 4 60
Plan
(Rs L)
Act
(Rs L)
Var
(Rs/t)
Plan
(Rs L)
Act
(Rs L)
Var
(Rs/t)
Plan
(Rs L)
Act
(Rs L)
Var
(Rs/t)
Plan
(Rs L)
Act
(Rs L)
Var
(Rs/t)
-34 -38 2 1663 1674 -1 111 104 4 847 737 60
2 4 58
1 0 1
-198
PLAN 2737
ACTUAL 2935
VARIANCE -198
-31 2 -9 -224
Plan
(Rs L)
Act
(Rs L)
Var
(Rs/t)
Plan
(Rs L)
Act
(Rs L)
Var
(Rs/t)
Plan
(Rs L)
Act
(Rs L)
Var
(Rs/t)
Plan
(Rs L)
Act
(Rs L)
Var
(Rs/t) Expenditure208
1615 1684 -31 471 470 2 130 148 -9 404 835 -224 Volume 9
36 2 10 SP sales 2
5 0 0
June '15West Bokaro : CC Cost :
Vol. Var. Vol. Var. Vol. Var.
Wages Govt. Levies Depreciation Royalty
Exp. Var. Exp. Var. Exp. Var.
Vol. Var. Vol. Var. Vol. Var.
Exp. Var.Exp. Var.Exp. Var.
Contracts & OthersPower (DVC)Stores & ContractsSecondary Product Sales
R1 R2 R3 R4
R5 R6 R7R8

42 42 Cost Management & Review Corporate Strategy & Planning
West Bokaro : CC Cost : June ’15 (ABP V ACT) (Variance : Rs. 198/T ADV) R4: Contract and others (Rs.58/t F ) : Lower spend than planned.
R5: Wages (Rs.36/t A), R7: Depreciation (Rs.10/t A) : Overall expenditure is within plan impact of
change in production mix of CC & Coal by-products on account of change is ash from 16% to 16.5%
and higher CC yield. (P 49% , A 60%)
R3: Royalty , DMF & NMET (Rs. 224/t A) : Royalty as per plan. Provision made for DMF@ 100%
royalty and NMET @ 2% of royalty as per new MMDR act of Rs 4.21 Crs (Rs 220/t CC) was not in
plan.
Reasons for Expenditure Variance
Royalty PLAN ACTUAL
Qty (LT) Rate
Amount
(Rs. Lakhs) Qty (LT) Rate
Amount
(Rs. Lakhs)
Clean Coal 1.90 209 397.46 1.91 207 395.8
Middlings 1.41 98 137.69 0.53 98 52.2
Tailings 0.60 301 180.60 0.00 0.0 0.0
Rejects 0.21 56 11.76 0.18 56 10.35
Total 727.51 458.38
Total Clean Coal Middling Tailing
Plan 100% 57% 28% 15%
Actual 100% 64% 25% 11%
Change in clean coal and by product mix +7% -3% -4%

43 43 Cost Management & Review Corporate Strategy & Planning
KPI Plan Act
Total Spend ( Rs Crs) 73 75
Total Despatch ( LT) 0.64 0.55
R9
R9: Lower CC volume due to lower RC production due to water seepage at 6&7 Pits colliery, adverse
geological condition at Digwadih.
June '15
(Variance Rs./t 3019 ADV)
-1214 -141 -40 -58
Plan
(Rs L)
Act
(Rs L)
Var
(Rs/t)
Plan
(Rs L)
Act
(Rs L)
Var
(Rs/t)
Plan
(Rs L)
Act
(Rs L)
Var
(Rs/t)
Plan
(Rs L)
Act
(Rs L)
Var
(Rs/t)
-1778 -851 -1214 600 591 -141 730 646 -40 115 130 -58
70 37 28
71 77 30
Rs./t -3019
PLAN 8458
ACTUAL 11477
VARIANCE -3019
22 34 -373 -1248
Plan
(Rs L)
Act
(Rs L)
Var
(Rs/t)
Plan
(Rs L)
Act
(Rs L)
Var
(Rs/t)
Plan
(Rs L)
Act
(Rs L)
Var
(Rs/t)
Plan
(Rs L)
Act
(Rs L)
Var
(Rs/t) Expenditure 621
-53 -58 22 725 601 34 3392 3106 -373 1722 2160 -1248 Volume 1206
72 430 1061 Stowing Asst. 22
38 803 187 SP sales 1214
Exp. Var. Exp. Var. Exp. Var.
(ABP V ACT)
Coal By- Prodn for sale Power Stores Depreciation
Jharia: CC Cost :
Vol. Var. Vol. Var.
Vol. Var. Vol. Var. Vol. Var.
Stowing Asst. Contract & Misc. Wages Others
Exp. Var. Exp. Var. Exp. Var.
Vol. Var.
R1 R2 R3 R4
R5 R6 R7 R8

44 44 Cost Management & Review Corporate Strategy & Planning
R1 : Coal By Product (Rs 1214/t A ) : Lower sale of by product due to non-availability of
permission from MOC, permission received and despatch started from 27.6.15.
R2 : Power : (Rs.70/t A) :
Higher purchase of power
due to shut down of
Captive power plant.
R3 : Stores : (Rs.37/t F): Lower spend than plan
R5 : Stowing Assistance (Rs 22/t F) : Due to higher stowing.
R6: Contract & Misc (Rs 72 /t A) : Slag worth Rs. 0.84 crs has been booked under C & H.
R7: Wages (Rs.430/t F) : : Impact of increment and DA increase not affected.( P : 94.72%, A 87.4%)
R8 : Others (Rs. 1061/t A) : Rs.184/ t A is on account of stock impact. : Provision made for DMF@
100% royalty and NMET @ 2% of royalty as per new MMDR act of Rs 3.12 Crs (Rs 593/t CC A) is
not in the plan and inventory impacts.
Reasons for Expenditure Variance
JHARIA : CC Cost : June ’ 15 (ABP V ACT) (Variance : Rs. 3019/T ADV)
PART. UoM ACTUAL PLAN
Captive Purchase Comb Captive Purchase Comb
UNIT LU 0.01 123.25 123.26 40.10 85.14 125.24
EXP Rs. L 2.59 616.60 619.19 137.26 478.20 615.46
T&D Exp Rs. L 5.38 26.42
CPU Rs/U 259 5 5.31 3.42 5.62 5.13

45 45 Cost Management & Review Corporate Strategy & Planning
Projection: Jul’15

46 Cost Management & Review Corporate Strategy & Planning
Overall production & KPI Proj. for CSI Area: Jul’15
ABP Projection Diff.
1. Production
Hot Metal Production KT 887 898 11
Sinter Production KT 699 689 (10)
Pellet KT 525 535 10
Coke Production KT 385 363 (22)
2. Major KPI's
Sinter % % 46% 46% 0%
Pellet % % 36% 36% 0%
Agglomerates % % 82% 82% 0%
Captive coal % % 35% 35% 0%
Coke Rate kg/thm 434 418 (17)
PCI Rate kg/thm 132 140 8
Fuel Rate kg/thm 566 557 (9)
Total Hot Metal Cost Rs/thm 13511 12960 (551)
UOMParticularsJul'15

47 Cost Management & Review Corporate Strategy & Planning
(Fig in KT) July’15 Production Projection :
Shortfall 0 to 2% in yellow and > 2% in red
KT KT KT
D 36 36 0
C 55 55 0
F 109 109 0
G 182 173 (9)
H 250 262 12
I 255 263 8
A-I BF 887 898 11
HM Pooling 11 10 (1)
BF (KT) Jul'15 ABP Jul'15 Proj. Var. Status
Jul'15 ABPJul'15
Proj.Var wrt ABP Status
Coke-Jsr (BF+Nut) 269 263 (6)
HMC(Screened) 116 100 (16)
Total Coke (BF+Nut) 385 363 (22)
Net Sinter 699 689 (10)
Pellet 525 535 10

48 Cost Management & Review Corporate Strategy & Planning
Fuel Rate: Jul’15 Projection (kg/thm)
BFce
Coke rate PCI+ Tar Fuel rate ABP Proj. ABP Proj. ABP Proj.
649 3 652 D 542 535 30 30 572 565
528 43 571 C 527 515 45 45 572 560
448 107 555 F 427 409 125 135 552 544
461 146 607 G 430 413 145 150 575 563
454 145 599 H 425 403 145 160 570 563
440 129 569 I 415 402 145 150 560 552
459 126 585 A-I 434 418 132 140 566 558
PCI Rate - July'15 Fuel Rate - July'15ACT – July’14 Coke Rate - July'15

49 Cost Management & Review Corporate Strategy & Planning
LD1: Cost & KPI (Projection) LD#1 - BILLET Jul'15 Aug'15 Sep'15
A-June'15 Jun-15 Particulars UOM ABP Projn.
Impact ABP vs Proj. (Rs/t)
ABP Projn.
ABP Projn.
Total w.r.to
consn.
w.r. to
Price
801 268 Prodn from LD#1 LS kT 284 284 284 284 245 245
12 3 Prodn from LD#3 LS kT 0 0 0 0 2 2
813 271 Total Billet Prodn. kT 284 284 284 284 247 247
1045 1043 Hot Metal kg/t 1040 1040 (573) 0 (573) 1028 1028 1041 1041
54 54 Scrap kg/t 65 65 0 0 0 77 77 65 65
1099 1097 HM+Scrap kg/t 1105 1105 1105 1105 1105 1105
(501) (510) Scrap Credit Rs/t (590) (500) 90 90 (590) (500) (588) (500)
75.3 71.0 Lime kg/t 76 74 (17) (17) (0) 76 75 76 75
19.5 19.4 Fe. Alloys. kg/t 20.0 20.0 27 0 27 20.0 20.0 20.0 20.0
0.81 0.80 DS Comp. kg/t 1.10 0.85 (10) (10) 0 1.10 0.90 1.10 0.90
0.150 0.131 Fuel Gcal/t 0.173 0.150 (46) (48) 2 0.173 0.150 0.173 0.149
92 94 Power kWh/t 94 93 (4) (4) 0 94 94 99 99
290 262 Stores Rs/t 329 300 (28) 329 295 329 320
180 159 R&M Rs/t 233 233 0 208 208 335 335
7.25 6.42 Refractory Kg/t 6.70 6.70 0 - 0 6.80 6.80 9.40 9.40
356 353 Labour Rs/t 348 348 0 348 348 399 399
200 202 Depreciation Rs/t 191 191 0 191 191 219 219
139 173 GW/ Town Medical/ LTC Rs/t 154 154 0 154 154 177 177
444 423 Others Rs/t 357 357 0 337 337 376 376
5596 5418 Conversion Cost (HM to
Billet) Rs/t 5783 5768 (15) 5773 5783 6286 6330

50 Cost Management & Review Corporate Strategy & Planning
LD2: Cost & KPI (Projection)
ABP Projection
Total Cons./Vol Price/mix
927 Production kT 329 347 360 360 328 328
1119 HM+ Scrap kg/t 1109 1109 (29) 0 (29) 1109 1109 1109 1109
(498) Scrap Credit Rs/t (442) (442) 0 0 0 (442) (442) (442) (442)
47 Iron Ore kg/t 56 56 0 0 0 56 56 56 56
69 Lime kg/t 71 69 (26) (20) (6) 71 69 71 69
8.97 Fe. Alloys. kg/t 10.18 9.50 (191) (85) (105) 10.18 9.50 10.18 9.50
2.95 DS Comp. kg/t 3.09 2.95 (16) (8) (8) 3.09 2.95 3.09 2.95
14 Dolomite kg/t 18 15 (6) (6) 0 18 18 18 18
347 Fuel & Gases Rs/t 376 364 (12) (12) 343 343 379 379
63 Power kWh/t 60 60 0 0 0 55 55 60 60
216 Stores Rs/t 207 190 (17) (10) (7) 207 207 207 207
235 Repairs & Maint. Rs/t 173 164 (9) (9) (0) 197 197 246 246
5.85 Refractory kg/tcs 7.29 6.74 (43) (43) 0 5.7 5.7 7.29 7.29
314 Labour Rs/t 299 284 (16) (16) 0 273 273 300 300
180 Depreciation Rs/t 179 170 (9) (9) 0 164 164 180 180
121 GW/ Town Medical
/ LTCRs/t 130 93 (36) (5) (31) 119 93 130 94
35 Utilities Rs/t 32 32 0 (2) 2 32 32 32 32
62 Shared Services Rs/t 55 55 0 (3) 3 55 55 55 55
0 Technical Cons Rs/t 5 5 0 (0) 0 5 5 5 5
2 IT EXP Rs/t 5 5 0 (0) 0 5 5 5 5
0 LD 3 Adj Rs/t 0 0 0 0 0 0 0 0 0
64Carriage & Handling Rs/t 78 65 (13) (4) (10) 78 78 78 78
71 Others Rs/t 74 74 0 (4) 4 74 74 74 74
5669Conversion Cost
(HM to Slab)Rs/t 5939 5517 (422) (224) (198) 5797 5513 6012 5749
LD#2 & SC Sep-15
ProjectionABP
Jul-15
Projection
Aug-15
Impact ABP vs Projn. (Rs/t)YTD
June 15Particulars UOM ABP

51 Cost Management & Review Corporate Strategy & Planning
LD3: Cost & KPI (Projection) LD#3 TSC
Total Cons./Vol Price/mix
605 Production kT 231 231 226 226 224 224
1100 HM+ Scrap kg/t 1118 1110 (161) (114) (47) 1118 1110 1,118 1,110
(446) Scrap Credit Rs/t (599) (599) 0 0 0 (599) (599) (599) (599)
44 Iron Ore kg/t 55 55 0 0 0 55 55 55 55
76 Lime kg/t 77 76 (21) (5) (16) 81 76 77 76
10.09 Fe. Alloys. kg/t 10.21 10.00 (109) (27) (82) 10.21 10.00 10.21 10.00
2.39 DS Comp. kg/t 2.80 2.39 (23) (23) 0 2.80 2.39 2.80 2.39
8 Dolomite kg/t 18 15 (7) (7) 0 18 18 18 18
318 Fuel & Gases Rs/t 337 337 0 0 305 305 340 340
79 Power kWh/t 75 75 0 0 0 75 75 75 75
348 Stores Rs/t 420 350 (70) 0 (70) 420 350 420 420
364 Repairs & Maint. Rs/t 332 318 (14) 0 (14) 282 386 314 283
6.61 Refractory kg/tcs 5.97 5.97 0 0 0 5.97 5.97 5.97 5.97
137 Labour Rs/t 111 111 0 0 0 114 114 115 115
484 Depreciation Rs/t 422 422 0 0 0 432 432 435 435
97GW/ Town Medical/ LTC Rs/t 77 62 (15) 0 (15) 79 62 80 62
1 Utilities Rs/t 15 0 (15) 0 (15) 15 0 15 -
71 Shared Services Rs/t 52 45 (7) 0 (7) 52 45 52 45
1 IT Exp Rs/t 7 7 0 0 0 7 7 7 7
96 Carriage & Handling Rs/t 118 100 (18) 0 (18) 118 100 118 100
95 Others Rs/t 129 90 (39) 0 (39) 129 90 129 90
6135Conversion Cost
(HM to Slab)Rs/t 6373 5874 (498) (176) (322) 6416 6011 6373 5950
Jul-15 Aug-15 Sep-15
YTD
June 15Particulars UOM ABP Projection ABP Projection ABP Projection
Impact ABP vs Projn. (Rs/t)

52 Cost Management & Review Corporate Strategy & Planning
WRM: Cost & KPI (Projection)
WRM(E) Jul'15 Aug'15 Sep'15
A-June'15 Jun-15 Particulars UOM ABP Projn.
Impact ABP vs Proj.
(Rs/t) ABP Projn. ABP Projn.
Total w.r.to
consn.
w.r. to
Price
106 34 Production kT 28.0 37.0 38.0 38.0 36.0 36.0
97.38% 97.52% Yield % 97.20% 97.50% 0 0 0 97.52% 97.50% 97.52% 97.50%
(456) (447) Scrap Credit Rs/t (425) (450) (25) (425) (425) (425) (428)
0.194 0.196 Fuel Gcal/t 0.190 0.190 0 0 0 0.190 0.190 1.837 1.837
121 121 Power kWh/t 140 121 (76) (76) 0 121 121 121 121
65 66 Rolls Rs/t 65 65 0 65 65 65 65
267 279 Stores Rs/t 290 285 (5) 290 280 290 290
455 375 R&M Rs/t 850 568 (282) 429 471 506 519
0 0 Refractory Rs/t 107 0 (107) 0 0 0 0
885 912 Labour Rs/t 1132 857 (275) 834 834 881 881
40 42 Depreciation Rs/t 50 38 (12) 37 37 39 39
211 265 GW/ Town Medical/
LTC Rs/t 295 223 (72) 217 217 229 229
374 417 Others Rs/t 476 360 (116) 350 350 370 370
3116 3164 Conversion Cost Rs/t 4335 3285 (1050) 3156 3178 3316 3332

53 Cost Management & Review Corporate Strategy & Planning
MM: Cost & KPI (Projection)
MM Jul'15 Aug'15 Sep'15
A-June'15 Jun-15 Particulars UOM ABP Projn.
Impact ABP vs Proj.
(Rs/t) ABP Projn. ABP Projn.
Total w.r.to
consn.
w.r. to
Price
109.3 37.7 Production kt 36.5 37.0 37 37 35 35
97.26% 97.27% Yield % 97.26% 97.26% 0 (0) 0 97.26% 97.26% 97.26% 97.26%
(413) (391) Scrap Credit Rs/t (418) (450) (33) (418) (450) (418) (450)
0.309 0.309 Fuel Gcal/t 0.310 0.310 0 0 0 0.310 0.310 0.310 0.310
65 45 Power kWh/t 60 60 0 0 0 60 60 61 61
56 58 Rolls Rs/t 50 50 0 55 55 60 55
152 103 Stores Rs/t 165 150 (15) 165 150 165 150
335 322 R&M Rs/t 367 362 (5) 466 540 801 789
0 0 Refractory Cost Rs/t 0 0 0 0 0 0 0
728 709 Labour Rs/t 745 735 (10) 745 745 775 775
6 7 Depreciation Rs/t 5 5 (0) 5 5 5 5
142 158 GW/ Town Medical/
LTC Rs/t 165 163 (2) 165 165 172 172
320 312 Others Rs/t 287 283 (4) 287 287 299 299
2542 2407 Conversion Cost Rs/t 2675 2590 (85) 2795 2807 3186 3124

54 Cost Management & Review Corporate Strategy & Planning
NBM: Cost & KPI (Projection) NBM Jul'15 Aug'15 Sep'15
A-June'15 Jun-15 Particulars UOM ABP Projn.
Impact ABP vs Proj.
(Rs/t) ABP Projn. ABP Projn.
Total w.r.to
consn.
w.r. to
Price
230 75 Production kt 78 53 78 78 75 75
96.60% 96.60% Yield % 96.60% 96.60% 0 0 0 96.60% 96.60% 96.60% 96.60%
(405) (390) Scrap Credit Rs/t (404) (404) (0) (404) (404) (404) (404)
0.222 0.222 Fuel Gcal/t 0.220 0.225 9 9 (0) 0.220 0.220 0.220 0.220
93 93 Power kWh/t 95 105 40 40 0 95 95 95 95
38 34 Rolls Rs/t 50 50 0 50 50 50 50
122 174 Stores Rs/t 176 215 39 176 192 176 176
232 253 R&M Rs/t 463 906 443 206 226 200 200
0 0 Refractory Rs/t 0 250 250 0 0 0 0
214 219 Labour Rs/t 204 300 96 204 204 212 212
173 176 Depreciation Rs/t 171 251 81 171 171 178 178
64 83 GW/ Town Medical/
LTC Rs/t 71 105 34 71 71 74 74
184 180 Others Rs/t 160 235 75 160 160 166 140
1948 2068 Conversion Cost Rs/t 2315 3361 1046 2072 2089 2090 2066

55 Cost Management & Review Corporate Strategy & Planning
HSM: Cost & KPI (Projection) HSM
ABP Projection
Total Impact Cons./Vol Price/mix
863 Production kT 255 290 361 327 351 350
98.19% Yield % 98.20% 98.20% -18 0 -18 98.20% 98.20% 98.20% 98.20%
(222) Scrap Credit Rs/t (215) (215) 0 0 0 (215) (215) (241) (241)
0.282 Fuel & Gases Gcal/t 0.300 0.300 0 0 0 0.275 0.275 0.275 0.275
89 Power kWh/t 90 90 0 0 0 85 85 85 85
23 Utilities Rs/t 20 20 0 -3 3 20 20 20 20
76 Stores Rs/t 166 166 0 0 0 87 87 81 81
267 Repair & Maint. Rs/t 370 325 -45 -45 0 230 254 212 213
66Rolls Cost Rs/t 131 131 0 -18 18 173 173 95 95
59 Packing Cost Rs/t 78 78 0 -11 11 78 78 78 78
260 Labour Rs/t 298 262 -36 -36 0 209 231 215 216
176 Depreciation Rs/t 203 178 -24 -24 0 143 158 147 148
46 GW/ Town Medical
/ LTCRs/t 71 62 -9 -9 0 50 55 51 52
48 Shared Services Rs/t 37 37 0 -5 5 37 37 37 37
12 Insurance Rs/t 12 11 -1 -1 0 12 13 12 12
0 Technical Cons Rs/t 7 6 -1 -1 0 5 5 5 5
3 IT Expenses Rs/t 11 10 -1 -1 0 8 8 8 8
56 Other Expenses Rs/t 77 50 -27 -7 -20 77 50 77 50
1891 Conversion Cost Rs/t 2283 2121 -162 -161 -1 1918 1944 1823 1793
Aug-15
ProjectionABP
Sep-15
YTD
June 15ABPParticulars
Jul-15
RemarksProjectionImpact ABP vs Projn. (Rs/t)
UOM

56 Cost Management & Review Corporate Strategy & Planning
TSC Rolling: Cost & KPI (Projection)
Rolling Mill
ABP Projection
Total Impact Cons./Vol Price/mix
591 Production kT 225 225 220 220 218 220
97.62% Yield % 97.53% 97.53% (27) 0 (27) 97.53% 97.53% 97.53% 97.53%
(103) Scrap Credit Rs/t (117) (117) 0 0 0 (117) (117) (117) (117)
0.189 Fuel & Gases Gcal/t 0.186 0.190 (19) 5 (24) 0.190 0.190 0.192 0.190
115 Power kWh/t 109 109 (10) 0 (10) 113 113 114 114
76 Utilities Rs/t 5 0 0 0 0 5 0 5 0
76 Stores Rs/t 98 90 (8) 0 (8) 100 90 101 90
286 Repair & Maint. Rs/t 287 256 (31) 0 (31) 221 388 251 205
164Rolls Cost Rs/t 165 145 -20 0 -20 165 145 165 145
120 Packing Cost Rs/t 120 120 0 0 0 120 120 120 120
0 Labour Rs/t 69 69 0 0 0 70 70 71 71
604 Depreciation Rs/t 523 523 0 0 0 534 535 539 539
16GW/ Town Medical/ LTC Rs/t 33 33 0 0 0 34 34 34 34
28 Shared Services Rs/t 28 28 0 0 0 28 28 28 28
0 Insurance Rs/t 5 3 -2 0 -2 5 3 5 3
3 IT Rs/t 6 6 0 0 0 6 6 6 6
61 Other Expenses Rs/t 54 54 0 0 0 54 54 54 54
2496 Conversion Cost Rs/t 2469 2348 (121) 6 (122) 2451 2526 2480 2354
Jul-15 Aug-15 Sep-15
ABP ProjectionYTD
June 15Particulars UOM ABP Projection
Impact ABP vs Projn. (Rs/t)Remarks

57 Cost Management & Review Corporate Strategy & Planning
CRM: Cost & KPI (Projection) CRM Jul-15 Aug-15 Sep-15
YTD
June 15 Particulars UOM ABP
Projectio
n
Impact ABP vs Projn. (Rs/t) Re
mar
ks
ABP Projectio
n
ABP Projectio
n Total Impact
Due to
Cons./Vol
Due to
Price/mix
453 Production kT 16 89 156 95 166 166
95.75% Overall Yield % 95.51% 95.51%
95.51
% 95.51%
95.51
% 95.51%
1038 HR Consumption Kg/t 1039 1034 (155) (116) (39) 1041 1039 1039 1039
(720) Scrap Credit Rs/t (714) (557) 157 157 0 (775) (738) (748) (748)
6.25 Zinc Kg/t 1.32 6.60 780 711 69 6.11 6.25 6.65 6.65
347 Fuel & Gases Rs/t 462 351 0 0 0 352 434 353 353
127 Power kWh/t 177 150 (106) (106) 0 129 150 129 129
389 Stores Rs/t 2331 749 (1582) (3280) 1698 433 958 377 519
621 Repair & Maint. Rs/t 6429 1826 (4602) (7998) 3396 606 993 504 504
89 Rolls Cost Rs/t 203 39 -163 (172) 9 131 84 108 48
361 Packing & Despatch Rs/t 400 360 (40) 0 (40) 400 360 400 360
518 Labour Rs/t 4626 860 (3766) (3766) 0 490 803 460 460
625 Depreciation Rs/t 5798 1078 (4720) (4720) 0 617 1011 580 580
151 GW/ Town Medical
/ LTC Rs/t 1606 299 (1307) (1307) 0 170 279 160 160
36 Utilities Rs/t 264 264 0 (1156) 1156 36 36 36 36
45 Shared Services Rs/t 296 55 (241) (241) 0 41 67 41 41
19 Insurance Rs/t 160 30 (130) (130) 0 22 36 22 22
4 Consultancy charge Rs/t 51 51 0 (221) 221 5 5 5 5
9 IT Exp Rs/t 109 20 (89) (89) 0 12 19 11 11
71 Other Exp Rs/t 727 135 (592) (592) 0 100 164 100 100
4780 Conversion Cost Rs/t 24489 7820 (16669) (23028) 6470 4911 6822 4715 4746

58
Cost Management & Review - CS&P
58 Cost Management & Review Corporate Strategy & Planning
R1: LD2 : Crane girder repairing, product mix & Power dip : (9 kt)
WOI : F fce -Tuyere burning due to material defect & lower agglomerate : (3kt)
: H fce -Sinter & Pellet plant shutdown & high moisture coke : (4 kt)
: I fce -Ore feeder jammed,O2 reduce due to unavailability of Ore, Sinter & SFC tripped : (2kt)
R2: LD2 : Breakout in caster 1 & 2 , caster 1 cap off due to slide gate plate leakage & LF2 roof jam stuck up : (7kt)
WOI : H fce –Replacement of HBF tuyere cooler as burnt in contact with molten hot metal : (8 kt)
I fce - OWH1 gate feedback fault:
R3: LD1 : Turn over cooling bed failure : (0.4kt)
LD2 : SEN choke, caster3 hydraulic fail, vessel 2 tilt drive break down & mould control fail (6kt)
WOI : H fce - Power dip (3rd Jun’15) due to external power failure : (5 kt)
R4: LD1 : Turn over cooling bed & secondary cooling failure in caster 2 : (1kt)
LD2 : Flair stack issue, C1 machine restriction, Vsl 3 hood leakage, caster 1 break out & C2 TCM problem : (8 kt)
Loss of Crude Steel Production (kt) : Jun’15 Total loss LD1 & LD2 : 53 kt , Outage : Iron making (WOI) 22 kt & Steel making 31 kt)
18
15
11 9
34%
62%
84%
100%
0%
20%
40%
60%
80%
100%
120%
0
2
4
6
8
10
12
14
16
18
20
R1Others
R2Operation
R3Electrical
R4Mechanical
Loss (KT) Percentage
LD1 LD2 LD3 Total
ABP 274 349 216 839
MBP 274 354 194 822
Actual 271 305 196 771
Gap wrt ABP -4 -44 -20 -68
Gap wrt MBP -4 -49 2 -51
Crude steel prodn.(kt)
BF : F BF : H BF : I Other BF Total
ABP 121 256 256 262 895
MBP 121 256 226 262 865
Actual 115 224 221 275 835
Gap wrt ABP -6 -32 -35 13 -60
Gap wrt MBP -6 -32 -5 13 -30
Furnace wise HM prodn.(kt)

59
Cost Management & Review - CS&P
59 Cost Management & Review Corporate Strategy & Planning
Opportunity Loss ( Rs. Crs) : Jun’15
SL no.Impact
(Rs. Crs)Remarks
1 Cost of Break downs/Instability:
1.R1 Cost of break down at LD Shops . 47
Impact of plant outage- Total Crude Steel production loss
(plant outage/Process disturbance) : 53 kt
Less HM pooling : 22kt
1.R2Loss of production at Sinter plant &
Pellet Plant2
1) SP2 - Breakdown in combustion air fan, conveyor belt failure
& high number of interruptions (8kt)
2) SP4 - Receiving belt, Sinter Cooler breakdown, extension &
boulder formation & high return fines (13kt)
3) Pellet Plant - Voltage dip (3rd Jun’15), gas shortage & dryer
#1 discharge belt failure (17kt)
1.R3 Demurrage Charges 16 Vessel: Rs. 10.03 crs; Rail: Rs. 3.09 crs; EOL Rs.3.03 Crs
Sub total 65
2 Less availability of Captive Raw Materials:
Sub Total 49
Total 114
2.R4 Iron ore shortage/ Mine Closure 49i. Usage of Bought Out Metallic (Ore : 104 kt, pellet : Nil).
ii. Fixed Cost impact of Khond bond closure

60
Cost Management & Review - CS&P
60 Cost Management & Review Corporate Strategy & Planning
Loss of Crude Steel Production (kt) : A-Jun’15
28
25
16 15
34%
63%
82%
100%
0%
20%
40%
60%
80%
100%
120%
0.0
5.0
10.0
15.0
20.0
25.0
30.0
R1Operation
R2Others
R3Mechanical
R4Electrical
Loss (KT) Percentage
LD1 LD2 LD3 Total
ABP 811 1019 600 2430
MBP 831 1024 578 2433
Actual 813 927 605 2345
Gap wrt ABP 2 -92 5 -84
Gap wrt MBP -18 -97 27 -88
Crude steel prodn.(kt)
BF : C-F BF : G BF : H BF : I Total
ABP 636 523 765 730 2655
MBP 636 523 765 730 2654
Actual 637 512 715 724 2588
Gap wrt ABP 1 -11 -50 -6 -67
Gap wrt MBP 1 -11 -50 -6 -67
Furnace wise HM prodn.(kt)

61
Cost Management & Review - CS&P
61 Cost Management & Review Corporate Strategy & Planning
Reason for cost increase: May vs June’15
May'15 June'15 Gap
Description Prod (KT)
Cost (Rs./t)
Prod (KT)
Cost (Rs./t)
Prod (KT)
Cost (Rs./t)
HM 891 12799 835 13497 -56 698
WSS 725 21494 786 22031 61 537
Description UoM May'15 June'15 Gap Impact (Rs./t)
Reason
Agglomerates % 81 77 -4 218
Pellet MSD SP#3 B/D
Coke Rate Kg/thm 401 413 12 Lower Agglomerates
Maintenance & Flux Rs./thm 133 MSD at Pellet, LD#3, CRM etc.
Higher captive ore cost Rs./thm 163 Lower production (Impact on Fixed Cost)
Rs./thm 184 HM production is lower by 56 KT (6%)
Sub Total Rs./thm 698
Mix Impact Rs./tss -140 Usage of slab and billet from stock produced in May'15 at lower rates.
Others Rs./tss -21 Total Rs./tss 537

62
Cost Management & Review - CS&P
62 Cost Management & Review Corporate Strategy & Planning
Hot Metal Cost variation : Jun’15(Proj.) vs Jun’15 (Act): (Rs./thm)
R1: Higher fuel rate by 5 kg/thm (Proj : 560 kg/thm, Act: 565 kg/thm)
R2: Higher conversion cost due to lower production (Proj : 850 kt, Act : 835 kt)
R3: Higher iron ore cost (Proj : Rs. 2107/t, Act : Rs. 2340/t)
R4: Higher flux consumption (Proj : 190/thm, Act : 221/thm)
R5: Cost reduction ideas envisaged was lower than plan.
AB
P
Cost is higher by Rs. 294/thm
Hig
her
Fu
el R
ate
Hig
her
iro
n o
re c
ost
MA
Y’1
5
13203 77
70 57 45 44 13497
R1 R2 R3 R4 R5
Low
er P
rod
uct
ion
Jun
’15
(P
roj)
Jun
’15
(A
ct)
Hig
her
flu
x u
sage
Oth
ers

63
Cost Management & Review - CS&P
63 Cost Management & Review Corporate Strategy & Planning
Q1 vs Q2: RM & CSI KPIs
Q4 FY15
Particulars UOM
Q1 FY16 Q2 FY16 H1 FY16 Q2 vs
Q1
Actual ABP Exp. Gap ABP Exp. Gap ABP Exp. Gap Gap w.r.t
Q1
82 Agglomerate % 83 81 -2.0 83 83 0.0 83 82 -1.0 2.0
16 Coke Ash % 15.9 16 0.1 15.8 16.4 0.6 15.8 16.2 0.4 0.4
410 Coke Rate Kg/thm 427 408 -19.0 434 418 -16.0 431 413 -18.0 10.0
135 PCI Rate Kg/thm 132 145 13.0 131 143 12.0 132 144 12.0 -2.0
544 Fuel Rate Kg/thm 559 553 -6.0 565 561 -4.0 563 557 -6.0 8.0
457 Carbon Rate Kg/thm 470 465 -5.0 475 471 -4.0 473 468 -5.0 6.0
634 WB Production KT 570 596 26.0 430 451 21.0 1000 1040 40.0 -145.0
213 Jharia KT 272 248 -24.0 275 277 2.0 547 525 -22.0 29.0
36 Captive Coal % 34 36 2.0 34 34 0.0 34 35 1.0 -2.0
64
Cost Management & Review - CS&P
64 Cost Management & Review Corporate Strategy & Planning
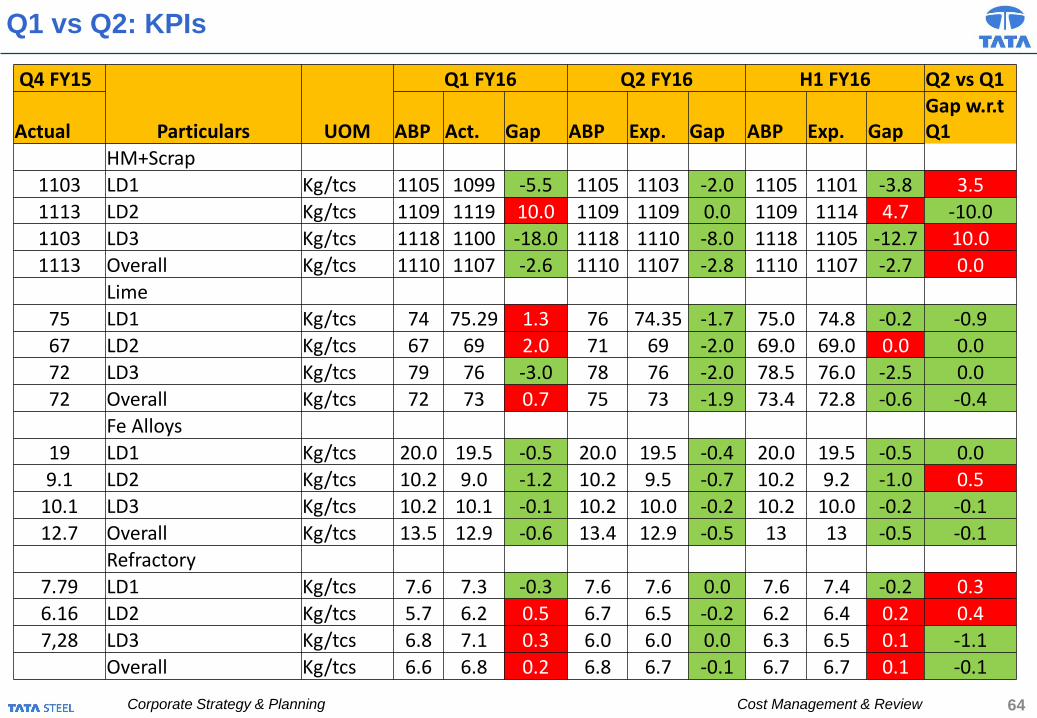
Q1 vs Q2: KPIs
Q4 FY15
Particulars UOM
Q1 FY16 Q2 FY16 H1 FY16 Q2 vs Q1
Actual ABP Act. Gap ABP Exp. Gap ABP Exp. Gap Gap w.r.t Q1
HM+Scrap
1103 LD1 Kg/tcs 1105 1099 -5.5 1105 1103 -2.0 1105 1101 -3.8 3.5
1113 LD2 Kg/tcs 1109 1119 10.0 1109 1109 0.0 1109 1114 4.7 -10.0
1103 LD3 Kg/tcs 1118 1100 -18.0 1118 1110 -8.0 1118 1105 -12.7 10.0
1113 Overall Kg/tcs 1110 1107 -2.6 1110 1107 -2.8 1110 1107 -2.7 0.0
Lime
75 LD1 Kg/tcs 74 75.29 1.3 76 74.35 -1.7 75.0 74.8 -0.2 -0.9
67 LD2 Kg/tcs 67 69 2.0 71 69 -2.0 69.0 69.0 0.0 0.0
72 LD3 Kg/tcs 79 76 -3.0 78 76 -2.0 78.5 76.0 -2.5 0.0
72 Overall Kg/tcs 72 73 0.7 75 73 -1.9 73.4 72.8 -0.6 -0.4
Fe Alloys
19 LD1 Kg/tcs 20.0 19.5 -0.5 20.0 19.5 -0.4 20.0 19.5 -0.5 0.0
9.1 LD2 Kg/tcs 10.2 9.0 -1.2 10.2 9.5 -0.7 10.2 9.2 -1.0 0.5
10.1 LD3 Kg/tcs 10.2 10.1 -0.1 10.2 10.0 -0.2 10.2 10.0 -0.2 -0.1
12.7 Overall Kg/tcs 13.5 12.9 -0.6 13.4 12.9 -0.5 13 13 -0.5 -0.1
Refractory
7.79 LD1 Kg/tcs 7.6 7.3 -0.3 7.6 7.6 0.0 7.6 7.4 -0.2 0.3
6.16 LD2 Kg/tcs 5.7 6.2 0.5 6.7 6.5 -0.2 6.2 6.4 0.2 0.4
7,28 LD3 Kg/tcs 6.8 7.1 0.3 6.0 6.0 0.0 6.3 6.5 0.1 -1.1
Overall Kg/tcs 6.6 6.8 0.2 6.8 6.7 -0.1 6.7 6.7 0.1 -0.1

65
Cost Management & Review - CS&P
65 Cost Management & Review Corporate Strategy & Planning 65 Cost Management & Review Corporate Strategy & Planning
Production & Cost Performance: Q1 vs. Q2 FY16
Particulars Q1 FY'16 Act Q2 FY'16 Act. Var. (Q2 over Q1)
Prodn Kt
Cost Rs/t
Prodn Kt
Cost Rs/t
Prodn Kt
Cost Rs/t
Iron Making
Hot Metal 2588 13228 2661 13120 73 -108
Steel Making Production & Conversion Cost
LD1- Billet 813 5596 815 5854 2 258
LD2- Slab 927 5669 1035 5590 108 -79
LD3- Slab 605 6135 681 5945 76 -190
Crude Steel 2345 19025 2531 19060 186 35
WRM 106 3116 111 3257 5 141
MM 109 2542 109 2833 0 291
NBM 230 1948 206 2405 -24 457
HSM - HR (Gross) 863 1891 967 1943 104 52
TSCR - HR (Gross) 591 2496 664 2409 73 -87
CRM 453 4780 329 6429 -124 1649
LP Saleable 796 19863 801 20517 5 654
FP Saleable 1432 22388 1610 22309 178 -79
WSS 2228 21817 2411 21714 183 -103
* Includes DMF impact from Apr'15 onwards

66
Cost Management & Review - CS&P
66 Cost Management & Review Corporate Strategy & Planning 66 Cost Management & Review Corporate Strategy & Planning
Production & Cost Performance: Q1 FY16 (ABP vs. Act)
Particulars Q1 FY'16 ABP Q1 FY'16 Act. Var. (Act over ABP)
Prodn Kt
Cost Rs/t
Prodn Kt
Cost Rs/t
Prodn Kt
Cost Rs/t
Raw Materials
Iron Making
Hot Metal 2655 13704 2588 13228 -67 -476
Steel Making Production & Conversion Cost
LD1- Billet 811 5957 813 5596 2 -361
LD2- Slab 1019 5742 927 5669 -92 -73
LD3- Slab 600 6646 605 6135 5 -511
Crude Steel 2430 19739 2345 19025 -85 -714
WRM 106 3505 106 3116 0 -389
MM 107 2673 109 2542 2 -131
NBM 205 2365 230 1948 25 -417
HSM - HR (Gross) 1007 1918 863 1891 -144 -27
TSCR - HR (Gross) 585 2743 591 2496 6 -247
CRM 496 4925 453 4780 -43 -145
LP Saleable 798 21091 796 19863 -2 -1228
FP Saleable 1574 23552 1432 22388 -142 -1164
WSS * 2372 22724 2228 21817 -144 -907
* Includes DMF impact from Apr'15 onwards