· 2 annual consumer inflation rate for september 1999 was 9.3%, 0.3 percentage points higher than...
TRANSCRIPT

1
������������ �����������
� � � � � � � � � � � � � � � � � � � �

2
�������������� �����������������
✠ Annual consumer inflation rate for September 1999 was 9.3%, 0.3 percentage points
higher than at the end of the second quarter (9.0%) but 8.5 percentage points lower than in
September 1998. The annual producer inflation rate was 10.9%, about five percentage points
higher than at the end of the second quarter.
✠ Since February 1999, inflation has presented a significant decline of 8.5 percentage points,
bringing the annual rate down to one-digit levels for five consecutive months. This reduction
was the outcome of lower price increases across all groups in the CPI basket of goods and
services. The largest declines were in food (with the annual rate of price increase falling from
20.3% in September 1998 to 4.2% a year later), education (from 18.4% to 8.9%), and housing
(from 15.6% to 8.6%). As in the previous quarter, all groups of the alternate classification
(tradable, indexed, flexible and cyclical items) contributed to lower inflation. The greatest
downward pressure on prices came from nontradable component’s, accounting for 70% of the
fall. This performance resulted from slower growth in demand, a favorable cycle of meat
prices, lower dwelling rents, and an abundant supply of root crops.
✠ On an annual basis, higher-than-average price increases were registered in sundry
expenditures (18.9%), transport (18.9%), and health care (15.7%). These groups were particularly
affected by the imposition of VAT, in the case of sundry expenditures (toiletries); higher world
oil prices, in the case of transport; and devaluation, in the case of health care (drugs). Lower-
than-average growth was seen in food (4.2%), clothing (4.4%), housing (8.6%), and education
(8.9%). In the alternate Consumer Price Index classification, higher-than-average inflation
was displayed only by tradables (10.2%) and indexed items (11.7%).
✠ According to the recent performance of core-inflation indicators, the small increase in
headline inflation since the beginning of the third quarter (from 8.8% in July to 9.3% in
September) was not the result of demand pressures. In fact, the average of the four underlying-
inflation indicators continued to fall, from 11.5% in June to 10.0% in September.
✠ Industrial-wage increases averaged 16.3% in July, slightly under the average registered
three months earlier (17.2%) and nearly three percentage points lower than in December 1998.
It should be pointed out, however, that in the past two months the rate of wage increases has

3
remained steady at around 15.5%, not far from the rates set in collective bargaining agreements
at the end of 1998. This is likely due to the relative downward inflexibility of industrial-pay
adjustments in Colombia in the medium term, a factor that has resulted in considerable growth
in real wages during 1999.
✠ According to Banco de la Repúbica’s expectations survey, inflationary expectations
continued to decline over the past quarter, following the trend started at the beginning of the
year. Expectations for December were 1.3 percentage points lower than in June. Agents currently
expect an average inflation of 12.2% by the end of 1999. For December 2000 they expect an
inflation of 11.3%, in contrast to the March survey’s figure of 12.2%. It is necessary to bear in
mind, however, that the Banco de la República’s expectations surveys have systematically
overestimated future inflation by about 2 percentage points.
✠ Indicators such as electricity consumption (to September), the financial sector’s nominal
and real portfolio performance (to September), and credit cards sales (to August) show no clear
reversal in the economy’s declining trends. Moreover, uncertainty in recent months about the legal
basis of housing financing schemes is likely to delay recovery in the critical construction sector.
✠ However, some signs of potential recovery continue to surface, such as increased orders
in industry and reductions in stocks of finished goods. In addition, there have been indications
lately, particularly in July and August, that nontraditional exports might present a more promising
performance towards the end of the year, benefiting especially from the peso’s real devaluation
in recent years and from faster growth in external demand. Based on this evidence, the economy
should show some signs of recovery by the end of the year. Never the less, demand is hardly
likely to cause any serious inflationary pressures.
✠ Forecasts derived from ARIMA models indicate that by December 1999 inflation will be
between 8.1% and 12%. The point forecast made with figures to September is lower than the
one registered a month earlier (10.8%). In addition, underlying inflation is expected to run
between 8.2% and 10.2% in December, below the 1999 inflation target.
✠ Forecasts derived from structural models confirm that inflation will remain at low levels
until the end of the year. The combination of forecasts yields an inflation of 9.8% for 1999,
10.4% for June 2000, and 9.8% for September 2000. These results bear out the conclusions of
a projection-run based on the historical behavior of food prices, which predicts an inflation
range of 7.3% to 10.7% by the end of 1999.
✠ The money supply’s 20-month moving average remained close to the midpoint of its
corridor, whereas M3 continued below its lower limit. In addition, nominal and real loan
portfolios displayed a new decline. Lastly, the real deposit rate in September was almost one
percentage point lower than in August, while the lending rate fell by 0.5 percentage points.

4
✠ The inflation results and trends discussed in this report have led the Bank’s Board of
Directors to conclude that inflation for 1999 will not surpass 11% and that the 10% target for
the year 2000 will be met. Moreover, since the money supply remains within its corridor, the
Board has decided that there is scope for reducing the Bank’s intervention rates by 100 basis
points. Accordingly, the basic rate for REPO auctions now stands at 15%, and the Lombard
rate (the rate for the unlimited REPO window) at 21%. The reverse REPO rate stays at 11%.
The Board of Directors,
Chairman
Juan Camilo Restrepo Salazar
Minister of Finance and Public Credit
Directors
Sergio Clavijo Vergara
Luis Bernardo Flórez Enciso
Antonio Hernández Gamarra
Salomón Kalmanovitz Krauter
Leonardo Villar Gómez
Governor
Miguel Urrutia Montoya
5
������������ �����������
Prepared by the:Programming and Inflation Unit
Economic Studies Division

6
������������� ����� ���Hernando Vargas HerreraManager
���������������������������Carlos Felipe Jaramillo JiménezDirector
Oscar Bautista MonteroEdgar Caicedo GarcíaAdolfo León Cobo SernaAndrés González GómezMunir Andrés Jalil BarneyDaniel Mejía LondoñoLuis Fernando Melo VelandiaJorge Enrique Ramos Forero

7
�� �� ��
�� ����������� ��������������� ��
�� ������������������� ��
�� ������������������� ��
��� ��� ������������� ��� ��
�� ����� ��� �� ���!����������� ���!� ������" � ��� �� ��
�� ����� ������ �� �#
�� $ �� #�
%� &����' ��������������(��� ���� #�
)� *"����� ������ ���� ##
���� �� ������������� ����� +�
��� ���������� ���������(�� +�
�(� ������ ���� ��������� +�
�� )�������� ��,�" +�
�� -�� ��� ��������. +/
�� ��������������� 0�
(� ��� ��������� ��� 0�
�� ���� � ����������� �������� 0�
�� -����������(������������ ���� 0#
�� ������������ ���������� 0+

8
���������� �������� �� ����������������� �������������������� ���
����������� ��������������
����������������� ����������
�
�������������� ���� ����������
� ����� ���� ���� � �� ��� � � ����� ����������� ��� ���������������������� � ������ �� � � ���� �������� ������������� ����������������������������������������������������������� !� ��������� ������ ������� ���� �����"����� ������������������� ���������� ������������������������� �� ���������������� �������������� ��� �� ����� ������ ��������� #�� � $��������%������&���������������'$�������(���������������� �������(�� #)����� �� �����#��*�+�,����-� .����� �� ��/"0#������������� ������������ !�������������������������� �����"���� ��� ����� ��� � � #������ �����#�� �� #�� ���� ��������������
������������� �� ���
��������������� �
The annual consumer inflation rate in September was
9.3%, similar to the rate the end of the second quarter
(9.0%) but more than eight percentage points lower
than in September 1998. During the first nine months
of 1999 consumer prices grew by 7.8%, down by 7.2
percentage points compared with the same period
last year. The monthly inflation rate of 0.3% registered
in September was identical to that of September 1998
and the lowest September rate since 1978 (Figure 1
and Table 1). Low monthly price increases since
February 1999 have yielded one-digit annual inflation
rate for the past five months.
All the measures of core inflation (CPI excluding food,
core inflation, trimmed mean, and asymmetric mean)1
(Table 1 and Figure 2) have continued to show a
significant decline in their annual variations, a trend
observed all this year. It should be pointed out that,
judging by the recent evolution of the different
indicators, the small pick-up in inflation in the past
two months was not caused by demand pressures. In
the third quarter, underlying inflation as an average
���� ���� ��� ���! ���� ���� ���� ��� ���! ����
��"
���
��"
���
��"
���
Monthly
������
���
���� ���� ��� ���! ���� ���� ���� ��� ���! ����
����
� ��
����
����
�"��
����
���
!��
January to September
����
����
����
���
����
���
����
����
��
����
���
����
����
����
��������
����
���
����
���� ���� ��� ���! ���� ���� ���� ��� ���! ����
��
#���
����
� ��
����
�!��
����
���
Past 12 months
���
����
���
����
���
����
����
����
���
����
���
����
��������
��������
������
����
���� ���� ��� ���! ���� ���� ���� ��� ���! ����
#"��
#���
�"��
����
�"��
����
"��
Annual inflation(In each month from 1980: 1 to 1999: 9)
��
��
���
���
���
�����
��� ���
������������
�����
������

9
�������������� �������� ��
������������������ ��������������
Monthly Year to Sept. Annual
1997 1998 1999 1997 1998 1999 1997 1998 1999
I. CPI 1.3 0.3 0.3 14.9 15.0 7.8 18.0 17.8 9.3
Food 1.8 (1.5) 0.1 13.7 17.6 6.0 17.8 20.3 4.2
Housing 0.9 1.2 0.2 14.3 12.4 4.7 17.9 15.6 8.6
Clothing 0.6 0.4 0.2 7.2 6.1 2.7 9.2 8.3 4.4
Health care 0.8 0.7 1.3 19.9 18.8 13.9 21.9 20.4 15.7
Education 1/ 1.8 1.7 0.0 22.5 18.2 9.7 22.7 18.4 8.9
Transport 0.6 0.3 1.6 17.2 17.0 15.7 18.1 21.0 18.9
Sundry expenditures 1.2 1.3 0.5 14.0 15.7 14.4 18.1 19.9 18.9
II. Core Inflation 2/ 1.0 1.1 0.4 15.4 13.9 8.5 16.9 17.4 10.0
CPI excluding food 3/ 1.0 1.1 0.4 15.4 13.9 8.5 18.1 16.7 11.6
Core 4/ 16.8 17.2 10.5
Trimmed mean 5/ 16.6 17.9 9.1
Asymmetric mean 6/ 16.2 17.7 8.7
III. PPI 1.3 0.0 1.5 13.5 12.5 10.0 16.1 16.5 10.9
By economic use or destination
Final consumption 1.1 0.1 1.3 12.2 10.5 8.9 14.7 14.9 10.6
Intermediate consumption 1.8 (0.5) 1.1 16.2 15.8 9.7 19.5 18.9 9.1
Capital goods 1.2 1.8 3.8 8.3 10.9 16.2 8.9 16.0 20.1
Building materials 0.1 2.3 1.2 13.0 9.1 10.9 13.2 13.4 14.3
By provenance
Domestically produced and consumed 1.1 (0.3) 0.7 14.1 13.1 7.8 17.1 16.7 8.3
Imported 3.1 2.9 3.8 9.6 8.5 16.7 8.4 14.7 21.2
Exported 7/ 2.9 3.8 2.7 25.1 (2.9) 21.0 23.5 5.9 30.0
By industrial origin
Farming, forestry & fishing 1.9 (1.9) (0.4) 21.3 14.2 6.4 26.7 16.1 2.5
Mining 1.1 (6.8) 0.3 (4.4) (17.5) 28.6 1.1 (8.9) 43.1
Manufacturing 1.1 1.0 2.0 11.4 12.8 10.6 12.9 17.3 13.2
IV. Other core inflation indicatorsCPI excl. food, services and transport 8/ 1.1 1.0 0.2 14.8 13.2 6.7 17.5 15.4 9.0
Median 9/ 16.8 14.5 5.6
1/ Starting in January 1999, application of a new CPI methodology divided this group into education, and culture and recreation. For purposes
of price monitoring, it was decided to leave them together in a single group.
2/ This is the average of the four underlying-inflation indicators calculated by the Banco de la República.
3/ CPI excluding all items of the food group.
4/ CPI excluding 20% of the weighting with those items that showed the greatest price volatility between January 1990 and April 1999.
5/ The weighted mean trimmed by 5% in each tail, calculated by the CPI-60 methodology. In this connection, see Luis Fernando Melo et al.
Un análisis de las medidas de inflación básica para Colombia, mimeo 1997, Banco de la República.
6/ The asymmetric mean trimmed by 15% in the left tail and 13% in the right tail, calculated by the CPI-60 methodology.
7/ The total PPI dos not include exported goods. It is calculated from the weighted sum of domestically produced and consumed goods and
imported goods.
8/ The total CPI does not include primary foodstuffs, state services (utilities in general), and transport.
9/ The weighted median of the entire CPI basket, calculated by the CPI-60 methodology. In this connection, see Melo (1997).
Sources: Banco de la República, Economic Studies Division, PPI and CPI Listings, and National Statistics Agency.

10
Source: National Statistics Agency; calculations by Banco de la República.
����������������������������������������������
�����������������������������������������
� � ��� ���"����� # ������� ������� ����� �� ��#��������� �����1�2�34����� ������5��"�������.����)���6����������������������������� �7��������%����������6�������������������� ���"������������������
� �����#��*��������������������#������#�������������������"����������8������������������ ����������������""�����������
� !���������*���������������������������������������"���������� �������
� ����#������*���������"���"��������������#���� ����������������
� �������������*�������������#�"��������
of all the indicators was 10.0%, down by 1.5
percentage points on the second quarter. The lowest
growth rate was shown by the asymmetric mean
(8.7%) and the highest by the CPI excluding food
(11.6%)
September’s inflation was low (0.3%) due to
favourable price behavior in education, culture and
recreation (0.0%) and food (0.1%). In education this
positive result is explained by a 12.5% fall in the CPI
of recreation services, which include cinemas and
discotheques2, while the food group benefitted from
a decline of almost 2.5% in vegetables.
Analyzing the evolution of inflation in the past 12
months by CPI group, three different patterns are
observed. First is the behaviour of the groups leading
the drop in annual inflation: food and clothing, with
annual price increases of 4.2% and 4.4%, respectively.
Second, the behavior of the groups showing a price
increase close to average inflation: housing (8.5%)
and education (8.9%). And third, the behavior of the
groups displaying a price increase far above average
inflation: health care (15.7%), sundry expenditures
(18.9%), and transport (18.9%).
The groups displaying this third pattern have been
especially affected in 1999 by devaluation, in the case
of health care, with drug prices rising by over 18%;
by the imposition of VAT on sundry expenditures,
such as toothpaste (18.9% price increase) and toilet
soap (14.7% price increase); and by the substantial
rise in gasoline prices, in the case of transport, with
consequent fare increases for urban buses (32.8%),
taxis (25.0%), and planes (27.6%). It is also important
to point out that the gradual dismantling of utilities
subsidies has led to considerable price increases in
telephones (36.3%) and water, sewage and waste
collection (23.0%).
���������� ������ ������������������������������
Figure 3 shows annual price evolution under an
alternate classification that divides the CPI basket into
tradables3, and nontradables (indexed4, flexible5,
and cyclical6 items). Two types of behavior can be
discerned from this figure. One is the behaviour of
flexible goods (unprocessed farm produce), which
began to rebound in the past three months after their
sharp fall in early 1999. The other is a declining price-
growth tendency in 1999 shown by indexed tradables
and even more strongly by cyclical tradables.
Although the prices of all groups in this classification
partly reflect the reduction in demand, they have at
the same time been favourably affected by other
factors. An abundant supply of food products,
particularly root crops, has benefitted flexibles food
prices. Low international prices have amply
$��%�& '��%�& ���%�& $��%�� '��%�� ���%�� $��%�� '��%�� ���%��
� ��
����
����
����
�!��
� ��
����
����
���
� �� ������
� ���
���������������
����� ����! � ��������"��

11
Source: National Statistics Agency; calculations by Banco de la República.
������� ����������������������������
������������������ ����!�������������
������������������������
Source: Banco de la República, Economic Studies Division.
�������!"������������������
������������������ ����������
compensated for the effects of devaluation all this year,
while indexed items have benefitted from lower
dwelling rents, and cyclical items from a downward
phase in livestock prices.
��� ���" ���! ���& ���� ����
!���
"���
���
#���
����
����
���
%����
%����
%#���
�������������� �� ���
Overall performance
Annual producer inflation was 10.9%, down by 5.6
percentage points from its level in September 1998.
However, it is 5 percentage points higher than at the
end of the second quarter of 1999 (Figure 1). In the
year to September, the Producer Price Index (PPI)
showed a variation of 10.0%, down by 2.5 percentage
points on the same period last year (Figure 4).
Monthly growth in the PPI was 1.5%, the highest rate
for September since 1991.
Classification by origin shows an upturn in the prices
of imported goods, which grew by 3.8% in September
and by 21.2% in the 12 months to September. Their
12-month rise by far exceeds the 8.3% increase in
the prices of domestically produced and consumed
goods. Classification by industrial sector shows
mining as the worst performer, with a 12-month
variation of 43.1%, reflecting currently high oil prices.
Producer prices rose by 13.2% in manufacturing and
by 2.5% in farming over the past twelve months.
���� ���� ���� ���� ���� ���� ���� ���� ���� ����
����
����
����
����
����
����
���
���� ���� ���� ���� ���� ���� ���� ���� ���� ����
���� ���� ���� ���� ���� ���� ���� ���� ���� �������� ���� ���� ���� ���� ���� ���� ���� ���� ����
Annual inflation(In each month from 1980: 1 to 1999: 9)
���
����
����
����
����
����
��
��
January to September
�������
����
����
����
����
����
��������
������
����
����
����
����
��� ����
����
����
���
���
���
���
���
���
��
���
���
���
������
���
��
���
���
���
��
���
������
���
��
���
Monthly
����
����
����
����
����
����
���
Past 12 months
����
����
����
���
����
���
��������
����
�������
���
����
����
����������
����
����
� ��� �����#���
���������
���� ��
$�� �#���

12
���������������������
���������������� ���������������������������������������������������������� ������������������� �������������������������� �������� �����
��� ����������������� ��������������� ������������� �������������� ��������������������������� ��������� ��������������������� ��� ���� ������������������������������������������
�������������������������� ������� ��������������������������������!������������������"#���������������� ���������$������� ��������!�����% ���&�����'�
(������������)����������"***+��(����������� ����������� ���������������������������� ��������������������������+��,��������� ��������������+
���������������������-�� ���� ����� ����� �����������.��������������������������������������������/ �����&����������� ��� ������������������������� � �������������������!���������������������������� ������� ��������������� �������#0������������� ����������������
(�����)���� ���� � ������������������������������ � �������+�� 1�� � ��)������������ ��������)������������� ����� �������� �������������������������� ���������������������������2������� �������� ������ ��������� ��� �������������������������� ����������������� ����2 � ��
�������������
����������������������� ������������������������ ����������� ����������� ��� �������� �
����� �������������������������� ���� ����������� �������������������� � ����� ���������� ������/ ���� ��������������� ����������� � ���������� ������������ ����������1������ ��������������������� ������������������������� ��������"***����������)������������ ����������������������� ���
��������������������������
��� ������������������������� �������������������������������������
$��%�! $��%�! $��%�& $��%�& $��%�� $��%�� $��%�� $��%��
#"��
#���
�"��
����
�"��
����
"��
���
(����)���
13
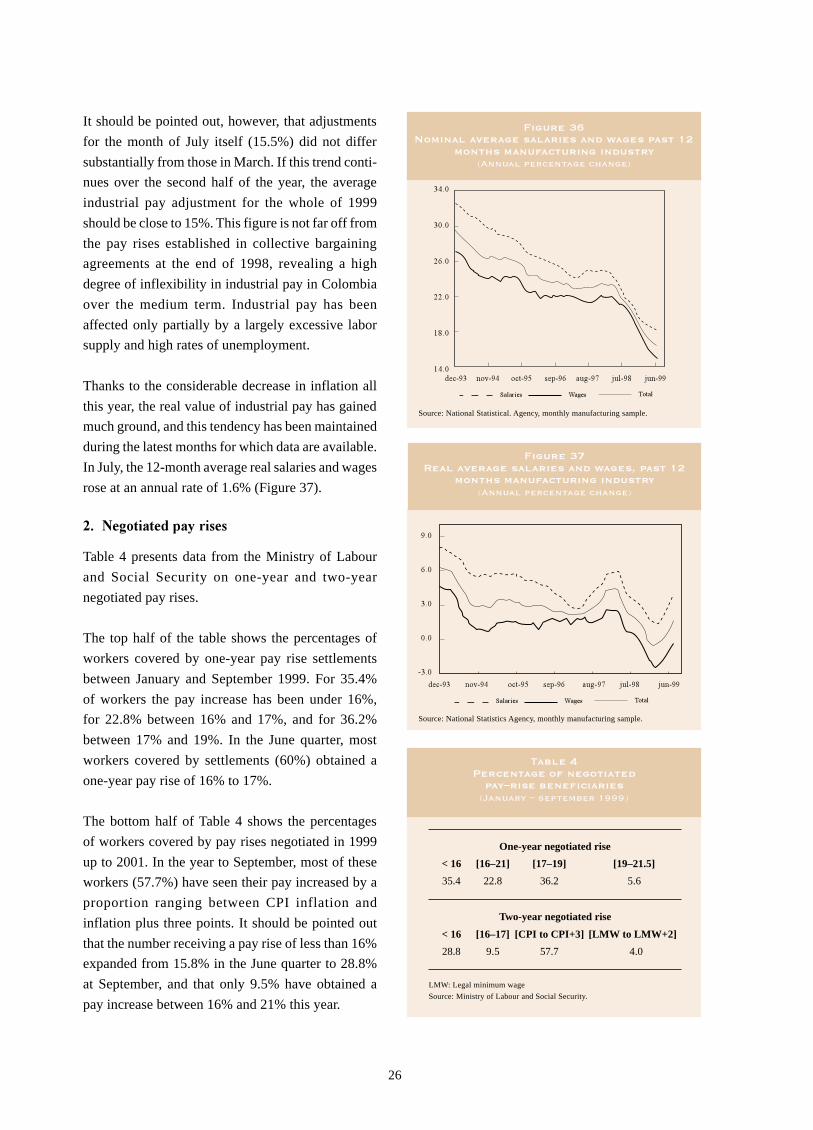
,������������ �������2!���������������������� �������������+��/���������������� �����������!������ ������ � ����� ������ ����� ��� �������� � � �������.�� ���� ������������� ��� �������
�������������� ���/��� � �����341� ���� �������#5��� � ������������ ������������� �������������� ����� ��������������������������������� ������������5������������������� ������������)������������ ���1����� ������� ������������"***����������������341������������0����������
����� � �����������������������5�60����������� � �������341���������� ������������������ �%����341!7*'���/������������������������"***������������������*��0������������!������������ ����������� ��� �������"����������������������������� ������������
,������������������ ���������������������������� �������� �����"***������� ������������������� ����� ���� ��������� �� ��������� ���� ���������������� ����� ������������������ ���
����341��� 2�����/ � �����������������������3����������� ���� ������������������������� �� ��� �������������)��������������65��0��������������������� ��������� 5!�� #�1����������)����������8�������� ���� ������� � ������������������������������ �����������341!7*�����"��#0�
��������������������5!���#�1�����������)����������8�������������������������� �������)���� ������ �%����������'������������������9����������� ����������66�#0������ 5!�� #����""� 0������5!���#������ � ����� ������������������ ��������341������ ������� ������� �������������
���������� ����������������������������������������� ��
������������� �������
Items CPI-60 CPI-98
Food 34.8 29.5
Food excluding meals away from home 33.5 22.8
Cereals and bakery products 4.9 3.3
Tubers and plantains 2.6 1.8
Vegetables and legumes 3.0 1.9
Fruit 1.9 1.3
Meat and meat by products 8.9 6.1
Fish and other seafood 0.8 0.6
Milk, eggs and fats 6.5 4.6
Sundry foodstuffs 4.8 3.4
Meals away from home 1.4 6.7
All other items 65.2 70.5
Source: National Statistics Agency.
1� ��� �����)���������������������������� ��������� � ��������� ����� ���� ��������341��� 2��
%341!� '�������������������"***���������������*�6����������������� �%�*�70'�
���� ��������� ����� ������������������ ���������������������������8���� ��� �/������%:/��'���
��������������341�����:����������� ���(����� �341!7*�� �������������������������;� ����� ����)�������������������341!� ��� ���� ������������ �������������;� ����� ���������������!���������������������������������������������������������������� ��������2����������� ����)���������
����� ������� ���������������������������������� �������� ����������������� ����������� ����������������������� �������� �������������������� �� � �� ����������)��������������� �

14
;� ������������������ ��������������������������������������� ���<����� ����� � ���������������=����������>��?����� ������������ ����������������� �����)� � ����������������������������)������������������� �������������� ������ �� �� ������������ ���� ������� �������������
�������������������������������������������������� �� ��������������������������������� ��� ����������������
��� ���������� �� ������� ������ �����������)������� ��������� �����)�� ����@ � �������� ������� ������ �������������� ������A�������������� ���������������������������� �������� ��������������������� ���������������� �����"***����� ����� �� �����������������������������
999999999999999999� !��� ����������������� �7��������%����������6����5��1&67$4���������������� �������+�1:���4�

15
��
������� � ������� ������
Source: Banco de la República, Economic Studies Division.
�������#$������������������������
������������������������� ������!������
#���
����
����
���
%����
%����
%#���
% ���
Source: Banco de la República, Economic Studies Division.
�������%$�����������
&��'��� ��������������"���� �� ���� ��
�� �& #� #& � & "� " �� �" �� �" #� #" � " "�
���� *��+� ����
�����
�����
&� ��
!�!��
"����
�� ������������������ �������������������������
This section discusses developments in the economy’s
monetary and exchange variables and supply and
demand situation.
����������������������
The behavior of the monetary aggregates is analyzed
by examining the evolution of the monetary base, M1,
the broader measure M3-plus-bonds, and the financial
system’s loan balance.
������������
An October 1st the monetary base amounted to 7.498
billion pesos, with a 12-month growth rate of 6.3%,
exceeding the indicative corridor’s ceiling by 1.7%
(Figure 5).
In September the monetary base’s average balance
showed an annual growth rate of 1.5%, up by 7.5
percentage points with respect to June. Analizing the
uses of the monetary base, this behavior is explained
by increased annual growth in both cash (from 19.0%
to 30.8%) and reserves (from -28.6% to -24.7%)
(Figure 6).
The monetary base, adjusted for liabilities subject to
reserve requirements, registered an average annual
growth of 18.0% at the end of September, up by 5.6
percentage points on the rate at the end of June. To
adjust the monetary base, reserve demand is corrected
by applying the current average rate of reserve
requirement (5.7%) to the liabilities subject to such
requirements.
$� � ���%�� ������"
$��%�& '��%�& ���%�& $��%�� '��%�� ���%�� $��%�� '��%�� ���%��
&��� ���' (����)�� ��*%�����#���

16
Source: Banco de la República, Economic Studies Division.
��������$����������� ������
�������������������������� ������!������
#"��
�"��
�"��
"��
%"��
%�"��
Source: Banco de la República, Economic Studies Division.
��������$ (����(�������������� ������
�������������������������� ������!������
#���
�"��
����
�"��
����
"��
���
Source: Banco de la República, Economic Studies Division.
�������)$ (����(����
&��'��� ��������������"���� �� ���� ��
&�����
!"����
!�����
""����
"�����
��������������
The M1 balance at October 1st was 9.420 billion
pesos, with a 12-month variation of 11.4%. Its average
annual growth rose in September to 11.9%, up from
4.3% in June. This behavior is explained by faster
growth in cash, as indicated above, and in checking
accounts (from -5.5% to -0.8%) (Figure 7).
������������
The broader monetary aggregate of liquidity, M3-
plus-bonds, was 56,810 billion pesos at October 1st,
growing 4.6% this level is 11.3% below the floor of
the indicative corridor (Figure 8).
The average balance of M3-plus-bonds registered a
lower annual growth rate in September (5.0%) than
in June (5.3%). This decline resulted from slower
growth both in liabilities subject to reserve require-
ments, and in bonds (Figure 9).
Annual growth in the average balance of liabilities
subject to reserve requirements dropped from 8.5% in
June to 7.2% in September. This is largely explained
by a fall in the rate of growth of Certificates of Deposit
(CDs) (from 14.2% to 6.0%), which was not offset by
the stronger growth in checking accounts (as indicated
above) and in savings accounts (from 6.7% to 12.0%)
(Figure 10).
The average monetary multiplier declined between
June and September, from 8.260 to 7.933. This
behaviour is associated with a rise in both the cash
ratio (from 0.079 to 0.083) and the reserve ratio
(from 0.052 to 0.054) (Figure 11).
The average monetary multiplier of the adjusted
monetary base also decreased between June and
September, from 7.971 to 7.748.
������
The overall balance of local and foreign currency
loans by the financial system (excluding FEN -
National Energy Financing Corporation) amounted
to 49.627 billion pesos on October 1st, with an annual
$��%�& '��%�& ���%�& $��%�� '��%�� ���%�� $��%�� '��%�� ���%��
$� � ���%�� ������"
�� �! #� # #� � ! "� � ! �� � �� �� �! #� # #� � ! "�
+��#���������%#*����� �����)����,%��������
���# ��� �'��-��"�& ������� %���
$��%�& $��%�& ��,%�& ���%�� ���%�� -��%�� $��%��
.��������"
�/
.��������"��
!�# ���/
�� ���' �'��-��"���� %���

17
growth rate of -1.5%. In domestic currency the annual
growth rate was 0.7%, in foreign currency -16.9%,
and in the latter’s dollar equivalent -35.1%.
Annual growth in the portfolio’s average balance fell
from 0.6% in June to -1.4% in September (Figure 12).
Annual growth in the financial system’s gross real
balance of local-currency loans also declined in
September relative to June, falling from -0.4% to -
6.5% (Figure 13).
������������������
The average deposit rate, as measured by the DTF
rate, stood at 18.1% at the end of September, and the
average lending rate at 25.6%. The difference was
7.6 percentage points, down by 1.9 points on the
previous quarter (Figures 14 and 15). The interbank
rate averaged 17.0% during September (Figure 16).
The real (ex-post) deposit rate edged down from 8.2%
at the end of June 1999 to 8.0% at the end of
September, while the real lending rate fell from 16.9%
to 14.9% over the same period (Figure 17).
Figure 18 shows how the interbank rate has evolved
for different maturities over the past nine months. Its
downward trend since November 1998 for all
maturities was interrupted in June of this year. And
from July the level of long-term interbank rates has
remained fairly stable around 18%, with an upward
trend for the longer maturities.
The behavior of spot and forward curves over the past
eight months can be seen from Figure 19. The spot
curve (thick broken line) shows that the downward
trend followed by 90-day interest rates since the
beginning of the year has levelled off at around 18%
for the past three months.
Each one of the points on the forward curves (thin lines)
shows the expectations of agents about the 90-day rate
at the present time (the first point), in 30 days (second
point), and so on up to 360 days. From June of this
year the forward curves have flattened out, reflecting
Source: Banco de la República, Economic Studies Division.
��������*+��������������,����������������-���� ����
.+/01������2����� �������������������������������� ������!������
#"��
�"��
�"��
"��
%"��
%�"��
1 National Energy Financing CorporationSources: Banco de la República and Superintendency of Banks.
������������������������������������������
������������3�
�������������������������� ������!������
!���
"���
���
#���
����
����
���
%����
Source: Banco de la República, Economic Studies Division.
���������$ (����(����� ���������
���
��"
���
&�"
&��
!�"
!��
"�"
"��
+0(1# ��� �'��-��"������ �2� 0�)��"�
$��%�& '��%�& ���%�& $��%�� '��%�� ���%�� $��%�� '��%�� ���%��
�%���3��� ���'����� (����)������
$��%�& $��%�& ��,%�& ���%�� ���%�� -��%�� $��%��
���
����
����
����
���!
���
���%�& ��,%�& ���%�& ���%�� ���%�� $��%�� $��%��
.��� �
��� �
�� �

18
1 National Energy Financing CorporationSources: Banco de la República, Superintendency of Banks.
�������� 4�������������(�����������������
��������������� �������������3������������������������
#���
�"��
����
�"��
����
"��
���
%"��
%����
Sources: Banco de la República and Superintendency of Banks.
��������%+����������������������������������
������������
��� ���" ���! ���& ���� ����
� ��
����
����
���
!��
Sources: Banco de la República and Superintendency of Banks.
��������!+�����������������������
��������������!������
""��
"���
"��
���
#"��
#���
�"��
����
�"��
Sources: Banco de la República and Superintendency of Banks.
��������#5����������������������������'���������
�����������%�(��������������������
����
&���
!���
"���
���
#���
����
����
���
Source: Superintendency of Banks.
��������)5�������������.�6/1�������������� ���������
������������
#"��
#���
�"��
����
�"��
Sources: Banco de la República and Superintendency of Banks.
���������0������������������������
������������
#���
�"��
����
�"��
����
"��
���
%"��
%����
���%�# ��,%� ���%�" ���%�! ���%�& $��%�� $��%��
��� ���" ���! ���& ���� ����
+�����"�����2�3 ��������
�&%'��%�& �"%���%�& �%'��%�� #�%$��%�� ��%���%�� ��%'��%�� #�%���%��
$��%�� ���%�� '��%�# ���%� '��%�! ���%�& $��%��
+�����" 2�3 ���
#� !� �� ��� #!������� ������ ����
����� ����� � ����
� ���� � ���� ������

19
Source: Superintendency of Banks.
����������*(�����6/��������,�����
������������
#���
# ��
����
� ��
����
� ��
Sources: Banco de la República and Superintendency of Banks.
���������7����������������
������������
���
#"��
#���
�"��
����
�"��
����
"��
���
Source: Banco de la República.
��������*�������������� ��������������������������������������
������������
�����
����
����
&���
!���
"���
���
#���
����
����
���
the fact that the market expects no big changes in the
yields of 90-day CDs in the longer run.
���� ����������������
As the exchange rate band has been eliminated, this
report proposes a new indicator of domestic and
foreign yield differentials. This indicator has been
constructed on the basis of the implicit devaluations
contained in the financial system’s forward (80 to 100
days) dollar purchase contracts. The external deposit
rate of reference is the 90 day libor rate and the DTF
rate is the domestic deposit rate of reference.
Figure 20 compares the expected external yield, the
return on domestic investments (as measured by the
DTF rate), and actual external yield with a lag of three
months. Expected external yield has run above
internal yield all this year except in September, when
the two were equal.
!���"# $���������
The nominal exchange rate at the end of September
was 2.017 pesos to the dollar, with a devaluation of
30.8% in the year to September and an annual
devaluation of 29.6% (Figures 21 and 22).
Before the exchange rate band was eliminated on
September 25 of this year, the exchange rate fluctuated
within the upper half of the exchange rate band
defined on June 28, 1999. Between the 1st and 25th
of September, the representative market exchange rate
stood at an average 19 pesos below the band’s ceiling,
161 pesos above its midpoint, and 342 pesos above
its floor.
%���&�����# $���������
The real exchange rate, as measured by the real
exchange rate index RERI-1 (1994 = 100), which uses
Colombia’s producer price index and those of its 20
trading partners, averaged 118.1 in September, with
a devaluation of 14.0% in the year to September, and
a 12-month devaluation of 15.0% (Figures 23 and 24).
$��%�� ���%�� $��%�� ���%�� $��%�� ���%�� $��%�� ���%�� $��%�� ���%��
$��%�& '��%�& ���%�& $��%�� '��%�� ���%�� $��%�� '��%�� ���%��
$��%�� $��%�# $��%� $��%�" $��%�! $��%�& $��%�� $��%��
2 ������ ���%���� ������ 4 3������� ������
���������������� ������ ����
����� ����� � ����
� ���� � ���� ������

20
Sources: Banco de la República and Superintendency of Banks.
���������0�������������� ��'������2���������8����
���2���������8����)����(������������ � �� �����
�����
�����
��&��
��"��
��#��
�����
���
Source: Banco de la República, Economic Studies Division.
��������!7���������������������8�����9��.���!�:��**1
��������(��������������������
�"��
����
�"��
����
"��
���
%"��
%����
%�"��
%����
Source: Banco de la República, Economic Studies Division.
�������� 0�������2�����������������������9����������9
���!�9��**��������(��������
��"��
�����
��"��
�����
��"��
�����
�"��
����
�"��
����
Source: Banco de la República, Economic Studies Division.
��������%7���������������������8�����( �.���!�:��**1
��������(��������������������
#���
����
����
���
%����
%����
%#���
Source: National Planning Department.
���������$��2������������
�#����� ���
�"����
������
�����
!����
#����
�
Sources: Interconexión Eléctrica S.A. and National Statistics Agency.
��������#��������� ��������������������������
-����������������������������������������
/0�������'���1
$��%�� $��%�# $��%� $��%�" $��%�! $��%�& $��%�� $��%�� $��%�& $��%�& ��,%�& ���%�� ���%�� -��%�� $��%��
���%�# ���%� $��%�" '��%�! ���%�! ���%�& $��%�� '��%��$��%�� -��%�# '��%� ���%�" '��%�! $��%�& $��%�� ���%��
�%$��%�� �%'��%�� �"%���%�� � %$��%�� �%���%�� #%$��%�� �!%���%��
$��%�� ���%�� ��,%�# ���%� ���%�" ���%�! $��%�& $��%�� '��%�����-���� �'��"������ $� � ������"
(4(�5� (4(�5� ���%����3� �%��4���"��������
/2��������������1
����
���
!��
��
���
���
%���
% ��
%!��
%���
�"��
����
"��
���
%"��
%����
%�"��
%����
%�"��

21
�������;��������������� ���������������������������� ���������
������������������������
If the rate is measured by the RERI-3 index
(1994 = 100), which uses consumer price indexes,
the devaluation for the year to September is 17.4%
and the 12-month devaluation is 19.0% (Figure 25).
�������������������
Different indicators of economic activity for the third
quarter of 1999 suggest that the Colombian economy
continued to contract during this period.
Power consumption, traditionally a good indicator of
urban economic activity, declined at an annual average
rate of 4.4%. All the same, this was a slower decline
than in the first and second quarters of this year (-6.7%
and -5.5% respectively) (Figure 26).
Much the same happened with car sales, which shrank
at an annual rate of 53% between January and August.
In August some 5.330 units were sold, slightly more
than in the first four months of the year, but far below
average historical levels for the nineties (Figure 27).
The above indicators, together with figures on indus-
trial performance in July and August, and various
indicators of the financial system’s credit perfor-
mance, do not offer a promising outlook for third-
quarter growth this year. Figures on GDP growth for
the period are expected to be negative, making it the
fifth quarter in a row display a contraction in out put.
Last month the National Planning Department revi-
sed downward the figures on expected growth for
1999. It now expects a contraction of 3.5% for this
year, a poorer performance than projected three
months ago (Table 2).
Although third-quarter interest rates remained
relatively low, which should have helped to expand
demand, several of the factors detrimental to growth
Actual Projected in
First quarter Second quarter June September
GDP (5.8) (7.6) 1.3 (3.5)
Imports (12.1) (18.4) (2.3) (19.9)
Final consumption (2.3) (2.8) (1.2) (3.7)Households n.a. n.a. (0.9) (5.2)Public sector n.a. n.a. (2.5) 2.0
Gross domestic capital formation (38.0) (46.6) 2.3 (29.0)
Gross fixed capital formation n.a. n.a. (4.5) (27.5)Private sector n.a. n.a. (5.3) (53.7)Public sector n.a. n.a. (3.5) 2.6
Change in stocks n.a. n.a. 35.0 (50.8)
Subtotal: Final domestic demand (9.5) (11.5) (0.5) (8.5)
Exports 10.5 3.1 6.6 5.7
n.a. Not available
Sources: National Statistics Agency, for actual data; National Planning Department, for projections.
22
Source: National Statistics Agency.
��������)7��������<�2���� ��2���������
������������
�"��
����
�"��
����
"��
���
%"��
%����
%�"��
%����
Source: Economic Studies Division, using figures from the Business OpinionSurvey by Fedesarrollo ( a research institution).
������� *6���������������������"�������� �����������
Source: DIAN.
���������=������� ��2���������
�$���� �� �� ������
�����
�����
���
!��
��
���
�
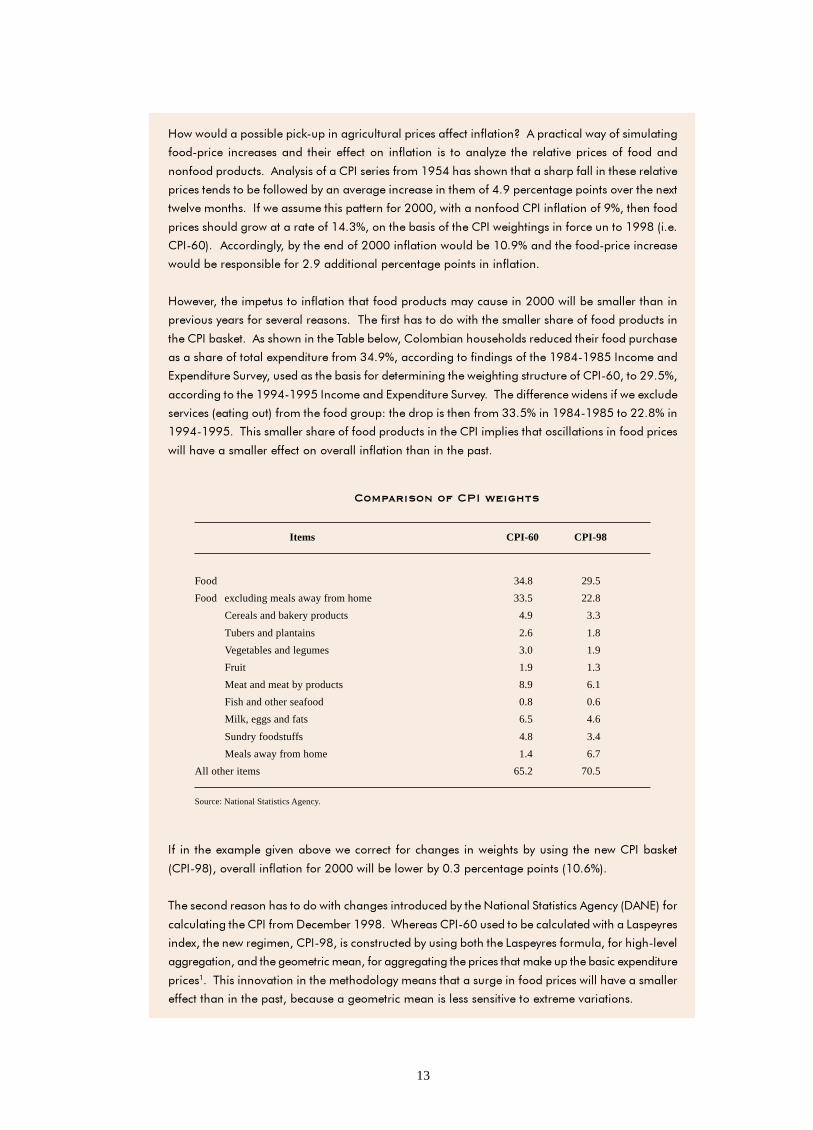
that had emerged last year failed to disappear during
the September quarter.
First, external conditions continued to impair
Colombia’s export performance. Prices for several of
our export products, notably coffee, stayed low or fell
even lower. Similarly, various of our export markets
are going through a deep recession, which reduces
chances of growth for our exports (see Section IV,
International Context).
Second, the financial system’s frailty since last year
has prevented it from having sufficient fresh funds
available for resuming its credit activity quickly and
widely. One factor likely to have contributed to this
situation was the liquidity drain produced in the past
two months by exchange-rate uncertainty. This
uncertainty also led to a further shortage of savings,
which, moreover, curbed the decline in interest rates.
Third, uncertainty in recent months about the legal
framework underpinning home financing schemes has
affected early recovery not just in the construction
sector but also in the economy at large, given this
sector’s powerful multiplier effect.
Despite the negative factors described above, several
signs of reactivation did appear during the third
quarter. The first was a better performance in exports,
including nontraditional exports. In July and August
total monthly exports registered an annual average
growth of 13%, largely accounted for by oil exports
(Figure 28).
Nontraditional exports, too, contributed to the better
performance of total exports. Average growth in
monthly nontraditional exports in July and August
was 1%, an improvement on the -7% average rate
registered in the first half of the year. Higher growth
rates for exports have resulted not only from the
statistical effect of comparison with a much lower
base in the second half of 1998. In recent months the
value of exports has also risen: by 10% relative to
levels in the first six months of the year (Figure 29).
���%�� ���%�� ���%�� -��%�� ���%�� $��%�� ���%��
6 �������� ����� 3 ���� ����� 3 ���
$��%�� ���%�� $��%�� ���%�� $��%�� ���%�� $��%��
6 �������� ����� 3 ���� ����� 3 ���
$��%�" ���%�" '��%�! ���%�! '��%�&���%�& $��%�� -��%�� ���%��
7�����0� �-�
/2�,����� ��1 /3�����1
"
�
#"
#�
�"
��
�"
��
"
�
%"
%��
�
%��
%��
%#�
% �
%"�
%!�
%&�
%��

23
The recovery in total exports during the third quarter
was closely connected with better oil prices. But
faster real devaluation must also have played a part.
This factor has begun to compensate in some measure
for slacker external demand and lower world prices.
Another positive sign was a reduction in inventories
of finished products accompanied by a pick-up in
orders (Figure 30). According to Fedesarrollo’s
Business Opinion Survey, inventories have been
decreasing steadily since March and by August (the
last month for which data are available) had dropped
to levels not seen since April 1998, when the economy
started its current phase of contraction. Orders show
a continuous recovery since May, with a large leap in
August. Both the falling trend in stocks and the rising
trend in orders are reported by companies of all sizes
(large, medium, and small); this was not the case
in earlier months. Lastly, progress in negotiations
with the International Monetary Fund, and expec-
tations of obtaining fresh funds from abroad are
factors that may reduce uncertainty and facilitate an
early solution to the crisis.
����'����(����� �)��� ��*'()+
The latest data available on GDP growth are for the
second quarter of 1999. According to the National
Statistics Agency, GDP in the second quarter
contracted by 7.6% relative to the same period in 1998
(Table 3). This contraction rate was greater than in
the first quarter and indicated a deepening of the
recession to record levels since quarterly GDP figures
began to be recorded.
By expenditure category, only demand for exports
expanded. Real exports measured in pesos grew by
3.1% in the second quarter, compared with the same
period in 1998.
By sector, the greatest contraction was in construction,
particularly private-sector building, which fell by
40.6% relative to the second quarter of 1998.
In fact, private construction declined much faster
in the second quarter of this year than in the first
(27.4%) or in 1998 (16.0%). Furthermore the greater
rate of contraction of overall GDP during the second
quarter was largely a result of the poor performance
of this sector.
Other sectors that shrank significantly in the second
quarter in terms of annual percentage change were
manufacturing (17.0%), commerce (9.5%), and the
financial sector (7.0%). In all these cases, however,
the rate of contraction was much the same as in the
first quarter.
The only sectors with positive annual growth were
mining and quarrying (8.8%) and communal, social
and personal services (2.1%), including public
administration services (3.1%).
������������
According to the National Statistics Agency’s
monthly manufacturing sample, industrial
production in the year to July fell in real terms by
19% with respect to the same period last year. This
������ 0����4���� ������������
�������������������������������������
ActualFirst Second
quarter quarter
GDP (5.8) (7.6)
Agriculture 1.2 (4.9)Green coffee 3.1 (4.9)
Manufacturing (18.6) (17.0)
Construction (14.7) (24.0)Buildings and other (27.4) (40.6)Public works (1.7) (4.6)
Commerce, restaurants & hotels (8.6) (9.5)
Financial sector (7.5) (7.0)
Communal, social and personal services 2.2 2.1Public administration services 3.5 3.1
Mining and quarrying 12.8 8.8
Source: National Statistics Agency.

24
Source: Economic Studies Division of figures from Fedesarrollo’s BusinessOpinion Survery.
������� �6����������� ���
�% �����������
#�
��
��
�
%��
%��
%#�
Sources: ANDI and National Statistics Agency.
������� �0��������������������������
������������������ �����
�#��
���
#��
%���
%&��
%����
%�&��
%����
row in which final consumption decreased, its longest
period of contraction in 20 years, according to the
quarterly spending series. The National Planning
Department’s currently projects consumption for
1999 as a whole to decline by around 3.7%, more
than previously expected.
Spending financed through credit cards suggests that
the contraction in consumption extended into the third
quarter. For the year to July and August, monthly sales
and cash advances through credit cards continued to
show declines of about 10% relative to the same period
last year. The year-to-date and 12-month figures in
August showed no signs of recovery either (Figure 33).
contraction was the same as in June and slightly less
than the average for the first six months of 1999.
With the information available to date, therefore, a
change in the industrial sector’s downward trend is
not yet noticeable (Figure 31).
A similar conclusion can be drawn from the Joint
Industrial Opinion Survey put out by ANDI, a major
business association. The survey shows the industrial
sector to have contracted in the year to August at a
slightly slower rate (11.6%) than in the previous two
months. Significant improvements are not expected
for the rest of the third quarter, in view of the poor
performance of indicators such as electricity consum-
ption, referred to earlier.
The prospects for fourth-quarter growth may be better,
to judge by the recent increase in orders reported
by business establishments, and the progressive
reduction in inventories.
A similar conclusion may be drawn from business
expectations in this sector. In fact, expectations about
the economy in the short run have been improving
gradually since June, while expectations for the next
six months began to pick up, albeit with some ups
and downs, back in April and rose considerably in
July and August. This has been reflected in a better
outlook for production in the short run (three months).
Figure 32 shows the business climate indicator, which
embodies the average behaviour of some of these
variables.
Although the seasonal element cannot be disregarded
in explaining the recovery seen in these and other
industrial indicators in July and August, the intensity
and duration of the recovery seem to indicate that
longer-term factors are at work. Some impro-
vement may therefore be expected in industrial
production indicators during the fourth quarter.
�������������
According to the National Statistics Agency’s figures,
final consumption in the second quarter declined by
2.8% in annual terms. This was the third quarter in a
-��%� ���%� $��%�" -��%�! ���%�! $��%�& -��%�� ���%�� $��%��
�62� � ��'������%!���%���"����3��
$��%�" $��%�" $��%�! $��%�! $��%�& $��%�& $��%�� $��%�� $��%�� $��%��

25
The real cash indicator has moved up considerablyin the past two quarters. However it no longer movesin line either with the Retail Sales Index (RSI), withwhich it has traditionally been correlated, or with finalconsumption, according to data from the NationalStatistics Agency. Everything seems to point to amajor change this year in the composition of thepublic’s liquid assets portfolio, fostered perhaps byan expansion of informal commercial and financialactivity. The outcome has been to make the cashindicator temporarily useless as a predictor of salesand consumption (Figure 34).
Despite the foregoing, it should be noted that in Juneand July the monthly Retail Sales Index contractedmore slowly than in the first months of the year.
!�������������
Gross domestic capital formation fell sharply in thesecond quarter of this year with respect to last year;at 46.6%, this fall even exceeded its large drop of38.0% in the first quarter.
For the second half of the year there seem to be nosigns of a possible recovery in this type of demand.Items such as imports of durable and capital goods,which may be associated with investment spending,continued to shrink at rates above 40.0% for the year-to-July series (Figure 35). Investment for 1999 isprojected by the National Planning Department todecline by about 29.0%; this strong contraction ismostly accounted for by a 53.7% fall in private
investment (Table 2).
��������
���������������,����
In July, adjustments to average nominal pay in theindustrial sector continued to fall. July data showa 16.3% annual adjustment in the average nominalwages and salaries of the previous 12 months. Salarieswere adjusted by 18.1% and wages by 14.8%. Theadjustments observed up to July were about onepercentage point lower than in March for salaries andwages as a whole (Figure 36).
Note: Nominal growth rates.Source: VISA Colombia.
������� /������������2�����������2���2
������������������������������������
���
#���
����
����
���
%����
%����
Source: DIAN - Manifests.
������� %������������ ����
�&������������ ���������
!���
���
����
���
%����
% ���
%!���
Sources: National Statistics Agency and Banco de la República.
������� !��2�����������������������.���1
-���������������������������������������������
����
���
!��
#��
���
%#��
%!��
%���
%����
���%�& ���%�� ���%�� ���%�� ���%�� ���%��
8����� ����� ��� ��'�����%�%�����
'��%�� ���%�� '��%�# ���%� '��%�! ���%�& '��%��(0� ���'
$��%�" $��%�" $��%�! $��%�! $��%�& $��%�& $��%�� $��%�� $��%�� $��%��
2�������� ���
� ��'
26
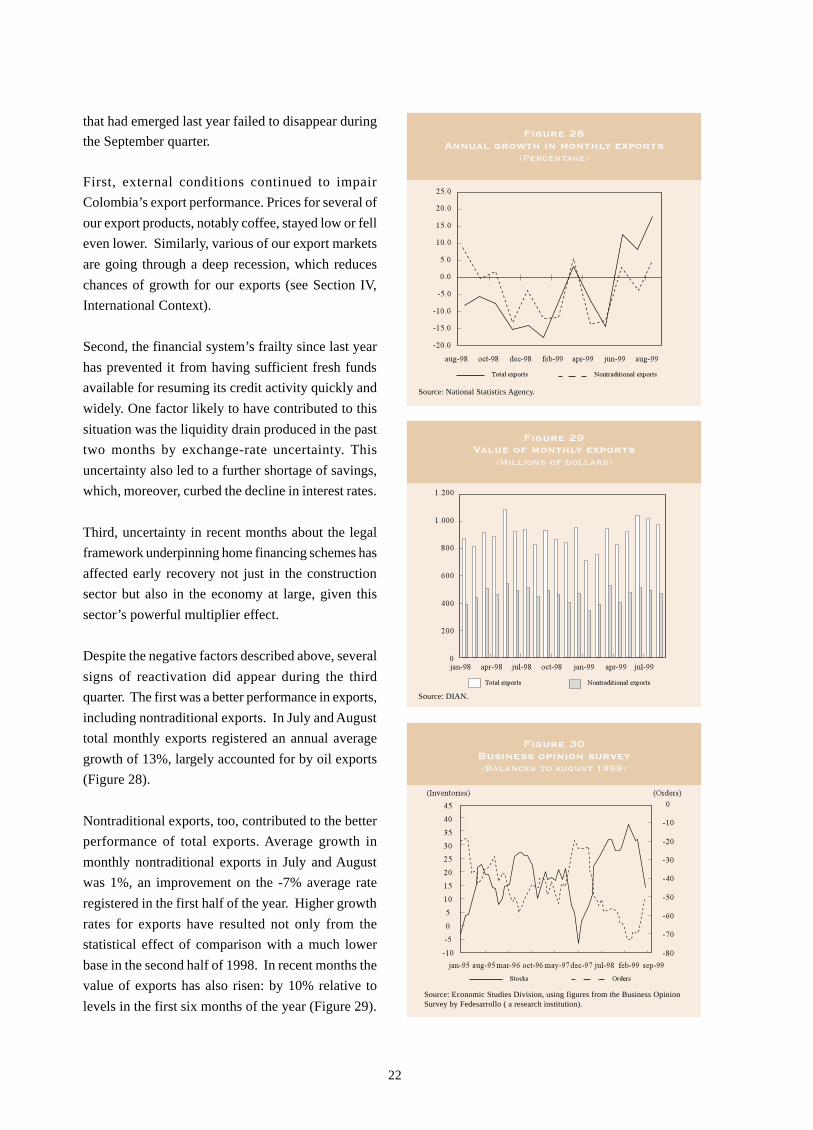
It should be pointed out, however, that adjustments
for the month of July itself (15.5%) did not differ
substantially from those in March. If this trend conti-
nues over the second half of the year, the average
industrial pay adjustment for the whole of 1999
should be close to 15%. This figure is not far off from
the pay rises established in collective bargaining
agreements at the end of 1998, revealing a high
degree of inflexibility in industrial pay in Colombia
over the medium term. Industrial pay has been
affected only partially by a largely excessive labor
supply and high rates of unemployment.
Thanks to the considerable decrease in inflation all
this year, the real value of industrial pay has gained
much ground, and this tendency has been maintained
during the latest months for which data are available.
In July, the 12-month average real salaries and wages
rose at an annual rate of 1.6% (Figure 37).
����-������������������
Table 4 presents data from the Ministry of Labour
and Social Security on one-year and two-year
negotiated pay rises.
The top half of the table shows the percentages of
workers covered by one-year pay rise settlements
between January and September 1999. For 35.4%
of workers the pay increase has been under 16%,
for 22.8% between 16% and 17%, and for 36.2%
between 17% and 19%. In the June quarter, most
workers covered by settlements (60%) obtained a
one-year pay rise of 16% to 17%.
The bottom half of Table 4 shows the percentages
of workers covered by pay rises negotiated in 1999
up to 2001. In the year to September, most of these
workers (57.7%) have seen their pay increased by a
proportion ranging between CPI inflation and
inflation plus three points. It should be pointed out
that the number receiving a pay rise of less than 16%
expanded from 15.8% in the June quarter to 28.8%
at September, and that only 9.5% have obtained a
pay increase between 16% and 21% this year.
Source: National Statistical. Agency, monthly manufacturing sample.
������� #3 ��������������������������<������������
��2�� ���������������������������������������������
# ��
#���
�!��
����
����
� ��
Source: National Statistics Agency, monthly manufacturing sample.
������� �0�������������������������<����8��������
��2�� ���������������������������������������������
���
!��
#��
���
%#��
���%�# ��,%� ���%�" ���%�! ���%�& $��%�� $��%��
0������� 9�"��
���%�# ��,%� ���%�" ���%�! ���%�& $��%�� $��%��
������!"������������������������(������������������
��������'��������������
One-year negotiated rise
< 16 [16–21] [17–19] [19–21.5]
35.4 22.8 36.2 5.6
Two-year negotiated rise
< 16 [16–17] [CPI to CPI+3] [LMW to LMW+2]
28.8 9.5 57.7 4.0
LMW: Legal minimum wage
Source: Ministry of Labour and Social Security.
� ���
0������� 9�"�� � ���
27
� !:���� �������� "������� � ��� � � ������������� "�#���,�������������������������#�;��3����<& ������ ����������������5��������=��3�� �!:���� ��������������� ������ ������������ ����"���������������"���������������� ���������"�������� .����������/"0#����5��"������� �������������������� ����������������
������ � ��� ���� �������� !������ ��
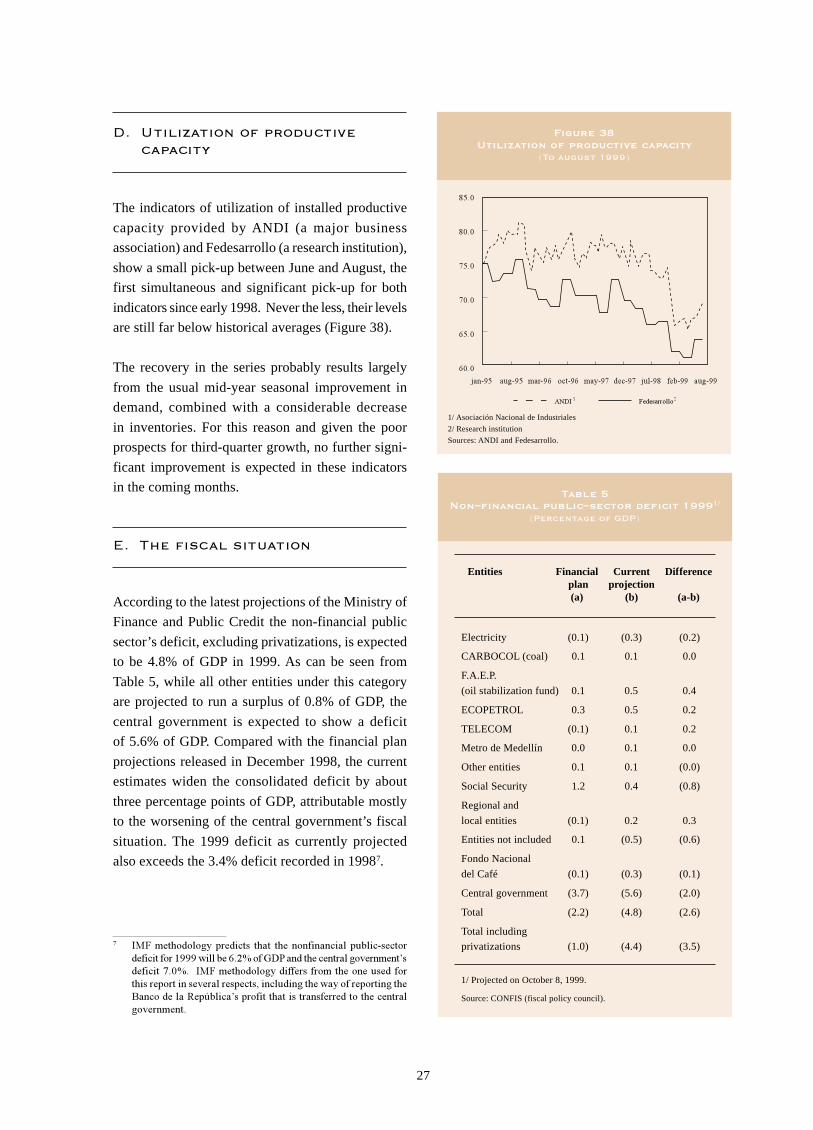
The indicators of utilization of installed productive
capacity provided by ANDI (a major business
association) and Fedesarrollo (a research institution),
show a small pick-up between June and August, the
first simultaneous and significant pick-up for both
indicators since early 1998. Never the less, their levels
are still far below historical averages (Figure 38).
The recovery in the series probably results largely
from the usual mid-year seasonal improvement in
demand, combined with a considerable decrease
in inventories. For this reason and given the poor
prospects for third-quarter growth, no further signi-
ficant improvement is expected in these indicators
in the coming months.
"���#�� ������ ���� ��
According to the latest projections of the Ministry of
Finance and Public Credit the non-financial public
sector’s deficit, excluding privatizations, is expected
to be 4.8% of GDP in 1999. As can be seen from
Table 5, while all other entities under this category
are projected to run a surplus of 0.8% of GDP, the
central government is expected to show a deficit
of 5.6% of GDP. Compared with the financial plan
projections released in December 1998, the current
estimates widen the consolidated deficit by about
three percentage points of GDP, attributable mostly
to the worsening of the central government’s fiscal
situation. The 1999 deficit as currently projected
also exceeds the 3.4% deficit recorded in 19987.
������%3�(����������������(��������������������
����������� �()��
1/ Asociación Nacional de Industriales
2/ Research institution
Sources: ANDI and Fedesarrollo.
������� )>����?�������������������������
�% �����������
�"��
����
&"��
&���
!"��
!���
Entities Financial Current Difference plan projection(a) (b) (a-b)
Electricity (0.1) (0.3) (0.2)
CARBOCOL (coal) 0.1 0.1 0.0
F.A.E.P.
(oil stabilization fund) 0.1 0.5 0.4
ECOPETROL 0.3 0.5 0.2
TELECOM (0.1) 0.1 0.2
Metro de Medellín 0.0 0.1 0.0
Other entities 0.1 0.1 (0.0)
Social Security 1.2 0.4 (0.8)
Regional and
local entities (0.1) 0.2 0.3
Entities not included 0.1 (0.5) (0.6)
Fondo Nacional
del Café (0.1) (0.3) (0.1)
Central government (3.7) (5.6) (2.0)
Total (2.2) (4.8) (2.6)
Total including
privatizations (1.0) (4.4) (3.5)
1/ Projected on October 8, 1999.
Source: CONFIS (fiscal policy council).
$��%�" ���%�" '��%�! ���%�! '��%�& ���%�& $��%�� -��%�� ���%��
�62��� $������� �� �

28
The central government’s total revenues are
projected to grow by 21.7% relative to the 1998 level
(Table 6). An increase of 11.4% is expected in tax
revenues, and of 95.9% in non-tax revenues, which
include among other things profits from operations
of Banco de la República.
Between January and September 1999, effective
operating revenues are calculated at 15,059 billionpesos, representing an execution level of 73.3% with
respect to the Ministry of Finance and Pubic Credit’slatest annual projection.
Tax revenues have been affected by the slowdown ineconomic activity, which has hit both taxes ofdomestic origin and import taxes.
Relative to tax revenues collected between Januaryand September 1998, income tax and VAT show anominal growth of 8.8%, while customs taxes andVAT on imports decline by 23.2%.
������#������������ ���
�"���� �� ���� ��
1999 1998-1999 January-September 19991/ change 1998 1999 change execution
% % %
I. Total revenues (A+B) 20.544.2 21.7 12.273.4 15.059.1 22.7 73.3
A. Tax revenues 16.519.3 11.4 11.143.9 11.781.7 5.7 71.3
Income tax & domestic VAT 11.322.1 13.0 7.561.1 8.229.0 8.8 72.7
Customs & external VAT 3.436.1 (15.9) 3.087.4 2.369.7 (23.2) 69.0
Gasoline 796.0 24.0 478.7 530.0 10.7 66.6
Other 2/ 965.2 4.429.0 16.7 652.8 3.809.0 67.6
B. Non-tax revenues3/ 4.024.9 95.9 1.129.5 3.277.4 190.2 81.4
II. Total expenditures (A + B + C + D) 29.180.9 20.6 17.991.5 19.815.1 10.1 67.9
A. Interest 5.214.8 27.5 3.430.9 4.118.5 20.0 79.0
B. Operating costs 21.065.2 23.0 12.524.7 14.127.4 12.8 67.1
C. Investment 2.042.1 (10.4) 1.767.5 1.283.7 (27.4) 62.9
D. Net loans 858.8 161.2 268.4 285.5 6.4 33.2
III. Deficit or surplus (I - II) (8.636.7) 24.4 (5.718.0) (4.756.0) (16.8) 55.1
IV. Financing 8.636.7 24.4 5.718.0 4.756.0 (16.8) 55.1
A. Net external credit 3.212.9 18.9 2.710.8 1.264.3 (53.4) 39.4
Disbursements 4.796.4 29.6 3.466.6 2.110.6 (39.1) 44.0
Servicing 1.583.5 58.6 755.8 846.3 12.0 53.4
B. Net domestic credit 4.239.1 6.1 2.978.8 3.463.4 16.3 81.7
Disbursements 11.088.2 43.8 6.269.8 9.310.0 48.5 84.0
Servicing 6.849.1 84.5 3.291.0 5.846.5 77.7 85.4
C. Privatizations and other 1.184.7 388.5 28.5 28.3 (0.7) 2.4
V. Deficit as percentage of GDP (5.6) (4.3) (2.9)
1/ Projected on October 8, 1999.2/ Includes the 2/1000 withdrawal levy.3/ Includes profit transfers from the Banco de la República.
Source: CONFIS (fiscal policy council).

29
As regards expenditures, CONFIS (the council on
fiscal policy) has set a target of 29,181 billion pesos
for 1999, which represents growth of 20.6% compared
with total payments in 1998. The growth in transfer
payments is around 28%. Between January and
September the execution percentage for operating
costs was 67.1%, for investment spending 62.9%, and
for interest payments 79.0%. Relative to the same
period in 1998, the growth in total expenditure is
10.1%, in interest payments 20.0%, and in operating
costs 12.8%. Unlike all other expenditure items,
investment spending during this period declines by
27.4%, owing to the government’s adjustment of the
annual target.
Comparison of the execution of revenues and
expenditures shows that the central government’s
accumulated deficit over the first nine months of the
year amounts to 4.756 billion pesos, equivalent to
2.9% of annual GDP. The deficit has been financed
largely from external and internal credit funds, which
show net changes of 1.264 billion and 3.463 billion
pesos, respectively, between January and September.
If the privatization of Carbocol (state coal company)
is not completed before the end of the year, which is
expected to bring in 584 billion pesos in 1999, the
government will have to consider alternative sources
of financing or adjust the last quarter’s payments
target. It should be noted that these projections do
not include the fiscal impact of the subsidies to
mortgage-loan debtors announced by the govern-
ment at the end of September, for there are as yet no
definite estimates of their amount, nor is it known
when they will begin to be granted.
As regards other sectors and entities, mention should
be made of a weakening in social security and in the
electricity sector. The surplus in social security has
declined because of the reduction in the Social Security
Institute’s income received in the form of health-care
and pension contributions. The electricity sector’s
increased deficit is mainly attributable to the fall
in energy demand resulting from the slowdown in
the economy.
At the same time there has been an improvement
in Ecopetrol’s financial situation, thanks to the
favorable performance of world crude prices all this
year. Ecopetrol has, however, been affected by falling
domestic demand for fuel, since income from the sale
of gasoline and other petroleum by-products
represents more than 50% of the company’s total
revenues. Lastly, declining external coffee prices have
weakened the Fondo Nacional del Café’s finances
by more than 0.1% of GDP.
��������������������������������
����������� ������������������������������������ ��������������� ���������������������������������� ��������)�������������������������������������� ��� ������������������������������ ��������������� �)������� �� ������� ���� ����� 2��� �)������ ��������� � ����� � ���� �������@ �����������������������������������������������!�� ���� ��� ������
1�������� ������������� ���������������������������� ������������� ����������������� ��������������� ����)������!����������� �����)��������������������� ������������������������������ %������������ ����'����������������������� ������� �������������� �������������������� ���)�������������� �2������ ���������� �������������=������ ���2�������� ������� ������������������� ���������� ����� ����� ��� ���� ���� %��� ����� ��� ���� ���� ��������'� ���������������� ��� � ������������ ���

30
1�������������������� ����� ���������� ���� � ���������� ���������������� ����������������2������ ���������������� ��������������)������!��������������� ��������� �����������������������-������������������������������������������������)����������� ���1������������ ����������������%��� ������'��������������� �������� ����������� ��%��������� �'����-�����������������������������������
1����������������������� ������ ����� ������������������ �%����)����������������������!������������������� ������ '��������������� ���������������������������������������������� ���1������������� ������� ������2������������������������ ��������� ����������������� �� �� ������ ������������,����������� ������������� ���������)������������������������������ ��� ������ ������������������������������������ �
������������ ������������� �� ������������������������������� � �������������������������������������� ���������� ��������������� �%2������ ��� ����������)�����������'� � ��� ������� �-����������������������������������� �������������������������������������������������(������� �������� ������ ��-���������������������������������� ������������������������������� �� ��� ������������ � � ������ ����� ������ �� ��� ������� ������ ���� �������)������!������������ � ��������� ������������ �������������� ������ ������!� ���� ��������������������
,���������������)�������������� ��������������� ���������������������������������)�������������������� �����A����)���� �������������������������������� ������������ � �������������� ����� ����2��������� ���������������������������������� ������ ����1����� �������� ����� ����������������������������������� �� �2�������������������������� ����������)����������������������� ����������� ������ � �������� ������ ���������� ����� ������ �� ������������� ������ ������� ����� ����������� �� ������������� � ������������������������������=��������������������� ��� ������� ��������������������� ������ ������������ ������������������������������� ������������������� ������������������������������������������������
;� ������������ ������������� �� ������������������������������������������������!�������� ��������������������������� !����������1��������������� ������������������������������������������!�������������������������������������)��������������������)����������������� ������� ����������������������������������������������� ���������� �������������������������@ ������������ ��� ���B��������� ����� ���� ���� �)������� ����� � � �������� ������ ���� ���!�����-��������������)��������������� ������������������������� � � �2��� ������ ���� ������������ ���������������������������������)������������� ��������������������
1����� ����������������� �� ������������������������ !�������������������������������������������� ��������� �� ����������������������������� ����� ������������������������������������������)����������������������������������)��������������������������������������� ���������� ����2�� ������ ������� ���� ������������������ ������������ � � ����3�� �-������� ���������������������������������������������� ���������������� ���������������� ���������������������������������� ������������������
1��3������@ ���� ������������� �������������������������������������������� ���"������ �� �)�������������������������������������������������"***���������� �� ������� ����9����� �����������������������������������)� ������������� �������������������������������%����� ���������������)���������������������2���������� ��������'����������������������������@ ����������������� ����������������� ���������������������������,��������� ����������������������2 �������������������������� 2��������� !���������������������� ��������

31
���
���������������������� �
������� �5���������������������������2������
������������
$��%�� ���%�� ���%�� '��%�� $��%�� ���%��
�"��
����
�"��
����
"��
���
Survey conducted in
�������!�@��������������������������������
������������
#"��
#���
�"��
����
�"��
����
"��
���
�������!*5�����������������������������<��������
������������
����
�"��
����
"��
���
$� ��� ��������� �������!�
.�������
The September 1999 Inflation Expectations Survey
shows inflation expectations of 12.2% by the end of
the year. This is 1.3 percentage points down on the
June figure (Figure 39).
The September survey also shows a downward trend
in the third quarter of this year in long-term inflation
expectations, with agents expecting a 11.3%
inflation by December 2000, down from 12.2% in
June (Figure 40).
Devaluation is expected by agents to average 27.3%
by the end of 1999 (Figure 41).
GDP for 1999 is predicted to shrink by 1.6%: a
worsening of 1.8 percentage points in expectations
relative to June (Figure 42).
Other survey findings show that, on average, firms
have raised their workers’ nominal pay for 1999
by 15.5%, 1.5 percentage points less than in 1998
(Figure 43). And, on average, they have increased
their product prices for 1999 by 10.5%, down from
the 14.9% increase recorded at December 1998
(Figures 43 and 44).
The September survey’s section on economic activity
(Figures 45 and 46) shows that in the past 12 months
52% of respondents implemented fewer projects than
planned, while 32% carried out all planned projects.
For the next 12 months, 57% of respondents plan to
Survey conducted in
Survey conducted in
$��%�� ���%�� ���%�� '��%�� $��%�� ���%��
:3�� ����5�� :3�� ����5�� :3�� ����5�� :3�� ����5�� :3�� ����5�� :3�� ����5��
$��%�� ���%�� ���%�� '��%�� $��%�� ���%��
:3�� ����5�� :3�� ����5�� :3�� ����5�� :3�� ����5�� :3�� ����5�� :3�� ����5��

32
�������!!"���������������������������
������������
�"��
� ��
�#��
����
����
����
�������!#5����� ��������������������������������."1
����������� ��2�������������
!�
"�
�
#�
��
��
�
�������!%"�,������������������������ ��2�
������������
"�
�
#�
��
��
�
�������! 3 ������������������������������ �
������������
����
����
����
�&��
�!��
�"��
�������!����������4@"���<�2
������������
��
#��
���
���
���
%���
%���
operate with the same productive capacity, whereas
12% intend to invest in expanding it and 21% mean
to reduce it.
Lastly, questions about employment (Figures 47 and 48)
have provided the information that for the next quarter
50% of respondents will keep the same number of
employees, while 40% will reduce theirs. For next year,
48% of respondents plan to keep their workforce
unchanged, 30% are thinking of reducing theirs, and
only 13% intend to hire more employees.
Survey conducted in
Survey conducted in
$��%�� ���%�� ���%�� '��%�� $��%�� ���%��
Survey conducted in
:3�� ����5�� :3�� ����5�� :3�� ����5�� :3�� ����5�� :3�� ����5�� :3�� ����5��
:3�� ����5�� :3�� ����5�� :3�� ����5�� :3�� ����5�� :3�� ����5�� :3�� ����5��
$��%�� ���%�� ���%�� '��%�� $��%�� ���%��
$��%�� ���%�� ���%�� '��%�� $��%�� ���%��
�� ������������� � �������� ����������������� ����� ���
������� � !���� �"��� #$������ ����� ���

33
�������!�&�'�������������������-������
������������
"�
�
#�
��
��
�
�������!)&�'�����������������������
������������
"�
�
#�
��
��
�
������ !�������� �"� %����� � ����� ���
������ !�������� �"� %����� � ����� ���

34
� ������������� �$��������5��"�����������������
��
� ��� ���� ����� ����
����"���� �����%��
World economic conditions have improved signi-
ficantly in recent months. Fears that the mid-1998
Russian crisis and the Brazilian crisis at the beginning
of this year would impair growth in developed
countries and impede recovery in several emergent
economies in South-East Asia and Eastern Europe
have gradually faded away. Published figures on
world economic performance in the first half of the
year have confirmed the better outlook for growth
(Table 7).
Economic growth in the United States was satisfactory
in the first two quarters of the year, and prospects for
the rest of the year are equally good. At 4.3% and
1.8% the growth rates for the first and second quarters,
respectively, were quite acceptable and in line with
figures recorded in recent years. Although the second-
quarter growth (1.8% annualized) was lower than
several analysts expected, this was largely because
of stock reductions, so a pick-up can be predicted for
the third and fourth quarters.
Domestic demand in the United States for the coming
months should continue to drive economic growth, since
on the external front the US economy has began to show
a substantial and mounting deficit. However, a good
part of the impetus to domestic demand in recent years
has come from asset appreciation, mainly in the equity
market, and the rest of the year may see some correction
in share prices, leading to a slowdown in consumption
and investment. GDP growth in the United States for
1999 is currently projected to stand around 3.7%, up a
little on projections three months ago. Although growth
is expected to slow down in 2000, it should continue to
run higher than 2%8 (Table 8).
Growth in European-Union countries slowed in the
first half of this year, but this tendency is expected
to reverse and a new upswing in growth indicators
is predicted for the third and fourth quarters. This
forecast is based on the recent improvement in
���������� �����<�28�����
First Secondquarter quarter
Developed countries 1/United States 4.3 1.8
Germany 1.8 0.2
Japan 8.1 0.9
Emerging countries 2/Asia
South Korea 4.6 9.8
Malaysia (1.3) 4.1
Indonesia (9.5) 1.8
Thailand 0.9 n.a.
Latin AmericaArgentina (3.0) (4.9)
Brazil (0.1) (0.8)
Chile (2.1) (3.2)
Ecuador (3.2) n.a.
Mexico 1.9 3.2
Peru 1.9 4.3
Venezuela (9.3) (9.6)
n.a. Not available1/ Growth in the quarter compared with the previous quarter,annualized.2/ Growth in the quarter compared with the same quarter the yearbefore.
Sources: Bloomberg, The Economist, WEFA, and central banks.

35
������)��� �����<�28�����������***
business climate and short-term economic activity
in Germany, the region’s largest economy. It is also
based on the easing of monetary policy in recent
months, made possible by good inflation
performance. It should be noted that the euro’s
devaluation against the dollar has, to some extent,
given a boost to external demand. The 11 countries
making up the Union are currently expected to show
a growth in the range of 1.8% - 2.3% for 1999 and
at least 2.4% for the year 2000.
The Japanese economy, for its part, experienced a
sharp upturn (8.1% annualized, according to the latest
estimates) during the first quarter of 1999 relative to
the last quarter of 1998, the first major quarterly
growth since the crisis in Asian economies. This
growth, largely driven by an aggressive public-
spending programme, is considered by various
analysts to be unsustainable because a good many
of the financial problems that led to the crisis continue
to exist. Besides, the various indicators of business
climate suggest that great uncertainty persists among
economic agents, and it is accompanied by a
weakening of real incomes that makes it impossible
1999 2000
Developed countriesUnited States 3.7 2.6
European Union 2.0 2.7
Germany 1.4 2.5
Japan 1.0 1.5
Emerging countriesMalaysia 2.4 6.5
Indonesia (0.8) 2.6
Thailand 4.0 4.0
Korea 6.5 5.5
Argentina (3.0) 1.5
Brazil (1.0) 4.0
Chile (0.4) 5.5
Ecuador (7.0) 1.5
Mexico 3.0 5.0
Peru 3.0 5.0
Venezuela (7.6) 1.6
Source: IMF, World Economic Outlook, September 1999.
to predict a sustained growth in private spending
in the medium term. Even so, growth projections for
1999 (between -0.8% and 1.7%) and for 2000
(between -1.2% and 2.7%) are somewhat better than
actual rate registered in 1998 (-1.9%).
With regard to emergent economies, two types of
countries should be considered (Figure 7). First there
are the countries of South-East Asia, most of which
registered positive growth in the first half of 1999, in
some cases, such as Korea and Malaysia, at rates
prevailing before the 1997 crisis. These substantial
growth levels, which received an impetus from the
buoyancy of the Japanese economy, may not be kept
up during the rest of the year or in 2000. Even so,
these economies are expected to continue to grow,
but at rates that will depend on how fast structural
reforms are implemented and on the future stability
of the Chinese economy. China’s economic outlook
is still uncertain, particularly on the exchange front.
The economies of Eastern Europe, seriously affected
by the Russian crisis, have also begun to show signs
of recovery. The European Union’s improved growth
outlook for the rest of the year should strengthen the
signs of upturn in several East-European emergent
countries. Russia, for its part, continues to under-
perform the region’s other economies, but various
analysts presently consider it to be entering on a stage
of stabilization.
The economies of Latin America are the ones with
the most disturbing prospects. In 1998, such
factors as falling commodity prices, and instability
in the world financial markets from the Russian
crisis combined to produce a sharp economic
slowdown. In almost all countries of the region
exchange-rate instability led to a large increase
in interest rates, which translated into turn
collapse of domestic demand.
The slowdown intensified early this year because
of Brazil’s exchange crisis. With the result that several
countries saw their economies contract in the first
half of 1999. In Venezuela and Ecuador, two of

36
Colombia’s major trading partners, the economy
contracted by 9.8% and 3.2%, respectively, in the first
quarter of the year compared with the same period in
1998. Appreciable contractions have also occurred
in Chile, Argentina, and Brazil.
One notable exception has been Mexico, which has
managed to keep clear of the region’s crisis withgrowth rates of 1.9% and 3.2% in the first and
second quarters, probably thanks to its close ties
to the US economy.
Growth trends in Latin America for the rest of 1999
are not very clear. In most countries nominal interestrates have decreased significantly, which should help
to revive consumption and investment. In fact, in
Brazil, one of the region’s crucial economies,performance has not been as poor as originally
predicted. In principle, this points to a possible rapid
upturn in Brazil and, to some extent, in otherMercosur countries, given their close trading
relations with Brazil.
Moreover, low inflation rates observed in most
countries give central banks scope to loosen monetarypolicy. In this case, however, the impact on growth is
more difficult to foresee, because in most countries
lower inflation has prevented real interest rates fromfalling quickly, thereby delaying a revival in demand.
Similarly, there have been inflation rises, such as
Brazil’s during July, which, if not transitory, may workagainst any further reductions needed in nominal
interest rates.
Table 8 shows economic growth projections made
by a number of analysts for various Latin-Americancountries. Except for Mexico and Peru, the other
countries are very unlikely to show any positive
growth. The economies of Venezuela and Ecuador areexpected to contract by 7.6% and 7.0%, respectively.
Colombia’s overall destination-weighted export
growth is expected to be 0.6% for 1999, less than theactual rate in 1998. That this figure is no lower than
0.6%, despite the poor performance of the region’s
economies, is thanks to the heavy weighting ofUS growth (47% of Colombia’s exports go the US).
For the year 2000 Colombia’s destination-weighted
export growth is forecast to be 2.0%.
����& ���� ���������'
At the end of September the United States Federal
Reserve decided to leave interest rates on federal
funds unchanged but hinted at a possible upward
move for the following weeks. Earlier, on August 24
the Fed had raised the rates by 25 basis points for the
second time this year, the first having been in June.
The Fed has justified the recent rises by the fact the
US economy continues to grow apace, and that this,
together with signs of upturn and faster growth in most
other economies, could give rise to undesirable
inflationary pressures9.
Some substantial inflationary pressures are presently
anticipated in the United States, which may lead to a
reversal in monetary policy and to a higher rise in
interest rates for the rest of the year. In any case,
consumer price inflation for 1999 is currently
expected to be around 2.2%; this is slightly higher
than in 1998 (1.6%) but presents no risk to the Fed’s
general price stability target. A somewhat higher
inflation, close to 2.5%, is forecast for 2000.
Several factors have been responsible for keeping
prices under control in the United States and also in
several other economies. They include notably: major
technological change in recent years, which has
improved work productivity; greater competition,
resulting from wider trade opening in various
economies; introduction of flexibility in labour
market; and, lastly, very weak demand in the countries
affected by exchange and financial crises, which has
reduced the prices of several commodities and
manufactured goods in the world market. To the extent
that a number of these factors continue to exist for
some time longer, the inflation scenario will be
favourable in the medium term not only for the United
���%�� � ��8��� ���������<�������%�� ���6����������

37
States but also for the rest of the developed countries
and most emergent economies.
This price-stability scenario has been partially altered
to date by the substantial rise in oil prices over the
past six months.
Accordingly the Fed may decide to make further
increases in interest rates, at least during the rest of
the year. Even so, the marked improvement in
variables such as productivity would still seem to
provide scope for strong economic growth, without
the labour market coming under such excessive
pressure as would jeopardize stability in nominal
wages and production costs.
It is important to recall that the Fed reduced the rate
by 75 basis point in 1998, in response to the world
economic slowdown. So, the increases so far this year
may be regarded as intended to bring rates back to
their original level, as the world economy recovers.
If the upturn in the world economy continues, then a
further rise of up to 25 basis points may be expected
in the coming months.
In the course of next year the Fed may see a need for
raising interest rates if productivity gains begin to
slacken, and if the country’s trade-deficit growth
causes the dollar to fall substantially against the yen
and the euro. A further reason for doing so would be
a rising trend in commodity prices, resulting from an
upswing in emergent markets, for one of the factors
that have helped so far to keep US inflation under
control has been the low level of commodity prices.
In the case of Europe, given the low rates of inflation
and growth so far this year, no monetary tightening
is expected to translate into a major rise in interest
rates, at least for the rest of the year.
Interest-rate movements in the United States and
Europe do not play an important part in raising the
cost of credit to Latin-American countries, rather it
is the internal conditions in each country and in
the region that do so. This fact is reflected by the
persistently high levels of sovereign-debt spread
all this year for several countries in the region.
Developments such as Ecuador’s partial default on
Brady-coupon payments, announced in August,
tend to intensify this problem.
In Colombia’s case, spreads for 10- and 30-year bonds
remained above 750 basis points in August. These
spreads are similar to levels recorded during much
of the year and correspond to countries such as
Argentina, Venezuela and Brazil that have not
traditionally enjoyed investment-grade ratings. In
this respect, it is clear that the market had already
taken for granted Colombia’s downgrading to
under investment-grade rating a good while before
the date on which Moody’s proceeded to make it
effective (Figures 49 and 50).
�������� ����� ��
The most notable development in world commodity
prices has been the steep rise in the price of oil. At
the end of the third quarter it continued on its upward
trend, with the barrel of crude fetching $4 more than
in June. For Colombian oil this meant an average
international selling price, in September, of $20.9
per barrel, a level not seen since the end of 1997
(Figure 51).
At the moment it is not clear how much higher oil
prices can rise. On the one hand there is upward
pressure from world demand for crude, which shows
signs of expanding as a result of faster growth in
South-East Asia. On the other hand experts believe
that production capacity remains substantially
underutilized, which may encourage several OPEC
countries not to adhere to their export allocations,
thereby causing prices to fall. What is clear, however,
is that prices can hardly go up much higher than now,
and their stability will depend to a large extent on
discipline among members of the exporters’ cartel.
Regarding Colombian coffee, in September the external
price fell to one of its lowest levels in recent times. At

38
�������%*/��������� *(����������(7 �����������
�"����� ���� !��*+'����#��%�������" ����
�������
��"����
�������
�����
!����
#����
���
Source: Bloomberg.
�������!�/����������*(����������(7 �����������
�"����� ���� !���+'����#��%�������" ����
�������
�������
��"����
�������
�����
!����
#����
���
Source: Bloomberg.
$��%�� '��%�� '��%�� $��%�� ���%�� ��,%�� $��%�� '��%�� '��%�� $��%�� ���%��
$��%�� '��%�� '��%�� $��%�� ���%�� ��,%�� $��%�� '��%�� '��%�� $��%�� ���%��
&����� �� �� ��"������ ;���<%��� � � �#��
� � �#�� ;���<%��� &����� �� �� ��"������

39
the end of the month the price in the New York market
was less than a dollar a pound (Figure 52). The reasons
for this fall are agents’ perception that the market is
amply supplied. This perception is based on Brazil’s
large harvest after the frost period, a good harvest in
Central America, a growing supply from Vietnam, and
a record harvest in Mexico.
�������%�7�������<�������������� �������
�) ���������������
� ��
����
�!��
����
���
Source: Ecopetrol (state oil company).
�������%�5�����������������������
�) ��������� ����
#��
��&
��
���
���
��"
���
���
Source: Federación Nacional de Cafeteros de Colombia.
$��%�& '��%�& ���%�& $��%�� '��%�� ���%�� $��%�� '��%�� ���%�� $��%�& '��%�& ���%�& $��%�� '��%�� ���%�� $��%�� '��%�� ���%��
The World Coffee Organization estimates that
during the 1998-1999 coffee year the world supply
of coffee has exceeded world consumption by four
million bags. Since the present oversupply is likely
to last, the international price of coffee is forecasted
to remain at its present levels for some time.

40
�
� ������ ����������
������ ���������������������
Banco de la República’s inflation forecasts for
December 1999 are based on the assumption that
GDP growth will be negative during the year.
It is further assumed that the economy will begin
to recover in the year 2000, displaying a moderately
positive growth. The monetary base is assumed to
remain at the midpoint of the corridor defined by
the Bank’s Board of Directors, both for the rest of
1999 and during 2000. The exchange rate is not
expected to vary much between the end of the third
quarter and the end of the year, and to undergo a
devaluation in the year 2000 consistent with the
current level of the real exchange rate.
The ARIMA model predicts an inflation of 10.1%
for December 1999, 0.9 percentage points lower than
the projection made the previous quarter.
The combination of forecasts of the Bank’s structural
models indicates that inflation will be 9.8% by the
end of 1999, up from 8.3% predicted in June. This
increase is due to upward revision in the assumptions
about nominal devalua-tion and monetary aggregates
for this year.
The 12-month forecast from the combination of
forecasts, yields an inflation of 9.8% at September
2000, compared with 10.4% projected by the same
methodology for June of that year.
����&������ ��!���� �������� ��
This section evaluates how inflation will be affected
by alternative food-price paths between September
and December of this year. The projections use as
input the ARIMA forecast for inflation excluding
food: with information to September 1999, this is
projected to be 10.1%, one percentage point lower
than that obtained with information to June.
To obtain forecast for food inflation and the CPI,
the historical behavior of the ratio of food to non-
food prices since 1960 for the four months from
September to December was studied, and four
alternative scenarios were defined.
Table 9 precents the projections for food inflation and
the CPI, based on the following assumptions about
the behavior of relative food prices from September
to December 1999: (1) average for post-Niño years,
(2) 1993, (3) year of highest growth since 1960, and
(4) year of lowest growth since 1960. According to
this exercise, inflation as measured by the CPI at the
end of the year will run between 7.3% and 10.7%
(scenarios 4 and 3, respectively). If relative food
prices follow a path similar to that of 1993, inflation
as measured by the CPI will be 9%. Lastly, if relative
food prices follow a path similar to the average of
post-Niño years, inflation will reach 9.1%.
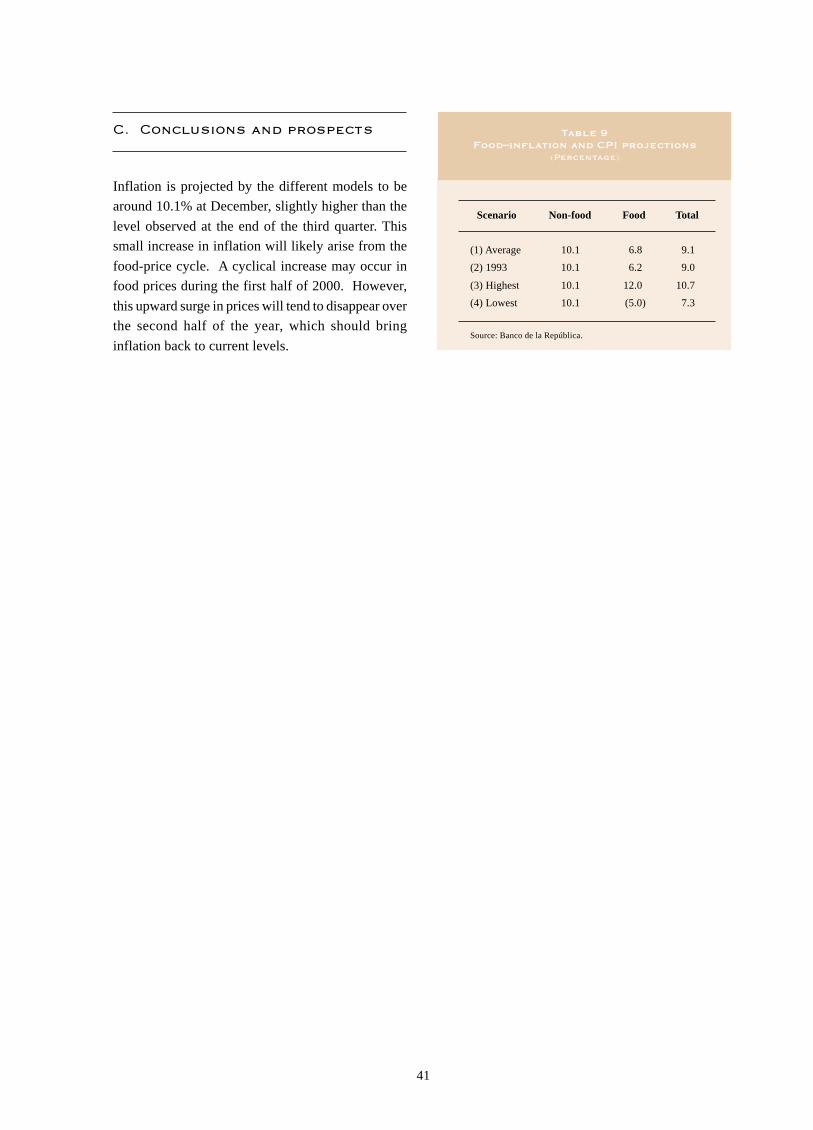
41
���������(�������������"5���,������
������������
����������� ����������������
Inflation is projected by the different models to be
around 10.1% at December, slightly higher than the
level observed at the end of the third quarter. This
small increase in inflation will likely arise from the
food-price cycle. A cyclical increase may occur in
food prices during the first half of 2000. However,
this upward surge in prices will tend to disappear over
the second half of the year, which should bring
inflation back to current levels.
Scenario Non-food Food Total
(1) Average 10.1 6.8 9.1
(2) 1993 10.1 6.2 9.0
(3) Highest 10.1 12.0 10.7
(4) Lowest 10.1 (5.0) 7.3
Source: Banco de la República.

42
����������������� ����������������� ����������������� ������� ���������������
���� ��� ����������� ���������� ������������� ����� �������������� ���� ���� ��� ��� ���� �
��� ���������!���������������"����#�����$%%%�