2-3: modeling real-world data with...
TRANSCRIPT

Modeling Real-World Datawith Matrices
TRAVEL Did you ever go on a vacation and realize that you forgot topack something that you needed? Sometimes purchasing those itemswhile traveling can be expensive. The average cost of some items
bought in various cities is given below.
Data like these can be displayed or modeled using a matrix. A problem related tothis will be solved in Example 1.
A matrix is a rectangular array of terms called elements. The elements of amatrix are arranged in rows and columns and are usually enclosed by brackets. A matrix with m rows and n columns is an m � n matrix (read “m by n”). Thedimensions of the matrix are m and n. Matrices can have various dimensions andcan contain any type of numbers or other information.
2 � 2 matrix 2 � 5 matrix 3 � 1 matrix
� � � � � �Special names are given to certain matrices. A matrix that has only one
row is called a row matrix, and a matrix that has only one column is called acolumn matrix. A square matrix has the same number of rows as columns.Sometimes square matrices are called matrices of nth order, where n is thenumber of rows and columns. The elements of an m � n matrix can berepresented using double subscript notation; that is, a24 would name the elementin the second row and fourth column.
� � aij is the element in the ithrow and the jth column.
a1na2na3n.
.
.amn
………
.
.
.…
a13a23a33.
.
.am3
a12a22a32.
.
.am2
a11a21a31.
.
.am1
�23
11
6.77.2
2.50.5
�1.1�22
3.4�3.4
0.23.4
�12
�
��34
�
��35
�
3
The plural ofmatrix is matrices.
78 Chapter 2 Systems of Linear Equations and Inequalities
2-3
Real World
Ap
plic ation
OBJECTIVES• Model data
using matrices.• Add, subtract,
and multiplymatrices.
$3.97Mexico City
$36.57Tokyo
$63.71Tokyo
$7.43Mexico City
$32.25Mexico City
Los Angeles$20.49
$18.98Atlanta
Los Angeles$7.41
Los Angeles$4.21$4.03
Atlanta
$6.78Atlanta
$7.08Tokyo
Source: Runzheimer International
The element 3is in row 2,column 1.

TRAVEL Refer to the application at the beginning of the lesson.
a. Use a matrix to represent the data.
b. Use a symbol to represent the price of pain reliever in Mexico City.
a. To represent data using a matrix, choose which category will berepresented by the columns and which will be represented by the rows.Let’s use the columns to represent the prices in each city and the rows torepresent the prices of each item. Then write each data piece as you wouldif you were placing the data in a table.
Atlanta Los Angeles Mexico City Tokyofilm (24 exp.) $4.03 $4.21 $3.97 $7.08pain reliever (100 ct) $6.78 $7.41 $7.43 $36.57blow dryer $18.98 $20.49 $32.25 $63.71
Notice that the category names appear outside of the matrix.
b. The price of pain reliever in Mexico City is found in the row 2, column 3 ofthe matrix. This element is represented by the symbol a23.
Just as with numbers or algebraic expressions, matrices are equal undercertain conditions.
Find the values of x and y for which the matrix equation � � � � � istrue.
Since the corresponding elements are equal, we can express the equality of thematrices as two equations.y � 2x � 6x � 2y
Solve the system of equations by using substitution.
The matrices are equal if x � 4 and y � 2. Check by substituting into thematrices.
Matrices are usually named using capital letters. The sum of two matrices, A � B, exists only if the two matrices have the same dimensions. The ijth elementof A � B is aij � bij.
2x � 62y
yx
Lesson 2-3 Modeling Real-World Data with Matrices 79
� �
Real World
Ap
plic ation
Example 1
Two matrices are equal if and only if they have the same dimensions andare identical, element by element.Equal Matrices
y � 2x � 6y � 2(2y) � 6 Substitute 2y for x.y � 2 Solve for y.
x � 2(2) Substitute 2 for y inx � 4 the second equation
to find x.
Example 2
The sum of two m � n matrices is an m � n matrix in which the elementsare the sum of the corresponding elements of the given matrices.
Addition ofMatrices

Find A � B if A � � � and B � � �.
A � B � � �� � �
You know that 0 is the additive identity for real numbers because a � 0 � a.Matrices also have additive identities. For every matrix A, another matrix can befound so that their sum is A. For example,
if A � � �, then � � � � � � � �.The matrix � � is called a zero matrix. The m � n zero matrix is the
additive identity matrix for any m � n matrix.
You also know that for any number a, there is a number �a, called theadditive inverse of a, such that a � (�a) � 0. Matrices also have additive
inverses. If A � � �, then the matrix that must be added to A in order to
have a sum of a zero matrix is � � or �A. Therefore, �A is the additive
inverse of A. The additive inverse is used when you subtract matrices.
Find C � D if C � � � and D � � �.
C � D � C � (�D)
� � � � � �� � � or � �
You can multiply a matrix by a number; when you do, the number is called ascalar. The product of a scalar and a matrix A is defined as follows.
.
621
15
�5
4 � 23 � (�1)
�4 � 5
9 � (�8)�1 � 6
0 � (�5)
2�1
5
�86
�5
43
�4
9�1
0
�21
�5
8�6
5
43
�4
9�1
0
�a12�a22
�a11�a21
a12a22
a11a21
00
00
a12a22
a11a21
00
00
a12a22
a11a21
a12a22
a11a21
02
72
�84
1 � (�1)�8 � 10
0 � 75 � (�3)
�2 � (�6)0 � 4
�110
7�3
�64
1�8
05
�20
80 Chapter 2 Systems of Linear Equations and Inequalities
GraphingCalculatorAppendix
For keystroke instructionon entering matrices andperforming operationson them, see pages A16-A17.
Example 3
The difference A � B of two m � n matrices is equal to the sum A � (�B),where �B represents the additive inverse of B.
Subtraction of Matrices
Example 4
The product of a scalar k and an m � n matrix A is an m � n matrixdenoted by kA. Each element of kA equals k times the correspondingelement of A.
ScalarProduct

If A � � �, find 3A.
3� � � � � Multiply each element by 3.
� � �
You can also multiply a matrix by a matrix. For matrices A and B, you can findAB if the number of columns in A is the same as the number of rows in B.
� � � � � � � �2 � 3 3 � 4 3 � 4 3 � 4
Since 3 � 3, multiplication is possible. Since 4 3, multiplication is not possible.
The product of two matrices is found by multiplying columns and rows.
Suppose A � � � and X � � �. Each element of matrix AX is the product
of one row of matrix A and one column of matrix X.
AsX � � � � � � � �In general, the product of two matrices is defined as follows.
Use matrices A � � �, B � � �, and C � � � to find
each product.
a. AB
AB � � � � �AB � � � or � �
b. BC
B is a 2 � 3 matrix and C is a 2 � 3 matrix. Since B does not have the samenumber of columns as C has rows, the product BC does not exist. BC isundefined.
4224
�21�3
2130
7(6) � 0(�2)5(6) � 3(�2)
7(�3) � 0(4)5(�3) � 3(4)
7(3) � 0(5)5(3) � 3(5)
6�2
�34
35
03
75
4�1
�1�2
62
6�2
�34
35
03
75
a1y1 � b1y2a2y2 � b2y2
a1x1 � b1x2a2x1 � b2x2
y1y2
x1x2
b1b2
a1a2
y1y2
x1x2
b1b2
a1a2
9�8
3
12�4
4
003
10
�2
0�3
2
122
303
56
�5
116
0�2�1
20
�3
0�4
1
12
�80
31
�30
24
321
�3
�129
�9
3(�1)3(0)3(8)
3(1)3(7)
3(�1)
3(�4)3(3)
3(�3)
�108
17
�1
�43
�3
�108
17
�1
�43
�3
Lesson 2-3 Modeling Real-World Data with Matrices 81
Example 5
The product of an m � n matrix A and an n � r matrix B is an m � r matrixAB. The ijth element of AB is the sum of the products of the correspondingelements in the ith row of A and the jth column of B.
Product ofTwo Matrices
Example 6

CommunicatingMathematics
Guided Practice
SPORTS In football, aplayer scores 6 points for a touchdown (TD), 3 points for kicking a fieldgoal (FG), and 1 point forkicking the extra pointafter a touchdown (PAT).The chart lists the recordsof the top five all-timeprofessional footballscorers (as of the end of the 1997 season). Use matrix multiplication to findthe number of points each player scored.
Write the scorer information as a 5 � 3 matrix and the points per play as a 3 � 1 matrix. Then multiply the matrices.
BlandaLowery TDStenerud FGAnderson PATAndersen
Blanda BlandaLowery LoweryStenerud StenerudAnderson AndersonAndersen Andersen
82 Chapter 2 Systems of Linear Equations and Inequalities
Scorer TD FG PAT
George Blanda 9 335 943Nick Lowery 0 383 562Jan Stenerud 0 373 580Gary Anderson 0 385 526Morten Andersen 0 378 507
Source: The World Almanac and Book of Facts, 1999
Read and study the lesson to answer each question.
1. Write a matrix other than the one given in Example 1 to represent the data ontravel prices.
2. Tell the dimensions of the matrix . � �.3. Explain how you determine whether the sum of two matrices exists.
4. You Decide Sarah says that � � is a third-order matrix. Anthony
disagrees. Who is correct and why?
Find the values of x and y for which each matrix equation is true.
5. � � � � � 6. [18 24] � [4x � y 12y] 7. [16 0 2x] � [4x y 8 � y]x � 3y � 5
2yx
3025
22
�12
3�4
02
45
�2�1
03
4�1
C HECK FOR UNDERSTANDING
TD FG PATpts
� � � ��
pts pts
� � � � �20021711169916811641
9(6) � 335(3) � 943(1)0(6) � 383(3) � 562(1)0(6) � 373(3) � 580(1)0(6) � 385(3) � 526(1)0(6) � 378(3) � 507(1)
631
943562580526507
335383373385378
90000
Real World
Ap
plic ation
Example 7

Practice
27. � �28. impossible29. impossible
30.� �31. � �
32. � �33.� �34. � �35. � �36. � �37. � �38. � �26
1�15�53
355
25�30
2�5
�3�3
142
�25
33
�14�2
00
2�8
12�2
80
�8
41216
0�816
1�1
3
�3�3�4
475
�27
�25
5�1�1
�134
43
13
129
8�7
Use matrices X, Y, and Z to find each of the following. If the matrix does notexist, write impossible.
X � � � Y � [0 �3] Z � � �8. X � Z 9. Z � Y 10. Z � X 11. 4X 12. ZY 13. YX
14. Advertising A newspaper surveyed companies on the annual amount ofmoney spent on television commercials and the estimated number of peoplewho remember seeing those commercials each week. A soft-drink manufacturerspends $40.1 million a year and estimates 78.6 million people remember thecommercials. For a package-delivery service, the budget is $22.9 million for 21.9 million people. A telecommunications company reaches 88.9 million peopleby spending a whopping $154.9 million. Use a matrix to represent this data.
Find the values of x and y for which each matrix equation is true.
15. � � � � � 16. [9 13] � [x � 2y 4x � 1]
17. � � � � � 18. [x y] � [2y 2x � 6]
19. � � � � � 20. � � � � �21. [2x y �y] � [�10 3x 15] 22. � � � � �23. � � � � � 24. � � � � �25. Find the values of x, y, and z for 3� � � � �.
26. Solve �2� � � � � for w, x, y, and z.
Use matrices A, B, C, D, E, and F to find each of the following. If the matrix doesnot exist, write impossible.
A � � � B � � � C � � � D � � �E � � � F � � �
27. A � B 28. A � C 29. D � B 30. D � C 31. B � A
32. C � D 33. 4D 34. �2F 35. F � E 36. E � F
37. 5A 38. BA 39. CF 40. FC 41. ED
42. AA 43. E � FD 44. �3AB 45. (BA)E 46. F � 2EC
00
�14
�61
2�5
�41
83
20
�2
134
0�2
4
3�1
1
�200
459
58
3�1
71
5�6
�42x � 8z
�166
x � z8
w � 53y
63x � y
156z
y � 13z
x4
x2
25
5 � yy � 4
x2 � 1x � y
2y � x4 � 2x
0y2
36
x � yy
6xy � 1
10 � x
�122
12y
111
4x � 3yx � y
3y5x � 3y
278
15 � x2y
4x5
2x � 1y � 5
yx
3�2
�10
16
4�2
Lesson 2-3 Modeling Real-World Data with Matrices 83
E XERCISES
A
B
C
www.amc.glencoe.com/self_check_quiz
Applicationsand ProblemSolving
47. Find 3XY if X � � � and Y � � �.
48. If K � � � and J � � �, find 2K � 3J.
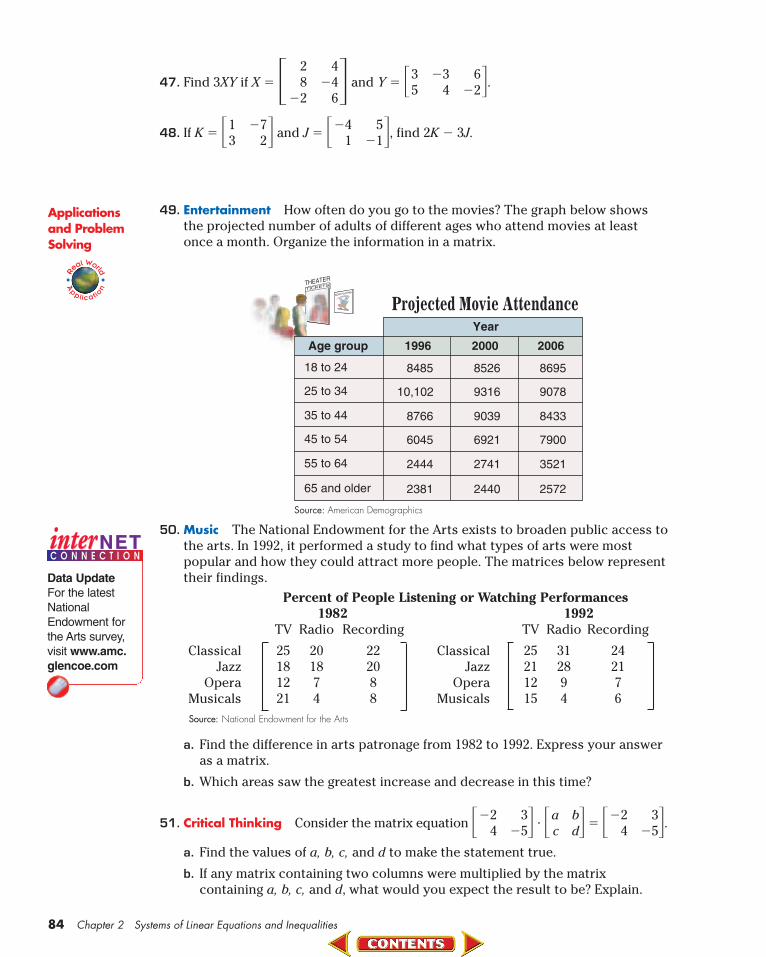
49. Entertainment How often do you go to the movies? The graph below showsthe projected number of adults of different ages who attend movies at leastonce a month. Organize the information in a matrix.
50. Music The National Endowment for the Arts exists to broaden public access tothe arts. In 1992, it performed a study to find what types of arts were mostpopular and how they could attract more people. The matrices below representtheir findings.
Percent of People Listening or Watching Performances1982 1992
TV Radio Recording TV Radio Recording
Classical 25 20 22 Classical 25 31 24Jazz 18 18 20 Jazz 21 28 21
Opera 12 7 8 Opera 12 9 7Musicals 21 4 8 Musicals 15 4 6Source: National Endowment for the Arts
a. Find the difference in arts patronage from 1982 to 1992. Express your answeras a matrix.
b. Which areas saw the greatest increase and decrease in this time?
51. Critical Thinking Consider the matrix equation � � � � � � �.a. Find the values of a, b, c, and d to make the statement true.
b. If any matrix containing two columns were multiplied by the matrixcontaining a, b, c, and d, what would you expect the result to be? Explain.
3�5
�24
bd
ac
3�5
�24
TICKETS
NOW PLAYING
THEATER
1996
8485
10,102
8766
6045
2444
2381
2000
8526
9316
9039
6921
2741
2440
2006
Year
8695
9078
8433
7900
3521
2572
Age group
18 to 24
25 to 34
35 to 44
45 to 54
55 to 64
65 and older
Source: American Demographics
5�1
�41
�72
13
6�2
�34
35
4�4
6
28
�2
84 Chapter 2 Systems of Linear Equations and Inequalities
Data UpdateFor the latestNationalEndowment forthe Arts survey,visit www.amc.glencoe.com
Real World
Ap
plic ation
52. Finance Investors choose different stocks to comprise a balancedportfolio. The matrix below shows the prices of one share of eachof several stocks on the first business day of July, August, andSeptember of 1998.
July August September
Stock A $33 �1136� $30 �
1156� $27 �
14
�
Stock B $15 �116� $13 �
14
� $8 �34
�
Stock C $54 $54 $46 �176�
Stock D $52 �116� $44 �
1116� $34 �
38
�
a. Mrs. Numkena owns 42 shares of stock A, 59 shares of stock B,21 shares of stock C, and 18 shares of stock D. Write a row matrixto represent Mrs. Numkena’s portfolio.
b. Use matrix multiplication to find the total value of Mrs.Numkena’s portfolio for each month to the nearest cent.
53. Critical Thinking Study the matrix at theright. In which row and column will 2001occur? Explain your reasoning.
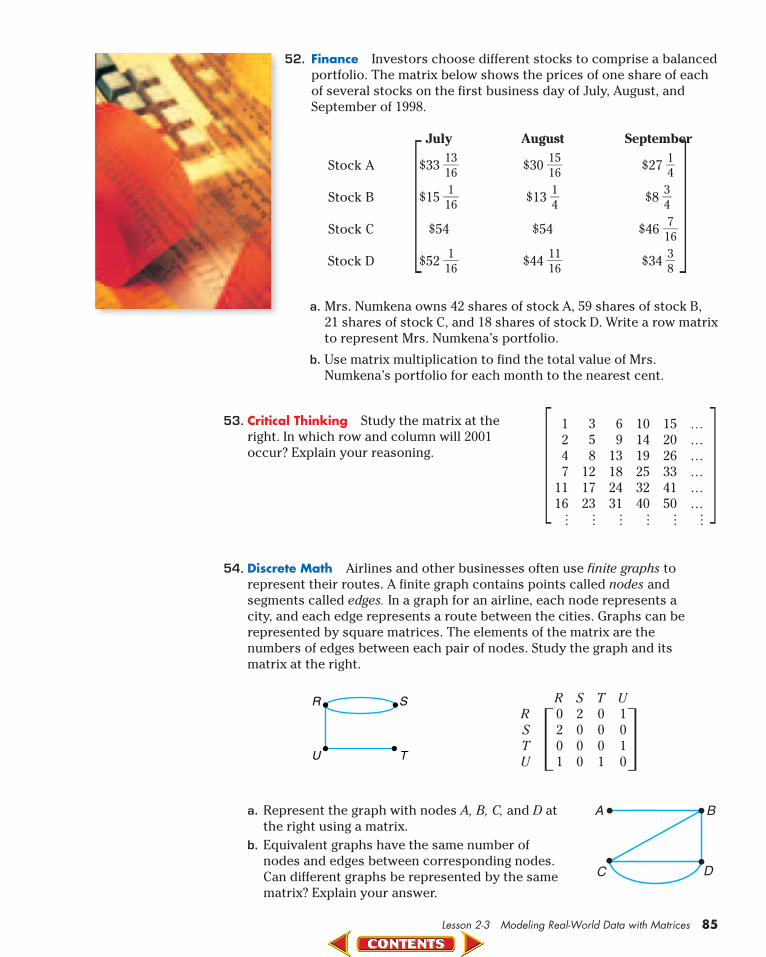
54. Discrete Math Airlines and other businesses often use finite graphs torepresent their routes. A finite graph contains points called nodes andsegments called edges. In a graph for an airline, each node represents a city, and each edge represents a route between the cities. Graphs can berepresented by square matrices. The elements of the matrix are the numbers of edges between each pair of nodes. Study the graph and its matrix at the right.
a. Represent the graph with nodes A, B, C, and D atthe right using a matrix.
b. Equivalent graphs have the same number ofnodes and edges between corresponding nodes.Can different graphs be represented by the samematrix? Explain your answer.
R
U T
S
Lesson 2-3 Modeling Real-World Data with Matrices 85
� �
A B
C D
� �U1010
T0001
S2000
R0201
RSTU
………………
...
152026334150
...
101419253240
...
69
13182431
...
358
121723
...
1247
1116
...
� �

Mixed Review 55. Solve the system 2x � 6y � 8z � 5, �2x � 9y � 12z � 5, and 4x � 6y � 4z � 3. (Lesson 2-2)
56. State whether the system 4x � 2y � 7 and �12x � 6y � �21 is consistent andindependent, consistent and dependent, or inconsistent. (Lesson 2-1)
57. Graph �6 � 3x �y � 12. (Lesson 1-8)
58. Graph f(x) � 3x � 2. (Lesson 1-7)
59. Education Many educators believe that taking practice tests will helpstudents succeed on actual tests. The table below shows data gathered aboutstudents studying for an algebra test. Use the data to write a predictionequation. (Lesson 1-6)
60. Write the slope-intercept form of the equation of the line through points at (1, 4) and (5, 7). (Lesson 1-4)
61. Find the zero of f(x) � 5x � 3 (Lesson 1-3)
62. Find [f g](x) if f(x) � �25
� x and g(x) � 40x � 10. (Lesson 1-2)
63. Given f(x) � 4 � 6x � x3, find f(14). (Lesson 1-1)
64. SAT/ACT Practice If �2x
x� 3� � �
3 �
2x
�, which of the following could be a value of x?A �3 B �1 C 37 D 5 E 15
GRAPHING CALCULATOR EXPLORATION
Remember the properties of real numbers:
Properties of AdditionCommutative a � b � b � aAssociative (a � b) � c � a � (b � c)
Properties of MultiplicationCommutative ab � baAssociative (ab)c � a(bc)
Distributive Propertya(b � c) � ab � ac
Do these properties hold for operations withmatrices?
TRY THESE
Use matrices A, B, and C to investigate eachof the properties shown above.
A � � � B � � � C � � �
WHAT DO YOU THINK?1. Do these three matrices satisfy the
properties of real numbers listed at theleft? Explain.
2. Would these properties hold for any 2 � 2 matrices? Prove or disprove eachstatement below using variables aselements of each 2 � 2 matrix.a. Addition of matrices is commutative.b. Addition of matrices is associative.c. Multiplication of matrices is
commutative.d. Multiplication of matrices is associative.
3. Which properties do you think hold for n � n matrices? Explain.
�32
�24
0�3
4�2
20
�13
86 Chapter 2 Systems of Linear Equations and Inequalities Extra Practice See p. A28.
Practice Test 15 75 60 45 90 60 30 120 10 120
Time (minutes)
Test scores68 87 92 73 95 83 77 98 65 94
(percents)

Lesson 2-4A Transformation Matrices 87
TRY THESE
The List�matr and Matr�listcommands transferthe data columnfor column. Thatis, the data in List1 goes to Column 1of the matrix andvice versa.
WHAT DO YOUTHINK?
2-4A Transformation MatricesAn Introduction to Lesson 2-4
The coordinates of a figure can be represented by a matrix with the x-coordinates in the first row and the y-coordinates in the second. When thismatrix is multiplied by certain other matrices, the result is a new matrix thatcontains the coordinates of the vertices of a different figure. You can use List andMatrix operations on your calculator to visualize some of these multiplications.
Step 1 Enter A � � �, B � � �, and C � � �.Step 2 Graph the triangle LMN with L(1, �1),
M(2, �2), and N(3, �1) by using STAT PLOT.Enter the x-coordinates in L1 and the y-coordinates in L2, repeating the firstpoint to close the figure. In STAT PLOT, turnPlot 1 on and select the connected graph.After graphing the figure, press 5to reflect a less distorted viewing window.
Step 3 To transfer the coordinates from the lists to a matrix, use the 9:List�matrcommand from the MATH submenu in theMATRX menu. Store this as matrix D. MatrixD has the x-coordinates in Column 1 and y-coordinates in Column 2. But a vertexmatrix has the x-coordinates in Row 1 andthe y-coordinates in Row 2. This switchcan be easily done by using the 2:T
(transpose) command found in the MATHsubmenu as shown in the screen.
Step 4 Multiply matrix D by matrix A. To graphthe result we need to put the ordered pairsback into the LIST menu.
• This means we need to transpose ADfirst. Store as new matrix E.
• Use the 8:Matr�list command from themath menu to store values into L3 and L4.
Step 5 Assign Plot 2 as a connected graph of the L3and L4 data and view the graph.
1. What is the relationship between the two plots?
2. Repeat Steps 4 and 5 replacing matrix A with matrix B. Compare the graphs.
3. Repeat Steps 4 and 5 replacing matrix A with matrix C. Compare the graphs.
4. Select a new figure and repeat this activity using each of the 2 � 2 matrices.Make a conjecture about these 2 � 2 matrices.
ZOOM
10
0�1
0�1
�10
�10
01
OBJECTIVE• Determine the
effect of matrixmultiplication ona vertex matrix.
[�4.548 ..., 4.548 ...] scl: 1 by [�3, 3] scl: 1
GRAPHING CALCULATOR EXPLORATION