2 3 bruce rymer, m eng., p.e. (ca) 4 5 6 7 1120 n street 8...
TRANSCRIPT

Tire/Pavement Noise Levels Related To Roadway Friction Improvement 1 2 3 4 5 6 7 8 9
Bruce Rymer, M Eng., P.E. (CA) Senior Engineer California Department of Transportation Division of Environmental Analysis 1120 N Street Sacramento, CA 95814 916-653-6073 [email protected] 10
11 12 13 14 15 16 17 18 19 20 21 22 23 24
Paul R. Donavan, PhD. 3655 Words of text Sr. Acoustic Scientist 12 Figures Illingworth & Rodkin, Inc 219 Word Abstract 505 Petaluma Boulevard South 6655 Word Total Petaluma, CA 94952 1-707-766-7700 [email protected] Erwin Kohler, PhD PE (CA) Pavement Engineer Dynatest Consulting Inc +1 (530) 231-4001 California, US +56 (2) 581-3940 Santiago, Chile [email protected] 25
26 27 28 29 30 31 32 33 34 35 36 37 38 39 40 41 42 43 44 45 46
ABSTRACT
In the United States, much has been learned about pavement acoustics in the past eight years with the development of the new On-Board-Sound-Intensity (OBSI) measurement method. OBSI allows researchers to quickly measure and compare pavement acoustics in great detail. A field demonstration provided a unique and controlled opportunity to examine how tire/pavement noise levels could be influenced with increases in friction on flexible and rigid pavements. The OBSI spectral measurements provided additional insight on how a shot peening process altered the noise generating mechanisms of the pavement surfaces. Spectral shifts in low and high frequencies were observed and the magnitude of the shifts varied between the two flexible and two rigid pavements. Generally, at frequencies below 1000 Hz, the texturing tended to increase the one third octave band levels. The process removed fine surface material and exposed larger aggregates which increased macrotexture depth and improved friction, but generated more low frequency noise. Frequencies from 1600 to 5000 Hz decreased after shot peening. The increase in low frequency noise was counter balanced by a reduction in high frequency noise. Overall OBSI A-weighted noise levels (re SRTT at 60 mph) of the flexible and rigid pavements were not significantly changed by the shot peening (Skidabrader®) process. Rigid pavement became slightly quieter and flexible pavement did not change or became slightly louder.
TRB 2010 Annual Meeting CD-ROM Paper revised from original submittal.

Rymer, Donavan, Kohler 2
BACKGROUND 1 2 3 4 5 6 7 8 9
10 11 12 13 14 15 16 17 18 19 20 21 22 23 24 25 26 27 28 29 30 31 32
Higher coefficients of friction on roadway surfaces equate to fewer traffic accidents, so maintaining high friction is a primary safety issue for roadway owners. Typically low friction on flexible pavements is remedied by a new overlay and low friction on rigid pavement can be addressed by grinding. Another option to increase roadway friction is to shot peen or ‘sandblast’ the road surface using steel pellets or shots. Shot peening can be used on both flexible and rigid pavements. A private company, Skidabrader®, developed a proprietary shot peening process and approached Caltrans to determine if their operation might have application as a strategy for creating quieter pavement as well as improving friction coefficients. This presented a very unique opportunity to determine how this process influenced pavement acoustics and also examine how changes in friction would influence acoustics. In this limited field study, acoustic engineers and pavement material engineers worked side-by-side and this report attempts to merge the data collected by the two disciplines to identify trends and draw some general conclusions. Long-term impacts of the shot peening process on pavement life cycle were not examined and are beyond the scope of this study. The Skidabrader® process uses a combination of two highly specialized vehicles designed to work in tandem to retexture pavement surfaces (Figure 1). The Skidabrader® process has a number potential advantages over grinding: 1) it can be used on both flexible and rigid pavements, 2) its production rate is much faster than typical grinding, 3) it is a dry, environmentally-friendlier process that recycles the steel shot, vacuums up the road dust, and dumps it offsite, and 4) it costs much less than grinding. The pavement surface texture can be varied during the process by changing the velocity and diameter of the steel shot and the overall road speed of the vehicle. This demonstration used a size 460 shot which has a nominal diameter of 0.0460 inches (1.1684 mm) to blast a 6 foot wide swath of roadway. Figure 2 shows the overall appearance of retextured flexible and rigid pavements after being shot peened by the Skidabrader® system. Figure 3 presents a close-up photograph comparing the surface of original and retextured dense graded asphalt concrete (DGAC).
2
TRB 2010 Annual Meeting CD-ROM Paper revised from original submittal.

Rymer, Donavan, Kohler 3
1 2 3 4 5 6 7
Figure 1. Skidabrader® equipment used to shot peen pavement. The rear vehicle shot peens the pavement and pushes the forward vehicle which vacuums the road dust and shot and extracts the shot for recycling.
a) b)
8 9
10 11 12
Figure 2. Retextured or ‘skidabraded’ flexible (a) and rigid (b) pavements. After treatment the retextured surface has an elevated friction coefficient and appeared lighter in color than original surface.
3
TRB 2010 Annual Meeting CD-ROM Paper revised from original submittal.

Rymer, Donavan, Kohler 4
1 2 3 4 5 6 7 8 9
10 11 12 13 14 15 16 17 18 19 20 21 22 23 24 25 26
Figure 3. Surface detail of dense graded asphalt (DGAC) pavement. Left side is original smooth texture. Right side is after retexturing - notice that more fines have been removed, leaving behind larger aggregate. MEASUREMENT DETAILS The skidabrading portion of this demonstration project was done in July 2008, in northern California in Yolo County on Interstate 505 near the intersection of State Route 16. This site is a rural, four lane divided Interstate freeway on flat terrain with a relatively low traffic volume by California standards of approximately 20,000 ADT. OBSI, skid, and texture measurements were taken on the pavements before and after retexturing with the Skidabrader®. The four test pavements included longitudinally tined Portland cement concrete (LT PCC), burlap drag Portland cement concrete (PD PCC), dense graded asphalt concrete (DGAC), and an open graded asphalt concrete (OGAC). The LT PCC, OGAC, and DGAC are representative of typical pavements in California. Each pavement texture was one mile long, and the measured segments within each pavement were at the end of each quarter mile and this supplied four test sections per pavement type. All pavements were in the outside truck-carrying lane, with the exception of the DGAC which was on the shoulder next to the OGAC pavement. The climate was moderate and completely dry during the study. Pre-texturing (Before) OBSI measurements were taken in early July 2008 when air temperatures were 88º to 94º F and post texturing (After) OBSI measurements were done a month later in August and air temperatures were 82º to 91º F. OBSI Measurements The OBSI measurements were conducted using the new draft AASHTO standard (1). As
4
TRB 2010 Annual Meeting CD-ROM Paper revised from original submittal.

Rymer, Donavan, Kohler 5
1 2 3 4 5 6 7 8 9
10 11 12 13 14 15 16 17 18 19 20 21 22 23 24 25 26 27 28 29 30 31 32 33 34 35
per this standard, each pavement was subdivided into 440 foot long test sections over which OBSI was measured three times at 60 mph for 5 seconds and these three results are arithmetically averaged for one representative A-weighted result per 440 foot test segment. All four kinds of pavements provided four separate, but similar 440 foot test segments. Three of the tested pavements were in southbound (SB) lanes and the longitudinal tined PCC was in a northbound (NB) traffic lane as labeled in Figure 4. OBSI testing was carried out by both Illingworth and Rodkin Inc. (I&R) and also the University of California at Davis Pavement Research Center (UCDPRC), with each team using their own independent OBSI systems. In addition to measuring with the Standard Reference Test Tire (SRTT), I&R also tested with the Goodyear Aquatred 3 tire used historically for the Caltrans OBSI pavement data base(2). The difference in level between the old Aquatred 3 and the newly adapted SRTT was only 0.2 dB on average and identical trends were seen with both tire designs. The OBSI measurements made by both teams used the second generation dual vertical probe configuration (3), and there were no considerable differences between the results of the two systems (4, 5). For simplicity, only the I&R acoustic data is presented in this report. Macrotexture Measurements The texture and skid data presented in this report are from the UCDPRC team. Pavement macrotexture was evaluated using the Circular Track Meter (6). This device uses a laser sensor at about 30mm over the pavement surface and measures the profile elevation at intervals of about 0.87mm following a circular track of 284 mm (11.2 in.) in diameter. This device reports the Mean Profile Depth, MPD, which is highly correlated with the volumetric measurement historically used for determination of texture depth. The MPD is calculated from the profile elevations using a standard procedure that considers the highest peak in segments of 100mm (7). Friction Measurements Friction testing was conducted using two different devices. The first one was a locked wheel friction trailer (8) regularly used by Caltrans, and the second was a Dynamic Friction Tester or DFT (9). The DFT reports surface friction as a function of sliding speed. It uses a horizontal spinning disk fitted with spring loaded rubber sliders which contact the paved surface as the disk rotational speed decreases.
5
TRB 2010 Annual Meeting CD-ROM Paper revised from original submittal.

Rymer, Donavan, Kohler 6
MEASUREMENT RESULTS 1 2 3 4 5 6 7 8 9
10 11 12 13 14 15 16 17
Acoustic Findings The overall A-weighted levels (400 to 5000 Hz) are presented in Figure 4 for the different pavement and each of the four 440 measurement segments within each pavement. In both the Before and After set of measurements, with the exception of the OGAC, there is less than 1 dB of variation between the 440 foot segments. This small amount of acoustic variation indicates that these pavements are in uniform condition from end to end. The most uniform results were produced by the rigid pavements and the DGAC which is located in the shoulder. The OGAC in the mainline had segment to segment variability of over 1dB in SBB2 and SBB4 and this is an indicator of uneven surface distress. The OGAC pavement also displayed a greater amount of variability each of the three times it was measured in addition to the variability between each 440 foot section. The Before and After measurements variation between segments in the OGAC is consistent. In terms of the Before and After data, it is seen that differences are small for all pavements and all segments—1.0 dB or less.
90
95
100
105
110
SBA1SBA2
SBA3SBA4
SBB1SBB2
SBB3SBB4
SBS1SBS2
SBS3SBS4
NB1NB2
NB3NB4
OB
SI L
evel
, dB
A
BeforeAfter
Burlap Drag PCC
OGAC DGACShoulder
Longitudinal Tine PCC
18 19 20 21 22 23 24 25 26 27 28 29 30 31
Figure 4. Overall A-weighted OBSI levels measured before and after the Skidabrader® operation for all pavements and each 440 ft segment within each section; re SRTT at 60 mph. NB and SB indicate north or southbound direction followed by site label information.
To interpret the results shown in Figure 4, it is instructive to consider the one third octave band spectra. For this purpose, since the difference in overall levels between segments was small, the four segments for each section were averaged (arithmetically) together to produce one representative spectrum for each pavement type both before and after skidabrading. The spectra for the all the pavements measured Before and After skidabrading are shown in Figure 5. These data indicate the PCC surfaces, the DGAC, and OGAC pavements are distinctly different acoustically. The two PCC surfaces are very close in level and spectrum shape while the DGAC is lower in level than the PCCs
6
TRB 2010 Annual Meeting CD-ROM Paper revised from original submittal.

Rymer, Donavan, Kohler 7
1 2 3 4
though generally preserving the same shape. The shape of the OGAC is appreciably different with much more bias to the lower frequencies. The OGAC spectrum shape is fairly typical for highly porous pavements and larger aggregate size (10).
70
75
80
85
90
95
100
105
400 500 630 800 1000 1250 1600 2000 2500 3150 4000 5000
1/3 Octave Band Center Frequency, Hz
OB
SI L
evel
, dB
A
LT PCC
BD PCC
OGAC
DGAC
Before Texturing
5
70
75
80
85
90
95
100
105
400 500 630 800 1000 1250 1600 2000 2500 3150 4000 50001/3 Octave Band Center Frequency, Hz
OB
SI L
evel
, dB
A
LT PCC
BD PCC
OGAC
DGAC
After Texturing
6 7 8 9
10 11 12 13
Figure 5. Spectra Shape and Texturing Influence on Pavement Acoustics. Before and After spectra for different pavements averaged from four samples within each pavement (re SRTT at 60 mph). Post texturing, the spectra move closer together at both low and high frequencies.
The spectral comparisons of each type of pavement before and after the skidabrader operations are presented in Figures 6 through Figure 9. When examined in isolation, the
7
TRB 2010 Annual Meeting CD-ROM Paper revised from original submittal.

Rymer, Donavan, Kohler 8
1 2 3 4 5 6 7 8 9
10 11 12 13 14 15 16 17 18 19 20 21 22 23
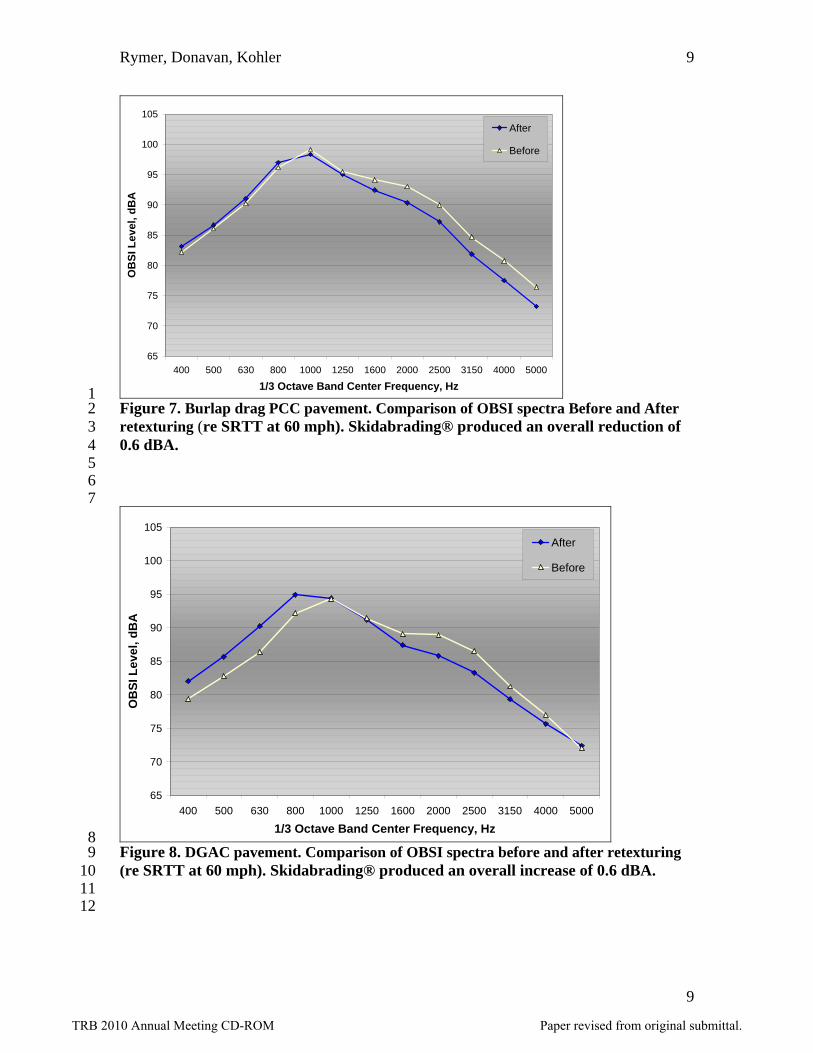
Before and After changes of each pavement are modest and show slight shifts in frequency. The plots do indicate that the texturing did alter the pavement noise generating mechanisms. When Figures 6 through 9 are examined together, a trend is evident. In general, relative to the pavement’s original peak frequency, all lower frequencies increased and all higher frequencies decreased (with the exception of the Figure 8. DGAC at 5000 Hz). For the two PCC surfaces in Figures 6 and 7, the trends are almost identical. In the lower frequencies, a very small, but consistent increase on the order of 1 dB is seen below 1000 Hz. In the higher frequencies, 1600 Hz and greater, skidabrading consistently lowered the one third octave band level by 2 to 3 dB. A visual inspection of the pavements determined that the skidabrading removed some of the cement binder and slightly exposed more of the aggregate. The newly exposed aggregate is creating a positive texture which is increasing the lower frequency levels while simultaneously the newly abraded surface texture is lowering the higher frequencies. Identical behavior was encountered on PCC pavements evaluated on the Caltrans Mojave Bypass study site before and after grinding of a burlap drag surface. In the Mojave study, however, the grinding produced higher roughness and hence even more of a low frequency level increase(11). The reason for the reduction of the higher frequency levels could be attributed to one or all of several mechanisms including reduced air pumping from the tread due to texture generated “escape paths”; reduction of the higher harmonics of the tread passage frequency due to randomizations created by the increased texture; and less “scrubbing” noise as the tread rubber “locks-in” to the pavement more readily with the increased texture and friction.
65
70
75
80
85
90
95
100
105
400 500 630 800 1000 1250 1600 2000 2500 3150 4000 5000
1/3 Octave Band Center Frequency, Hz
OB
SI L
evel
, dB
A
After
Before
24 25 26 27 28 29
Figure 6. Longitudinally tined PCC. Comparison of OBSI spectra Before and After retexturing (re SRTT at 60 mph). Skidabrading® produced an overall reduction of 0.2 dBA.
8
TRB 2010 Annual Meeting CD-ROM Paper revised from original submittal.
Rymer, Donavan, Kohler 9
65
70
75
80
85
90
95
100
105
400 500 630 800 1000 1250 1600 2000 2500 3150 4000 5000
1/3 Octave Band Center Frequency, Hz
OB
SI L
evel
, dB
AAfter
Before
1 2 3 4 5 6 7
Figure 7. Burlap drag PCC pavement. Comparison of OBSI spectra Before and After retexturing (re SRTT at 60 mph). Skidabrading® produced an overall reduction of 0.6 dBA.
65
70
75
80
85
90
95
100
105
400 500 630 800 1000 1250 1600 2000 2500 3150 4000 5000
1/3 Octave Band Center Frequency, Hz
OB
SI L
evel
, dB
A
After
Before
8 9
10 11 12
Figure 8. DGAC pavement. Comparison of OBSI spectra before and after retexturing (re SRTT at 60 mph). Skidabrading® produced an overall increase of 0.6 dBA.
9
TRB 2010 Annual Meeting CD-ROM Paper revised from original submittal.

Rymer, Donavan, Kohler 10
65
70
75
80
85
90
95
100
105
400 500 630 800 1000 1250 1600 2000 2500 3150 4000 50001/3 Octave Band Center Frequency, Hz
OB
SI L
evel
, dB
AAfter
Before
1 2 3 4 5 6 7 8 9
10 11 12 13 14 15 16 17 18 19 20 21 22 23 24 25 26 27 28 29 30
Figure 9. OGAC pavement. Comparison of OBSI spectra before and after retexturing (re SRTT at 60 mph). Skidabrading® produced no overall A-weighted change in noise levels.
Whatever the mechanisms for the high frequency behavior observed for the PCC pavements, a similar behavior was found for the DGAC (see Figure 8). For DGAC, the higher frequency reduction did not carry as high in frequency (5000 Hz)as it did for the PCC, however reductions of 2 to 3 dB were measured between 2000 and 3150 Hz. In the lower frequencies, the increases were more pronounced in the DGAC than for the PCC surfaces. For the DGAC, increases in level of 3 to 4 dB occurred at 800 Hz and below. Examination of the DGAC pavement before and after skidabrading revealed that the process appears to have removed more of the binder exposing the aggregate more than it did for the PCC pavements. As a result, the texture is visibly rougher than the before skidabrading surface condition (see Figure 3). Some of the tendencies observed for the PCC and DGAC surfaces also appear for the OGAC surface, however, at a much reduced magnitude (see Figure 9). In the higher frequency, reductions grow from 1 dB above 1000 Hz to about 1½ dB. In the lower frequencies, the levels after skidabrading are slightly higher (½ to 1 dB) growing with decreasing frequency. Given the small range of these changes, they would be difficult to assign as real without the similar results seen in the other three pavements. The implication for the OGAC pavement is that with already rough and presumed porous structure with little or no fines, the skidabrading operation had little effect on the noise generation or the appearance of the surface.
The overall one third octave band spectra for all the pavements after skidabrading are compared in the lower portion of Figure 5. At first glance the Before and After spectra of each pavement appear to be quite similar which is expected from the small changes in overall A-weighted level produced by the treatment. However, the spectra do move closer together in both the higher and lower frequencies. In the higher frequency, the extreme difference between the pavements closes from 11.6 dB to 9.6 dB, while in the lower frequency, the difference is reduced from 12.3 dB to 9.8 dB. When the one
10
TRB 2010 Annual Meeting CD-ROM Paper revised from original submittal.

Rymer, Donavan, Kohler 11
1 2 3 4 5 6 7 8 9
10 11 12 13 14 15 16 17 18 19 20 21 22 23 24
third octave band frequencies are combined into an overall A-weighted noise level, the Skidabrading operation produced very little overall acoustic change in each pavement type. On average, the two rigid pavement surfaces were lower in level, 0.6 dB and 0.2 dB for the burlap drag and longitudinal tined pavements, respectively. For the two rigid pavements, the smoother burlap drag benefitted the most from the texture changes introduced by the abrading process. For the DGAC pavement, the A-weighted levels actually increase after skidabrading with an average change of 0.6 dB. For the OGAC, there was no change. Roadway Friction Findings
With respect to macrotexture, Figure10 shows a noticeable increase in texture depth for three of the four pavements. The largest increase in MPD occurred at the DGAC pavement, which doubled the texture from about 0.6mm to 1.2mm (0.0236 to 0.0472 inches) The OGAC pavement started with the greatest MPD, of about 1.8mm (0.0708 inches), and changed to 2.2mm (0. 0866 inches) with treatment. The high MPD of the OGAC correlates to the low frequency bias shown in Figure 5. The Burlap Drag PCC pavement was similar in terms of MPD to the DGAC pavement before retexturing (0.5mm/01968in), but the effect of the treatment was less so it ended up with 0.8mm (0.03149 in.) of MPD. The least-changed pavement was the LT PCC, because the tines or “channels” controlled the MPD results. For both the PCC pavements, the MPD was not greatly improved upon and the changes in lower frequencies were smaller. The largest change in MDP occurred in the DGAC and this pavement had the largest spectral shifts. The MDP changed the least in the PCC pavements and the OGAC and these pavements also changed the least in the low frequencies.
Mean Profile Depth
PCC Burlap Drag DGAC
OGAC
PCC Long tined
0.0
0.5
1.0
1.5
2.0
2.5
0 10 20 30 40 50Test point
MPD
(mm
)
BeforeAfter
25 26 27 28 29 30 31
Figure 10. Mean Profile Depth (MPD) for all four pavements before and after retexturing.
Regarding friction, the Skidabrader process improved the conditions for all four pavement types. The DFT at 20mph measurements in Figure 11 shows, prior to retexturing, a great deal of variability between all the pavements with friction ranging
11
TRB 2010 Annual Meeting CD-ROM Paper revised from original submittal.

Rymer, Donavan, Kohler 12
1 2 3 4 5
from 0.34 to 0.71. After retexturing the friction increased with almost all results points (90 percent) between 0.69 and 0.85 and less variability between all the pavements. In both the PCC pavements, the DFT coefficient increased significantly and the higher frequencies were lowered significantly. For all pavements, after the treatment, the DFT coefficient moved closer together, similar to the spectral data.
PCC Burlap Drag DGAC OGAC PCC Long tined
0.0
0.2
0.4
0.6
0.8
1.0
1.2
0 10 20 30 40 50Test point
Fric
tion
Before
After
6 7 8 9
10 11 12 13 14 15 16 17 18 19 20
Figure 11. DFT friction coefficient at 20mph (DFT20) for all four pavements before and after retexturing. The 20mph values shown in Figure 12 are the direct results from DFT testing, based on torque measured while the device’s rubber pads were in contact with the wetted pavement surface. Since the DFT test is not an exact replica of what a vehicle would experience when trying to stop on a pavement, the DFT results were used in combination with the macrotexture to determine the International Friction Index, IFI (12). The IFI was developed to compare and harmonize texture and skid resistance measurements, and consists of two parameters that report the calibrated wet friction at 60 km/h (37mph) (F60) and the speed constant of wet pavement friction (Sp). Figure shows the IFI F60 results, again before and after retexturing. The F60 results in general increased overall by 0.20 with the treatment.
12
TRB 2010 Annual Meeting CD-ROM Paper revised from original submittal.

Rymer, Donavan, Kohler 13
International Friction Index
PCC Burlap Drag DGAC OGAC PCC Long tined
0.0
0.1
0.2
0.3
0.4
0.5
0.6
0.7
0.8
0.9
1.0
0 5 10 15 20 25 30 35 40 45 50
Test point
F60
Before
After
1 2 3 4 5 6 7 8 9
10 11 12 13 14 15 16 17 18 19 20 21 22 23 24 25 26 27 28 29 30 31
Figure 12. International Friction Index (F60) for all four pavements before and after retexturing. CONCLUSIONS
This study examined the acoustic changes shot peening pavements has on pavements and it found a correlation between improving friction and it influence on acoustics. Shot peening the pavement tended to remove the fines from the surface, leaving behind larger aggregate with a positive texture which improved friction but elevated lower frequency noise levels. Noise levels in the higher frequencies of 1600 Hz and above decreased with higher friction. The Skidabrader® or shot peening process did alter the pavement noise generating mechanisms and created offsetting changes between the lower and higher frequencies of each of the pavements; however, it did not provide any significant changes to the overall A-weighted levels because of these offsetting or counter-balancing changes. All of the low frequency changes occurred below the original peak frequency of the pavement and the only shift in peak frequency occurred in the DGAC which also had the largest change in MPD. The OGAC with the least amount of ‘Before’ fine aggregate had the least amount of lower frequency change and the shot peening had little acoustic affect on this type of pavement. Both the spectra and DFT coefficient data moved closer across all pavements after the skidabrading treatment. The DFT coefficient improved the most on the PCC pavements and these had significant changes in the higher frequencies. The MPD changed the least for the rigid pavements and the OGAC and the low frequency noise for these pavements also changed the least. ACKNOWLEDGEMENTS Thanks to Gary Billiard and the Skidabrader® crew for supplying the personnel and equipment for this demonstration project. Thanks also to Dr John Harvey, Mark Hannum, Bruce Steven, and the staff of UC Davis Pavement Research Center for their work. Executive support at Caltrans was provided by Bill Farnbach and field support and coordination was provided by Al Vasquez.
13
TRB 2010 Annual Meeting CD-ROM Paper revised from original submittal.

Rymer, Donavan, Kohler 14
14
1 2
4
6 7
9
10 11 12
13 14 15
16 17
18 19
20 21
22 23
24 25 26
27 28
29 30
REFERENCES
1. AASHTO, “Measurement of Tire/Pavement Noise using the On-Board Sound 3 Intensity (OBSI) Method”, TP 76-09 (2009).
2. Donavan, P., and Rymer, B., “Quantification of Tire/Pavement Noise: 5 Application of the Sound Intensity Method”, Proceedings of Inter-Noise 2004, Prague, the Czech Republic, August 2004.
3. Donavan, P. and D. Lodico, “Measuring Tire-Pavement Noise at the Source”, 8 NCHRP Report 630, Transportation Research Board, Washington (2009).
4. Kohler, E., Dynatest Consulting, Inc., “Tire Noise Testing on Highway 505 after Skidabrader,” technical report number TM 005 to John Harvey, UC Davis Pavement Research Center, July 19, 2008.
5. Donavan, P., Illingworth and Rodkin, Inc., “On-Board Sound Intensity Evaluation of Skidabrader Test Sections,” technical memo to Bruce Rymer, Caltrans, September 29, 2008.
6. ASTM E2157 - 01(2005) Standard Test Method for Measuring Pavement Macrotexture Properties Using the Circular Track Meter.
7. ASTM E1845-96 Standard Practice for Calculating Pavement Macrotexture Mean Profile Depth.
8. ASTM E274 - 06 Standard Test Method for Skid Resistance of Paved Surfaces Using a Full-Scale Tire.
9. ASTM E1911 - 09ae1 Standard Test Method for Measuring Paved Surface Frictional Properties Using the Dynamic Friction Tester.
10. Donavan, P., “Generation of Noise by Truck and Car Tires on Various Types of Asphalt Concrete Pavements”, Proceedings of Inter-Noise 2006, Honolulu, Hawaii, December 2006.
11. Donavan, P., “Influence of PCC Surface Texture and Joint Slap on Tire/Pavement Noise Generation”, Proceedings of NoiseCon 2004, Baltimore, MD, July 2004.
12. ASTM E1960 - 07 Standard Practice for Calculating International Friction Index of a Pavement Surface.
TRB 2010 Annual Meeting CD-ROM Paper revised from original submittal.