2 1 - restaurant brands...pizza hut 101 107 103 97 93 91 starbucks coffee 39 44 47 44 42 41 pizza...
TRANSCRIPT
1
2 1
CONTENTS
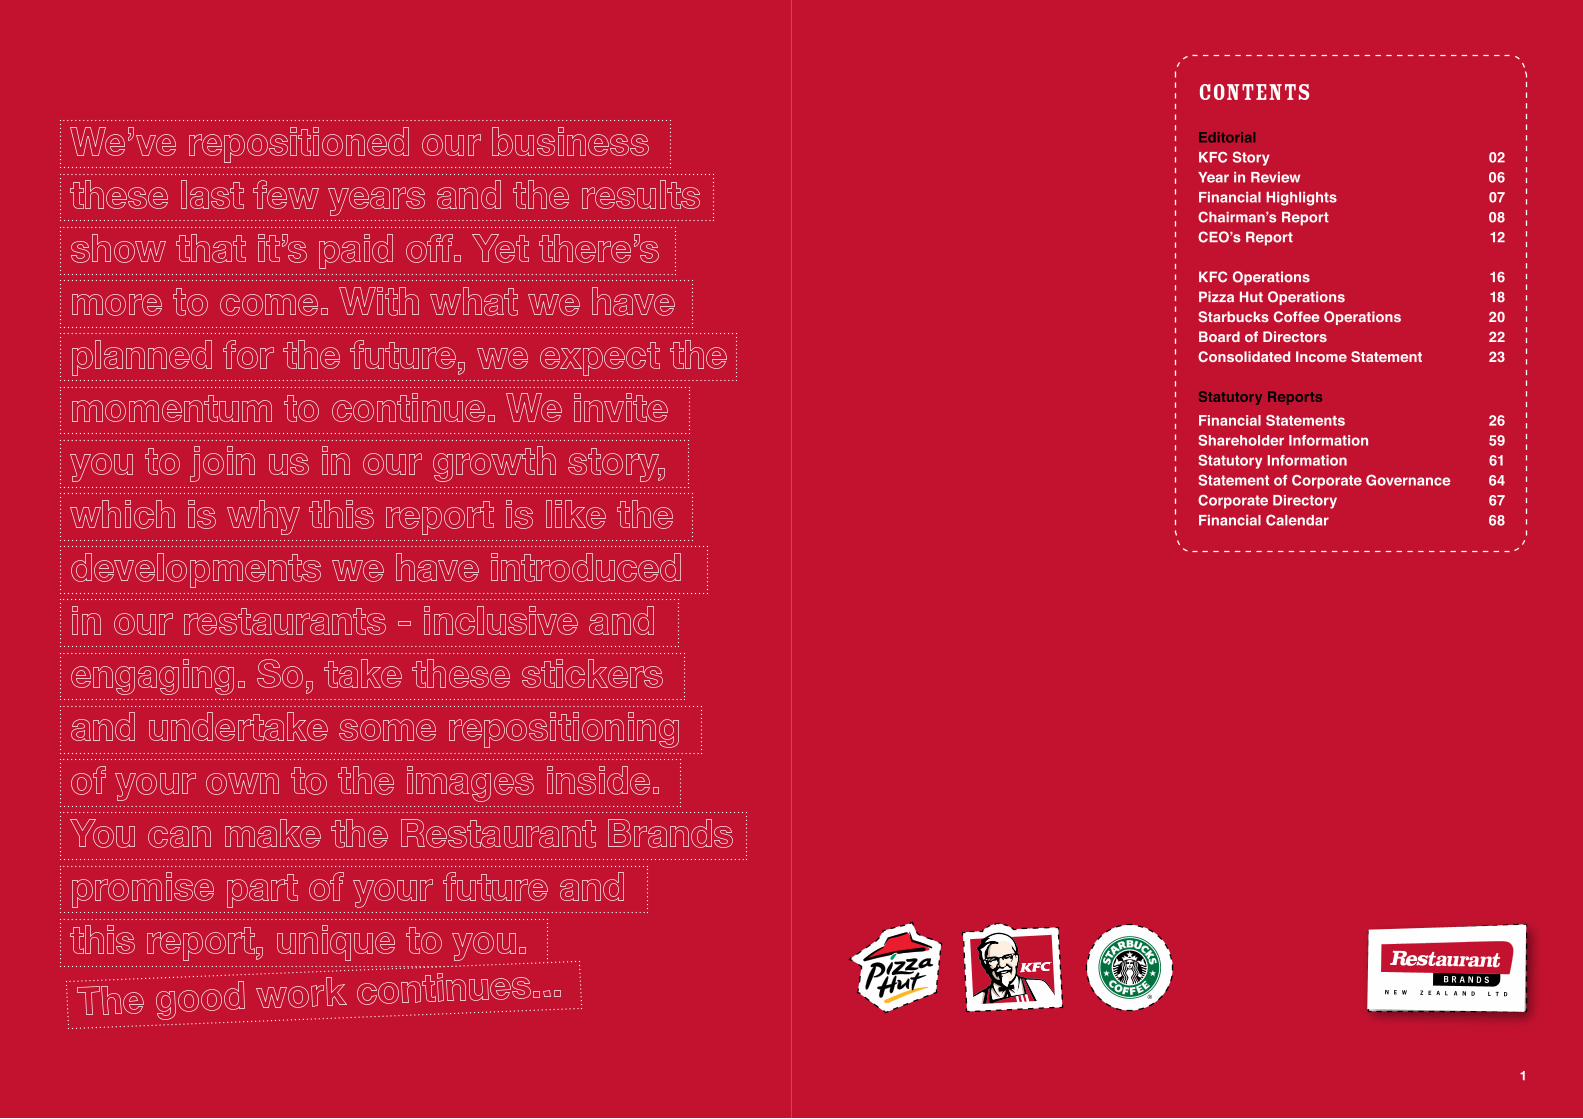
EditorialKFC Story 02 Year in Review 06Financial Highlights 07Chairman’s Report 08CEO’s Report 12
KFC Operations 16Pizza Hut Operations 18Starbucks Coffee Operations 20Board of Directors 22Consolidated Income Statement 23
Statutory ReportsFinancial Statements 26Shareholder Information 59Statutory Information 61Statement of Corporate Governance 64Corporate Directory 67 Financial Calendar 68
RESTAURANT BRANDS

3 4
KFC STORY yesterday & today
For the past five years, the KFC brand has been on a unique journey – a journey wherein the face of a brand has been transformed and the attitude to KFC from the investment community, our partners and, most importantly, our customers, has been similarly changed for good.
KFC favourable future
24055
KF
C S
al
es
$N
Zm
KF
C E
BIT
DA
$N
Zm
23050
21040
19030
35200
45220
25180
20170
15160
10150
RED IS KFC SAlES
BlACKIS KFC EBITDA
NUMBER OFTRANSFORMED
STORES
2007
$31m
$183m
21
2006
$30m
$172m
9
2005
$28m
$173m
100
The last five years have seen significant change and growth in the brand.
2003 FranktonIt is a journey that started in late 2004 with a long debated decision to alter the face of a single store in Frankton, Hamilton. At the time it was seen as a brave step.
Some $1.3 million was spent in dramatically changing the appearance of the store to something far more inviting, upmarket and customer friendly. But it was not only the facility itself. The entire instore operations were overhauled, staff retrained and the menu and marketing presentation altered.
That first move delivered results beyond our most optimistic expectations and gave us heart to try it with more stores. The Mangere East store was transformed the same year with broadly similar results. This was followed with a further seven stores the following year and 11 the year after.
Thus was born a process that has generated growth on growth for the KFC brand over the past five years. Considerable capital investment made over this time (more than $46 million to date) has continued to deliver ever-increasing returns. Sales have grown from a flat $176 million a year average over the three years preceding the first
2004 TRANSFORMATION
2010
40
$46m$223m
20092008
30
$199m$36m
34
$38m
$212m
transformation to more than $223 million in the current year. Earnings have grown at a similar rate, with KFC now producing EBITDA of $46 million a year compared with less than $30 million five years ago.
As the process has continued, the upgrades have not only enhanced sales and profits in stores that have been transformed, but also in stores that have not, benefiting from the “halo effect” of a considerably improved brand perception.
Product offerings have widened with a greater emphasis on snack products, wraps and “easy-to-eat” lines, although the base of the business with the Colonel’s original recipe chicken still remains. The brand has also moved into wider beverage offerings, with the introduction of the Krushers range across 56 of its stores in the 2010 year.
The improved consumer experience and wider product offering has expanded the customer base, with more people now starting to visit KFC stores who would not have done so several years ago. Repeat business is also up with customer frequency also beginning to escalate.
The physical store transformation process continues, always one store at a time, but with 40 stores now sporting the new looks and another 10 targeted in the coming year, it seems there is room for still more growth.
The store design and menu process continues to evolve. As the more recent stores are transformed, more enhanced design features are incorporated to further improve the attractiveness and usefulness of the facility. Separate beverage bars for the Krushers range are but one example.
And what of the stores that were transformed now five years ago? Does the growth continue? The first transformed store in Frankton is now in its sixth year of operation post transformation. Before it embarked on the journey, this store averaged weekly sales of $48,000. It is now averaging $70,000 a week and climbing. Profitability has increased accordingly, with EBITDA improving from about $500,000 a year to nearly $900,000.
Now, as it has always been, the repositioning of this brand has been one store, one new product and one new customer at a time. KFC has been building and continues to build momentum through both boom times and tougher economic environments. Is there more to come?
We think so.
a happy KFC customer:“Premises are inviting”
FRANKTON STORE
good trendgood trend
5 6
2005
Permanent introductions» Popcorn Chicken» New Burger Range including
BBQ Bacon & Cheese Burger» Better for you drinks – Water, Juice
and Pepsi Max
Innovation-lIMITED TIME OFFERS» BBQ Roast Chickens» Wicked Wings
2006
Permanent introductions» Chicken Fillet Garden Salad» Twister range extended» Sara Lee dessert range
Innovation-lIMITED TIME OFFERS» Fillers» Hot Rods» Boneless Chicken» Chicken Italiano Burger
2007
Permanent introductions» Snack Box» Green Side Salad
Innovation-lIMITED TIME OFFERS» Hot & Spicy Boneless Chicken» Teriyaki Chicken» Family Fun Bucket» Fiesta Burger» South Western Twister
2008
Permanent introductions» Original Recipe Fillets with
less than 7g fat per avg. piece» Wicked Wings
Innovation-lIMITED TIME OFFERS» Wrapstar» Country Crunch Chicken» Zinger Maxxx Burger
2009
Permanent introductions» Hot & Spicy Fillets» Popcorn Roller» Krushers» Bean Salad
Innovation-lIMITED TIME OFFERS» The legendary Tower Burger returns» Hot & Spicy Popcorn Chicken» Pocketfuls» Honey Soy Twister
PRODUCTS
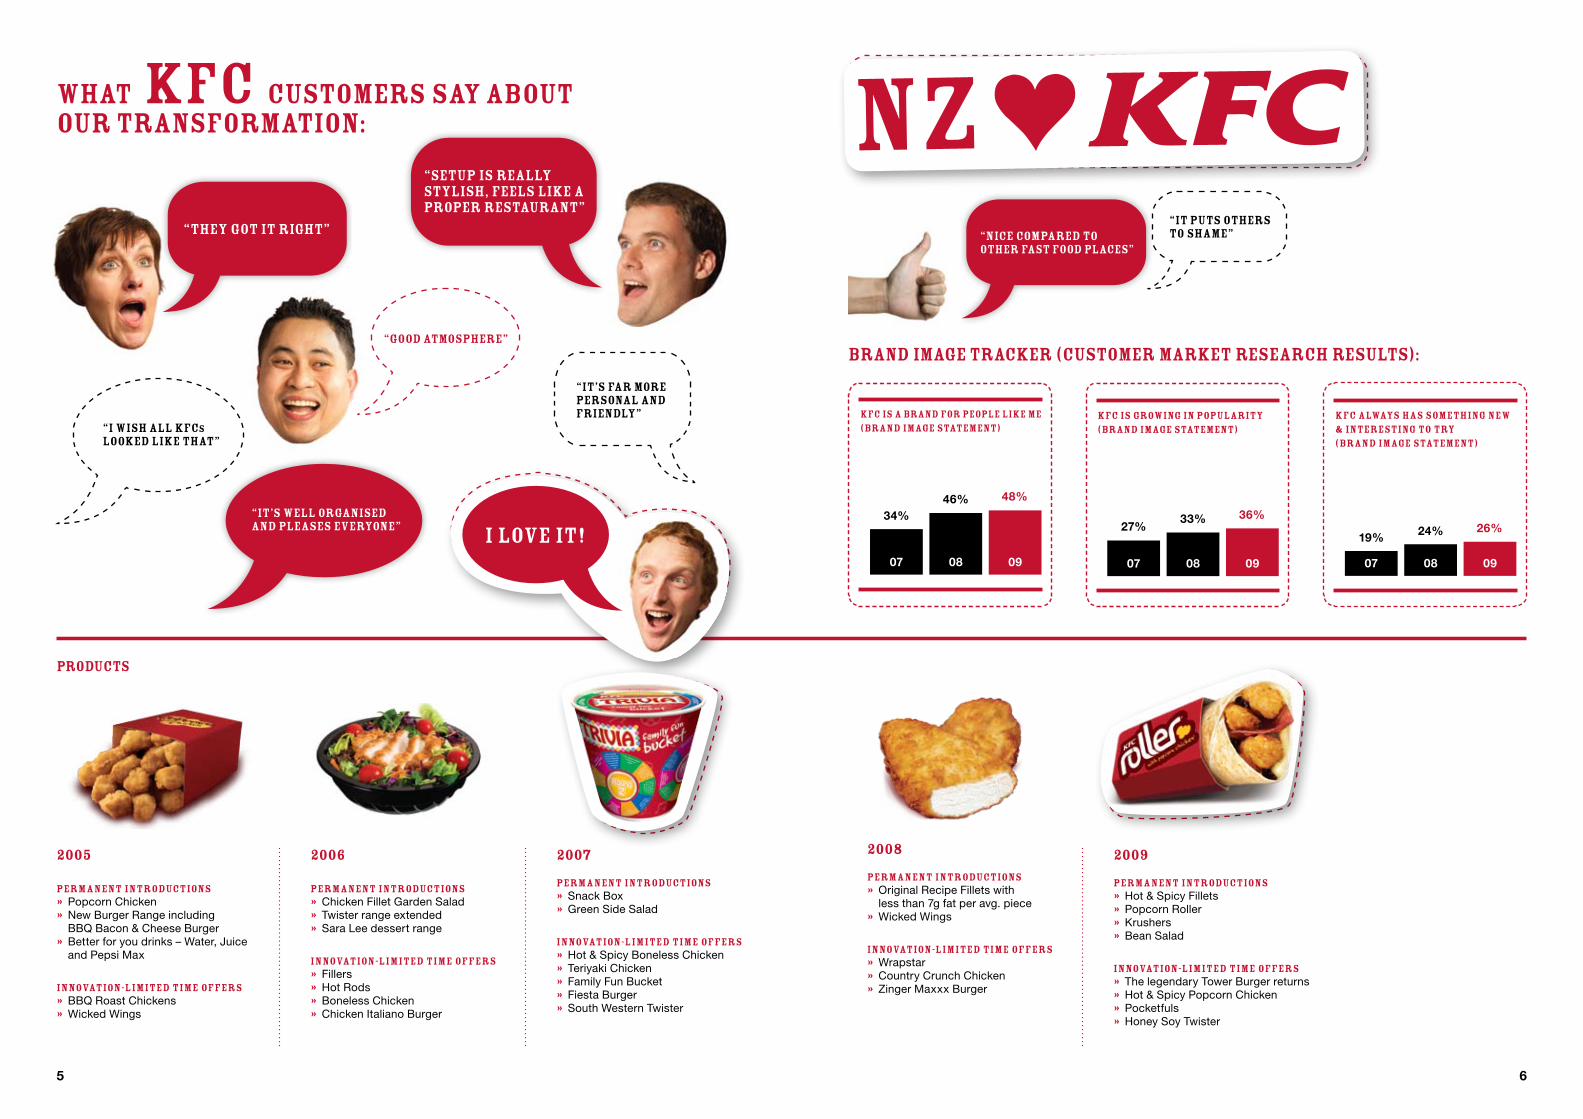
WHAT KFC Customers say about our transformation:
KFC is a brand for people like me (brand image statement)
07 08 09
34%46% 48%
KFC is growing in popularity (brand image statement)
07 08 09
27%33% 36%
Brand Image Tracker (customer market research results):
“Setup is really stylish, feels like a proper restaurant”
“They got it right” “Nice compared to other fast food places”
“I wish all KFCs looked like that”
“It’s well organised and pleases everyone”
“It puts others to shame”
“It’s far more personal and friendly” KFC always has something new
& interesting to try (brand image statement)
07 08 09
19% 24% 26%
TRIVIA FAMIlY FUNBUCKET
KFC ROllERWITH POPCORN CHICKEN
NZ KFC
I love it!I love it!
NZ
“Good atmosphere”

7 8
2005 2006 (1) 2007 2008 2009 2010 (2)
Financial performance SalesKFC 173.0 171.8 182.7 199.1 211.5 223.2Pizza Hut 87.6 89.1 79.7 71.4 64.6 64.2Starbucks Coffee 24.9 27.9 31.3 33.0 33.0 30.5Pizza Hut Victoria 30.0 27.6 25.0 6.3 0.3 -Total 315.5 316.4 318.7 309.8 309.4 317.8Store EBITDAKFC 27.8 29.6 31.2 35.9 38.0 46.3Pizza Hut 13.6 11.8 5.1 4.4 2.8 5.4Starbucks Coffee 3.7 3.9 3.6 3.9 2.9 3.2Pizza Hut Victoria 0.1 (0.3) (2.9) - - -Total 45.2 45.0 37.0 44.2 43.7 54.9EBIT 19.1 11.3 (1.1) 16.1 15.6 29.2NPAT (reported) 10.7 5.2 (3.6) 8.4 8.3 19.5NPAT (excluding non-trading) 11.0 12.3 6.5 10.4 11.7 19.9
Financial position/cash flowShare capital 25.3 25.6 25.6 25.6 25.6 25.8Total equity 51.1 43.9 32.6 35.2 37.1 48.7Total assets 105.3 109.3 117.7 112.0 101.1 103.0Operating cash flows 23.4 28.2 20.8 31.3 23.3 38.7
SharesShares on issue (year end) 96,843,475 97,081,875 97,128,956 97,128,956 97,128,956 97,280,005Number of shareholders (year end) 7,992 7,067 6,733 6,214 6,095 5,668Earnings per share (full year reported) 11.1c 5.4c (3.7)c 8.6c 8.5c 20.1cOrdinary dividend per share 10.0c 10.0c 5.5c 6.5c 7.0c 12.5c
OtherNumber of stores (year end)KFC 87 88 87 87 84 85Pizza Hut 101 107 103 97 93 91Starbucks Coffee 39 44 47 44 42 41Pizza Hut Victoria 51 50 23 1 - -Total 278 289 260 229 219 217
Partners (employees) paid (year end) 7,083 6,787 5,949 4,957 4,526 4,735Notes: (1) The results for 2006 and onwards have been restated on a post IFRS basis. Data provided prior to 2006 are on a pre IFRS basis.(2) Sales for each of the concepts do not aggregate to the total due to rounding.
HISTORICAl SUMMARYAll figures in $NZM unless stated
TOTAl SAlES($NZ MIllIONS)
05 06 07 08 09 10
TOTAl STORE EBITDA($NZ MIllIONS)
05 06 07 08 09 10
TOTAl ASSETS($NZ MIllIONS)
317.8
» Group net profit after tax (excluding non-trading items) was $19.9 million (20.5 cents per share), up 70% or $8.2 million on prior year, as a result of continued strong performance by KFC and a solid turnaround in Pizza Hut.
» Reported net profit (including non-trading items) was $19.5 million (20.1 cents per share) compared to $8.3 million in the prior year.
» Total revenues for the company were $318.3 million, up $8.8 million (2.8%) on prior year, with same store sales up 6.8%.
» KFC achieved yet another sales record at $223.2 million (up 9.2% on a same store basis), with Pizza Hut at $64.2 million (up 3.9% on a same store basis) and Starbucks Coffee at $30.5 million (down 2.9% same store).
» Bank debt was reduced by $16.6 million (on top of the $8.2 million reduction in the prior year) as the company continued to reduce borrowings on the back of strong operating cash flows.
» A final full year fully imputed dividend of 8.0 cents per share has been declared making a full year dividend of 12.5 cents, up 5.5 cents or 79% on prior year.
Note: Results for the 2009/10 financial year are on a 52 week basis versus 53 weeks for the previous year. The company normally uses a 52 week (364 day) year, and therefore a “leap” year is occasionally required. Hence, the extra week last year. NICE ONE!
POSITIVE
TREND
NICE ONE!
POSITIVE
TREND

109
chairman’s report
Restaurant Brands recorded a net profit after tax (excluding non-trading items) of $19.9 million this year (or 20.5 cents per share), up 70% on the previous year. The 2009/10 result has truly lifted the bar to where expectations of profits in excess of $20 million a year are achievable and sustainable.
The reason for this improvement has been the continued growth of the KFC brand, with a sales and profit performance that matches any KFC market in the world. The transformation process of continuing sales growth and the maintenance of a quality food and customer service experience is positioning KFC as a premium fast food choice for a wider range of customers.
Elsewhere in this report is the history of the KFC transformation process. Even with 40 stores (nearly half the network) now having seen major renovation of their facilities, there still remains greater potential for growth.
Notwithstanding the continuing growth in the KFC business, it is also pleasing to report a significant profit turnaround in the Pizza Hut brand and improved profitability in our Starbucks Coffee operations.
The theme of this year’s annual report is “repositioning of the company”. In the 2009/10 year this became a financial reality with a step change in financial performance driven primarily by a reconstituted KFC business with renewed momentum.
net profit after tax (excluding non-trading)up
70%KFC TRANSFORMED STORES NATIONWIDE
40TED van ARkel
RUSSEl CREEDY

11 12
This has been a particularly satisfactory year for Restaurant Brands, the results for which could not have been delivered without the hard work and skill of our people (or partners). The board acknowledges the continuing efforts of staff and management in the company’s result and looks forward to an even better performance next year.
The continuing improvement in the financial position of the business means that management is in a position where it can begin to explore new brand opportunities – something that has been part of the board’s long term strategy.
However, directors and management are all too aware of the pitfalls in the aggressive pursuit of diversification. There is no mandate to actively pursue these opportunities; there is still considerable work to do in continuing to build momentum in KFC and enhance the performance of and rationalise the Pizza Hut and Starbucks Coffee businesses.
We therefore continue to maintain a watching brief for new opportunities to leverage our multi-site food retail expertise, especially where they arise in the current economic environment.
This year’s profit performance exceeded most of our expectations, delivering trading results better than previously experienced by the company. The improvement has been built on a gathering momentum in sales and profits from the KFC business and helped by much better results from the other two brands.
In the coming year the pace of investment in the KFC brand transformation programme will be increased and at least two new stores will be opened. Positive same store sales growth is expected to continue, although as the economy improves this may not be at the levels enjoyed over the past couple of years.
Pizza Hut is expected to continue the momentum of same store sales growth seen in the current year. The sale of stores to independent franchisees will be actively pursued as will the programme of unprofitable store closures, particularly of the red roof stores.
Starbucks Coffee is expected to return to same store sales growth and produce further margin improvement on the current year.
Whilst the KFC profit improvement has been assisted by both improved market demand in the recessionary environment and some reductions in cost pressures from the economic downturn, directors believe that this “step up” in level of financial performance can be maintained and are targeting a profit result for the company in excess of $20 million for the new financial year.
Ted van ArkelChairman
In the 2009/10 year we achieved a net profit after tax (excluding non-trading items) of $19.9 million (20.5 cents per share). This result is $8.2 million or 70% up on last year’s profit of $11.7 million (12.1 cents per share).
Net profit after tax (including non-trading items) was $19.5 million (20.1 cents per share) compared to $8.3 million (8.5 cents per share) in 2008/9.
Total store earnings before interest, tax, depreciation and amortisation (EBITDA) for the year were up $11.2 million to $54.9 million, with KFC contributing $8.3 million of the improvement, Pizza Hut $2.6 million and Starbucks Coffee $0.3 million.
Total store sales of $317.8 million were up $8.7 million (2.8%) on the previous year’s sales. Same store sales for the group were up 6.8% (1.6% in 2008/09). KFC and Pizza Hut demonstrated continuing same store sales growth, up 9.2% (4.1% in 2008/09) and 3.9% (-6.5% in 2008/09) respectively, but Starbucks Coffee suffered an annual same store sales drop of 2.9% (up 3.6% in 2008/09).
Year end store numbers at 217 were two down on February 2009 following two Pizza Hut and one Starbucks Coffee store closures and one new KFC opening over the year.
Total balance sheet assets of $103 million were slightly up on the previous year’s $101.1 million with small increases in fixed assets reflecting KFC transformation expenditure ahead of depreciation and a reclassification of deferred tax. Shareholders’ funds were up from $37.1 million to $48.7 million as a result of the higher levels of profitability of the company.
Operating cash flows improved strongly to $38.7 million for the year, up $15.4 million on the previous year. This again was mainly from improved trading, but a portion ($6.8 million) was attributable to working capital movements.
Investing cash flows climbed $5.1 million to $13.2 million over the year as the pace of KFC store reinvestment accelerated after a brief pause last year. The resulting improved free cash flow position meant that we were able to retire a further $16.6 million in bank debt over the year (in addition to the $8.2 million reduction last year). Year end borrowings were $17.7 million, down from $34.3 million last year, well within current facility limits of $45 million.
Bank debt has been reclassified as a current liability in these accounts as the Westpac facility expires in October 2010. The renewal of the facility was deferred as the company seeks to minimise its exposure to increased funding costs as old interest rates roll off. Directors expect that the facility will be renewed in the normal course of business on or before the October expiry date.
The focus on debt reduction over the past three years has seen the level of gearing on our balance sheet drop from 55% two years ago to 26% today.
Even in more challenging times, the company has produced a dividend for its shareholders. It was, however, with some satisfaction that the board was able to declare a significantly increased dividend this year (up 79% on the previous year).
A final dividend of 8 cents per share has been declared, bringing the total dividend to 12.5 cents per share, up from 7 cents last year.
The dividend will be paid as fully imputed on 25 June 2010 to all shareholders on the register as at 11 June 2010. Non-resident shareholders will also benefit from the supplementary dividends attached to the imputation credits in the normal manner.
The company will continue to increase dividends commensurate with improvements in profitability and required reinvestment capital.
The board has worked closely with management in delivering the improved result for the company.
The independent directors continue to approve further investment in the company by Danny Diab, who purchased one million shares during the year to bring his holding to five million shares or 5.1% of total securities on issue. Chief Executive Russel Creedy has also purchased more shares (under our approved securities trading rules) to where he (and associated interests) now holds about 0.5% of the register, demonstrating his continuing commitment to the company.
Directors received with regret the resignation of Shawn Beck during the year but have not moved to replace him at this stage.
Trading Results
Balance Sheet and Cash Flows
People
New Brands
Outlook
Board
Dividend
1413
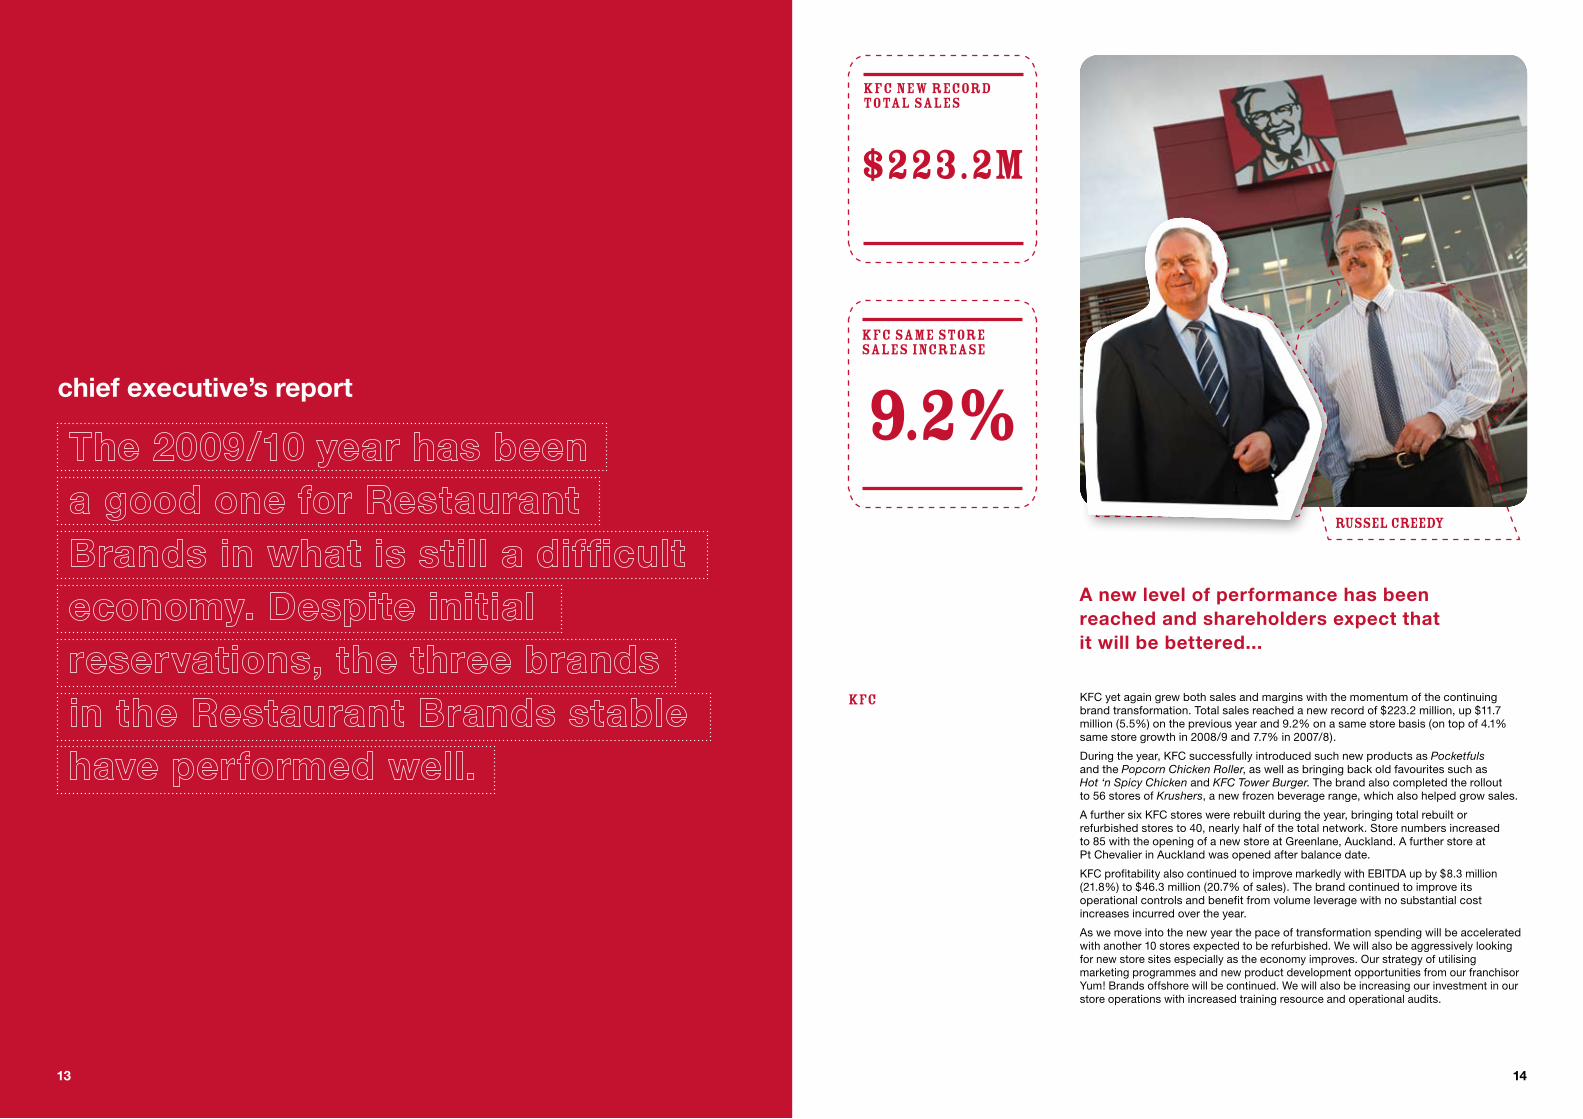
KFC yet again grew both sales and margins with the momentum of the continuing brand transformation. Total sales reached a new record of $223.2 million, up $11.7 million (5.5%) on the previous year and 9.2% on a same store basis (on top of 4.1% same store growth in 2008/9 and 7.7% in 2007/8).
During the year, KFC successfully introduced such new products as Pocketfuls and the Popcorn Chicken Roller, as well as bringing back old favourites such as Hot ‘n Spicy Chicken and KFC Tower Burger. The brand also completed the rollout to 56 stores of Krushers, a new frozen beverage range, which also helped grow sales.
A further six KFC stores were rebuilt during the year, bringing total rebuilt or refurbished stores to 40, nearly half of the total network. Store numbers increased to 85 with the opening of a new store at Greenlane, Auckland. A further store at Pt Chevalier in Auckland was opened after balance date.
KFC profitability also continued to improve markedly with EBITDA up by $8.3 million (21.8%) to $46.3 million (20.7% of sales). The brand continued to improve its operational controls and benefit from volume leverage with no substantial cost increases incurred over the year.
As we move into the new year the pace of transformation spending will be accelerated with another 10 stores expected to be refurbished. We will also be aggressively looking for new store sites especially as the economy improves. Our strategy of utilising marketing programmes and new product development opportunities from our franchisor Yum! Brands offshore will be continued. We will also be increasing our investment in our store operations with increased training resource and operational audits.
KFC
chief executive’s report
KFC NEW record total sales
$223.2M
KFC same store sales increase
9.2%RUSSEl CREEDy
A new level of performance has been reached and shareholders expect that it will be bettered...
TED van ARkel

15 16
Following the signing of an agreement with Yum! Brands last year we have been working towards a plan to sell individual stores to independent franchisees. Under these new arrangements we will be able to rationalise the network for better profitability but still retain day-to-day control and direction of the brand. We expect to be able to announce the completion of a number of sales of the smaller stores in particular over the new financial year.
As the chairman has observed, much of the credit for the improvements in the business over the past 12 months rests with our partners.
We have 4,735 people in our organisation, most of whom are in our stores producing the chicken, pizzas or coffee that keep our customers happy.
We continue to develop and train our people with more field training planned for the coming year along with the continued provision of qualifications in food safety and hospitality.
Staff safety also remains of great importance and we continue to actively support and monitor our safety performance right up to board level. It is pleasing to report that we continue to maintain our ACC Partnership Programme at the tertiary (highest) level and our accident rates continue to fall, with lost time injuries down 15% on the previous year.
While the 2009/10 year has been one of considerable success for the company, management is determined not to rest on its laurels. A new level of performance has been reached and shareholders expect that it will be bettered. That is our focus for the coming year.
Russel Creedy
CEO
The Pizza Hut business finally returned to profitability in 2009/10. While sales of $64.2 million for the year were down $0.4 million (0.7%), this was as a result of having two fewer stores. The brand delivered same store sales growth of 3.9% in the year, the first time Pizza Hut has seen an increase in same store sales since 2002/03.
More importantly, however, the leverage from the sales growth and the closure of unprofitable stores, together with a number of margin improvement initiatives and continued emphasis on improved controls, meant that the brand produced an EBITDA result of $5.4 million for the year, $2.6 million or 95% up on the previous year. Pizza Hut’s EBITDA margin as a percentage of sales finished at 8.4% compared with 4.3% in the previous year.
Limited time offers such as the More-4-All and Garlic Bites pizzas have attracted new customers. Existing successful products such as the Jumbo size pizza and Slab have provided further growth. Towards the end of the financial year, Pizza Hut launched the everyday value Pizza Mia as well as a range of seven new flavours, bringing innovation to the core pizza range with both initiatives assisting in generating repeat business.
Two stores closed during the year, the Hamilton North red roof restaurant and the Mairangi Bay delco. Both closures assisted profitability. Store numbers at year end totalled 91.
Over the next 12 months my team will be continuing to build on the positive sales momentum seen in the back half of last year, while improving profit margins through further tightening of in-store controls and loss prevention activities. Another two or three red roof restaurants will be closed and it is expected that a small number of delcos will be sold to independent franchisees (see next page).
Starbucks Coffee revenues at $30.5 million were down $2.5 million (7.6%) on 2008/9 and down 2.9% on a same store basis. One store in Palmerston North was closed (at lease end) over the year bringing store numbers at year end to 41.
Despite the sales result, the Starbucks business managed to improve earnings by $0.3 million (9.6%) on the previous year to produce an EBITDA of $3.2 million or 10.6% of sales. A more favourable exchange rate and enhanced in-store controls, together with some product rationalisation, all contributed to the improved result.
A renewed focus on strong customer service and product innovation is expected to deliver a return to positive sales growth through the new year. Work on margin enhancement will continue through more local sourcing, effective price increases and better labour and food cost controls. There will be some store rationalisation of three or four loss-making stores at lease end and some limited new store development where new opportunities present themselves.
General and administration costs (above store overheads) at $12.9 million were significantly ($2.4 million) above the previous year because of higher headcount and increases in variable remuneration due to improved financial performance of the company. G&A costs were 4.1% of sales (2009: 3.4% of sales).
With the delays in KFC transformation and capital expenditure flowing over from the previous year, depreciation charges at $12.0 million for the year were slightly lower than incurred for 2008/09.
Non-trading charges of $0.6 million were $4.4 million lower than prior year because the previous year’s result included $0.4 million in write offs from Pizza Hut store closures (largely red roofs) and $3.7 million in Pizza Hut goodwill impairment charges following a review of the carrying value of this investment.
Interest and funding costs at $1.4 million were $2.5 million lower than prior year, with the company benefiting from both lower debt levels and the continued fall in interest rates. Bank interest rates for the year averaged 4.3% compared with 8.3% in 2008/09.
Pizza Hut
Starbucks Coffee
Corporate and Other Costs
Pizza Hut Franchising
People
Conclusion

KFC operations
2,808$56.2M
sales ($NZm) assetsebitDa ($NZm) partNers
The “step change” in the performance of the KFC brand continued this year with yet another significant lift in sales and profit. The pace of store transformation began to accelerate again after losing some momentum in 2008/9 (with concerns of a general economic slowdown not delivering the required returns).
The total number of transformed stores is now 40 (nearly 50% of the network) with another six undergoing extensive refurbishment and a new store opening in Auckland in the 12 months to February 2010.
Total sales reached yet another new record of $223.2 million, up $11.7 million (5.5%) on last year’s record of $211.5 million. This growth is very satisfactory, given the fact it includes significant periods of time when a number of stores were closed for refurbishment (up to 12 weeks) and it also is comparing the result with a 53 week period in the previous year. On a same store basis, sales were up 9.2% on top of 4.1% last year and 7.7% for the year before.
New product releases including Pocketfuls and Popcorn Chicken Roller added to the increasing range of snack products on offer and the release of Krushers, a new frozen beverage range, has also been very successful in driving sales.
05 06 07 08 09 10 05 06 07
46.3223.2
08 09 10
Profitability continued to reflect the improved sales with continuing excellent store controls and the benefits of volume leverage delivering an EBITDA for 2009/10 of $46.3 million (20.7% of sales). This was up 21.8% on last year’s result of $38.0 million (18.0% of sales).
At the EBIT level (after depreciation expense and above-store overheads, but before non-trading items), KFC earned $37.1 million, up $7.8 million on 2008/9. Depreciation and amortisation costs were similar to prior year, but G&A costs were up as a result of higher headcount and increases in variable remuneration.
One new store at Greenlane Auckland was opened late in the year, bringing total store numbers to 85.
Customer service measures as reflected by the CHAMPS programme also continued to improve, finishing the year at 84.0%, up on the prior year’s 80.6%.
The more important in-store operations performance measure (CHAMPS Excellence Review or CER) achieved a score of 58.7%. This was significantly down on last year’s 76%, but arises from a substantial change in measurement basis with a move from “announced” (where stores are prepared) to “unannounced” audit inspections, providing a much more accurate picture of the underlying brand performance in-store operations.
Partner turnover at 53% shows a further significant improvement on last year’s 67%, which in itself was a
reduction on the previous year’s 85%. This level of turnover is getting close to industry best practice.
Levels of staff training also remained at very high levels, with 94% of partners and 100% of managers fully trained for their positions.
The continued focus on accident prevention within the KFC stores saw lost time injuries per million hours worked at 26, a further improvement on 30 achieved last year. Whilst most injuries are minor, a major initiative for the new year is achieving further significant gains in store safety.
The KFC brand continues to drive the growth of the company, with the momentum of its transformation programme building both sales and margins to where the brand contributes 70% of group sales and 84% of EBITDA margins respectively.
17 18
KFC lOGO
CHICKEN FIllETGARDEN SAlAD
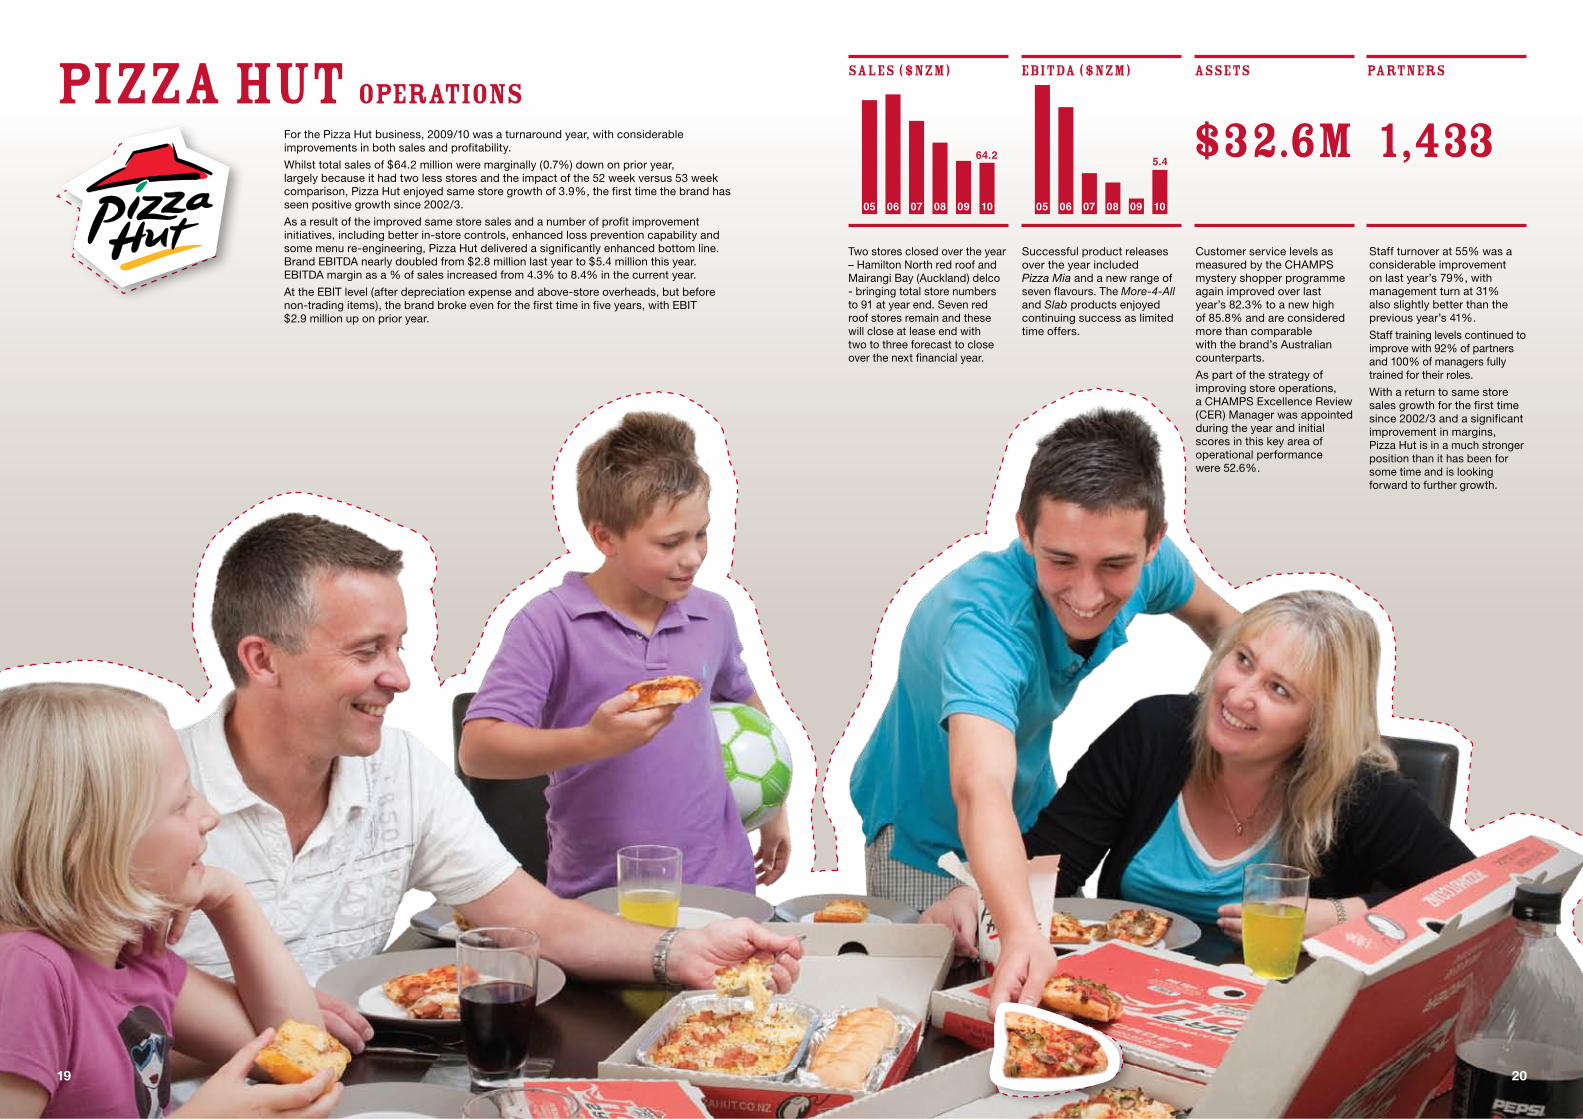
PIZZA HUT operationssales ($NZm) ebitDa ($NZm) partNers
For the Pizza Hut business, 2009/10 was a turnaround year, with considerable improvements in both sales and profitability.
Whilst total sales of $64.2 million were marginally (0.7%) down on prior year, largely because it had two less stores and the impact of the 52 week versus 53 week comparison, Pizza Hut enjoyed same store growth of 3.9%, the first time the brand has seen positive growth since 2002/3.
As a result of the improved same store sales and a number of profit improvement initiatives, including better in-store controls, enhanced loss prevention capability and some menu re-engineering, Pizza Hut delivered a significantly enhanced bottom line. Brand EBITDA nearly doubled from $2.8 million last year to $5.4 million this year. EBITDA margin as a % of sales increased from 4.3% to 8.4% in the current year.
At the EBIT level (after depreciation expense and above-store overheads, but before non-trading items), the brand broke even for the first time in five years, with EBIT $2.9 million up on prior year.
Two stores closed over the year – Hamilton North red roof and Mairangi Bay (Auckland) delco - bringing total store numbers to 91 at year end. Seven red roof stores remain and these will close at lease end with two to three forecast to close over the next financial year.
Successful product releases over the year included Pizza Mia and a new range of seven flavours. The More-4-All and Slab products enjoyed continuing success as limited time offers.
Customer service levels as measured by the CHAMPS mystery shopper programme again improved over last year’s 82.3% to a new high of 85.8% and are considered more than comparable with the brand’s Australian counterparts.
As part of the strategy of improving store operations, a CHAMPS Excellence Review (CER) Manager was appointed during the year and initial scores in this key area of operational performance were 52.6%.
Staff turnover at 55% was a considerable improvement on last year’s 79%, with management turn at 31% also slightly better than the previous year’s 41%.
Staff training levels continued to improve with 92% of partners and 100% of managers fully trained for their roles.
With a return to same store sales growth for the first time since 2002/3 and a significant improvement in margins, Pizza Hut is in a much stronger position than it has been for some time and is looking forward to further growth.
1,43305 06 07 08 09 10 05 06 07 08 09 10
64.2 5.4
assets
$32.6M
2019
slice of pizza
PIZZA HUT lOGO

STARBUCKS sales ($NZm) assetsebitDa ($NZm) partNers
The Starbucks Coffee operation saw a fall in same store sales of 2.9%, with total revenues down $2.5 million to $30.5 million for the year. This is the first drop in same store sales for the brand in five years and, although relatively small, is being aggressively addressed.
Profitability, however, improved 9.6% or $0.3 million on prior year to an EBITDA of $3.2 million (10.6% of sales). This was as a result of a more favourable exchange rate on imported coffee, stronger in-store controls and some product rationalisation.
Store numbers reduced by one over the year to 41 with the closure of the Palmerston North store (at lease end).
Customer service ratings were very satisfactory, with the year’s result of 91% comparable to the prior year at 90%.
Partner turnover at 64% was a significant improvement over last year’s 84%.
Staff training levels were satisfactory, with 86% of partners now fully trained and 85% of managers certified for their roles.
The Starbucks Coffee imperatives for the new year are to return to same store sales growth, whilst building on store margins.
434$9.1M 05 06 07 08 09 10 05 06 07 08 09 10
30.53.2
21 22
COFFEE OPERATIONS
STARBUCKS lOGO
GOOD
turnaround
STARBUCKSHOT CUP
GOOD
turnaround

23 24
Eduard (Ted) Koert van Arkel FNZIMChairman
Mr van Arkel has been a professional director since retiring from the position of Managing Director of Progressive Enterprises Limited in November 2004. He joined the board in September that year and was elected chairman in July 2006. Mr van Arkel currently serves as Chairman of Charlie’s Group Limited, Unitec New Zealand Limited and Colorite Group Limited. He is also a director of NZX listed companies Allied Work Force Group Limited and Postie Plus Group Limited, as well as a director of the following private companies: Nestle New Zeland Limited, Danske Mobler Limited, Paper Plus New Zealand Limited and Lockwood Group Limited. Mr van Arkel is a director of the Auckland Regional Chamber of Commerce & Industry Limited, is President of Youthtown Inc. and is a director of his family-owned companies Lang Properties Limited and Van Arkel & Co Limited. Mr van Arkel sits on the board’s audit committee and remuneration committee.
Sue H Suckling B.Tech (Hons), M.Tech (Hons), OBEDirector
Ms Suckling is a professional director with over 20 years governance experience with public and private companies. She was appointed to the board in June 2006. She is currently Chairperson of the New Zealand Qualifications Authority, Barker Fruit Processors Limited, HSR Governance Limited, ECL Group Limited, Carter Price Rennie Limited, the Risk & Assurance Committee for the Ministry of the Environment and the Risk & Audit Committee Education Review Office. She is a director of TYTM Development Limited, Air Scientifics NZ Limited and Acemark Holdings Limited, and a member of the Takeovers Panel and the Risk & Audit Committee NZ Food Safety Authority. Ms Suckling sits on the board’s audit and remuneration committees.
Danny Diab FAICD, Dip CD, Dip CM, FICMDirector
Mr Diab was appointed to the board in October 2002 and is based in Australia where he owns and operates a number of Pizza Hut restaurants in Sydney in addition to other business interests. He has more than 23 years’ experience in the pizza industry and is regarded as one of the leading Pizza Hut franchisees in Australia. He is currently president of the Australasian Pizza Association Inc, and a director of the Pizza Hut Advertising cooperative and Premier Stainless Steel Pty Limited. Mr Diab sits on the board’s remuneration committee.
David A Pilkington BSc, BE(Chem), Dip Dairy Sci & TechDirector
The former Managing Director of New Zealand Milk Limited, Mr Pilkington is also Chairman of Prevar Limited, Ruapehu Alpine Lifts Limited and Tecpak Industries Limited. He is also a director of Douglas Pharmaceuticals Limited, Ballance Agri-Nutrients Limited, Ports of Tauranga, Rangatira Limited and Zespri Group Limited. Mr Pilkington is also a shareholder and director of NZ Biotechnologies Limited and his own consulting company, Excelsa Associates Limited. He is an independent appointee to the Wellington City Council Audit and Risk Management Sub-Committee and a trustee for the New Zealand Community Trust. Mr Pilkington was appointed to the board in July 2004 and chairs the board’s audit committee.
28 FEB 2010 AUDITED VS PRIOR %
28 FEB 2009 AUDITED
$NZ000's
Continuing operations:SalesKFC 223,228 5.5 211,531Pizza Hut 64,158 (0.7) 64,595Starbucks Coffee 30,463 (7.6) 32,980Total sales 317,849 2.8 309,106Other revenue 495 4.9 472Total operating revenue 318,344 2.8 309,578Cost of goods sold (255,136) 0.7 (256,879)Gross margin 63,208 19.9 52,699Distribution expenses (3,781) 10.4 (4,221)Marketing expenses (16,716) 4.1 (17,438)General and administration expenses (12,945) (22.4) (10,572)EBIT before non-trading 29,766 45.4 20,468Non-trading (558) 88.8 (4,974)EBIT 29,208 88.5 15,494Interest income 32 52.4 21Interest expense (1,474) 62.6 (3,943)Net profit before tax 27,766 139.9 11,572Taxation expense (8,230) (148.1) (3,317)Net profit after tax (NPAT) from continuing operations 19,536 136.7 8,255Total profit after tax (NPAT) 19,536 136.7 8,255Total NPAT excluding non-trading 19,926 69.8 11,736
consolidated income statement
% sales % sales
EBITDA before G&AKFC 46,268 20.7 21.8 37,993 18.0Pizza Hut 5,403 8.4 95.0 2,771 4.3Starbucks Coffee 3,224 10.6 9.6 2,941 8.9Total 54,895 17.3 25.6 43,705 14.1
RatiosNet tangible assets per security (net tangible assets divided by number of shares) in cents 25.6c 12.7cCost of goods sold are direct costs of operating stores: food, paper, freight, labour and store overheadsDistribution expenses are costs of distributing product from storeMarketing expenses are call centre, advertising and local store marketing expensesGeneral & administration expenses (G&A) are non-store related overheads
YES!
IMPROVEMENT
IMPROVEMENT
YES!