2-1 relations and functions objectives students will be able to: 1)analyze and graph relations...
TRANSCRIPT
2-1 Relations and FunctionsObjectives
Students will be able to:
1) Analyze and graph relations
2) Find functional values
Note: You cannot spell function without “fun”

Terminology
• Ordered pair: a pair of coordinates, written in the form (x, y), used to locate any point on a coordinate plane• Relation: a set of ordered pairs• Domain: the set of all x-coordinates of the
ordered pairs of a relation• Range: the set of all y-coordinates of the
ordered pairs of a relation
Functions
• A function is a special type of relation in which each element of the domain is paired with exactly one element of the range.
• One-to-one function: a function where each element of the range is paired with exactly one element of the domain

Mappings
A mapping is a way of showing how each member of the domain is paired with each member of the range.
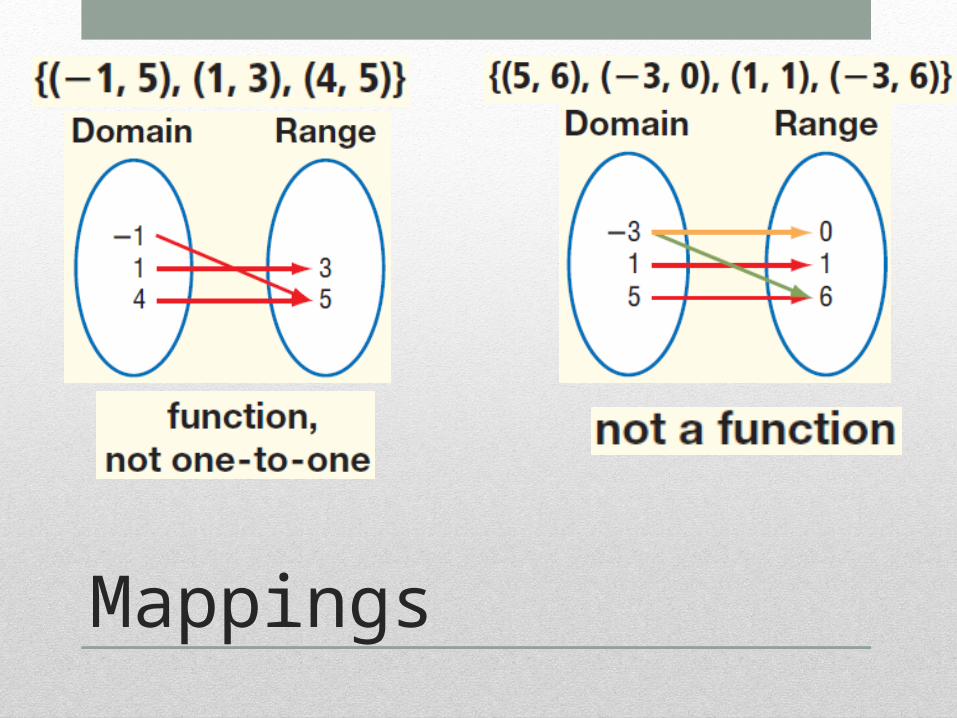
Mappings
Example 1
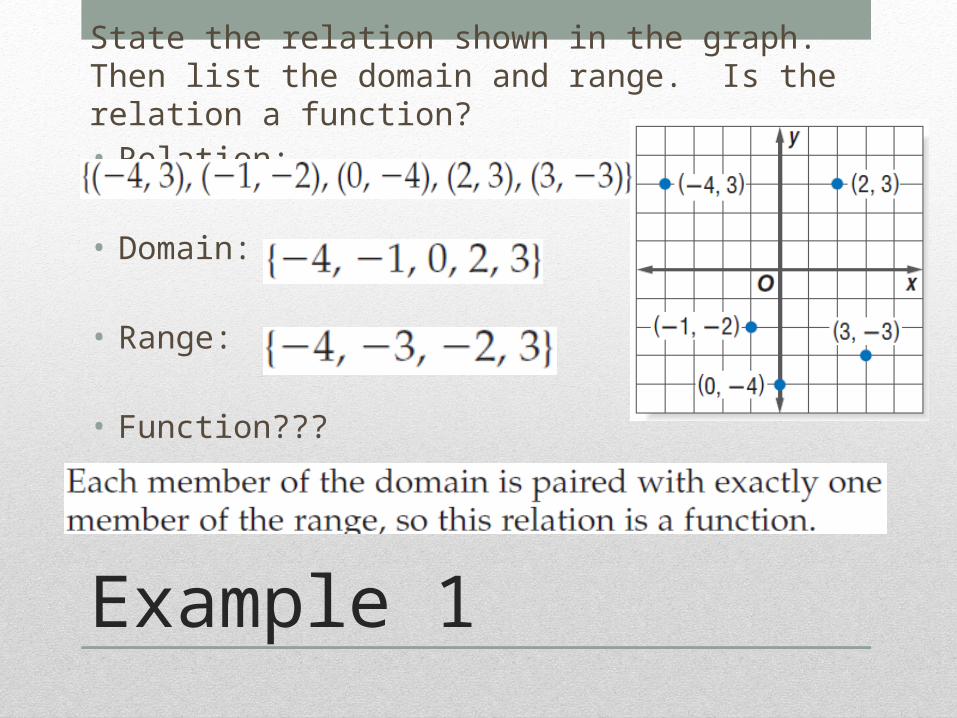
State the relation shown in the graph. Then list the domain and range. Is the relation a function?• Relation:
• Domain:
• Range:
• Function???
You try
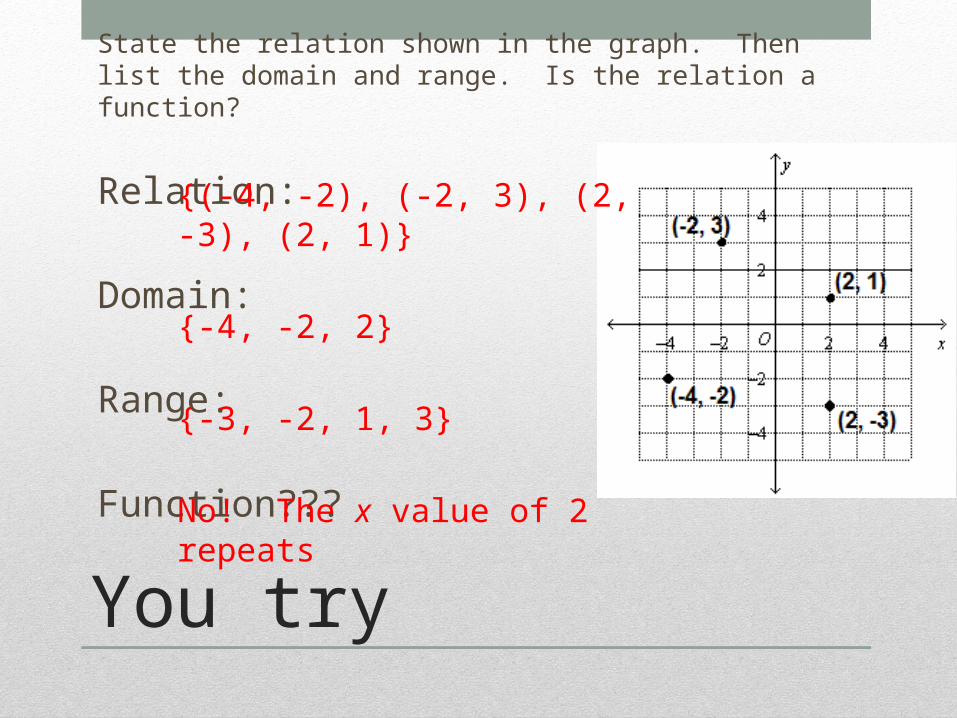
State the relation shown in the graph. Then list the domain and range. Is the relation a function?
Relation:
Domain:
Range:
Function???
{(-4, -2), (-2, 3), (2, -3), (2, 1)}
{-4, -2, 2}
{-3, -2, 1, 3}
No! The x value of 2 repeats

Vertical Line Test
• When given a graph of a relation, one can perform a vertical line test to determine whether a relation is a function.
• If a vertical line, does not intersect the graph in more than one point, then the relation is a function. If they do intersect the graph in more than one point, then the relation is not a function.

Vertical Line Test

Example 2: Vertical line Test
Yes, is a function Not a function
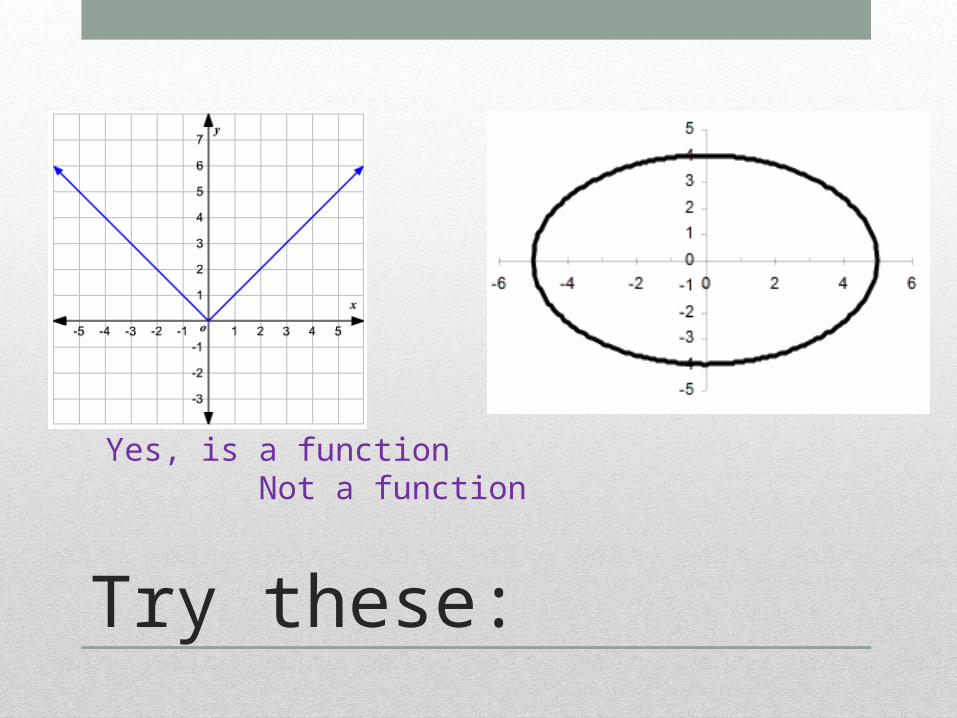
Try these:
Yes, is a function Not a function
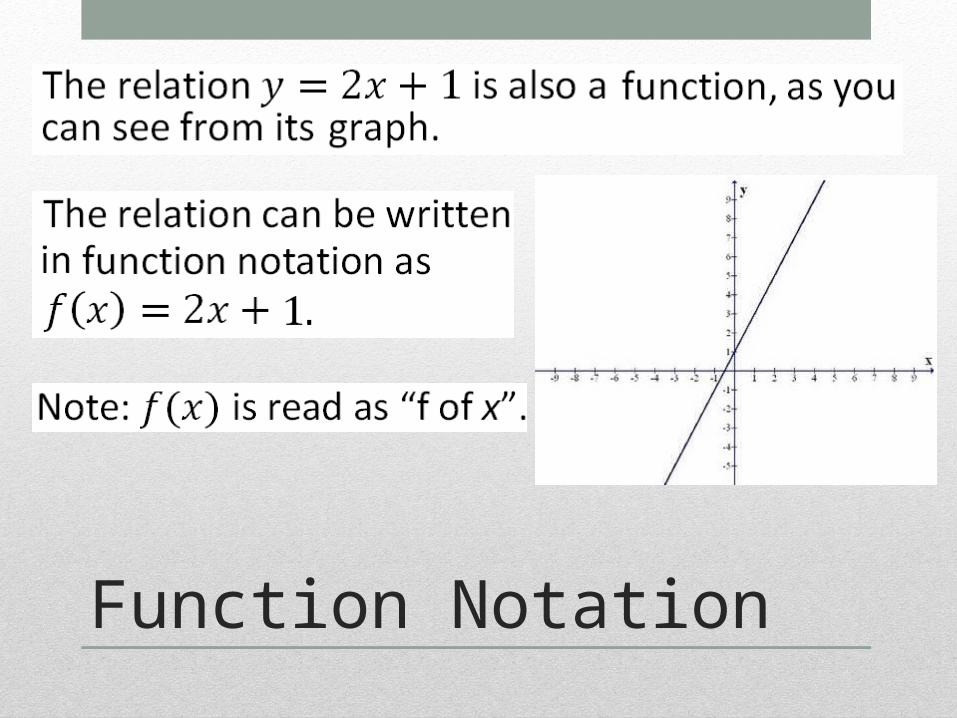
Function Notation

Example 3

You Try!

2-2 Linear EquationsObjective
Students will be able to identify and graph linear equations and functions

Linear Equations
• A linear equation is the equation of a straight line.• The only operations that exist in linear equations are
addition, subtraction, and multiplication of a variable by a constant.
• Linear equations are often written in slope-intercept form (y=mx + b).
• Linear functions can be written in the form f(x)=mx + b.• What linear equations would not be linear functions?

Graphing w/ Intercpets
• One way to graph a linear equation is by finding its x-intercept and y-intercept.
• The x-intercept is the point at which the graph crosses the x-axis. At this point, the y value will be 0. The ordered pair will be (x, 0).
• The y-intercept is the point at which the graph crosses the y-axis. At this point, the x value will be 0. The ordered pair will be (0, y).

Example 1:
Find the x-intercept and the y-intercept for each equation. Then use the intercepts to graph the equation.
x-intercept:
y-intercept:

You try.
x-intercept:
y-intercept:

Problems w/ Intercepts!
NOTE: When finding intercepts, there are times when you will not attain two ordered pairs. Remember, to graph a linear equation, you need at least two ordered pairs. Times you will not attain two ordered pairs occur when:
1) The equation is vertical x=constant
2) The equation is horizontal y=constant
3) Both intercepts occur at (0, 0)
Let’s look at an example…

Graph?!
x-intercept:
y-intercept:

Other Graphing Methods
When you do not attain two ordered pairs via the intercept method, you have a few options.
1) You can create a table of x and y values. This is a way of attaining a few ordered pairs to help you graph the line.
2) If the equation is in slope-intercept form, use the y-intercept and slope to graph the line. If it is not in slope-intercept form, get it in slope-intercept form!
2-3 SlopeObjectives
Students will be able to:
1) Find and use the slope of a line
2) Graph linear equations using slope-intercept form

Slope…
• The slope of a line is the ratio of the change in y-coordinates to the corresponding change in x-coordinates
• Slope is also referred to as rate of change.

Four types of slope

Example 1:
Find the slope of the line that passes through each pair of points.
a) (-1, 4) and (1, -2)
b) (1, 3) and (-2, -3)
c) (6, 4) and (-3, 4)

You Try
Find the slope of the line that passes through each pair of points.
d) (-6, -3) and (6, 7)
e) (5, 8) and (5, 0)

Slope-Intercept Form
y = mx + b
Why is it so useful?
The equation gives us two pieces of information we need to graph a linear equation: it’s slope, and it’s y-intercept. If we have these pieces of information we can graph any linear equation.

Example 2: Graph each equation.

You Try
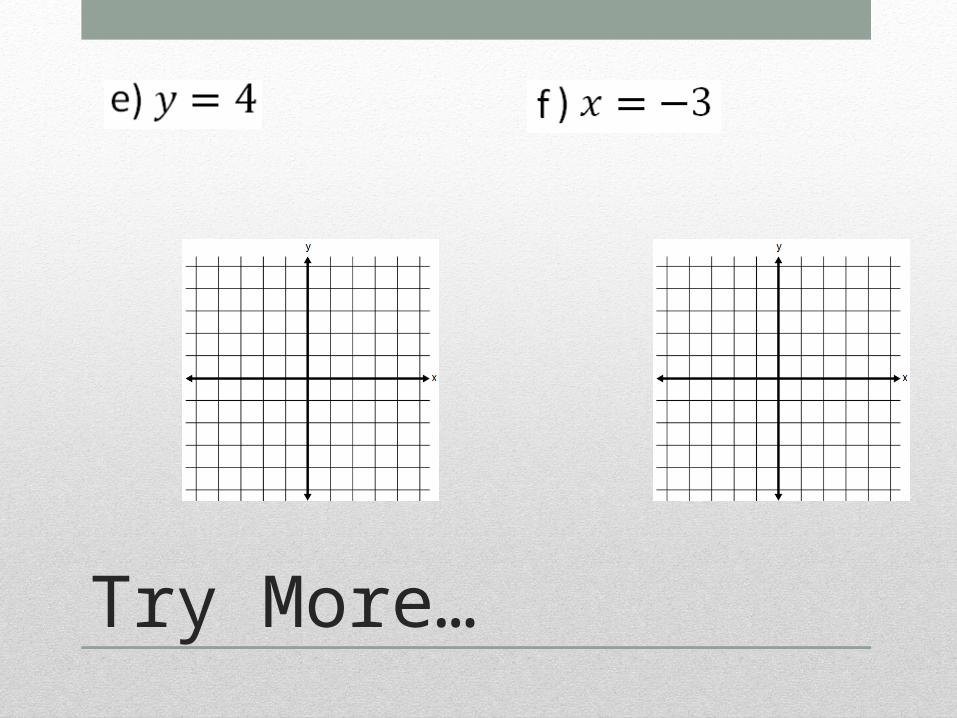
Try More…
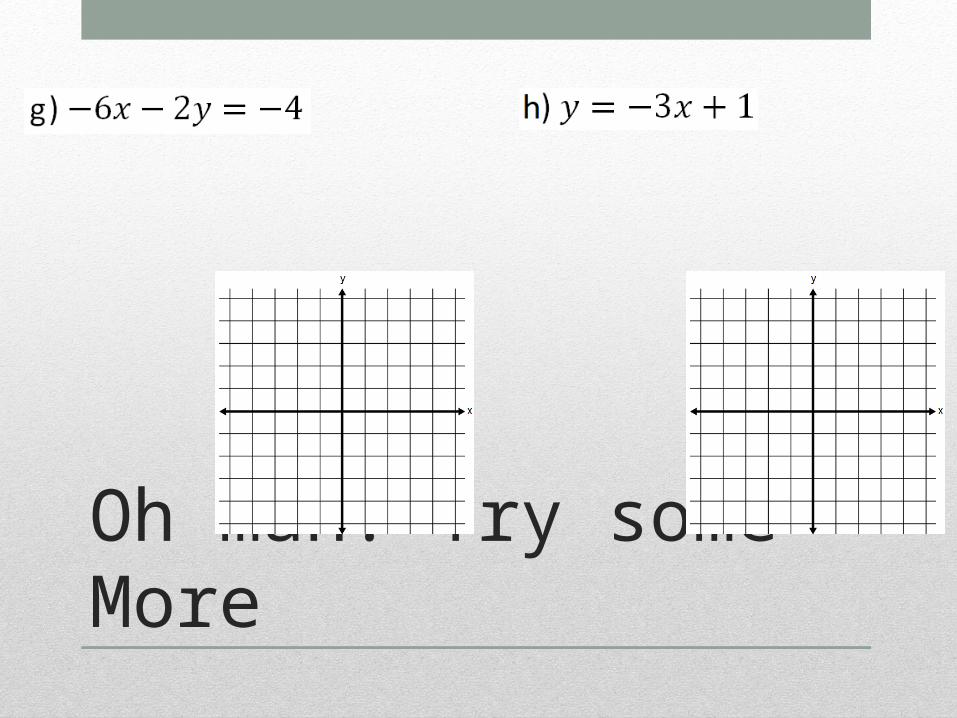
Oh man! Try some More