2 0 1 7 - tbsホールディングス · tokyo broadcasting system television, inc. (tbs tv) saw...
TRANSCRIPT

Tokyo Broadcast ing System Holdings, Inc.
INVESTOR INFORMATION 2017

Net Sales(Millions of Yen)
Operating Income(Millions of Yen)
Ordinary Income(Millions of Yen)
Pro�t Attributable to Owners of Parent(Millions of Yen)
Total Assets(Millions of Yen)
Contents
23456
11
Financial FiguresThe �nancial �gures used in this report are those used in the Japanese ”Tanshin,” which has been created in accordance with the provisions set forth in the Japanese Financial Instruments and Exchange Act. Thus, all �gures have been rounded down to the nearest million yen.
Forward-Looking Statements
To Our StakeholdersAt a GlanceOrganizationCorporate DataBusiness ReportConsolidated Financial Statements
1517192224
Major IndicesSegment InformationTBS TelevisionFinancial Data of Major Group Companies TBS Networks
Total Net Assets(Millions of Yen)
355,363
17/3
19,878
17/3
17/3
16,136
707,063
17/3
517,430
17/3
15,72815,69616,188
15/314/313/3
17,179
16/3
15/314/313/3
12,811
9,6449,173
16/3
14,497
456,118
385,971344,473
15/314/313/3
458,208
16/3
26,207
17/3
347,817354,338352,351
18,91518,09617,671
653,732579,039559,626
15/314/313/3 15/314/313/3
348,539
16/3
15/314/313/3
15/314/313/3
649,970
16/3
22,678
16/3
This report contains forward-looking statements based on management’s assumptions and beliefs in light of the information currently available. These statements are subject to risks and uncertainties that could cause actual results to differ materially from those discussed in this report. Such risks include, but are not limited to, market trends, economic conditions and changes in industry regulations.
INVESTOR INFORMATION 2017Tokyo Broadcasting System Holdings, Inc. 1
Consolidated Financial Highlights

INVESTOR INFORMATION 2017Tokyo Broadcasting System Holdings, Inc. 2
To Our Stakeholders
Tokyo Broadcasting System Television, Inc. (TBS TV) saw
audience ratings improve in the second half-year
compared with the first half-year in the all-day, golden,
prime, and non-prime time slots. Among the best-received
TV dramas during this period were The Full-Time Wife
Escapist and A LIFE: A LOVE. High audience ratings
were also achieved during the 2017 World Baseball
ClassicTM competition by live broadcasts from the fiercely
fought battles of the Japan National Baseball Team.
TBS Radio Inc. continues its evolution toward the next
generation of radio through expansion with Internet
distribution services such as Wide FM, radiko, and
Radio Cloud. In our Multi-Visual Ventures and Cultural
Events Business, the 360-degree theater IHI STAGE
AROUND TOKYO opened in March 2017 in the Toyosu
district of Tokyo and has enjoyed daily success. A
variety of events was also offered at the new Akasaka
Sacas development, which, together with Akasaka ACT
Theatre and Akasaka BLITZ, has become a byword for
the Akasaka district.
Elsewhere, we decided on the joint establishment in
July 2017 of Premium Platform Japan Co., Ltd., a new
company whose main business will be to provide pay
video streaming and related services. Additionally, we
were appointed strategic media partner to ispace, Inc.,
which manages Team HAKUTO, the only Japanese
participant in the Google Lunar XPRIZE competition to
explore the surface of the moon.
We at the TBS Group will continue to take on new
challenges for the future. Guided by the commitment
“From TBS,” and backed by the firm support and
understanding of our stakeholders, we look forward to
continued corporate growth.
June 2017
Shinji TakedaPresident & Representative Director
Tokyo Broadcasting System Holdings, Inc.
Tokyo Broadcasting System Television, Inc.
The following is a brief summary of business operations during the fiscal year ended March 31, 2017.

Our Business
Business Activities (Year ended March 31, 2017)
Broadcasting Business¥219.1 billion
Multi-Visual Ventures and Cultural Events Business¥120.9 billion
Real Estate Business¥15.2 billion
Terrestrial TVbroadcasting
Terrestrial radiobroadcasting
Satellitebroadcasting
Manufacture &sale of cosmetics
Real estateleasing
Miscellaneousretailing
Net & mobilecontents
Planning &production of audio & visual
contents
The Group covers a wide range of businesses essentially including broadcasting. We aim to become the best media group that provides the
most powerful contents and software in the areas of information, entertainment, lifestyle and culture.
61.7%34.0%
4.3%
INVESTOR INFORMATION 2017Tokyo Broadcasting System Holdings, Inc. 3
At a Glance
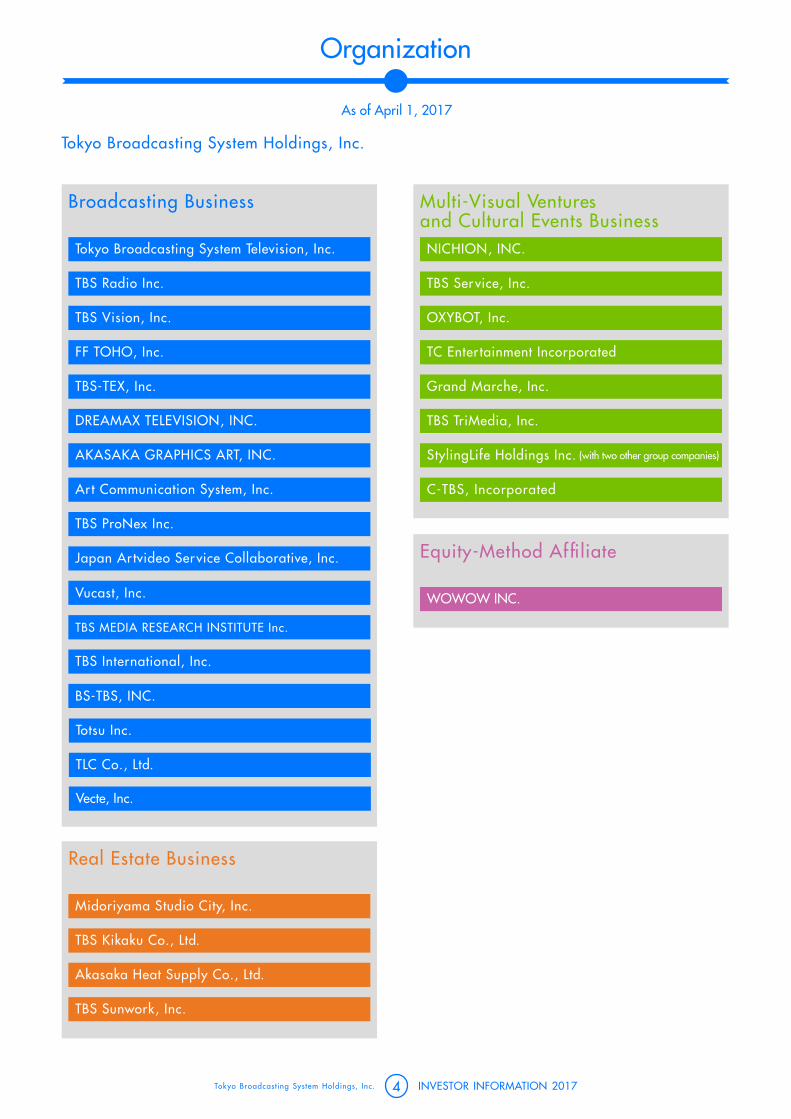
Tokyo Broadcasting System Holdings, Inc.
Broadcasting Business Multi-Visual Venturesand Cultural Events Business
Equity-Method Af�liate
NICHION, INC.
TBS Ser vice, Inc.
OXYBOT, Inc.
TC Enter tainment Incorporated
Grand Marche, Inc.
TBS TriMedia, Inc.
StylingLife Holdings Inc. (with two other group companies)
C-TBS, Incorporated
WOWOW INC.
Totsu Inc.
TLC Co., Ltd.
Tokyo Broadcasting System Television, Inc.
TBS Radio Inc.
TBS Vision, Inc.
FF TOHO, Inc.
TBS-TEX, Inc.
DREAMAX TELEVISION, INC.
AKASAKA GRAPHICS ART, INC.
Ar t Communication System, Inc.
TBS ProNex Inc.
Japan Ar tvideo Ser vice Collaborative, Inc.
TBS MEDIA RESEARCH INSTITUTE Inc.
TBS International, Inc.
BS-TBS, INC.
Real Estate Business
Midoriyama Studio City, Inc.
TBS Kikaku Co., Ltd.
Akasaka Heat Supply Co., Ltd.
TBS Sunwork, Inc.
Vucast, Inc.
Vecte, Inc.
INVESTOR INFORMATION 2017Tokyo Broadcasting System Holdings, Inc. 4
Organization
As of April 1, 2017

INVESTOR INFORMATION 2017Tokyo Broadcasting System Holdings, Inc. 5
Corporate Data
As of April 1, 2017
Date of EstablishmentHead Office
Paid-in CapitalNumber of Employees
Major Shareholders
May 10, 1951 (Registered on May 17)5-3-6 Akasaka, Minato-ku, Tokyo 107-8006, Japanwww.tbsholdings.co.jpStock Code: 9401, TSE First Section¥54,986,892,896Tokyo Broadcasting System Holdings, Inc. 271Tokyo Broadcasting System Television, Inc. 1,079TBS Radio Inc. 58
Name of shareholder Number of shares held (shares)
Percentage held(%)
The Master Trust Bank of Japan, Ltd.(Pension Account-Pension Trust Account held for DENTSU INC.) 9,310,500 5.32
The Master Trust Bank of Japan, Ltd.(Trust Account) 9,273,000 5.30
Mainichi Broadcasting System, Inc. 8,848,100 5.06
MITSUI & CO., LTD. 7,691,000 4.40
Sumitomo Mitsui Banking Corporation 5,745,267 3.28
Mitsui Fudosan Co., Ltd. 5,713,728 3.27
NTT DOCOMO, INC. 5,713,000 3.26
Panasonic Corporation 5,643,180 3.23
Nippon Life Insurance Company 5,006,235 2.86
BIC CAMERA INC. 4,190,000 2.39
(as of March 31, 2017)
1 Newsroom at TBS Television2 Sub-control room at TBS Television
3 Akasaka Biz Tower4 TBS Holdings Head Office
5 On set at TBS Television studio for news programs6 On set at TBS Television studio for variety shows
1 3 5
2
4
6

INVESTOR INFORMATION 2017Tokyo Broadcasting System Holdings, Inc. 6
Business Report
The Current Position of Tokyo Broadcasting System Holdings, Inc. and Its Subsidiaries
From April 1, 2016 to March 31, 2017
1 Business Activities and Results
Japan’s economy continues on a path of modest recovery,
with improvements seen in the employment and income
environment. Meanwhile, the outlook remains unclear due to
uncertainties in overseas economies, such as a slowdown in
Asian emerging economies, including China, and US policy
developments after the presidential election.
Against this backdrop, consolidated net sales of the Group
in the fiscal year ended March 31, 2017 increased by 2.0%
from the previous fiscal year to ¥355,363 million, operating
income increased by 15.7% to ¥19,878 million, ordinary
income increased by 15.6% to ¥26,207 million, and profit
attributable to owners of parent increased by 11.3% to
¥16,136 million.
BroadcastingConsolidated net sales from the Broadcasting Business
segment increased by 2.5% from the previous fiscal year to
¥219,175 million, while operating income increased by
24.4% to ¥5,973 million.
Tokyo Broadcasting System Television, Inc., the core of the
Broadcasting Business, posted a 0.5% increase in time
Rio de Janeiro Olympics 2016© PHOTO KISHIMOTO
Rio de Janeiro Olympics 2016© PHOTO KISHIMOTO
revenue and a 3.2% increase in spot revenue for the fiscal
year under review from the previous year. Regarding time
sales, one-off programs, such as Rio de Janeiro Olympics
2016, 2017 World Baseball ClassicTM, and Leaders II, as
well as increased unit prices of regular programs, contributed
to an increase in sales. The company recorded approximately
the same level of sales as in the previous year when one-off
programs such as IAAF World Championships Beijing 2015
contributed significantly to sales.
Concerning spot sales, with advertisements increasingly
placed by many industries, such as “information,
telecommunications and broadcasting” “food,” and “alcoholic
and other beverages,” the Company enjoyed strong audience
ratings and expanded its market share among key television
stations in Tokyo. In addition, the Company recorded growth
rate of the volume of advertisements, which was higher than
that in the Kanto region (+1.6% year on year).
With the BS digital broadcasting market remaining firm,
BS-TBS, INC. continued to perform well, posting a 5.8%
increase in sales from the previous year due to its unique
strategic programing that increases customer satisfaction,
especially for BS broadcasting. Operating income also rose
8.3% over the previous year, despite an increase in production
costs accompanying efforts to strengthen programing.

INVESTOR INFORMATION 2017Tokyo Broadcasting System Holdings, Inc. 7
Business Report
TBS Radio Inc. continued to rank No. 1 in the radio listener
ratings research conducted by Video Research Ltd. in the
Tokyo metropolitan area in February. Since the research
undertaken for August 2001, the Company has retained top
position for 94 consecutive terms covering 15 years and
eight months. Sales and operating income for the fiscal year
under review increased 1.4% and 3.1%, respectively, from
the previous year as a result of comprehensive efforts to
expand measures to improve sales and control costs.
Multi-Visual Ventures and Cultural EventsNet sales from the Multi-Visual Ventures and Cultural Events
Business segment increased by 1.5% over the previous fiscal
year to ¥120,986 million, while operating income increased
by 27.4% to ¥6,168 million.
In film business, 64 (SIX FOUR: Part 1 and Part 2 (starring
Koichi Sato, etc. and directed by Takahisa Zeze)), released in
May and June, respectively, became a smash hit with a box
office revenue of ¥3,680 million Among exhibitions, Van
Gogh and Gauguin: Reality and Imagination, held at the
Tokyo Metropolitan Art Museum attracted more than 390,000
visitors, while 265,000 people visited Lascaux: The Cave
Paintings of the Ice Age, at the National Museum of Nature
and Science. As the first exhibition under a decade-long
partnership agreement between TBS and Kunsthistorisches
Museum of Vienna, Lucas Cranach the Elder: 500 Years of the
Power of Temptation, was presented at the National Museum
of Western Art and at the National Museum of Art, Osaka.
From April 1, 2016 to March 31, 2017
Among concerts and stage performances, blockbuster hits, such
as TAKE FIVE 2, THE SCARLET PIMPERNEL, and Romeo &
Juliette, were presented consecutively at the TBS Akasaka ACT
Theater. Besides, at other theaters, a new episode of the Hyper
Projection Performance Haikyuu!!, and other dramas were
staged. All of these performances received good reviews.
Akasaka Sacas attracted many people throughout the year,
organizing new events aggressively in addition to annual
events, such as Mama Sacas, in the spring, Deliciacas, in the
summer and White Sacas, in the winter.
64 (SIX FOUR)© 2016 64 Film Production Committee

INVESTOR INFORMATION 2017Tokyo Broadcasting System Holdings, Inc. 8
Business Report
From April 1, 2016 to March 31, 2017
Real Estate BusinessNet sales from the Real Estate Business segment decreased by
1.8% from the previous fiscal year to ¥15,202 million, and
operating income increased by 2.7% to ¥7,736 million.
Akasaka Biz Tower maintains sound business operations
with occupancy rates of both offices and commercial facilities
remaining high. Regarding Akasaka Sacas, we aim to cement
its status as a mecca for a creative broadcasting culture by
continuing to hold various events that bring the TBS Group
and its programs closer to customers and viewers.
Regarding the media business, while growth in the number of
subscribers on each platform slowed in the CS business, sales
improved due to strategic programing for unique content and
sports content, focusing on live broadcasting of professional
baseball games. In the DVD business, a drama series titled
The Full-Time Wife Escapist, recorded strong sales. Businesses
targeting overseas also reported strong sales growth,
particularly sales in the SASUKE, format.
The StylingLife Group increased both sales and operating
income. In its core retailing business, StylingLife Holdings Inc.
PLAZASTYLE COMPANY, cosmetics and sundry items
performed well and secured about the same level of sales as
in the previous year, while sales of clothing items were weak
because the apparel industry has been in a slump. Income
increased as a result of efforts to control costs. The cosmetics
business remained satisfactory, reflecting an expansion of
sales of hit products.
The Full-Time Wife Escapist
SASUKE

INVESTOR INFORMATION 2017Tokyo Broadcasting System Holdings, Inc. 9
Business Report
From April 1, 2016 to March 31, 2017
2 Capital Investment
Total capital investment in the fiscal year under review was
¥10,600 million.
IHI STAGE AROUND TOKYO was constructed and opened
at Toyosu, Koto-ku, Tokyo. This theater features rotating
audience seats that are surrounded by stages on 360
degrees.
Concerning equipment for producing television programs,
we upgraded the lighting, dimming, and lifting equipment at
Midoriyama M5 Studio, which is a base for producing
dramas. We also renewed the imaging equipment of A
Studio, the flagship studio of TBS, located in the Broadcasting
Center at Akasaka where we produce comedy/variety shows
and live programs. The Company introduced a 4K imaging
system, including studio cameras, so that we can create the
first 4K programs for TBS in the studio.
Regarding the internal core system, we installed XDCAM, a
mainstream file recorder, in the Recording Center. It is on
schedule for transition to file-based production following
termination of the maintenance service for VTR equipment and
the need to update obsolete devices.
Regarding wireless equipment, we upgraded the FPU
equipment for live broadcasts of road races and specific radio
mic equipment, in accordance with the radio frequency shift
plan. The scheduled transition of all related equipment has
now been completed.
In news reporting, the Company updated the anti-vibration
camera mount of Helicopter #1, which is essential for
recording news video. Video shot at night is much brighter
with the latest highly sensitive camera being employed.
At digital terrestrial relay stations around Kanto area, several
facilities prepared in time for the launch of digital
broadcasting are aging. We are continuing our efforts to
maintain and upgrade digital relay stations in cooperation
with companies in the Kanto area to ensure and support a
region-wide environment for receiving television broadcasts.
3 Capital Procurement
Total interest-bearing debt of the Group at the end of the
fiscal year under review was ¥23,169 million (excluding
lease obligations), consisting of ¥769 million in short-term
loans and ¥22,400 million in long-term loans payable
(including the current portion).
To ensure flexible access to operating capital, as of the
end of the fiscal year under review, StylingLife Holdings
Inc., a consolidated subsidiary of the Company, had
established the commitment line agreements, totaling
¥3,000 million with multiple financial institutions (the
balance of the funds drawn is nil, and the available
balance is ¥3,000 million).
Besides the above, with the aim of streamlining of funds,
some of the account receivables are in the process of
liquidation.
IHI STAGE AROUND TOKYO IHI STAGE AROUND TOKYO

INVESTOR INFORMATION 2017Tokyo Broadcasting System Holdings, Inc. 10
Business Report
From April 1, 2016 to March 31, 2017
4 Priorities
We were made aware of the further diversification of our
lifestyles and the ways we access media in the fiscal year
ended March 2017. Technology that may ultimately change
people’s lifestyles, such as the Internet of Things (IoT) and
artificial intelligence (AI), are finally being put to practical
use. Accordingly, younger generations are increasingly
turning away from television. However, we are confident
that the pioneering content the Group produces, such as
dramas and comedy/variety shows, remains highly
accessible to young people and has significant value in
online video distribution services. In fact, we produced
some high-profile smash hit dramas this fiscal year.
Nevertheless, we should not be content with the situation.
We need to continue to create content that is in line with the
times with a perspective that is always fresh as we seek to
further strengthen our content production capabilities.
These efforts are consistently yielding results, such as
increasing operating income. Now, with work-style reforms
in mind, the Company aims to respond to your trust and
support by integrally and efficiently managing all media
owned by the Group, including terrestrial broadcasting,
broadcasting satellite (BS), communications satellite (CS),
radio, and the Internet.
In the broadcasting segment, revenue and earnings
growth continued mainly in terrestrial TV broadcasting,
supported by strong viewer ratings and a steady increase in
spot revenue. However, there is uncertainty in the
advertisement market. We will endeavor to gain firmer
support and trust by providing strong, quality content.
In the business segment, IHI STAGE AROUND TOKYO, a
theater where the audience is surrounded on 360 degrees
by stages and screens, finally opened in March, 2017 at
Toyosu, Koto-ku, Tokyo. The theater has been filled since its
opening, and we are pleased with its flying start. The
playhouse, which will be in operation until 2020, the year
of the Olympics, is getting attention from the theatrical
community around the world, along with the original theater
in Holland, for its unprecedented dynamic staging.
Concerning overseas business, SASUKE, and other TV
formats remain popular.
TBS Radio, Inc. has been ranked No. 1 in radio listener
ratings in the Tokyo metropolitan area since August 2001,
which is a great achievement. However, radio broadcasting
continues to face headwinds, and there is no time to take a
wait-and-see approach. The Internet distribution service for
radiko radio broadcasting, which was launched in 2010, is
gaining recognition for radio broadcasting, particularly
among young people, and is expanding opportunities for
people to listen to radio broadcasts.
BS-TBS, Inc., with its constant and steady growth, is
maximizing synergies among the Group companies, is
contributing to developing revenue sources of the Group,
and is steadily preparing for the upcoming 4K broadcasting.
In May 2016, the Company announced the Group
Medium-Term Management Plan 2018, which defines
priorities: enhancing the broadcasting business, building a
comprehensive media strategy, improving the Group’s
profitability, and making progress on diversifying earnings
through new business development with strategic
investments, and implemented the plan. The fiscal year
ended March 2017 was the first year of the medium-term
framework. While sales fell slightly short of the final year’s
expectations, earnings reached the targeted level two years
ahead of schedule. Indeed, the firm spot market in the Kanto
area supported this performance, but the Company is
encouraged that each business segment worked hard to
improve profit while strengthening its capabilities. Although
the advertising market is seeing some uncertainty, the
Company aims to continue moving toward the next stage
and to sustain growth.
We appreciate your support and strive to fulfill the
mandate of our shareholders.

INVESTOR INFORMATION 2017Tokyo Broadcasting System Holdings, Inc. 11
Consolidated Financial Statements
Consolidated Balance Sheets (Unaudited)
As of March 31, 2017 and 2016Millions of yen
2016 2017Assets
Current assetsCash and deposits ¥ 74,273 ¥ 69,731Notes and accounts receivable—trade 38,850 42,460Securities 1,001 449Merchandise and finished goods 7,245 7,472Program rights and work in process 6,173 6,378Raw materials and supplies 561 520Prepaid expenses 10,880 10,206Deferred tax assets 3,666 3,326Other 7,004 5,086Allowance for doubtful accounts (177) (153)Total current assets 149,478 145,479
Noncurrent assets
Property, plant and equipmentBuildings and structures 199,705 200,685
Accumulated depreciation (102,822) (106,060)
Buildings and structures, net 96,883 94,624Machinery, equipment and vehicles 90,281 90,149
Accumulated depreciation (79,094) (79,502)
Machinery, equipment and vehicles, net 11,187 10,647Tools, furniture and fixtures 30,433 30,972
Accumulated depreciation (27,635) (28,357)
Tools, furniture and fixtures, net 2,797 2,615Land 84,008 84,003Lease assets 3,728 4,348
Accumulated depreciation (1,826) (2,233)
Lease assets, net 1,901 2,115Construction in progress 2,211 3,786Total property, plant and equipment 198,988 197,792
Intangible assetsSoftware 4,438 3,929Goodwill 20,392 18,595Lease assets 129 68Other 1,601 1,253Total intangible assets 26,560 23,846
Investments and other assetsInvestment securities 260,218 326,689Long-term loans receivable 226 216Deferred tax assets 1,212 1,161Long-term prepaid expenses 350 241Other 13,160 11,839Allowance for doubtful accounts (225) (203)Total investments and other assets 274,942 339,944
Total noncurrent assets 500,492 561,583Total assets ¥ 649,970 ¥ 707,063

INVESTOR INFORMATION 2017Tokyo Broadcasting System Holdings, Inc. 12
Consolidated Financial Statements
Consolidated Balance Sheets (Unaudited)
As of March 31, 2017 and 2016Millions of yen
2016 2017Liabilities
Current liabilities
Notes and accounts payable—trade ¥ 34,048 ¥ 36,130
Short-term loans payable — 769
Current portion of long-term loans payable 1,200 5,400
Current portion of bonds 30,000 —
Accounts payable—other 11,768 12,077
Income taxes payable 4,671 6,083
Accrued consumption taxes 1,526 1,513
Accrued expenses 5,364 1,620
Provision for bonuses 973 4,684
Provision for directors’ bonuses 108 107
Provision for removal of noncurrent assets — 432
Other provision 274 287
Other 5,342 8,122
Total current liabilities 95,278 77,231
Noncurrent liabilities
Long-term loans payable 22,400 17,000
Provision for environmental measures 119 121
Net defined benefit liability 15,971 16,206
Lease obligations 829 1,001
Deferred tax liabilities 42,926 63,201
Other 14,236 14,871
Total noncurrent liabilities 96,483 112,402
Total liabilities 191,762 189,633
Net assets
Shareholders’ equity
Capital stock 54,986 54,986
Capital surplus 50,477 50,489
Retained earnings 255,701 267,127
Treasury stock (20,674) (20,543)
Total shareholders’ equity 340,490 352,059
Accumulated other comprehensive income
Valuation difference on available-for-sale securities 103,362 150,247
Deferred gains or losses on hedges 294 174
Foreign currency translation adjustment 8 5
Remeasurements of defined benefit plans (69) (42)
Total accumulated other comprehensive income 103,596 150,385
Non-controlling interests 14,121 14,985
Total net assets 458,208 517,430
Total liabilities and net assets ¥ 649,970 ¥ 707,063

INVESTOR INFORMATION 2017Tokyo Broadcasting System Holdings, Inc. 13
Consolidated Financial Statements
Consolidated Statements of Income (Unaudited)
As of March 31, 2017 and 2016Millions of yen
2016 2017Net sales ¥ 348,539 ¥ 355,363
Cost of sales 241,466 242,067
Gross profit 107,072 113,296
Selling, general and administrative expenses 89,893 93,417
Operating income 17,179 19,878
Non-operating income
Interest income 49 25
Dividends income 4,583 5,087
Equity in earnings of affiliates 1,030 986
Other 1,059 1,141
Total non-operating income 6,723 7,241
Non-operating expenses
Interest expenses 777 468
Loss on retirement of noncurrent assets 171 77
Other 275 366
Total non-operating expenses 1,224 912
Ordinary income 22,678 26,207
Extraordinary income
Gain on sales of investment securities 478 212
Gain on step acquisitions 61 —
Total extraordinary income 539 212
Extraordinary loss
Provision of allowance for removal — 432
Loss on sales of shares of subsidiaries and associates — 215
Loss on valuation of investment securities 105 129
Loss on retirement of noncurrent assets — 101
Impairment loss 130 79
Total extraordinary losses 235 958
Profit before income taxes 22,982 25,461
Income taxes—current 6,077 8,537
Income taxes—deferred 1,343 39
Total income taxes 7,421 8,576
Profit 15,561 16,884
Profit attributable to non-controlling interests 1,064 747
Profit attributable to owners of parent ¥ 14,497 ¥ 16,136

INVESTOR INFORMATION 2017Tokyo Broadcasting System Holdings, Inc. 14
Consolidated Financial Statements
Consolidated Statements of Cash Flows (Unaudited)
As of March 31, 2017 and 2016Millions of yen
2016 2017Cash flows from operating activities
Income before income taxes ¥ 22,982 ¥ 25,461Depreciation and amortization 14,385 13,614Amortization of long-term prepaid expenses 235 108Amortization of goodwill 1,439 1,796Gain on valuation of investment securities 105 129Gain on sales of investment securities (478) (212)Increase (decrease) in allowance for noncurrent asset retirement expense — 432Increase (decrease) in provision for bonuses 6 3,711Increase (decrease) in net defined benefit liability (51) 268Loss on retirement of noncurrent assets 171 178Loss (gain) on step acquisitions (61) —Increase (decrease) in allowance for doubtful accounts (104) (45)Interest and dividends income (4,632) (5,113)Interest expenses 777 468Equity in (earnings) losses of affiliates (1,030) (986)Decrease (increase) in notes and accounts receivable—trade (439) (3,593)Decrease (increase) in inventories 1,725 (391)Decrease (increase) in prepaid expenses 306 752Increase (decrease) in notes and accounts payable—trade 1,329 2,087Other, net (3,663) (1,694)Subtotal 33,003 36,974Interest and dividends income received 4,877 5,408Interest expenses paid (776) (582)Income taxes refund 942 2,532Income taxes paid (5,709) (7,847)Net cash provided by operating activities 32,337 36,485
Cash flows from investing activitiesPurchase of property, plant and equipment (5,954) (9,459)Purchase of intangible assets (2,511) (1,236)Purchase of investment securities (464) (240)Proceeds from sales of investment securities 661 266Purchase of stocks of subsidiaries and affiliates (118) (544)Proceeds from purchase of shares in subsidiaries resulting in change in scope of consolidation (36) —Other, net (532) 1,135Net cash used in investing activities (8,956) (10,078)
Cash flows from financing activitiesIncrease in short-term loans payable — 769Decrease in short-term loans payable (200) —Repayment of long-term loans payable (1,200) (1,200)Redemption of bonds — (30,000)Proceeds from disposal of treasury shares 365 328Cash dividends paid (3,510) (4,707)Cash dividends paid to non-controlling interests (157) (173)Repayments to non-controlling shareholders — (1,350)Other, net (623) (384)Net cash used in financing activities (5,326) (36,718)
Effect of exchange rate change on cash and cash equivalents (49) (2)Net increase (decrease) in cash and cash equivalents 18,005 (10,314)Cash and cash equivalents at beginning of period 56,728 74,734Increase (decrease) in cash and cash equivalents resulting from change of scope of consolidation — 2,971Cash and cash equivalents at end of period ¥ 74,734 ¥ 67,391

INVESTOR INFORMATION 2017Tokyo Broadcasting System Holdings, Inc. 15
Major Indices
Earnings per Share(Yen)
Ratio of Ordinary Income to Total Assets (%)
Equity Ratio(%)
Return on Equity(%)
Ratio of Operating Income to Net Sales(%)
Net Assets per Share(Yen)
17/3
3.4
15/3
2.9 2.8
3.2
13/3 14/3 16/3
3.3
92.46
17/3
60.27
13/3
61.22
14/3
79.12
15/3
83.12
16/3
17/313/3 14/3 15/3 16/3
5.6
17/313/3 14/3
4.54.44.6
15/3
4.9
16/3
71.1
17/3
63.366.7
13/3
58.7
14/3 15/3
68.3
16/3
2,878.29
17/3
2,158.00
13/3
2,263.65
2,689.56
14/3 15/3
2,545.60
16/3
3.9
3.2 3.2 3.1
3.5

INVESTOR INFORMATION 2017Tokyo Broadcasting System Holdings, Inc. 16
Major Indices
190,434,968
Number of Shares Issued at the End of the Term (Including Treasury Shares) (Shares)
190,434,968 190,434,968 190,434,968
Cash Flows from Operating Activities(Millions of yen)
Cash Flows from Financing Activities(Millions of yen)
Amount of Treasury Shares at the End of the Term(Shares)
Cash Flows from Investing Activities(Millions of yen)
Cash and Cash Equivalents, at End of Period(Millions of yen)
190,434,968
17/3
36,485
13/3
28,156
14/3
23,038
15/3
27,851
16/3
32,337
67,391
17/3
68,031
13/3
56,312
14/3
56,728
15/3
74,374
16/317/3
–36,718
13/3
–25,475
14/3
–23,567
15/3
–25,242
16/3
–5,326
17/315/313/3 14/3 16/3 17/3
15,871,409
13/3
38,226,794
14/3
28,590,009
15/3
28,404,517
16/3
15,981,914
17/3
–10,078
13/3
–13,649
14/3
–11,326
15/3
–2,326
16/3
–8,956

INVESTOR INFORMATION 2017Tokyo Broadcasting System Holdings, Inc. 17
Segment Information
Consolidated Results by Segment
Capital Expenditures and Depreciation
Consolidated FY2017
Capital expenditures ¥10,627
Depreciation 13,009
TBS Holdings FY2017
Capital expenditures ¥ 233
Depreciation 2,784
TBS Television FY2017
Capital expenditures ¥ 8,223
Depreciation 7,596
(Millions of yen)
(Millions of yen)
FY2017External
sales y/y change Operatingincome y/y change
Broadcasting Business ¥219,175 +5,297 ¥ 5,973 +1,172
Multi-Visual Ventures and Cultural Events Business 120,986 +1,804 6,168 +1,326
Real Estate Business 15,202 –277 7,736 +204
Consolidated Business ¥355,363 +6,824 ¥19,878 +2,699

INVESTOR INFORMATION 2017Tokyo Broadcasting System Holdings, Inc. 18
Segment Information
FY2018 Consolidated and TBS Television Business Results Forecasts
Note: The estimated figures above, which were announced on May 11, 2017, are subject to revision. For the most up-to-date estimated figures, please see the Company’s web site.
Time/Spot, Program Cost Forecasts
Business Results Forecast by Segment
TBS Television FY2018
Net sales ¥218,000
Operating income 9,200
Ordinary income 11,700
Net income 8,000
1st half 2nd half Full year
Time +2.1% -1.8% +0.1%
Spot +1.9% +1.7% +1.8%
Program cost — — ¥98,000 million
Consolidated FY2018
Consolidated net sales ¥357,000
Broadcasting Business 220,000
Multi-Visual Ventures and Cultural Events Business 121,300
Real Estate Business 15,700
Consolidated operating income 20,000
Broadcasting Business 6,100
Multi-Visual Ventures and Cultural Events Business 5,900
Real Estate Business 8,000
Consolidated FY2018
Net sales ¥357,000
Operating income 20,000
Ordinary income 27,300
Profit attributable to owners of parent 17,000
(Millions of yen)
(Millions of yen)
(Millions of yen)
2018
2018

INVESTOR INFORMATION 2017Tokyo Broadcasting System Holdings, Inc. 19
TBS Television 1
Breakdown of TBS Television Income
Year-on-Year Changes in Time/Spot Earnings
FY2017 y/y change
Television ¥184,654 +3,621
Time advertising 85,388 +457
Spot advertising 86,240 +2,686
Program sales in Japan 8,933 +58
Others 4,091 +418
Operations 28,997 +2,647
Real estate 3,065 +95
Total income ¥216,717 +6,364
Q1 Q2 Q3 Q4 Full year
● Time 102.8 95.5 98.3 106.1 100.5
● Spot 103.3 101.9 104.6 102.8 103.2
TBS share among five key broadcasters 18.7 18.9 18.8 19.1 18.9
(Millions of yen)
Apr. May Jun. Jul. Aug. Sep. Oct. Nov. Dec. Jan. Feb. Mar.
2016 2017
(%)
150
120
90
60
Time
Spot
103.8
104.3
101.9
102.4
102.6
103.1106.7
100.4
80.5
100.3106.0
104.9 104.7
105.9
94.1
104.2
96.5
103.9
96.0
103.0
101.0
103.1
121.3
102.5
Asa Chan! SUNDAY MORNING HIRUOBI!

INVESTOR INFORMATION 2017Tokyo Broadcasting System Holdings, Inc. 20
TBS Television 2
Spot Advertising Sales Ranks by Business Category
TBS Television Business Segment Income
FY2017 Growth rate Share
1 Information, telecommunications and broadcasting +4.5 13.6
2 Foods +5.8 10.9
3 Alcoholic and other beverages +5.9 10.2
4 Pharmaceuticals +4.9 9.4
5 Cosmetics and toiletry +4.6 8.2
6 Automobiles and transportation equipment +8.6 6.4
7 Financial services –5.0 6.4
8 Precision instruments and office machines –13.3 5.0
9 Transportation and leisure +2.0 4.8
10 Eating out and related services +13.7 4.5
(Millions of yen)
(%)
(Ranked in order of sales proceeds)
Segment Full year y/y change Remarks
Operations division
Cultural business (events) ¥ 3,440 +950
The number of events increased over the previous year. Revenue rose due to Musée du Petit Prince de Saint-Exupéry à Hakone, which achieved good results throughout the year, as well as well-received exhibitions, such as Van Gogh and Gauguin, Reality and Imagination and Hiroshige Vivid.
Show business 4,041 +395Revenue increased due to successful Haikyuu!! Winners and Losers and Romeo and Juliet in the fourth quarter, in addition to a number of events including TAKE FIVE2 that achieved good results for the full year.
Movies and animation business
Movies 1,548 -165 Revenue decreased due to a decline in the number of movies released compared with the previous year, although 64 (SIX FOUR): Part 1 and Part 2, including DVD versions, were big hits.
Animation 977 +2 Revenue edged up, reflecting strong sales of programs overseas, primarily in Asia.
Content business division
Multi-visual business 4,945 +912Revenues from DVDs increased significantly despite the contraction of the market, reflecting the record hit The Full-Time Wife Escapist in the fourth quarter as well as 99.9, which achieved good results for the full year. On-demand content remained firm.
Overseas business 2,892 +705 Revenue rose due to very strong sales in Asian markets throughout the year, as well as the expansion of SASUKE overseas and strong sales of animation programs in China.
Pay-TV business 9,044 +332Market share expanded thanks to efforts to improve programming and promotions. Revenue increased due to the success of two baseball teams for which the broadcasting rights are held by us.
Licensing business 934 -27 Revenue declined, reflecting the effects of revisions to online shopping programs, although Gudetama continued to achieve good results.
Digital/new business 1,172 -458 Revenue declined mainly due to the termination of content production for carriers.
Total ¥28,997 +2,647
The World Unknown to Matsuko Pittanko Kankan Monitoring

INVESTOR INFORMATION 2017Tokyo Broadcasting System Holdings, Inc. 21
TBS Television 3
FY2017 Viewer Ratings
TV Program Costs (Production Expenses)FY2017 FY2016 y/y change
Q1 ¥23,722 ¥23,528 +193
Q2 24,932 24,725 +206
Q3 23,805 23,473 +332
Q4 25,718 24,398 +1,320
Direct expenses 20,311 18,928 +1,383
Indirect expenses 5,407 5,471 –64
Fiscal year cumulative ¥98,176 ¥96,125 +2,050
FY2018 forecast ¥98,000
Ratings for April 4, 2016 to April 2, 2017, on a weekly basis* 19:00–22:00** 19:00–23:00
(According to research by Video Research Ltd. in the Kanto region)
Major expenses included in TV program costs:
Direct expenses: Program production expenses, fees for broadcasting rights, fine arts production expenses, technical production expensesIndirect expenses: Absorbed costs including depreciation and personnel cost for employees
(%)
(Millions of yen)
All day Golden time* Prime time**
TBS 6.1 (4th) 9.8 (4th) 9.7 (4th)
NTV 8.4 (1st) 12.2 (1st) 11.9 (1st)
TV Asahi 7.3 (2nd) 10.3 (3rd) 10.6 (2nd)
TV Tokyo 2.8 (6th) 6.5 (6th) 6.2 (6th)
Fuji TV 5.7 (5th) 8.0 (5th) 8.0 (5th)
NHK 6.9 (3rd) 11.3 (2nd) 9.8 (3rd)
HUT 41.0 60.9 58.7
Brass Dreams Quartet IQ246, The Cases of a Royal Genius

INVESTOR INFORMATION 2017Tokyo Broadcasting System Holdings, Inc. 22
Financial Data of Major Group Companies
TBS Radio Inc.
BS-TBS, INC.
Grand Marche, Inc.
(Millions of yen)
(Millions of yen)
(Millions of yen)
FY2017
Amount y/y change
Net sales ¥10,825 +150
Operating income 357 +10
Ordinary income 364 +12
Net income 239 +29
FY2017
Amount y/y change
Net sales ¥17,031 +928
Operating income 2,557 +196
Ordinary income 2,595 +201
Net income 1,781 +220
FY2017
Amount y/y change
Net sales ¥12,582 –1,356
Operating income 312 +157
Ordinary income 326 +153
Net income 221 +136
Recorded the highest ratings for 96 consecutive periods from August 2001 to June 2017.

INVESTOR INFORMATION 2017Tokyo Broadcasting System Holdings, Inc. 23
Financial Data of Major Group Companies
StylingLife Holdings Inc. (Consolidated)FY2017
Amount y/y change
Net sales ¥65,664 +284
Operating income 2,572 +257
Ordinary income 2,434 –300
Net income 1,062 –477
(Millions of yen)
© 2017 Alice Taylor & Thomas Taylor All rights reserved.
Where's Wally? © DreamWorks Distribution Limited. All rights reserved.
ⓒ2017 Those Characters From Cleveland, Inc.

INVESTOR INFORMATION 2017Tokyo Broadcasting System Holdings, Inc. 24
TBS Networks
JNN ( Japan News Network)JRN ( Japan Radio Network)
JNN Overseas Bureaus
London (& Middle East)Paris
Beijing
Moscow
HBC
IBC
TBC
TUFRFC
ABS
TUYYBC
BSN
KNBMRO
FBC
MBS
BSS
TYS
RKB
NBCRKK
MBCMRT
RBC
OBSITV
RNB
KRYRSK
RNC
RKCKUTV
JRT
RCC ABC
WBS
CBC
SBC
UTYYBS
SBS
TUT
TBSTBS R&C
ATVRAB
Bangkok
Los AngelesWashington, D.C.
New YorkSeoulTokyo (TBS)Shanghai
TBS Television and TBS Radio harness two of the most extensive commercial broadcasting networks in Japan, in which 28 TV stations af�liated with the Japan News Network (JNN) and 34 radio stations af�liated with the Japan Radio Network (JRN) nationwide guarantee thorough and quality news gathering. Our news network delivers accurate information in a split second, in alliance with overseas bureaus placed in 10 major cities around the world.
JNN JRNTelevision Radio

5-3-6 Akasaka, Minato-ku, Tokyo 107-8006, Japan Phone: +81-3-3746-1111 Fax: +81-3-3588-6378www.tbsholdings.co.jp/ir/en/
Tokyo Broadcasting System Holdings, Inc.