1Ž. naval postgraduate school …½. naval postgraduate school monterey, california dtic ssep...
TRANSCRIPT

1Ž. NAVAL POSTGRADUATE SCHOOLMonterey, California
DTICELECTESSEP 28 1981
B
THESISDETERMINING THE TRAINING EFFECTIVENESS
AND COST-EFFECTIVENESS OF VISUAL FLIGHTSIMULATORS FOR MILITARY AIRCRAFT
by
George Benjamin Mayer, Jr.
June 1981
Thesis Advisor: W. H. Skierkowski
Approved for public release; distribution unlimited.
!I
UNCLASSIFIEDSECURITY CLASSiPICAION OF TWIS PAG9 (O at e Ea__w
REPORT DOCUMENTATION PAGU *IFORZ COMPLTZNG FORM. NEPONT NMIUNGER"" . GOVT ACCIESSION NO. . RNCIP1I9?5S CATALOG NUMNER
(and Sdeaea86j S. T '"XORT 6PIRoOOCOVERED
" Determining the Training Effectiveness L•aster's Thesis->,\_Land Cost-Effectiveness of Visual Flighl TWAT•
Simulators for Military Aircraft, a. PERFORMING**. REPORT NUMBER
7. AUThOR6- S. CONTRACT ON GRANT NuISER(s)
/ George Benjamin ayer, Jri
9. 9RO~f~y 00 NIATIN AMEAN A50186 0.PRORA E MET. PROJECT. TASK3. ERPRMOG OGANZATOWNAM AN ASREM10.ARA a WOR UINI1T NUMBERS
Naval Postgraduate SchoolMonterey, California 93940
11. CONTROL61NG OFFC P1MANKM AND A00R4SS
Naval Postgraduate School June 191Monterey, California 93940 -*wwM,-'wGs
14, IIOkfT3XIN AOL ACV ANMAt S A6 I0=1 d1A em 0r0 Cm"f#MW*f OUth) Is. SECURITY CLASS. (Ot .ta pue")
- .Unclassified
r& Ck4 ASPICATION/OOWNGRAONG'
IS. WSTRIGUTION ITATEMENT (of We Xoet)WnApproved for public release; distribution unlimited.
17. Do$?TRIGUTIOM ST ATEMENMT (0#*n~ ~ab@ 11080d 10E~s We 5k J9 I tt 011 NO Rapie)
WS SUPPLE9MENTARY MOVESf
,9. K.Ev WoNUS iCaukism. -ewrnl ohmi HI m498006" aw WwOFr or We* 00.) CompuWter animatedFlight simulation Model beards photographic viewCost-benefit analysis Air-to-ground training Transfer of train-Cost effectiveness argalysis Air-to-air training ing measurementCumnpter generated immgery Instrument training Night carrierTraiping effectiveness Cbst-effectiveness models landing trainingU. ~ ~ d ASSre W&C WmI a awe sea"a ad awdi W' was& 4b.
The constraint on vil flow from the Middle East as aý,esult of the 1973 war and the increased sophistication ofAircraft weapons systems are two important factors whichhave contributed significantly to the interest in visualflight simulation as an integral part of military flighttraining. Costs associated with these factors, such asprocurement and fuel costs, are providing pressure to the
00 Ivy 0 It [email protected] UNCLASSIFIED / ",/ _.
""ECU TY C A•A-PICAT4OW OF T"15 PA4% (9b•ln Date b .-,
TIMC?.TWP Trl-
military establishment to improve t :n,Ž ,.. ability toprovide military pilots with visuil. f.. . simulationsystems which do not impair combz.s efic,- aness oraviation safety. This thesis des -. ibos the results offlight simulation utilization by commaercial airlineindustry, analyzes the effectiveness realized by usingflight simulators to supplement military training in
Sdifferent aviation-environments, and outlines methodol-ogies for measuring and improving the cost-effectivenessof the systems. Recommendations for careful study aremade in areas that would improve military utilizationof flight simulation.
II
Acorltsi~n or.
NTIS GRA&I
0'2'l 1 CO(
Ju, ' c t t"•t ..-.-.
By.- .......
DO ora' 1473 2 UNCLASSIFIED
S/ ý111% ~~~WSUWO 4%OWGiUISAYIOF V P&WiN6 000 0U"

Approved for public release; distribution unlimited.
Determining the Training Effectiveness and Cost-Effectivenessfof isalFlight Simulators for Military Aircraft
by
George Benjamin Mayer, Jr.Major, United States Marine CorpsB.S., University of Florida, 1976
Submitted in partial fulfillment of the
requirements for the degree of
MASTER OF SCIENCE IN MANAGEMENT
from the
NAVAL POSTGRADUATE SCHOOLJune 1981
Author d t L .J
Approved by: ___________________
Thesis Advi1--o
Second Reade-r
Ir~n, e a ent of Adnuinist-rati1ve Screince
Dean of Informati.on And Policy Scienices-
3
low -***-*,* --~...z-.- -

ABSTRACT
Trhe constraint on oil flow from the Middle East as a
result of the 1973 war and the increased sophistication of
aircraft weapons systems are two important factors which have
contributed significantly to the interest in visual flight
simulation as 'an integral part of military flight training.
Costs associated with these factors, such as procurement and
fuel costs, are providing pressure to the muilitary establish-
ment to improve their capability to provide military pilots
with visual flight siniulation systems which do not impair
combat effectiveness or aviation safety. This thesis describes
the results of flight simulation utilization by the commercial
airline industry, analyzes the effectiveness realized by using
flight simulators to supplement military training in different
aviation environments, and outlines methodologies for measur-
ing and improving the cost-effectiveness of the systems.
Recommendations for careful study are made in areas that would
improve military utilization of flight simulation.
4
TABLE OF CONTENTS
I. INTRODUCTION------------------------------------------1
A, PURPOSE--------------------------------------------1
B. RESEARCH METHODOLOGY------------------------------ 13
C. THESIS ORGANIZATION------------------------------- 13
II. FLIGHT SIMULATION - AN O)VERVIEW -----------------------14
A. HISTORICAL DEVELOPMIENT OF FLIGHT SIMULATION----- 14
B. VISUAL FLIGHT SIMU1LATION METHODOLOGY --------------16
1. Model Boards -----------------------------------16
2. Computer Generated Imagery (CGI) --------------23
3. Computer Animated Photographic TerrainView (CAPTV) ------------------------------------ 27
C. A DESCRIPTION OF MILITARY FLIGHT SIMULATORS------28
1. A-'JE Night Carrier Landing Trainer,Device 2F 103--------------------------------- 28
2. A-7E Weapons System Trainer, Device2.F 111 ------------------------------------------30
3. Advanced Simulator for Pilot Training(ASPT)------------------------------------------ 31
D. SUMMARY --------------------------------------------- 34
III. FLIGHT SIMULATOR UTILIZATION IN THE COMMERCIALAVIATION INDUSTRY -------------------------------------- 35
A. GENERAL ---------------------------------------------35
B. THE FLIGHT TRAIN:ING CENTER CONCEPT ----------------39
C. FAA RULINGS CONCE'RNING VISUAL FLIGHTSIMULATION----------------------------------------- 42
5

D. A DESCRIPTION OF FLIGHT SIMULATION SYSTEMS------44
E. TRAINING EFFECTIVENESS--------------------------- 47
F. COST SAVINGS OF FLIGHT SIMULATORS ----------------52
G. SUMMARY------------------------------------------- 56
IV. TRAINING EFFECTIVENESS OF MILITARY FLIGHTSIMULATORS-------------------------------------------- 58
A, GENERAL------------------------------------------- 58
B. METHODS OF MEASURING TRAINING EFFECTIVENESS---- 59
C. FACTORS INFLUENCING SIMULATOR TRAININGEFFECTIVENESS------------------------------------- 62
1. Design of Simulator Systems ------------------62
2. Training Programs---------------------------- 66
3. Personnel------------------------------------ 67
4. Expectations--------------------------------- 68
D. TRAINING EFFECTIVENESS REALIZED USING
MILITARY FLIGHT SIMULATORS----------------------- 70
1. Instrument Fl~ying in UndergraduatePilot Training-------------------------------- 70
2. Air-to-Surface Weapons Delivery forthe A-10 Aircraft -----------------------------72
3. Air-to-Air Combat Training -------------------79
4. Night Carrier Landing Training inthe A-7E --------------------------------------84
E. SUMMZARY------------------------------------------ 87
V. COST-EFFECTIVENESS OF MILITARY FLIGHT SIMULATORS --- 88
A. GENERAL -------------------------------------------88
B. NAVAL AIR SYSTEM4S COMMAND COST-EFFECTIVENESS
METHODOLOGY--------------------------------------- 89
C. IMPROVING COST-EFFECTIVENESS USING MICRO-ECONOMIC THEORY AS A FRAMEWORK---,---,-----------. 93
6

D. COST.-EFFECTIVENESS ANALYSIS FOR THE AH-1
HELICOPTER .......................... ---------- 97
• E . THE ANSER MODEL -------------- .................. 102
F. THE COST-EFFECTIVENESS OF USING SIMULATORS* IN THE PILOT SEILECTION PROCESS ----------------- 110
SG. SUMRY.-----------------------------------------. 115
VI. SUMMARY, CONCLUSIONS A17D RECOMMENDATIONS ------------ 117
A. SUMMARY ----------------------------------------- 117
B. CONCLUSIONS ------------------------------------- 119
1. Flight Simulators Improve TrainingEffectiveness ------------------------------ 119
2. Flight Simulators Can Increase Long-RunCost Savings ------------------------------ 120
3. The Cost-Effectiveness of FlightSimulation Can Be Improved ------------------ 120
4. All Levels of Command Must Understandand Support the Flight Simulation System--- 121
C. RECOiNMENDATIONS -------------------------------- 121
APPENDIX A: Simulator and Visual System Requirements ---- 123
LIST OF REFERENCES ---------------------------------------- 131
INITIAL DISTRI:BUTION LIST---------------------------------- 138
7
-4 "

LIST OF TABLES
111-1. Average Training Hours and Costs Per Hour inSimulator and Aircraft for Captain Transitions---- 53
111-2. Direct Operating Cost Comparison --------------------53
111-3. Cost Comparison nf Aircraft Training VersusSimulator Traini..• • -------------------------------- 55
K111-4. Cost Savings----------------------------------------- 55
IV-l. Methods for Measuring Transfer Effectiveness------ 60
IV-2. Bomb Delivery Circular Error Means -----------------65
IV-3. Comparison of Experimental and Control Groupfor Instrument Stage Training ----------------------71
IV-4. t-Statistic and Prob-Values for A-10Air-to-Surface Tasks-------------------------------- 78
IV-5. Pilot GSI Scores Before and After SimulatorTraining ---------------------------------------------82
V-1. Cost-Benefit Analysis for Instrument FlightSimulators ------------------------------*-- -------- 92
V-2. Simulators Hours vs. Aircraft Hours Neededto Pass Final Flight Check -------------------------C
V-3. Naval Air Training Costs Associated withAttrition (Jet Training) -------------------------- 1
8

iN ,
LIST OF FXGURES
II-1. Camera Motion Systems ------------------------ ----- 18
11-2. Probe Optical Systems ----------------------------- 19
11-3. Airfield and Terrain Lighting --------------------- 2,
11-4. Display System ------------------------------------ 22
1 111-1. Organization Chart for Flight Training Center ---- 40
IV-l. 300 Dive Bomb CEP -------------------------------- 75
IV-2. 200 LALD Dive Bomb --------------------------------- 75
IV-3. 150 LAB Dive Bomb --------------------------------- 76
IV-4. 200 LALD "Pop-up" ---------------------------------- 76
IV-5. 150 LAB "Pop-up" --------------------------------- 77
IV-6. 50 Low Angle Strafe ------------------------------- 77
V-1. Production Isoquant ------------------------------ 93
V-2. Production Isoquant and Cost Constraint ---------- 95
V-3. Isoquant and Cost Constraint for AH-1Running Landing ---------------------------------- 101
V-4. Effectiveness Determination Schematic ------------ 106
V-5. Cost Process ------------------------------------- 107
V-6. The Relationship Between Attrition Rate onthe Simulator Test and Overall Costs ofiIlecruitment, Selection, and Training ------------- 113
9
4!

ACKNOWLEDGEMENT
The author wishes to express sincere appreciation to the
following people who provided the much needed support that
is necessary when conducting thesis research:
- Mr. Paul Bacon, United Airlines
- Dr. Dan Boger, Assistant Professor, Navai Postgraduate School
- Colonel A. Castalano, USMC, Naval Training Equipment Center
- Commander Norm Green, USN, Code N-43A, Chief of NavalEducation and Traaiing
- AL. John Hancock., American Airlines
- Captain W. R. Jones, Delta Airlines
- Mr. George Kitchel, Vought Corporation
- Mr. Larry Lanchoney, Naval Training Equipment Center
- Major Bob Magnus, USMC, Headquarters U.S. Marine Corps
- Major Mike Moorman, USAF, 82 FTW/DOT, Williams AFB, AZ
- Dr. Stephen Osborne, Seville Research Corporation
- Commander Larry Rasmussen, USN, Air Forces Human ResourcesLaboratory, Williams, AFB, AZ.
- Dr. L. E. Ryan, Naval Training Equipment Center
- Lieutenant Colonel W. H. Skierkowski, UsMC, Instructor,Naval Postgraduate School
- The Library Staff, Naval Postgraduate School
- My wife, Jill, and children, Bryan and Jennifer
10
-.-,

I. INTRODUCTION
A. PURPOSE
According to LtGen. William J. White, Deputy Chief of
Staff for Aviation, United States Marine Corps, the most
critical issues facing Marine aviation during the 1980's will
be procuring sufficient aircraft to meet the Soviet threat,
retaining sufficient pilots to man the squadrons, and preserv-
ing those aircrews and airframes through safety [Ref. I]. It
is anticipated that the F/A-18 will be introduced to the
fighter community in 1984 and the AV-8B will reach the attack
squadrons in 1986. The procurement of these new high perfcr-
mance, sophisticated aircraft supports the issue of meeting
the threat; however, pilot retention and aviation safety are
two areas where continuous studies are being performed to
formulate answers that will satisfy the Department of Defense
goals of: (1) development of better pilots and aircrew mem-
bers; (2) maintenance and improvement in combat readiness;
(3) reduction of training and operating costs; and (4) con-
servation of scarce resources such as energy, weapons, and
ammunition [Ref. 2].
Constraints such as procurement costs, fuel costs, risks
of flying, ecology, and training effectiveness interject addi-
tional problems in the search for answers to the issues.
_;. i11
iI

An area of study that is being strongly considered to provide
some relief from the conitraints is military use of flight
sLmulators.
The world's military forces will spend almost $10 billion
by 1987 on development and procurement of all types of simu-
lators and trainers. The Navy will allocate $1.7 billion for
flight simulators and trainers. Major Navy flight simulator
programs include the AV-BB estimated at $52 million and the
F/A-18 with a projected investment of $172 million [Ref. 3].
The simulators will be state-of-the-art incorporating such
characteristics as computer generated imagery (CGI) and six
degrees of freedom motion systems to provide the pilot with
the most realistic simulation possible, resulting in more
effective training. An additional powerful side effect of
these simulator procurements is thu savings they represent in
men, fuel, weapons, and supply support resulting in a coeffi-
cient of resource savings. The value of this coefficient has
been estimated to vary between 5 and 100, depending on the
type of military mission being trained in the simulator
[Ref. 4].
The purpose of this thesis is to determine whether visual
flight simulators for military aircraft are cost effective.
A secondary purpose is to gather data supporting the training
value of visual flight simulation and its impact on cost
effectiveness.
12

IN
B. RESEARCH METHODOLOGY
Information gathering for this thecis includes library
research, phone conversations with personnel from Headquarters
Marine Corps, Naval Air Systems Command, Navai .Araining Equip-
ment Center, and on-site visits to a major airline Flight
Training Center, and the Human Resources Laboratoiy, Williams
AFB, Arizona, to conduct interviews with persons involved in
both cost and training effectiveness of visual flight
simulators.
C. THESIS ORGANIZATION
Section II provides a background for flight simulation
including historical development, a description of simulation
methodology such as model boards, computer animated photographic
terrain view (CAPTV), and CGI, and a brief description of three
tactical flight simulators, two of which are used by the Navy
and one by the Air Force. Section III examines flight simu-
lator utilization within commercial aviation. Section IV
presents the training effectiveness of military flight simu-
lators to include methods of measurement, aralysis of training
data, and characteristics of the flight simulator program
necessary to support positive training effectiveness. Section
V will examine the cost effectiveness of flight simulation,
and Section VI will include the author's conclusions and
recommendations.
13
LOW
II. FLIGHT SIMULATION -AN OVERVIEW
A. HISTORICAL DEVELOPMENT OF FL.IGHT SIMULATION
The historical development of flight simulation seems to
be as innovative as the airplane; itself. The motivational
requirement for inventiveness was stimulated by the hazards
of flying,, th~e skill required to pilot the airplane,, and the
need for a training aid to supplement pilot inst3.u1c1ion. The
earliest devices appear to have been devised around 1910 usin~g
actual aircraft, some of which were propnsed to be moved at
speed in the air supported by balloons and overhead gantries.
A training device which came to be known as the "penguin" was
also developed during this time period. It was a stubbed-
winged aircraft capable of moving across large open spaces
but incapable of leaving the ground [R~ef. 5].
Prior to World War I, special training apparatuses, not
based upon actual aircraft, were being developed to meet
specific needs of pilot training. For example, small aircraft-
like devices that were mounted on pivoted universal joints
were used to show pilots the effect of prevailing winds on
aerodynamic control surfaces. During the war,, research
attempts were made tu use simulators for aircrew training.
One such research attempt was a piece of equipment, produced
in France in 1917, which used an aircraft fuselage based on
14

IMOWOPO
a pivotal mouint and incorporated compressed air which produced
.1 ~variatiozus of response and aerodynami.c feel with variances in
speed [Ref. 6].
In 1924, two English research workers, Reid and Burton,
evaluated the importance of full cockpit simulation by meas-
uring responses of pilots in a modified aircraft fuselage
with fu~nctioning displays and controls. It was concluded
K that devices which required pilots to make responses on the
ground to those made while airborne could be used to:, (1)
test the pilot's ability to fly and land successfully; (2)
assess the rate of acquisition of flying skills; (3) train
pilots on those particular motor skills necesoary for aircraft
controllability; and (4) classify subjects for different forms
of flying service [Ref. 7].
The year 1929 proved to be a "banner year" in flight sim-~
ulator development. Roeder, a German invenvtor, proposed an
apparatus for instruction in the navigation of vehicles in
free space utilizing a hydraulic system which would reproduce
the physical movement of an airship not unlike the motion sys-
tems. of some present-day simulators. The first Link Trainer
was also completed in 1929 by Edwin Link in the basement of
his father's piano and organ factory in Binghamton, New York '
[Ref. 8]. The drive for the instruments and motion system of
the trainer used the pneumatic technology of organ building.
The Second World War provided the necessary impetus for the
development of the Link as a mass produced ground trainer.
15

- _"_,__ _ _ _ _ _ _--
After the war, development of computer technology acce!-
erated the design of 1light simulators. First in analog and
now in digital form, the modern flight simulator uses sophis-
ticated computing techhniques to animate full scale represen-
tations of the operational environment experienced by the
pilot during flight.
B. VISUAL FLIGHT SIMULATION METHODOLOGY
1. Model Boardis
The first method described by the author for visual
flight simulation is the model board. As a reference, the
systm described is; used on the 2F-87 Operational Flight
Trainer (OFT) for the P-3 aircraft.
The model ]board provides the pilot with a realistic
view of external scenery enabling flight crews to perform
visual take-off, a)pproach, landing, and low-altitude maneuver-
ing procedures under day, dusk, or night conditions. The
instructor also has the capability of selectively varying
visibility and cloud effects.
The mrin system includes a rigid three dimensional
model of an airfield located in the midst of a landscape
scaled at 2000:1, e closed circuit color television system,
and a gantry-mounted camera which moves over the model board
to simulate height and movement over the ground In response
to simulator, control inputs. A special optical probe, attached
in front of the camera, contains servo-controlled optical
16
NNE
systems which simulate the in-flight pitch, bank, and heading
changes [ReZ'. 9!. A camera trip system is provie-d to prevent
damage to the optical probe due to contact with the model
surface. Using a pressure-sensitive switch for activation
allows the~ came-ra and probe to re~tract should it come in con-
tact with the model.
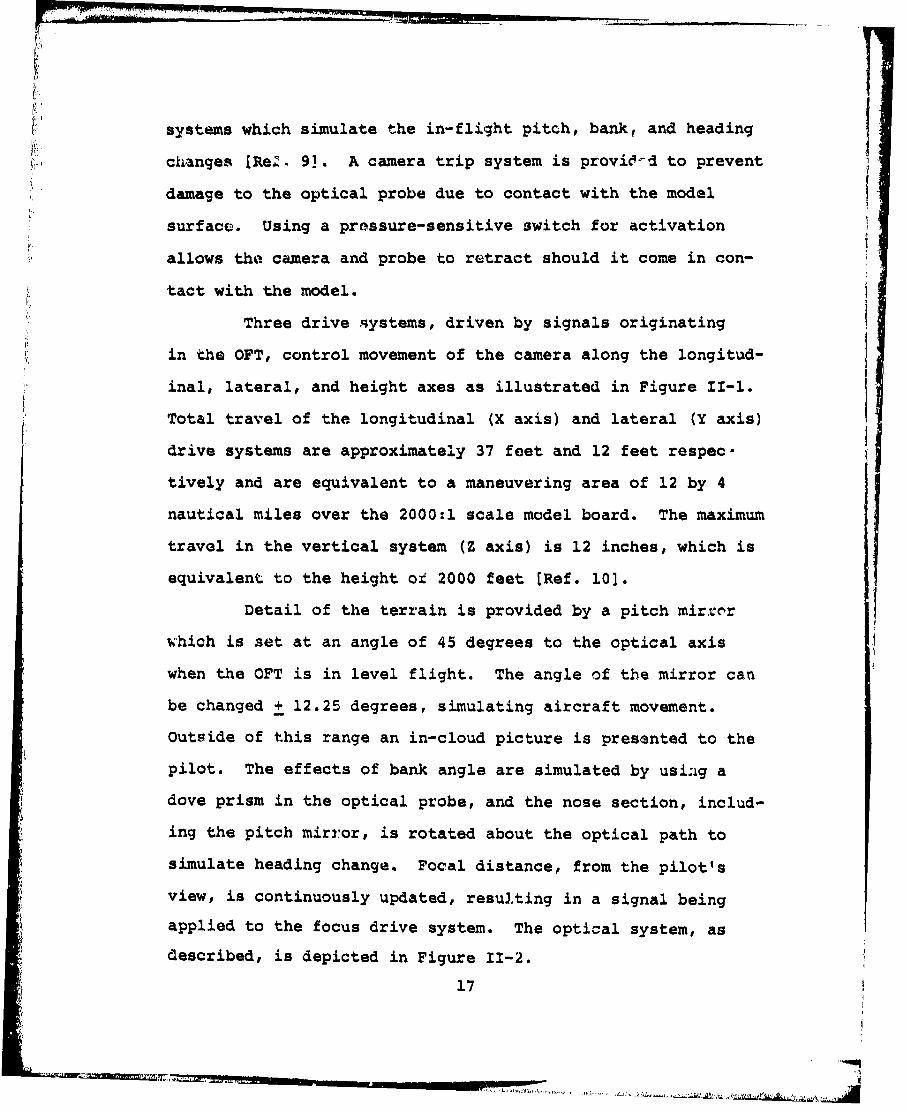
Three drive systems, driven by signals originating
in the OFT, control movement of the camera along the longitud-
inal, lateral, and height axes as illustrated in Figure 11-1.
Total travel of the longitudinal (X axis) and lateral (Y axis)
drive systems are approximately 37 feet and 12 feet respec-
tively and are equivalent to a maneuvering area of 12 by 4
nautical miles over the 2000:1 scale model board. The maximum
travel in the vertical system (Z axis) is 12 inches, which is
equivalent to the height oi 2000 feet [Ref. 10].
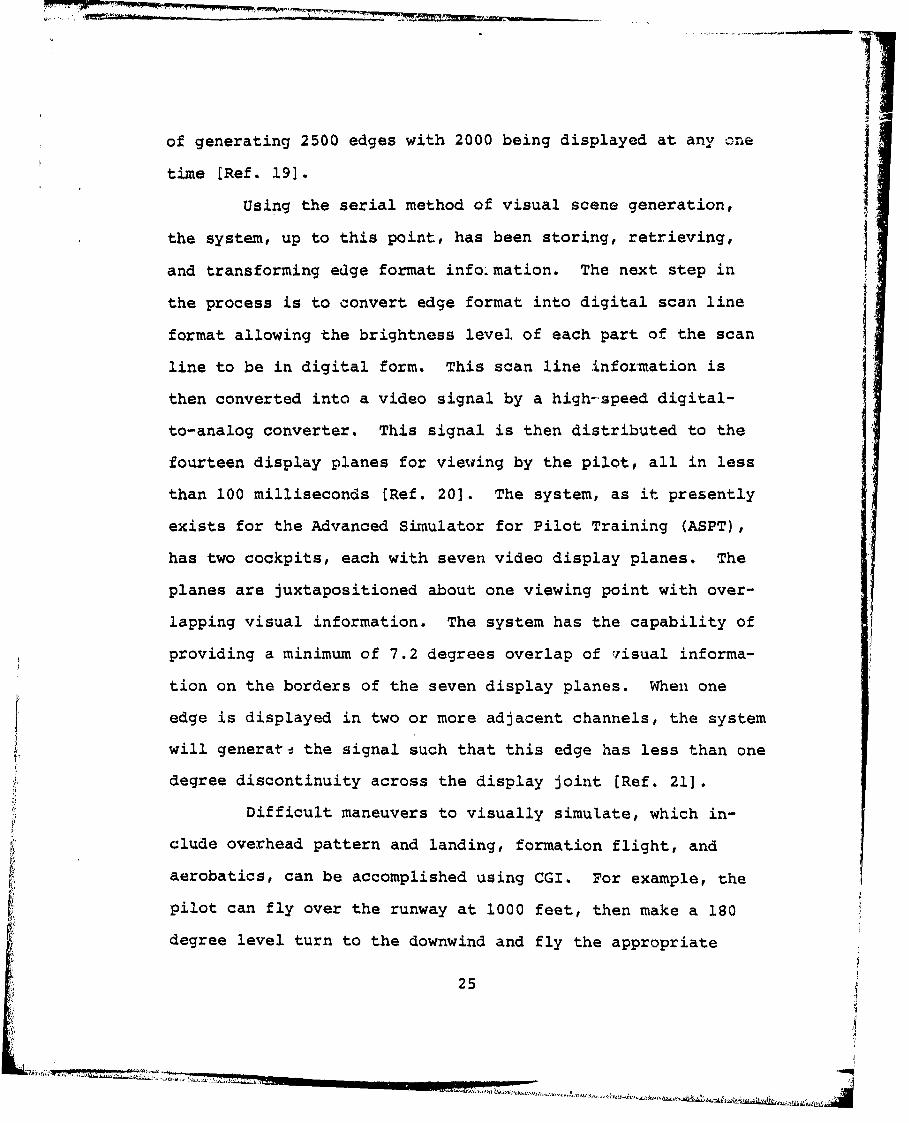
Detail of the terrain is provided by a pitch mirror
w~ihich is set at an angle of 45 degrees to the optical axis
when the OFT is in level flight. The angle of the mirror can
be changed + 12.25 degrees, simulating aircraft movement.
Outside of this range an in-cloud picture is presented to the
pilot. The effects of bank angle are simulated by usiag a
dove prism in the optical probe, and the nose section, includ-
ing the pitch mirror,, is rotated about the optical path to
simulate heading change. Focal distancep from the pilot's
view, is continuously updated, resulting in a signal being
applied to the focus drive system. The optical system, as
described, is depicted in Figure 11-2.
17

-S4
'iJC.)L I
F 4
0�*9�*�0*
'a..
'3
-5'I...�0
0'3 I
C.)
C.)'.3 I00
ii
18
A.'
- '-----.-.-<-,--'

!,-
I-2CD
V3.
I-.cn 4
19

The model board is illuminated by a bank of 850
eight foot (244 cm) fluorescent tubes located approximately
seven feet from the model surface [Ref. 11]. There is also
lighting on the camera tower to eliminate shadows cast by the
tower structure which moves on a track bstween the model board
and the lighting bank. Control of the light banks creates
the simulation of day,. dusk,. and night conditions. Small
prisms illuminated from behind the model a~re used to simulate
the airfield lighting system, as shown in Figure 11-3.
Approach, strobe, visual appLoach slope indicators, touch-downf ~zone lighting, runxway end identification lights, runway, and
taxiway lighting are included within this system. Realism
of the night scene is enhanced even Luore by lighting elements
incorporated into the terrain around the airfield simulating
lights from a city.
Figure 11-4 illustrates the positioning of the pro-Ijector, mirrors, and screen necessary for the display system.
The high brightness of the display allows the level of cockpit
illumination to be consistent with day. dusk, or night condi-
tions. The image is projected from a color television pro-
jector ..,ounted on top of the simulator fuselage through a
mirror system onto a back projection screen. The pilot views
the visual scene by means of a large collimating mirror posi-
tioned. ahead of the cockpit.
20

-Aft4
w w
F~ W
-~ NW
.~~ .... ... ....

i A.
s/ I/
U I
.9'.
Sq d , 'k .0
! °,"5 °
C1
i~B
I'
22i
- L~X '~.k~d

K
2. Computer Generated Imagery (CGI)
The Computer Generated Imagery system consists of a
numerically stored environment model, a computation system
for generation of display video from the numerically stored
environment, and display electronics for driving the cathode
ray tube (CRT) display system [Ref. 121. This system is
presently used by the Air Force Human Resources Laboratory
(AFHRL) on their Advanced Simulator for Pilot Training (ASPT).
Maneuverability by the pilot through the control
systemr of the simulated aircraft is unlimited. The scenery
changes are generated in response to the pilot's viewpoint
position and attitude in real time with aneration of a com-
plete new visual scene displayed each 1/30 of a second (Ref.13] .
The physical environment, which consists of a flat
surface representing the surface of the earth and three-
dimensional objects representing solid figures, is numerically
described in three-dimensional vector space.
When the system is in the on-line operational mode,
it accomplishes its real-time scene generation task in a serial
manner. Data that is necessary for scene computation is re-
quested from the computer subsystem each 1/30 of a second and
the correspondinn• scene is completely displayed within 1/10
of a second of receiving new scene data [Ref. 141 .
Three time phases are used for processing the display
data. The phases are referred to as Frames I, II, and III.
23

While i'rame III is producing the video signal that is being
observied by the pilot, Frame II is preparing information for
the picture to be used in the next television frame period,
and Frame I is working on the most recently requested data
which is driven by the pilot's viewpoint position and
attitude [Ref. 15].
Visual scene development using a CGI system has
certain primary capabilities including exact perspectiveness,
real-time display of moving objects, quick visual environment
change or modification, unlimited rate of maneuverability,
and a large area of flight coverage [Ref. 161. The imagery,
as viewed by the pilot, consists of surface patterns or
objects formed by planes of different brightness levels
bounded by straight lines or "edges." A system with a finite
edge generation capability results in a stylistic presentation
rather than according to nature. As a rule, the degree of
stylizatiour is inversely proportional to the edge generation
capability of the system since scenes in the real world are
not constrained to representation by straight lines or edges
[Ref. 17]. To improve image quality, two techniques, edge
smoothing and continuous shading of surfaces, are employed.
The edge smoothing feature provides a gradual transition
across an edge while the continuous shading of surfaces capa-
bility permits the generation of imagery representing curved
surfaces [Ref. 18]. The present system has the capability
24
S.......
......11.of generating 2500 edges with 2000 being displayed at any one
time [Ref. 191.
using the serial method of visual scene generation,
the system, up to this point, has been storing, retrieving,
the process is to convert edge format into digital scan line
format allowing the bri.ghtness level of each part of the scan
line to be in digital form. This scan line information is
then converted into a video signal by a high-speed digital-
to-analog converter. This signal is then distributed to the
fourteen display planes for viewing by the pilot, all in less
than 100 milliseconds [Ref. 201. The system, as it presently
exists for the Advanced Simulator for Pilot Training (ASPT),
has two cockpits, each with seven video display planes. The
planes are juxtapositioned about one viewing point with over-
lapping visual information. The system has the capability of
providing a minimum of 7.2 degrees overlap of risual informa-
tion on the borders of the seven display planes. When one
edge is displayed in two or more adjacent channels, the system
will generat-4 the signal such that this edge has less than one
degree discontinuity across the display joint [Ref. 21].
Difficult maneuvers to visually simulate, which in-
dlude overhead pattern and landing, formation flight, and
aerobatics, can be accomplished using CGI. For example, the
pilot can fly over the runway at 1000 feet, then make a 180
degree level turn to the downwind and fly the appropriate
25
, 41landing pattern to touchdown. Throughout this maneuver,
the pilot uses computer generated visual cues that are being
projected on the seven display planes to determine attitude
and position with respect to the touchdown point. Precise
aerobatic maneuvers can be accomplished because the pilot
is able to look directly overhead and out both sides of the
cockpit for aircraft control and performance assessment.
During formation flying, the pilot uses visual cues from the
lea& aircraft to maintain a satisfactory wing position.
Reliability of the CGI system has a design goal in
terms of mean-time-between-failures of 150 hours [Ref. 22].
The system is also designed to have a minimum accumulated
operating life of 30,000 hours and a maintainability require-
ment that maintenance man-hours, comprised of corrective and
preventive maintenance, calibrations, and servicing, will not
exceed 20 percent of the accumulated operating time [Ref. 23].
There are limitalions to CGI predominantly in the
area of image content and detail; however, with the advent
of present technology, the system provides a more complete
visual simulation in terms of perspective, field of view, and
unprogrammed flight conditions [Ref. 24]. In a paper presented
to the National Aerospace meeting, Mr. G. V. McCulloch, United
Airlines Flight Training Center, stated:
United Airlines believes that computer generated imagingis the visual simulation tecbnique offering the greatestpromise of making total airplane simulation possible.(Ref. 25].
26
' L-

3.. Computer Animated Photographic Terrain View (CAPTV)
A third method by which visual scenes can be produced
for flight simulatioit is Computer Animated Photographic Ter-
rain View (CAUTV). This system is under development and being
considered for the Navy's new jet aircraft training program
(VTX(TS)). The process originates by having an aircraft with
a camera mounted underneath the fuselage fly over a "gaming
area" such as an aircraft carrier, runway, or tar9;et at dif-
ferent altitudes, recording the scenes on motion picture film.
The camera uses seven lens systems simultaneously capturing
scenes of 360 degrees in azimuth and up to 10 degrees above
the horizon. The photographs are processed through a flying
spot scanner, color encoded, and recorded on a video disc.
The video disc units have the capability of recording 40t high
fidelity color photographs per disc surface.
When the visual scenes are to be used for flight
simulations, the discs are read optically by laser, that is,
an electronic digital picture processor (DPP) accesses photo-
graphs from the disc and interpolates for infinite eyepoints.
The DPP has a large digital memory which holds the last read
scene of interest and then ass'm-bles the scene as it is
accessed from the disc.
Since the camera mounted on the aircraft only covers
the earth and 10 r,.grees above the horizon, computer generated
imagery provides the sky simulation and can also be used for
insetting such special effects as moving targets.
W% 27

After the video special effects have been inserted,
the image can be displayed using either a dome projection or
cathode ray tubes. Because the visual scenes are actual
photographs cf the terrain and objects of intorest, CAPTV can
provide highly-detailed information, accurate depth perception,
and real-world scenery texture within a large field of view
[Ref. 26].
C. A DESCRIPTION OF MILITARY FLIGHT SIMULATORS
1. A-7E Night Carrier Landing Trainer, Device 2F-103
The Night Carrier Landing Trainer (NCLT) is utilized
to simulate an A-7E aircraft flying a night aircraft carrier
approach and landing. The system is composed of a simulated
A-7E cockpit, a visual display system, a 3 degree-of-freedom
motion system, instructor console, digital computer, and
related hydraulic and electrical supplies [Ref. 27]. The
visual scene is displayed on a single cathode ray tube which
is positioned in front of the cockpit, providing the pilot
with a 40 degree horizontal and 30 degree vertical colored
picture of the deck lighting and visual landing aids such as
the Fresnel Lens Optical Landing System (FLOLS), which is
properly positioned in relation to the deck edge, the Lunway
lights, and vertical drop lights, all of which are used to
form a basic "night" landing picture. The computer generates
a two dimensional perspective view of the carrier l.ights and
updares the spatial placement as a function of closing range
28
to touchdown and high/low or left/right approach positions
dictated by real-time pilot control inputs [Ref. 2R].
Through interface with the instructor console, the
Landing Signal Officer (LSO) can monitor the pilot's perfor-
mance. The LSO can also vary the degree of difficulty of each
approach by selecting different environmental characteristics
such as a rough sea state or high wind conditions across the
aircraft carrier deck. Fourteen aircraft emergencies can
also be programmed during any approach [Ref. 293.
In order to improve upon debriefing procedures, the
LSO can obtain records from an X-Y plotter which shows altitude
and lateral error deviations from the desired glideslope and
line up. In addition to this recording capability, the system
can replay the last minute of final approach and also "freeze"
the display so that the LSO can provide instructional advice
at the point in time where the pilot commits the error. In
addition, information such as angle-of-attack (AOA) control,
power control, pitch control, and tailhook-to-ramp clearance
can also be displayed to both the pilot and instructor. If
desired, a hard copy of these results can be obtained from the
printer.
The NCLT provides the pilot with complete freedom to
fly the aircraft and realistic aircraft sounds throughout the
flight. Carrier arrestment is simulated by stopping the CRT
display. The device also has the capability of simulating
landing and missing the arresting wires wit% the aircraft
29
~ ~.i

tailhook, touch-and-goes, ramp strikes, and allows the pilot
to re-enter the final approach pattern after each missed
landing [Ref. 302.
2. A-7E Weapons System Trainer, Device 2F-lll
This system includes an A-7E cockpit mounted on a six
degree-of-freedom motion p.atform, digital computers. a digital
radar landmass system, interface equipment, and instructor's
console. The trainer features flight validated system. to
include departure from flight, aircraft spin and recovery
characteristics, utilization of CRT displays for instructor
information, integration of the navigational computer with
other systems, and performance measurement capability (Ref.
31].
Simulation of the aircraft is very precise with the
system including all modes of engine and fuel system opera-
tion, hydraulic and electrical systems, flying qualities, and
performance characteristics.
For tactical instruction, the system includes simula-
tion of weapon delivery, loading, arming, safeing, and ordnance
release. The instructor has the capability of simulating any
weapons loading configuration. In addition, the trainer can
simulate signals that are emitted when enemy weapons systems
have a radar-lock-on such as a surface-to-air missile (SAM)
allowing the pilot to practice using electronic countermeasure
systems and also to perform appropriate evasive maneuvers.
30lB
The system also has a "freeze" capability allowing
the instructor to completely stop all systems for debriefing
and analysis and then move to another geographical location
to continue the training situation. There is a data base map
within the system which depicts a 1250 x 1250 nautical mile
area of either the western or eastern United States [Ref. 32].
The instructor has the ability to enter 3ighty mal-
functions into the system, increasing the level of difficulty
for the pilot-under-training. Four CRT displays allow the
instructor to monitor the status of the training mission and
the proficiency of the pilot in accomplishing the mission.
Included within the displays are a repeat of cockpit switch
positions, instrument panel indications, the capability to
monitor sequential actions by the pilot for a given procedure,
and information relating to the position and orientation of
the aircraft [Ref. 33].3. Advanced Simulator for Pilot Training (ASPT)
The Advanced Simulator for Pilot Training (ASPT) is
used primarily in the research area with formally stated ob-
jectives of the program being: (1) to enhance pilot training
within the Air Force through the application of recent tech-
nological advances in simulation; (2) to demonstrate the max-
imum effective utilization of simulators in Air Force pilot
training; and (3) to define the future generation of ground
training equipment and simulators [Ref. 34].
3i

_777'
The system is comprised of three major components:
the basic simulators, the visual displays, and the computer
image cenerator (Ref. 353. The visual display and computer
image generating systems for the ASPT have been described in
a prAceding section, therefore the basic simulator will be
described at this point.
The ASPT is presently configured with the F-16 and
the A-10 cockpits enclosed within the sever-channel visual
display systems. The realistic appearances of the cockpits
are provided by the utilization of actual aircraft parts, and
the cockpits include faithful reproductions of in-cockpit
sights, sounds, and aerodynamic control feel to the maximum
extent djlowable within the state-of-the-art in simulation.
The rotion system provides the on-set acceleration
cues along and about the three aircraft axes. The motion
platform is supported by six active hydraulic actuators with
six passive safety actuators providing complete mechanical
redundancy in case of system failure. The sixty-inch stroke
system is essentially a hydraulic position servo that is
driven by commanded actuator lengths computed by the motion
system mathematical model (Ref. 36].
The ASPT also has provisions for introducing several
levels of difficulty and complexity within any given task.
These variables are &ccomplished by restricting any combin-
ation of the six degrees-of-freedom motion system, varying
aircraft response to control movements, inserting system
32
i .-....... .

malfunctions, or introducing environmental factors such as
temperature changes, turbulence, and wind velocity.
The ASPT has the capability to "freeze" the simulated
visual scene, reinitialize to a point in space, automatic
demonstration, provide the student with knowledge of the
"results, and playback of a particular maneuver.
Unlike other flight simulation systems described in
this section, the ASPT, through Computer Generated Imagery,
can change the training environment almost instantaneottsly.
This author had the opportunity to "fly" the A-10 ASPT during
a recent visit to the Human Resources Laboratory, Williams AFBp,
Arizona. During the sixty minute training period, the author
flew in four different environments to include aircraft carrier
approaches and landings, form/Ation flying with a simulated
A-10 aircraft, air-to-air refueling using a simulated KC-135
tanker, and air-to-ground ordnance delivery in a hostile eavi-
runment. While in the last three environments, the computer
demonstrated a "perfect" maneuver involving all instrument
readings and visual scenes of the total simulator system.
When first shown the CGI environment, the author was concerned
with the lack of realism. However, after becoming involved in
performing the required tasks such as flying the approach to
the aircraft carrier, the realistic aspect of the visual scene
became secondary in importance while the correct performance
of the maneuver was of primary interest.
33

D. SUM4MARY
Part A of this section outlined the historical develop-
ment of flight simulation from the earliest devicea around
1910 using actual aircraft to the modern flight simulator
which uses sophisticated computing techniques to animate full
scale representations of the operational environment experi-
enced by the pilot during flight. Part B described different
methods being utilized today to provide visual flight simula-
tion. The methods included model boards, computer generated
imagery (CGI), and computer animated photographic terrain view
(CAPTV). Part C presented a description of three military
flight simulators inuluding the A-7E Night Carrier Landing
Trainer, the A-7E Weapons System Trainer, and the Advanced
Simulator for Pilot Training being used by the Air Force for
visual flight simulation research.
34
i ~34
i -4

II.FLIGHT SIMULATOR UTILIZATION IN THECOMMERCIAL AVIATION INDUSTRY
A. GENERAL
The use of flight simulators to provide initial and
recurrent training for flight crews of commercial airline
companies has increased rapidly since World War II. The
airline companies saw flight simulator utilization as an
opportuanity to reduce the costs associated with training their
Captains, First Offi7..r., -and F,..ght Engineers. Improvements
in flight simulation hardware, supported by more complete
performance data from aircraft flight tests, and fostered by
a more permissive Federal Aviation Administration (FAA) regu-
latory environment, have moved the air transport industry
closer to an ultimate goal of total flight training through
simulation [Ref. 373.
The impetus to use flight simulators has been provided
by three primary considerations, namely, safety, simulator
quality, and energy conservation. Within the safety regime,
pilots are able to practice unique maneuvers such as power
loss after takeoff commital speed, and limited power on final
approach to landing. Simulator training is especially imper-
ative for Flight Engineers, because it permits shut-down of
electrical or hydraulic systems without exposing the aircraft
to undue hazards. An additional effective utilization of
35
..........................,,

siultosto ipoesafety conditions -wud be using the
devices to reconstruct events as they occurred during flight.
To illustrate, on May 25, 1979, an American Airlines DC-l0
crashed after losing the left engine on takeoff from Chicago's
O'Hare Airport. Technicians took data from the flight recorder
of the crashed aircr~aft and translated the information into
a computer to be used with a DC-10 simulator to try to deter-
mine why the pilot could not control the left- roll, and if any
combination of aerodynamic control inputs or throttle positions
of the remaining operable engines could have prevented the
accident [Ref. 38].
New simulation equipment that is being procured by the
major airline carriers is inherently capable of fulfilling FAA
advanced simulation requirements. State-of-the-art simulators
use computer generated imagery and six degrees-of-ft-eedom Imotion systems. There are normally four visual screens posi-
tioned in front of and on the left side of the Captain and in
front of and on the right side of the First Officer. These
side screens allow the pilots to practice circling approaches
instead of being restricted to straight-in approaches to land-
ing. FAA requirements will be explained in detail in a subse-
quent part of this chapter.
During the early stages of flight simulator development
aircraft costs incurred to practice procedures arnd build
practical experience were less expensive than inves~Itents in
peripheral training equipment. As a result of escalating fuel
36

costs and increased technology,ithis trend has reversed itself.
The Boeing Corporation determined that visual simulators have
triimmed 12 of the 18 flight hours formerly scheduled for each
pil.ot transitioning to one of their jet aircraft. As an
example,, the cost associated with transition training in a ABoeing 727 is $1400 per flight hour in the aircraft versus
$280 per flight hour in the simulator [ Ref. 39). Without the
simulator the training cost would be $1400 per hour x 18 hours 1$25,200. With the simulator/aircraft combination the train-
ing cost would be $1400 per hour x 6 hours plus $280 per hour
x 12 hours - $11,760. This results in a savings of $13,440
for each pilot trained. Data obtained from a major airline
company showed that their short-haul., aircraft (500 nautical
miles between landings) cost $1400 per flight hour while the
simulator cost was $250 per hour, and their long-haul aircraft
(in excess of 1100 nautical miles between landings) cost $5600
per flight hour while the simulator was $300 per hour. For
qualification as Captain in the short-haul aircraft, a pilot
would require approximately 12 hours in the aircraft only
($16,800) or 16 hours in the simulator plus three hours in
the aircraft ($8,200). In the long-haul aircraft, qualifi-
cations would require approximately 12 hours in the aircraft
only ($67,200), or 15 hours in the simulator plus two hours
in the aircraft ($15,700). Based on 822 crew qualifications
per year in the short-haul aircraft and 411 qualifications
per year in the long-haul aircraft, this major airline
37

company recognized potential annual cost-savings associated
with training of $7,069,200 and $21,166,500 respectively in
1980 [Ref. 40].
Flight simulation technology has progressed from a simple
fixed base of a single place cockpit to a device capable of
immersing a pilot and his crew in a very -realistic and typical
flight situation. Detailed environmental situations such as
F. communication with the ground crew during "pushback,' reaction
of the aircraft to wind shear, any level of aircraft system
malfunction, ground effect, and braking deceleration on land-
ing rollout can be realistically simulated with state-of-the-
art technology [Ref. 41]. American Airlines has conducted at
least eighty requalifications of pilots who had been away from
line duty for periods of ninety days to two years with complete
retraining in a simulator under an FAA exemption and with no
non-revenue flight time. American also conducted upgradeI
studies taking First Officers who were current within the past
two years as pilots of airplanes of the same type and upgrad-
ing to Captain with no aircraft non-revenue time [Ref. 42].
Commercial airlines use of flight simulators is a multi.-
million dollar business; therefore, a tremendous effort is
put forth in organizing and operating the training centers
which utilize the simulators. The next part of Section III
will describe such a training center.
38

B. THE FLIGHT TRAINING CENTER CONCEPT
Extensive research by this author has shown that major
airlines have tended to centralize their training facilities
in order to take advantage of economies of scale and to im-
prove standardized operating procedures. In 1966, as a result
of a study completed by a private consulting firm, American
Airlines centralized their training program in the Dallas-Fort
Worth area. This change had been precipitated by the fact that
two fatal training accidents had recently occurred with a pri-
mary cause being a difficulty in maintaining standardization,
since at that time American had training facilities in New
York, Chicago, Los Angeles, and Dallas-Fort Worth. The major
complex was completed in 1970 and trains approximately 4000
flight crewmen annually through any of 75 different types of
4 flight and ground school courses covering initial, refresher,
upgrade, and transition training [Ref. 43].
Figure 111-1 depicts an organization chart for a major
airline flight training center. it is readily apparent that
the training center is a very large organization requiring a
tremendous amount of coordination between major departments
to ensure that operations are both effective and efficient.
The Standards and Procedures Department performs all the
necessary flight checks, both within the simulator and the
aircraft, in order to ensure that the flight crews perform
the procedures correctly. Flight Simulator Services attest
to the fidelity of the flight simulators, perform necessary
39

r'po
LjJ
V) .)LLJ C
6.4~ cmW jx L
LU U
7-J -f w
1/i ).- .
40 C.D2
W-4 w-
u"J
U- ;;:4 -
V). 2-1
CLC
U-
.ro
VI (.)OI
-~~~t --II~
V-- -'I

system changes, and ensuxre all systems are operating within
FAA specifications. The Director of Flight Operations coor-
dinates the input and training of all the crews ensuring that
an individual's program is progressing according to the appro-
priate syllabus. The Manager of Flight Training Programs
maintains the present training syllabus and develops new tech-
niques for improving classroom and other media instruction&.
Finally, the Manager of Avionics is responsible for the main-
tenance effort associated with maintaining the simulators and
other training devices.
Two major contributions to the success of the flight
training center concept have been the instructor staff and
up-to-date training systems and techniques for using these
systems. The instructors are~ professionals with extensive
backgrounds in classroom teaching in addition to considerable
flight experience, averaging 15,000 to 20,000 flight hours.
* Training techniques, such as the concept of individualized
training, has received much emphasis. This type of training
permits each student to proceed at his own best learning rate.
Subjects, such as aircraft systems, are divided into study
units. Each study unit is intended to teach and test, with
testing being accomplished through the timely display of mul-
tiple choice questions. If the student answers the questions
correctly, the study unit automatically continues. Post-
training performance has shown an exceptionally high level of
retention. The training technique also allows the student to
41

progress from the aircraft system study units through a
systems trainer, the Cockpit Procedures Trainer (CPT), and
finally to the Full-Mission Simulator. This procedure usedby the commercial aircraft induutry ensures that operations
of all the training devices are cost-effective.
Normally, aircrows return to the flight training centerI
every six months. One of the sessions includes an extensive
briefing of commercial aircraft accidents or incidents, an
operational review, and the yearly proficiency check required
by FAA. The second session inc~ludes aircraft evacuation
training, aircraft systems review, and line-oriented flight
training (LOFT). LOFT creates line conditions during a sim-
ulator flight and allows the crew to face typical training
problems. Any malfunctions, diversions, or other circum-
stances, such as a passenr7,er experiencing a heart attack, may
be introduced during the course of the four hour flight. The
crew undergoing training must deal with the problems themselves
which demonstrates the ability of the Captain to effectively
use the human resources available. The LOFT instructor may
not add any information or advice and may not interrupt the
exercise to critique any actions until the si~mulation has been
completed [Ref. 44].
C. FAA RULINGS CONCERNING VISUAL FLIGHT SIMULATION
The FAA has proposed new rules dealing with progress
toward 100 percent simulator programs. The program is divided
42

T --
into basically three phases. Phase 1 requires that the simu-
lators be upgraded to the best that presently exists, with
the capability of successful training *'.n takeoff and landing
maneuvers and ground handling of the aircraft. A Phase 2
simulator would allow the airlines the ability to upgrade to
Captain a pilot currently qualified as a First officer on the
same type of aircraft. It would also allow lateral. transition
of a Captain or First Officer tc a different aircraft. Follow-
ing completion of transition training, Captains fly 25 hours
and First Officers fly 15 hours under the supervision of a
check pilot on regular revenue generating flights. P~hase 3
is defined as total simulation traiaiing with corresponding
requirements for improved aircraft data and better visual
systems available to all crew members, including side window
visuals. In 1979, Pan American was granted an exemption to
perform a study to determine the feasibility of total simu-
lator training. A group of 118 pilots was divided into a
control group and experimental group with the experimental
group completing the transition training without any aircraft
time. At the end of the training, both groups were examined
thoroughly by the FAA and Pan American check pilots with no
discernible difference found in their performance. Excellent
training results such as reported by Pan American point to
implementation of P'hase 3 training as a realistic objective
by 1982-83 (Ref. 45].
43

In a recent interview with Mr. William Traub, Director
of Flight Operations, United Airlines, the cost savings asso-
ciated with upgrading the simulators to Phase 2 was outlined
as follows:
B-727 AIRPLANE TRAINING AND CHECKING1979 (Year of normal expansion and training)
1. Total Aircraft Time - 694 hours
2. Total Cost to Fly Above Hours - $1,058,3503. Fuel Burned - 5,968,400 lbs.
1980 (Year of limited training)1. Total Aircraft Time - 434 hours
2. Total Cost to Fly Above Hours - $661,850
3. Fuel Burned - 3,732,400 lbs.
This requirement to use the actual aircraft would have been
alleviated with Phase 2 simulators. Appendix A of this thesis
describes the simulator and visual system requirements for the
three phases, as presented in Appendix H to Part 121 of the
Federal Aviation Regulations.
"D. A DESCRIPTION OF FLIGHT SIMULATION SYSTEMS
-r The approach toward Phase 3 simulation has been made pos-
sible by advances in several different fields including com-
puter programuning, hydrostatic motion systems, daylight
computer generated image visual displays, available aircraft
data, instructor integration, and maintenance [Ref. 46].
Accurate aircraft data have allowed the simulator to
duplicate the aircraft more accurately, particularly in
44
i i __

:IIground effect and g'.ound handling. Aerodynamic characteýr-
istics of an aircraft change when within approximately 300
feet of tite ground and has been di:"fficult to simulale until
the present state-of-the-art. Better visual and motion
systems are now simulating grour.. iaandling more accurately,
and several airlines have opted for our o= even six window
displays to provide pilots ý,vth an ai(--aroun0 cockpit view.
Ground handling may also inolude the effect of ice and snow
[Ref. 47].
Improvements such as hydrostatic technology have been
used to reduce friction in motion and control feel systems.
Prior to this new technology, the pilot would notice a dis-
concerting "bump" especially during the return to the neutral
position by the Jack after the system had inputted a particu-
larly large acceleration. Hydrostativ jacks reduce friction
to about one-tenth of its previous value by eliminating direct
contact between piston and cylinder wall. High pressure
hydraulic fluid is leaked between the piston and wall and the
prossure centralizes the piston because it acts equally in
all directions [Ref. 48].
Control feel errors ha /e been reduced to about one-half
their previous value as a result of the simulator companies
adopting electronic feedback controls. These components allow
technicians to individually alter a particular parameter with-
out introducing undesirable effects in other areas. This has
45. ara.TiIa

rnrae infcnl h im h iuao a enmdavailable to the user airline [Ref. 4ade
Major airlines are emphasizing instructor integration
into the cockpit while the student is undergoing training.
This allows the instructor to devote more time to observing
and instructing. Pre-programimed aircraft system faults, hand-
held controllers, and full color CRT displays are training
aids made available in the cockpit. An instructor could, for
example, select a pre-programrmed engine failure to occaLu at a
particular altitude after takeoff. He could observe the
method by which the crew complied with the emergency proced-
ures, and without taking his eyes off them, input other faults
through the hand-held controller.. Both the crew and instructor
could debrief the procedure by using the CRT and a printed copy
of the plot of the aircraft position could be made, if desired
[Ref. 50].
Most airline simulators are presently using visual systemsI
with night/dusk CGI capability, using 6,000 to 10,000 light
points to create the image; however, better computers are being
developed which will allow daylight full color imagery to be
developed. The FAA's total simulation plan (Phase 3) requires
daylight CGI which typic~ally costs twice as much as the night/
dusk system.
Other improvements to simulator visual displaym~ include
using multi-window displays increasing the crew's field-of-
view, and also decreasing the gap between the windows from
five degrees to about one degree (Rf 51].
46

Airline companies' utilization o(t sophisticated flight
simulators must; be carefully scrutinized since the lead time
is about two years and a typical cost is about $5 million to
$6 million. Typical cost of a two-window, night/dusk CGI is
more than $500,000 while a four-window system would exceed
$1 million (1980 dollars) [Ref. 52]. With costs of this
magnitude, it is absolutely imperative that the simulators
be an effective asset to flight crew training. The next part
of this Section examines the training effectiveness of flight
simulators realized by the major airline companies.
E. TR~AINING EFFECTIVENESS
'The state-of-the-art technology in flight simulation sys-
tems combined with the professional training concept outlined
in Part B of this Section provides the basic foundation for
training an airline pilot; however, the real test is to eval-
uate whether the skills learned will transfer to the aircraft.
Many studies have been conducted by major airline companies
to determine whether or not flight simulators can provide the
necessary training to economically justify the costs of a,
visual simulator system, and more importantly, to determine
whether critical maneuvers that would ne unsafe in the aircraft
could be satisfactorily learned in the simulator. This part
of Section III will review three such studies.
The first study to be reviewed concerns the requirement
for aircrews to conduct three takeoffs and landings in the
47

actual aircraft as a fundamental requirement to maintain or
reinstate the pilot's currency in that particular type air-
craft. American Airlines questioned the effectiveness of this
requirement since experience had shown that requalification
flights were normally made on days with excellent weather
conditions and at unrealistic airplane weights. if the re-
qualification flight6 .tyre performed in visual simulators,
the pilot could demonstrate proficiency in both day aind night
conditions and at aircraft weights normal to line operations,
To increase the completeness of training, varying conditions
such as reduced visibility and crosswinds could be introduced
by using the simulator.
American Airlines used the two-group concept in conducting
the study. The control group complied with Federal Aviation
Administration regulations in conducting their takeoff and
landing requirements while the kstudy group used an approved
digital flight simulator with a color visual system. After
the appropriate training both groups had their first twoV
landings evaluated by an approved check pilot. There were
80 pilots in. each group with the pilots coining from all types
of aircraft including the Boeing 727, 707, 747, and McDonnell-
Douglas DC-l0. The training provided each pilot was dependent
on the time period since the last currency rating.
During the training period the FAA observed 13 line take-
of fs and landings for the control group and 81 line takeoffs
and landings for the study group. The average grades for the
48

line takeoff and landings for the control group were 3.33
and 3.40 while the study group had average grades of 3.49
and 3.60 respectively. These scorea were based on a five
point rating scale. Xt should also be noted that weather
conditions for both groups during the evaluations included
day, night, dusk, dawn, and a variety of visibility and
crosswind conditions (Ref. 53].
Questionnaires concerning the simulator training were
completed by 41 of the 80 subjects within the study group.
Forty-four percent of the pilots favored the simulator pro-
gram without any reservations and an additional 37 percent
accepted the simulator program as adequate in view of the
economic situation or with some added qualifications, one of
which was that a minimum level of pilot experience be required
before using the simulator in lieu of the airplane. The most
common recommendation was a minimum of 100 hours pilot experi-
ence in that type aircraft [Ref. 543.
Based on analysis obtained from this study, American Air-
lines recommended to the FAA that pilots who had not completed
three takeoffs and landings within 90 days be allowed to re-
qualify using a visual simulator training program. This
recommendation was accepted and has been incorporated within
the regulations as long as the simulator system has been
approved by the FAA. Requalification in the aircraft is a
very costly program, therefore, this ruling has proven to be
an economical improvement for the commercial airline industry.
49

Practicing maneuvers in the simulator that would be un-
safe in the aircraft is a second positive area supporting
training effectiveness. During the 24 month period between
July 1965 and July 1967, 38 percent of jet accidents resulting
in fatalities or airframe destruction occurred during training.
Of these accidents, 37.5 percent occurred when the pi:lot was
practicing a simulated engine failure on takeoff [Ref. 55).
Between September 1, 1971 and January 12, 1972, American
Airlines conducted training in the simulated engine failure
maneuver through extensive use of visual flight simulation.
The following groups of pilots were studied:
DC-10 Captains - 37DC-l0 Co-pilots - 24B-747 Captains - 8B-747 Co-pilots - 5B-707 Captains - 38B-707 Co-pilots - 7B-/27 Captains - 38B-727 Co-pilots - 18
After simulator training, the pilots were checked in the
aircraft by qualified examiners with the following results:
AVG. NO. OFfPRACTICE PERIODS
PASS FAIL % PASS IN THE SIMULATOR
DC-10 Captains 36 1 98 5.2DC-10 Co-pilots 24 0 100 5.5B-747 Captains 8 0 100 6.4B-747 Co-pilots 5 0 100 5.2B-707 Captains 36 2 95 6.3B-707 Co-pilots 7 0 100 5.8B-727 Captains 38 0 100 5.0B-727 Co-pilots 18 0 100 4.4
In addition to the Pass/Fail score given, all examiners
graded pilots in four areas including: lateral control,
50

heading control, climb speed, and procedures. There was a
general consistent relationship between grades given in the
simulator and on the first performance in the aircraft. Data
actually showed that pilot performance in the aircraft was
slightly higher than in the simulator.
As a result of the success of this study, it was recom-
mended that all training and checking for maneuvers involving
power plant and critical systems failures be conducted in
simulators equipped with visual systems [Ref. 56].
Beginning in June 1967, four major airline carriers
participated in a study determining the appropriate methods
for training pilots in landing three and four engine aircraft
with 50 percent power available. Realizing that all carriers
did not have the same types of training equipment, three pro-
grams were used to gather data for the report. There were
three prerequisites required for each program including: (1)
a high level of proficiency in normal approach and landing
before using 50 percent power; (2) performance characteristics
of 50 percent power aircraft must be completely understood by
the pilot in training; and (3) a high proficiency standard of
operating and landing an aircraft with 50 percent power loss
must be attained [Ref. 57].
The programs included: (1) a simulator (without visual)
and aircraft combination with subcomponents of the maneuver
such as configuration changes being mastered in the simulator
and with actual maneuvers in the aircraft being accomplished
at altitude; (2) complete training in a visual simulator with4
satisfactory performance on normal and one engine inoperative
landing being required before a 50 percent power loss landing
was attempted; and (3) complete training in the aircraft with
individual components being taught and integrated at altitudeJ
prior to actually performing the landing.
Avery important result of this study showed that a highF
degree of success was achieved with each of the programs, em-
phasizing the fact that flight simulators had proven to be an
ideal device for combining knowledge and skill requirements
necessary to execute the 50 percent power loss on landing
iraneuver. With the effectiveness results of the three programs
being the same, the airline companies using the "simulator only"
training method showed a significant cost savings as a result
of fewer actual aircraft hours being utilized.
A ~F. COST-SAVINGS OF FLIGHT SIMULA~TORS
This part of Section III will quantitatively show the
cost savings realized as a result of data obtained from both
American and Delta Airlines. In the case of American Airlines
data, the autho~r concentrated on the costs associated with
transitioning a Captain from one aircraft type to another type.
Table 111-1l provides data for three aircraft flown by
American Airlines. In order to conduct a direct operating cost
comparison, this author made the assumption that, if a simu-
lator was not available, each simulator training hour would
52

00
.4-)
r, r0 r 43)
4.44-) 0 H r=Ll
0 rq-4
En4 r o~~ a,
0 *c4 f
Ec '0 n 0
0-0
H 4r4 C0 Wr0
E4E-
00
*d re~ eH c04' r"4 rcc
~i5- 4)4-) 4-
En~ E- 7 r.O (d
rH 10 H)ý -
000
u 00 (N d
4- 00)ii04
cc4-PZ H P4ur--
H(~ 0Z
0*~ r0r
H 4 4
00
EA 0 -4C) r 043
w 0 rr-O $
~ 1)0
COO 44 r-
r-r. -I c
z c) - I53

have been performed in the aircraft. Table 111-2 shows this
direct cperating cost comparison.
For American Aii lines, the direct operating costs associ-
ated with using the simulator and aircraft in the training
program was only 9.9 percent of the costs that would have
been incurred if only the aircraft were used. It must also
be remembered that this was only for Captains transitioning
to another type of aircraft.
The Assistant Manager of Flight Training, Delta Airlines,
provided this author with training and cost data for all line
aircraft flown by the company. Table 111-3 outlines the direct
cost per hour of aircraft training versus simulator training
for Delta's current fleet of aircraft. The cost of fuel, oil,
and taxes is based on a fuel price of $1.05 per gallon, plus
$.0245 per gallon for oil and taxes. Maintenance burden costs
are computed at 60 percent of the fully allocated rate.
Table 111-4 provides cost savings associated with using
the simulator systems for the different aircraft. The hours
showa for each simulator system are the total hours used to
train all crewumepbers in that particular aircraft. Delta
confiraied the assumption made by this author that if the sim-
ulator were not available, those training hours would be flown
in the aircraft. Consequently, the cost per hour to compute
the savings that result is the net aircraft cost calculated
in Table 111-3.
54
-i~C >. .

TABLE 111-3
COST COMPARISON OF AIRCRAFT TRAININGVERSUS SIMULATOR TRAINING"(Source: Delta Airlines)
Cost Per Hour for Aircraft DC-9 DC-8 B-727 L-1011
Fuel, Oil, and Taxes $ 987 $2050 $1603 $2547Direct Maintenance 130 205 110 385Maintenance Burden 81 143 64 193Total Aircraft Cost $1198 $2398 $1777 $3125
Simulator Cost Per Hour
Maintenance $ 85 $ 85 $ 85 $ 85
Net Aircraft Cost $1113 $2313 $1692 $3040
TABLE 111-4
COST SAVINGS(Source: Delta Airlines)
AnnualAircraft Simulator Hours Net Aircraft Cost Savings
DC-9 3,012 $1113 $ 3,352,3S6DC-8 1,315 2313 3,041,595B-727 12,571 1692 21,270,132L-1011 3,300 3040 10.032,000
Total Savings - $37,696,083
55":? 7"
- , .zz

The cost (1980) of procuring the simulator systems that
are being utilized by Delta Airlines is approximately
$41,500,000. Since the savings were $37,696,083, this would
allow the initial cost to be recouped in approximately 1.10
years.
G. SUMMARY
This Section has described the use of visual flight simu-
lators by major commercial airline companies. The cowpanies
have consolidated their initial, transition, and recurrent
training, taking advantage of standardization and economies
of scale. The FAA has worked in close harmony with the air-
lines so that the simulator systems, with their potential for
training, could be used in the most effective and efficient
maniter. Training effectiveness was successfully measured
using simulator systems in such areas as takeoff and landing
requalification and practicing the hazardous maneuvers of
losing an engine once the aircraft reached takeoff commital
speed and 50 percent power loss during final approach. The
final part of Section III quantitatively describes cost
savings that have been realized by two major air carriers.
There are basically two areas which highlight major dif-
ferences between commercial airlines and military utilization
of visual flight simulators. First, commercial airlines do
not get involved in the initial training of a pilot. For the
most part, airline companies hire pilots with many hours of
56

military or private flying. Secondly, the missions are
* ~entirely different. Simulating air-to-ground del.ivery of
ordnance or air-to-air combat is an entirely different
environment than teaching someone to fly an approach and
landing to a major aerodrome such as San Francisco or Denver.
Can visual flight simulation be effective when used in mil-
itary training? Section IV outlines training effectiveness
of visual flight simulators within the military.
57
IV. TRAINING EFFECTIVENESS OF MILITARY FLIGHT SIMULATORS
A. GENERAL
History indicates that the single most decisive factor
in winning and losing wars is the adequacy of training and
the motivation of the personnel who make up the combat forces.
During peacetime, the realism of training is difficult to
maintain without jeopardizing the safety of these personnel
and their valuable equipment. Because of this problem, the
Department of Defense has invested millions of dollars to
procure simulators which assume to provide realistic and
effective training at reduced costs. As a result, many stud-
ies have been conducted to gather and analyze data in order
to determine quantitatively and qualitatively that simulators
are devices that enhance training effectiveness.
Simulator effectiveness is typically assessed through the
4 use of a transfer of traiining paradigm [Ref. 58). Experimental
and control groups are normally evaluated both objectively and
subjectively in order to ascertain whether a transfer of
training occurred between the 6imulator device and the systen..
The results of this transfer may either be positive or nega-
tive. Positive transfer implies that less time is needed in
the aircraft in order to attain a predetermined performance
criterion as a result of training in the simulator, while
58

negative transfer indicates that more aircraft time is required
than would have been necessary if the simulator were not used
in the training process. The methodology of data gathering
would require that experimental groups be exposed to a pre-
designed simulator syllabus and then performan,'ýe would be
measured in the aircraft, while the control group would re-
ceive their training only in the aircraft before completing
the performance meas~urement.
It is the purpose of this Section to: (1) describe some
methods that have been developed to measure the effectiveness
of the flight simulator; (2) discuss critical factors influ-
encing simulator training effectiveness; and (3) present an
analysis of training effectiveness data from actual military
applications.
B. METHODS OF MEASURING TRAINING EFFECTIVENESS
Computational formulas for measuring training effective-
ness have been developed using the relationship between
simulator substitution hours and in-flight hours. Table IV-).
describes how the methods are computed.
Interpretation of the calculations indicates that the
larger the positive value of syllabus reduction, the more
effective the simulator system, and the smaller the Flight
Substitution Ratio. (FSR), the more effective the substitution.
FSR defines the rate at which flight time is being replaced
by the simulator and thus reflects efficiency off the device.
59

0 n
0 t 10
-4 4J
to
-O H 0 H4 ý
o 03)4J nH- z 4 r
W~N (dI j
0 Nz I I
tz 0 :
'1- 0 02 t
EA rj 4) Hjt Hr4
Iii .Hj r-1
.4~
00)
02-
H- N
60
41 4

Transfer Effectiveness Ratio (TER) describes the ratio of
flight hours saved to the time spent in the simulator (Ref.
59]. All the flight and simulator hours data used in the
three equations are the times required for the subject pilots
to accomplish a predetermined effectiveness criterion.
Studies Qonducted between 1967 and 1977 support the
fact that simulators show positive transfer effects to the
aircraft; however, there were wide variations in the effec-
tiveness of different simulators and of the same simulator
when used for different types of training [Ref. 603. The TER
is a measure used to identify the type of task for which the
simulator would be more cost effective than the aircraft.
Using the learning curve theory, the amount of improvement
per hour of training is expected to decrease as training pro-
gresses. This implies that the effectiveness of a simulator
is the greatest at the beginning of training and diminishes
during the training period. Despite this diminishing effec-
tiveness, it is cost effective to use the simulator up to the
point where the TER equals or becomes less than the ratio of
simulator to aircraft operating cost [Ref. 61].
Although the effectiveness of flight simulators has been
quantitatively measured using the formulas previously exylained,
factors that influence the effectiveness have received little
attention. Part C of this Section will address these factors.
61
C. FACTORS INFLUENCING SIMULATOR TRAINING EFFECTIVENESS
Even though state-of-the-art technology has allowed
simulator systems to be developed with remarkable realism,
there remains much to be learned about training with these
devices. There is no quantifiable data to support some of
the factors believed to influence simulator training effec-
tiveness; however, where inferences can be made and supported
by a consensus, these factors must be carefully considered
by those responsible for simulator design. The following
paragraphs discuss selected factors which influence training
effectiveness.
1. Design of Simulator Systems
Important in the design of simulator systems is the
fidelity of the system itself and training aids incorporated
such as instructor station displays, playback, performance
recording, freeze, and performance measurement. The level of
fidelity is often equated to physical correspondence between
the simulator and the real world. Two critical areas con-
tributing to the level of fidelity are visual systems and
motion bases.
When simulating aircraft environments, some areas of
training, such as air-to-ground weapons delivery and air-to-
air combat, require visual systems for effective training.
"On the other hand, instrument flying would not require such
a system. This theory, along with other factors that will
be discussed in this Section, have motivated the military to
62)

r ~ - -. ~-plop
evaluate procuring simulator systems which include part-task
trainers designed to train within particular areas of mili-
tary flying or at different levels of pilot performance. As
an example, when a student begins flight training, a full
fidelity simulator system could actually serve to confuse
him or her by having attributes such as visual and motion
systems which would divert the student's attention from the
actual transfer responses desired. Conversely, advanced 'training requires the high fidelity systems which most closely
simulate the actual aircraft through sight, sound, and motion.IUsing a low fidelity system at this point in the training
cycle would seriously reduce the effectiveness because of the
inability to provide distractions that would be experienced
during aircraft operation (Ref. 62]. In addition, motion
bases provide a significant contribution to the costs associ-
ated with procuring a simulator system; therefore, extensive
study and evaluation should be completed to ensure that motion
systems are incorporated within the part-task trainers that
will result in the most effective training.
During the period of August 1976 thro~ugh March 1977,
the Air Force Human Resources Laboratory (AFHRL) conducted
a study to determine how simulator training with a full six
degree motion system affected air-to-ground weapons delivery
training. Twenty-four recent graduates of the pilot training
program were divided into three groups of eight subjects
each. The groups were ranked equally in the areas of flight
63

grades and flight experience. The control group received no
simulator training. Experimental Group I received training
with a motion simulator and Experimental Group II's training
was in a simulator with no motion. The control group received
two familiarization flights in the F-5B aircraft prior to the
flights for score. There were two ordnance carrying flights
with nine bombing patterns made on each flight. The pilot
had six bombs on the aircraft so he would make one practice
pattern and then drop two bombs. This scenario was repeated
for the 108, 151, and 30* delivery patterns. The experimental
groups received eight one-hour sessions in the simulator prac-
ticing the three tasks. Following these sessions, the exper-
iwental groups completed the two familiarization flights and
then flew the same score-taking flights. The method for meas-
uring the bombing score was the circular error probable (CEP),
which is the radius of a circle in which 50 percent of the
projectiles would be expected to fall. Table IV-2 lists the
observed means for each group on the three bomb delivery tasks
in the aircraft.
Additionally, scoreable bombs were defined as those
with a CEP of less than 300 feet. The results of the three
bombing tasks showed that 72 percent of the control group's
bombs were scoreable while 86 percent and 85 percent of
Experimental Groups I and II were scoreable.
Statistically, there were no significant differences
found between the two experimental groups in the number of
"64
S. . . . . . . . • . . . .• ,, ." .

44 44 4
rt4 0 w LOC1 r-H H
0
a)
W E-44~ 4;)N,4.4 44~ 4.4
rd 4)> 0 00 0
cono
HH
HH
~> i- 0 02 02
04
*1 009 4
0 4-
044 4-i. 04-
0 ) a)0
,~ T~i65
;775aO~

qualifying bombs, the number of scoreable bombs, or the
bcmb delivery circular error. These results indicated that
six-degree-of-freedom platform motion did not enhance the
training value of the system. To reemphasize the fact that
the level of fidelity needed within the system should be
carefully evaluated, it should be noted that the aircraft
simulated was a T-37 (with sighting device) and still there
was a significant transfer of training to the F-5B. This
study confirmed the theory developed by Prophet and Boyd in
1970 that a low fidelity device could provide considerable
transfer of training when properly utilized [Ref. 631.
2. Training Programs
Even though sophisticated simulator systems have been
procured by the military, reports have been documented in
which the importance of training program design has been ig-
nored allowing simulators to be misused or used inefficiently
[Ref. 64]. Training programs should be implemented that
interface with the simulator devices. A dynamic flight sim-
ulator used as a Cockpit Procedures Trainer (CPT), for example,
4h. is not being used effectively. A procedure that has proven
to be most effective is to develop and utilize training pro-
grams that are presented in the context of a simulated mission
activity as opposed to an abstract training exercise. Litera-
ture has also shown that skills taught within such a training
program were retained to a greater degree than the abstract
training exercise [Ref. 65].
66
LJ~~~~~~. .... ............" ...": '"' '....... .. ...-- • .... ..... .i . ........ /....... ...... .. . . . .. ., . :.-•.
3. Personnel
Trainees and instriictors both play a significant
role in the trainin4 effectiveness of flight simulators,
particularly in the areas of qualifications and prior
experience.
As was highlighted by comnmercial airlines' use of
individualized programs, all investigations of human learn-
ing are subject to the influences of task-related aptitudes
of the trainees. When a fixed amount of time is allotted,
trainees with a high aptitude are able to transfer more
training to the aircraft; however, where training is to a
fixed performance level and training time is allowed to vary,
both high and low aptitude students attain this performance
level. Tne ability of a simulator to train less experienced
military pilots has been questioned; however, studies have
shown that the flight training devices and programs, if
optimally designed, are effective for pilots with differing
experience levels [Ref. 66],.
Training effectiveness of a simulator system is highly
dependent upon the instructor's input into the program.
Effectiveness can be degraded considerably if instructorsI
are not fully aware of the capabilities and limitations of
the system. In a study sponsored by the Aerospace M11edical
Laboratory, it was determined that instructor ability and
fidelity of simulation were related in such a way that as
67
fidelity increased the necessary level of instructor ability
could decrease, and, conversely, as fidelity decreased in-
structor ability shotuld increase. Unfortunately, observations
had shown that just the opposite occurred, resulting in a
reduction of the simulator's training effectiveness [Ref. 671.
A final personnel point to support training effcc-
tivenest is the single instructor concept. Even though this
variable has not been adequately studied, there appears to be
an increase in effectiveness when a single instructor is
responsible for both simulator and aircraft training, allowing
instructio given in the simulator to be more compatible with
that gi-,, in the aircraft. This reduce; any potential nega-
tive transfer that could occur as a result of instructor-
peculiar performance requirements [Ref. 68].
4. Expectations
What an instructor and trainee expect from a simula-
tor system can affect the training effectiveness. If simula-
tors are viewed as useful only as procedures trainers or as
instrument trainers, they tend to be used only in that
capacity, even though possibly offeting a qreater range of
training opportunities. Attitudes of the personnel can lead
to certain expectations. As an example, it was noted that
older pilots tendeu to make less effective flight instructors,
possibly because of a hesitancy to adopt new teaching methods
such as the use oF simulation. This hesitancy could have
occurred as a result of unsatisfactory experiences with older
68
simulators, resulting in greater confidence in in-flight
training. These expectations, especially of instructors,
must be realized before training effectiveness of the system
is possible [Ref. 69].
Effective simulator training is dependent upon a
proper combination oi the system, training programs, per--
sonnel, expectations, and other factors. These factors,
which may not be that influential in isolation, may become
very volatile, either positively or negatively, when acting
in combination. information about the simulator's design,
the way it was used, and the attitudes and expectations of
the personnel involved should be disseminated, resulting in
greater benefits to simulator training programs under devel-
opment. The first step in this process io to recognize a
need for better communication amon4 the us~ers of simulator
systems which would lead to increased training effectiveness
through graater familiarity with the proces,3es [Ref. 70].
Measuring the training effectiveness of the flight
simulators in military scenarios nas been performed through
many independent research analyses. The next part of Section
IV will describe the results in the mission areas of; (1)
instrument flying in undergradiate pilot training, (2) air-
to-surface weapons delivery for the A-10 aircraft, (3) air-
to-air combat training, and (4) night carrier landing training
in the A-7E.
69

D. TRAINING EFFECTIVENESS REALIZED USING
MILITARY FLIGHT SIMULATORS
1. Instrument Flying In Undergraduate Pilot Training
The study used as a reference for this section was
evaluating the simulator system mix that should be utilized
in the instrument training program; however, information
made available is pertinent to demonstrating training effec-
tiveness of such devices in teaching undergraduate pilots
the mission of instrument flying.
The study, coordinated by AFHRL, was conducted during
the period of March 1976 through July 1977. During this
period, subject pilots were divided into three groups. The
first group received all instrument training in the aircraft. *The second group received all ground instrument training in
the Advanced Simulator for Pilot Training (ASPT) and all pro-
cedures training in the existing T-37 instrument proceduresf
trainer (T'-4, no visual and limited motion). The third group
conducted most of the instrument training in the ASPT with
the remainder of the instrument training and all of the pro-
cedures training in the T-4. It is not the author's intent
to discuss the proper mix of these two trainers as recent
phone conversations with the Instrument Flight Simulator per-
sonnel at Williams AFB, Arizona, have pointed out that the
T-4 is presantly not fully operational and is only being used
as a Cockpit orientation Trainer (COT). The important fact
to highlight is that data were obtained to compare hours of
70
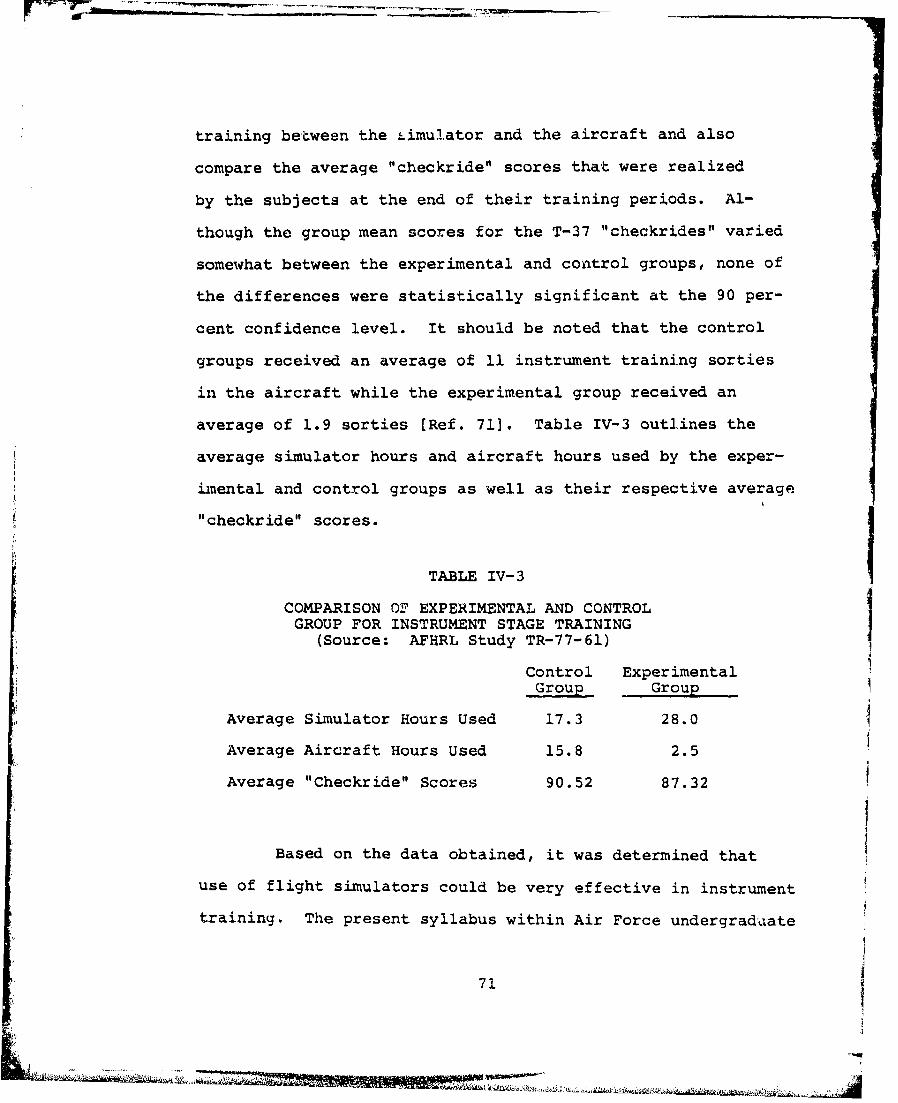
training between the _,imulator and the aircraft and also
compare the average "checkride" scores that were realized
by the subjects at the end of their training periods. Al-
though the group mean scores for the T-37 "checkrides" varied
somewhat between the experimental and control groups, none of
the differences were statistically significant at the 90 per-
cent confidence level. It should be noted that the control
groups received an average of 11 instrument training sorties
in the aircraft while the experimental group received an
average of 1.9 sorties (Ref. 71]. Table IV-3 outlines the
average simulator hours and aircraft hours used by the exper-
imental and control groups as well as their respective average
"checkride" scores.
TABLE IV-3
COMPARISON OF EXPERIMENTAL AND CONTROLGROUP FOR INSTRUMENT STAGE TRAINING I
(Source: AFHRL Study TR-77-61)Control Experimental
Group Group
Average Simulator Hours Used 17.3 28.0
Average Aircraft Hours Used 15.8 2.5
Average "Checkride" Scores 90.52 87.32
I
Based on the data obtained, it was determined that
use of flight simulators could be very effective in instrument
training. The present syllabus within Air Force undergraduate
71I
--

pilot training requires 22.1 hours in the simulator and 5.2
hours in the aircraft for Instrument Phase in the T-37 and
31.2 hours in the simulator with 5.6 hours in the aircraft
Lor Instrument Phase in the T-38. Even with this syllabus
description, the average percent of pilots that qualify on
their first instrument "checkrides" has been 85 to 90 percent
supporting simulator training effectiveness within this
mission [Ref. 72].
2. Air-to-Surface Weapons Delivery for theA-10 Aircraft
During the period that Gray and Fuller were conducting
their transfer of training studies from the T-37 simulator to
the F-SB aircraft, the A-10 aircraft was being introduced into
the Air Force inventory. This is a single-place airplane with
a primary mission of air-to-surface weapons delivery; there-
fore, simulator training was especially critical due to the
fact that the first flight must be a successful solo and the
flights are composed of hazardous activities.
Since there were no A-10 simulators in the inventory,
the Tactical Air Command (TAC) and AFHRL modified the ASPT
to the A-10 configuration. This allowed two objectives to
be achieved. First, it provided AFHRL the opportunity to
further their research in air-to-surface weapons delivery
training with a simulator, and second, it provided the A-10
neophyte pilot with a training device for conversion and
surface attack tasks [Ref. 73].
72

It was recognized from the beginning that the sample
size would be small because of the recent introduction of the
aircraft; however, this drawback was outweighed by the valid-
ity of the sample. The subjects were very representative of
the population because both the students and instructors were
members of an operational combat crew training squadron. It
was determined that assessment of the results of the study
would be based on measures highly relevant to actual
operations [Ref. 741.
The modification of the ASPT to the A-10 configura-
tion was very precise in the area of aircraft performance
and handling qualities. Although the cockpit did not have
complete A-10 instrumentation, all the instruments operated,
and the CGI system depicted Davis-Monthan AFB and Gila Bend
Gunnery Range with reasonable fidelity [Ref. 75].
The study consis.. od of six air-to-surface weapons
delivery tasks including dropping bombs at different dive
angles and firing the internally-mounted gun. Bomb scores
were determined using the CEP as the criterion measure while
the percentage of hits per rounds fired was used to score the
firing of the gun.
There were 24 students participating in the study.
The experimental group (17 students) received an average of
six hours of training in the simulator prior to flying the
aircraft. The control group (7 students) did not receive any
73
L .I
L'V
practice in the simulator before flying the aircraft. There
were 12 sorties flown in the surface attack weapons delivery
phase. The first seven sorties were conventional deliveries
with 300 dive bomb (DB), 200 low angle low drag (LALD), and
150 low angle bomb (LAB). The remaining five sorties included
50 low angle strafe (LAS) and "Pop-up" deliveries using 200
LALD and 150 LAB [Ref. 76). "Pop-up" deliveries, as opposed
to conventional deliveries, means ingressing into the target
area at a low altitude, pulling the nose of the aircraft up
to a predetermined pitch attitude, climbing to visually
acquire the target, and then completing the ordnance delivery.
Figures IV-1 through IV-5 graphically portray the average CEP
scores, in meters, that were realized on each sortie for
bombing tasks, and Figure IV-6 plots the percentage of rounds
through the target for the low angle strafe task.
The data made available to this author were only the
average circular error probables for each sortie. To support
the fact that all tests were run at the 5 percent level of
significance, this author applied a t-test of statistical
significance to the average data to compute the Prob-value
(PV) for each task. The null hypothesis (H0 : 1 - P2 0)
implied no difference between the control group and the
experimental group while the alternative hypothesis
(H 1 : Pl -•2 > 0) implied that the average CEP for the
control group was greater than the experimental group. Table
IV-4 outlines the t-statistic value and the Prob-value for
74
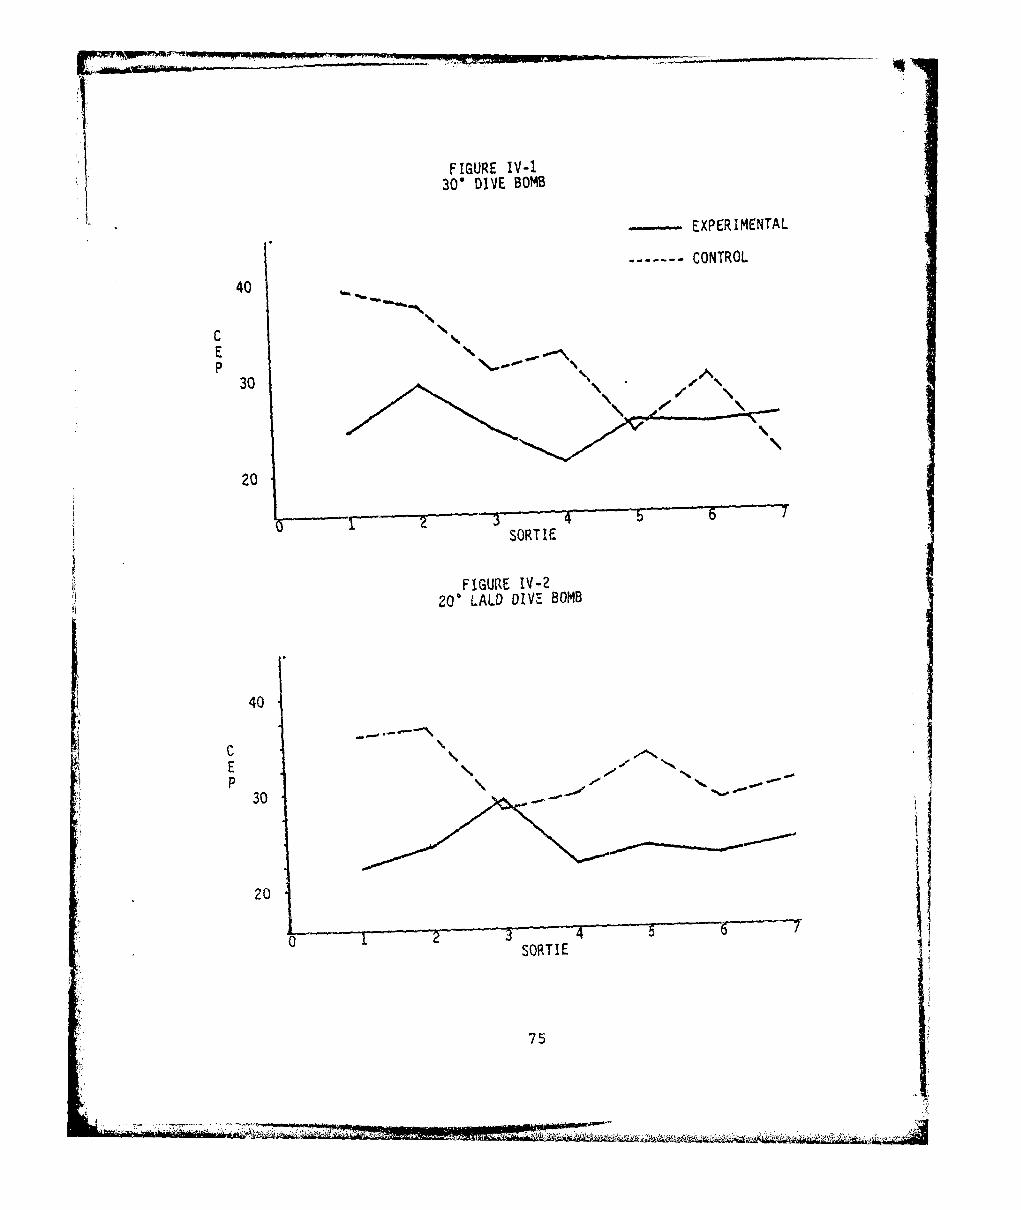
FIGURE IV-).3Q* DIVE BOMB
- EXPERIMENTAL
----------------------- ------- CONTROL
40
CE
30
20
SORTIE
FIGUR~E IV-241 200 LALD DIVE BOMB
40
Ep
'
30
201
SORTIE
75
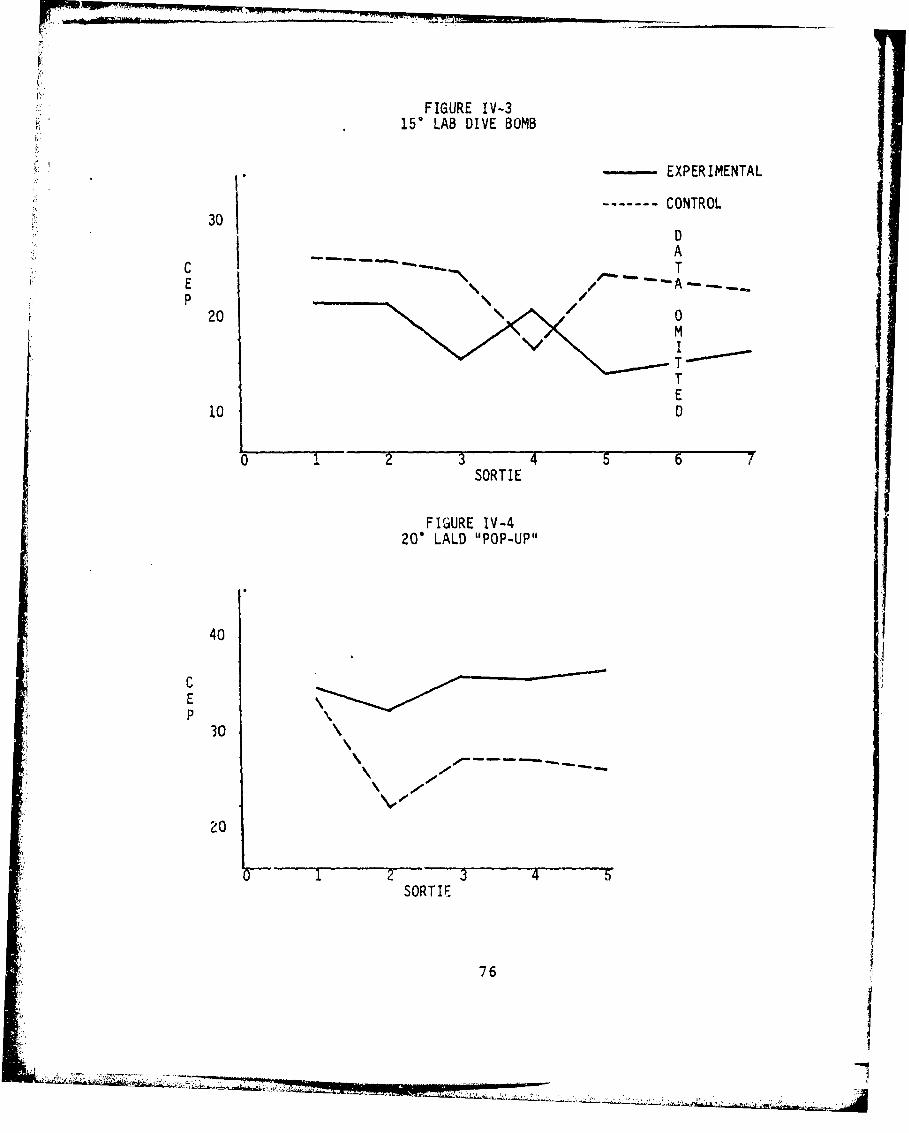
FIGURE IV-315" LAB DIVE BOMB
- : EXPERIMENTAL
------- CONTROL30
AC TEAP
20 0MITT
E10 0
"2 3 4 6 7SORTIE
FIGURE IV-420" LALD "POP-UP"
40
CEP
30
-,\ -/
20
1 2 3 4 5SORTIE
76

FIGURE IV-515" LAB "POP-UP"
-, EXPERIMENTAL
------- CONTROL
30
CP \
20 -
10
0 2 3 4 5SORTIE
FIGURE IV-65" LOW ANGLE STRAFE
75
TARG 50E
T/
H,,I -T 25S
1O2 3 5SORTIE
77

each task. It must be remembered that the values were cal-
culated from average scores and are not as valid as raw data.
Since the PV for each task, except the 200 LALD "Pop-up," is
less than .05, the null hypothesis (HO) should be rejected
at the 95 percent confidence level, meaning that there is a
statistically significant differ-nce between the control
group and the experimental group.
TABLE IV-4
t-STATISTIC AND PROB-VALUESFOR A-10 AIR-TO-SURFACE TASKS
Task t-Statistic (ts) Prob-Value (PV)
300 Dive Bomb 2.198 .024
200 LALD Dive Bomb 4.774 .0002
150 LAB Dive Bomb 2.63 .013
20" LALD "Pop-up" -3.78 .997
151 LAB "Pop-up" 1.910 .046
50 LAS 3.929 .002
As depicted on Figure IV-4 and supported by the
average-based t-statistic and PV in Table IV-4, the control
group exhibited significantly better performance than the
experimental group in the 200 LALD "Pop-up" task. It was
determined that ASPT's flat visual flight plane offered
limited depth perception cues. As a result, the ability to
judge angle-off approaches and apex positioning made the
78
"Pop-up" weapons delivery task more difficult to satisfac-
torily simulate [Ref. 77].
In conclusion, it was determined that three ASPT
sorties (6 hours) provided highly effective training. The
data indicated that the simulator also provided more bene-
ficial training in the conventional delivery and low angle
strafe than in the "Pop-up" delivery. Additional benefits
included flight safety and ease of instruction on the con-
trolled range. Mechanical and procedural problems could be
either eliminated or reduced in the simulator, leaving more
time for instructing weapon delivery techniques on the actual
range [Ref. 78].
3. Air-to-Air Combat Training
State-of-the-art simulators provide an excellent
opportunity to enhance training effectiveness in air-to-air
combat. If the aerodynamic capabilities are properly pro-
grammed, it allows the pilot an opportunity to explore the
edges of the maneuvering envelope without sacrificing safety
of flight. It also gives the pilot excellent training in
utilizing different weapons systems such as missiles and guns
and also to develop both offensive and defensive tactics.
The U.S, Air Force, through a joint program with the
Vought Corporation, has developed a Good Stick Index (GSI)
for measuring the training effectiveness of air-to-air combat
simulation. The GSI was formulated from data gathered in
Vought's Air Command Engagement Simulator (ACES). The ACES
79

consists of two cockpits, each situated within 16 foot
diamneter spherical screens. it utilizes F-4 cockpits with
complete instrumentation plus the ability to program into
the computer MIG-21 aerodynamic characteristics in order to
provide training in dissimilar aircraft engagements [Ref. 791.
i. Normally, classes utilizing the ACES Training Program
consisted of eight students. The students would fly approxi-
mately 8.5 to 9.0 hours in the simulator between Monday and
Friday. The study discussed in this part of Section IV exam-
ined data from four of twelve classes which used th&., simulator
from 3 April 1978 through 23 June 1978. During this period,
89 students were evaluated. At the end of the training
period, a "turkey shoot" tournament was conducted in which
the students flew one-versus-one engagements with double
elimination rules. It was the intent of the study to statis-
tically validate the GSI as a predictor of the "turkey shoot"
winner, investigate improvement in the GSI by varying the
weight factors of the parameters, and introduce additional
parameters to determine whether the predictions could be im-
proved. These objective evaluations were also compared with
predictions of the instructor pilots to assess its agreement
with expert opinion [Ref. 801. (Readers interested in further
details concerning the study or the statistical analysis are
encouraged to read AFHRL-TR-79-15 which may be obtained from
the Air Force Human Resources Laboratory, Air Force Systems
Command, Brooks AFB, Texas.) This author intends to define
80

the GSI and show, through the data gathered from the four
classes, that the pilot's ability did improve during the one
week of training.
Computation of the GSI score was accomplished using
data obtained from the predictor variables measured by the
computer system. The data were recorded when the simulator
was flown against five canned targets. The five canned tar-
gets consisted of two cinetrack runs and three head-on passes.
The coefficients of the equation were computationally weighted
to provide an ideal score of 1000. The equation developed is,
GSI = 4.6(70 - MILERR) + 0.86 (PANG) + (O/D - 35)
+ 0.5 (180 - TTFK)
where:
MILERR average mill error over two cinetrack runswhile range is less than 3000 feet.
PANG = average percentage of engagement time inpointing angle advantage over two cinetrackruns at a range less than 3000 feet.
O/D = average ratio of offensive to defensive timeagainst the head-on targets. Offensivetime is the time the target aircraft is inthe front hemisphere of the piloted aircraft.
TTFK = average time to first kill (seconds) frombeginning of run until student achieves firstkill against head-on targets with gun or heatmissile. (Ref. 81]
Table IV-5 lists the Monday and Friday GSI scores
for 27 pilots tested during this study. Hypothesis testing
is used to compute the t-statistic and the PV from the actual
data. The null hypothesis is that there is no difference in
81
- I

TABLE IV-5
PILOT GSI S-nME' BEFORE AND AFTER SIMULATOR TRAINING
'i.rce: AFHRL Study TR-79-15)
After Training Before Training
(Friday) -(Monday)
So595 359
601 3122 589 2663 547 1254 499 3095 549 3936 552 3047 794 2108 447 5319562 234
11 570 304131 494 19912 494 393
13 487 68714851 391
15 73916 751 553/ 17 531 24717 527 36818 716 57719 581 36420
681 55021 571 26422 566 55323 18724 515
25 616 14526 690 41427 773 529
HYPOTHESIS TESTING
1 A • = 0B
HI; : A - 'B >
ta = 7.039 df 52
PV = .000
82

the GSI between Monday and Friday versus the alternative
hypothesis that there exists a statistically significant
difference. Since the PV is less than .05, we may reject
the null hypothesis that the population means are equal and
accept the alternative hypothesis that the Friday GSI score
is greater than the Monday score.
Through the ACES, the Tactical Air Command has been
able to complement and reinforce flight training in the air-
to-air environment. The program has been developed to opti-
mizt simulation training, so that it will enhance the flight
syllabus, not replace it. The simulator system involves all
facets of one-versus-one similar and dissimilar training,
including the ability to train with all ordnance systems.
The debriefing ability 4ncludes data recording, replay, and
video recording. The scoring system looks at ordnance firing
conditions and combat management. Every tenth bullet is
scored and the attacker's "g" and angle of attack are recorded
along with tht Aiming error, range, angle off, and target
crossinc angle. Missile firing data is evaluated to determine
if the missile was fired within the proper envelope, and, if
not, which parameters were not satisfied.
The cost of operating the simulator is approximately
$250 per hour per cockpit, compared to the operating cost of
the F-4 which is about $1.500 per hour. These values take on
mucd greater meaning when one considers that during a one
hour flight a pilot would experience approximately three
83

engagements in the aircraft and 15 engagements in the simu-
lator. During the one week's training a pilot will, receive
an average of 134 engagements [Ref. 82j.
General Robert Dixon, Commander of the Tactical Air
Command, reemphasized the value of air-to-air simulation
training when he stated,
With today's advanced state-of-the-art in lethal aircombat weapons systems, TAC feels that training must bebetter than ever before so that every advantage of thesystem over those of the enemy may bp.~ fully exploitedby the key ingredient of the system, the man. TAC must,through optimized training, make the combat pilot'scapability match that of his equipment. His appraisals,decisions, and actions m~ust match the speed and accuracyof his machine. And, in these austere times, the AirForce is particularly interested in improved pilotcapability without an appreciable increase in cost.[Ref. 83).
This improved pilot capability can be realized through
effective utilization of an air-to-air combat simulator.
4. Night CarrieT Landing Training in the A-7E
Training effectiveness of the A-7E Night Carrier
Landing Trainer (NCLT) was determined by using pilots that
were members of the Replacement Air Group (RAG) squadron.
The pilot trainees were selected for NCLT training (exper-
imental Group) or NO-NCLT training (control group) on the
basis of the following specific selection and assignment
criteria,-
(a) No previous A-7E experience.
(b) No night carrier landing experience in any
aircraft for the last three years.
84

(c) Random selection from newly designated aviators,pilots who had instructed in the training commandbut with no fleet experience, pilots who had beenassigned to billets with variable flying time forthe past 18 months to three years, and ex-prisonersof war or experienced aviators who had not flownin two or three years.
(d) Random selection of pilots on the basis of previousjet flight hours.
From these criteria, 26 pilots were chosen for NCLT training
while 27 pilots were placed in the NO-NCLT training group.
Their average jet flight hours were 715 and 747 hours
respectively [Ref. 841.
The planned simulator training schedule provided for
the experimental group to receive 6.5 bours of training with
approximately 85 controlled approaches. The control group
received 2.5 hours of familiarization training in the simu-
lator but no controlled approaches [Ref. 85).
There were both objective carrier landing performance
measures and subjective performance measures used to determine
the transfer of training effectiveness. Variables zuch as
altitude and lateral error from glideslope and centerline, an
objective measure derived from wire number arrestnent, and
the percentage of final approaches that resulted in successful
landings were some examples of the objective landing perfor-
mance measurements, while the Landing Signal Officer (LSO)
evaluations and pilot questionnaires provided the qualitative
performance measurements (Ref. 86].
85 II
Both the quantitative and qualitative performance
measurements had statistical tests applied to their values.
The Night Carrier Qualification Landing Performance Score
was significantly different for NCLT pilots (ts = 1.98,
df = 46, PV = .02). The night boarding rate was also sig-
nificantly different for the NCLT pilots based on a t-test
of proportions (ts = 1.643, df = 46, PV = .05). The NCLT
group (185 approaches) had a 7 percent higher boarding rate
than the NO-NCLT group (202 night approaches). The overall
attrition rate was found to be significantly different
between the two groups (ts = 2.50, df = 51, PV = .006). The
NCLT pilots had one disqualification out of 26, while there
were eight disqualifications out of the 27 NO-NCLT pilots
[Ref. 87]. This means that 96 percent of the NCLT trained
pilots were successful ia their first carrier qualification
period. On the other hand, disqualified pilots averaged 12
weeks longer in training plus they required 19 percent more
total A-7E flight hours and 33 percent more night hours be-
fore night carrier qualification [Ref. 88]. In terms of
qualitative measures, LSO evaluations of final approach and
carrier landings were found to be statistically different at
night (ts = 2.78, df = 46, PV = .003) [Ref. 89].
It was also determined from analyzing the data that
the recently designated aviator received very effective
training from the NCLT. His attrition rate was only 8 percent
while the new aviator that did not train in the NCLT had an
86

attrition rate of 44 percent. New aviators, with NCLT
training, had a 50 percent success rate for their first
night approach compared to a 31 percent success rate for
the new aviator with NO-NCLT experience (Ref. 90].
Data, such as described in the preceding paragraphs,
support the theory that the NCLT is an effective trainer forpreparing aviators for night carrier qualification. From a
safety standpoint, the night carrier accident rate has been
reduced by 80 percent since introduction of the NCLT into
the training process (Ref. 91].
E. SUMM4ARY
Section IV has described methods of measuring training
effectiveness, factors influencing simulator training effec-
tiveness, and training effectiveness realized from military
flight simulators. No studies examined by this author wouldI
support a finding that flight simulators do not provide
effective trainkr,ý; however, improving the system's cost
effectiveness requires further examination. Section V will
investigate the areas of improving and measuring cost effec-
tiveness of vi.oual flight simulation.
87

V. COST-EFFECTIVENESS OF MILITARY 'FLIGHT S:IMULATORS
A. GENERAL
In a report recently released by Frost and Sullivan,
Incorporated, it was disclosed that spending on flight sim-
ulators and training devices by the military, NASA, and
civilian markets was projected to total slightly below $7
billion between FY 1981 and FY 1985. The Navy was forecast
to emerge as the lar ;est buyer during this period with a
projected outlay of $2.44 billion, equating to 35 percent ofI
the total market [Ref. 92],. With the amount of money being
invested in flight simulators, it is obvious that these
systems have become an integral part of the total weapons
system procurement for the military; therefore, it is abso-J
¶11
lutely critical that the systems be utilized in the most
cost-effective manner. Section IV described the training
effectiveness of mailitcary flight simulators, but it should
be noted that the fact thiat flight simulators are effactive
for training does not necessarily imply that the systems are
worth their cost [Ref. 93].
Section V will: (1) examine a method that bas been used
by the Navy to measure the cost-effect~ivenress of flight simnu-
lators; (2) describe an application of Taicroaconomic theory
that could approximate the aptimnum mix of training hot-irs
88
r.I,qI
it4I

At.
between an aircraft and simulator, and therefore improve cost-
effectiveness; (3) outline the cost-effectiveness analysis
used by the Army for their AH-1 helicopter flight simulator;
(4) describe a model developed by the Analytic Services
(ANSER MODEL) for determining the cost-effectiveness of air-
crew training devices; and (5) suggest an area that could be
studied in order to improve the cost-effectiveness of simu-
lator systems.
B. NAVAL AIR SYSTEMS COMMAND COST-EFFECTIVENESS METHODOLOGY
The Navy conducts a cost-benefit analysis as part of the
procedure used to determine whether or not to procure a
flight simulator system. The costs associated with the anal-
ysis include the capital investment, any cost associated with
modifications or updates to the system, annual operations and
maintenance costs, ariA -1v military corL~truction necessary to
"house" or support the system. Benefits include cost savings
associated with flight hour substitution, depreciation sav-
ings, and the assumed savings associated with accident
reduction.
Cost savings are determined by using the following
equation-:
Cost Savings (Cost/Flight Hour) x(Flight Hour Substitution)
Cost per flight ho;ur for each aircraft can be obtained from
the Navy Program Factors Manual and inclules cost associated
89
-4g

with petrolewn-oil'-lubricants (POL) cost per hour, organiza-
tional and intermediate maintenance per flight hour, compone-nt
rework, replenishment spares, and engine overhaul. Flight
hours substitution is the projected number of hours in a year
that can be substituted in the simulator instead of flown in
the aircraft.
Information necessary to compute depreciation savings
includes aircraft acquisition cost, aircraft service life,
the number of aircraft at the base where the simulator is
located, and the number of flight hours projected to be flown
by an aircraft during the year. Depreciation savings are
calculated by using the following equation:
Depreciation Savings = (Depreciation/Aircraft) x
(Number Aircraft) x
Flt. Hour Substitution(Flt. Hrs + Flt. Hrs. Subs.
The third area measured in order to determine annual
4,, benefits is accident reduction. The assumption used to
support this measurement is that all pilot error accidents
could have been avoided by using flight simulators. An
estimated monetary loss for damage to aircraft due to pilot
error is determined and then multiplied by the yearly flight
hour substitution.
Accident Reduction Savings $ Hr. x Flt. Hr. Subs.
Other factors considered in procurement of a simulator
system includes the value of a human life and the emergency
90,

Or_ _ _ _ __ _ _ _ _ _
training capability which is imPossiDle or unsafe to conduct
in the aircraft. Both of these factors are difficult to
reduce to monetary quantities [Ref. 941.
Utilizing the cost-benefit methodology, this author
performed an analysis using data from the Instrument Flight
Simulator Training Division at Williams AFB, Arizona. De-
preciation savings was not computed since the aircraft at
Williams (T-37 and T-38) had exceeded their service lives,
making depreciation zero. It should also be noted that in
computing the accident reduction savings, $260,000 was used
as a value for a human life (Ref. 95].. The amount shown for
initial capital investment also includes modifications and
updates. Table V-i presents the cost-~effectiveness analysis.
Present values are computed using a 10 percent disco~'ntIfactor as required by Department of Defense Instruction
7041.3, EconomicAnalysis and Program Evaluation for Resource
Management.
During the period FY 78 through FY 80, the net benefit
K associated with the instrument flight simulators totaled
$31,336,796, which means that the system was fully amortized
in slightly less than three years. As evidenced by the values
in Table V-1, flight hour substitution is the primary benefit
realized from flight simulator utilization; however, the
substitution hours are "best-guess" subjective estimates and
are not objectively determined. The next section will outline
a procedure for realizing the optimum mix of simulator and
aircraft hours using Inicroeconomic theory as a framework.
91

w~ m m r D r-. 00
rZ4~~ 0sC1 - r- 0D
r- H- 'q' r- Ll N M' 0
wo HH4 oj a% ýo H co cio H
co~0 w 00 C40 r n
E- OH 0 i - ý 0 00 U, 0
w' ' -D H -H 00 r- mI H 7 C4~5 - 5 5
E-qI- 00 C r- H oc C14 a)
CD 0 I 0 .04 ~ 'N '
CD~ 00O a~ 0 c>O ~'0 HH 0HC)O C0
LO C
E -4 r1H 0 000w44 M m
H a)
4-)0 0 ' 4- HH
u~ 41 0
H)0 > 0.90. I ( u
HJ 00- 4J- M-F >1 W~ = 4Ji
W J U Z ( J2 r-4 kW .)r-
0~~( 04 '.0u u 0 00 H P4 4J
92

C. IMPROVING COST-EFFECTIVENESS USING MICROECONOMICTHEORY AS A FRAMEWORK
The microeconomic theory being used is normally employed
when showing production with two variable inputs. An example
of variable inputs would be labor and capital. Different
combinations of labor and capital can be used to produce the
same output. Figure V-1 depicts this by plotting an isoquant
on a graph with capital on the y-axis and labor on the x-axis.
FIGURE V-1
PRODUCTION ISOQUANT
50
~4044
30
'I20
10 10
U
0 .1.0 20 30 40 50 60 70 80
Labor per unit of time
The grnph shows that different combinations of inputs such Ias 50 units of capital and 15 units of labor or 10 units of
capital and 75 units of labor produce the same ida units ofoutput; therefore, an psoquant is a curve showing all possible
combinations of inputs physically capable of producing a given
93
FIGURE V-I~

level of output. Isoquants are concave from above, indicat-
ing a diminishing marginal rate of technical substitution.
This concavity implies that as capital decreases by equal
amounts, proportionately more labor must be added in order
to maintain the same output level. [Ref. 96:1.
With the isoguant plotted, the producer is now concerned
with the costs associated with the two inputs. In determin-
ing his operating input, it is important for the producer
to pay particular attention to relative input prices in order
to minimize the cost of producing a given output or maximize
output for a given level of cost.
The next step in the analysis would be to plot a cost
constraint on a graph such as depicted in Figure V-1. As
an example, suppose the cost of capital was $1000 per unit
and labor wage rates were $2500 per man year. If the deci-
sion was made to invest $15,000 in the two inputs, then the
producer could invest the total amount in capital. resulting
in 15 units being purchased, or he could invest totally in
labor allowing him to purchase si~c man years. Using these
two points, the producer could plot the cost constraint, line
C on the isoguant graph as depicted in Figure V-2.
The producer would use the combination of inputs where
the cost constraint, line C', is tangent to the production
isoquant. This satisfies the principle of maximizing output
subject to a given cost or minimizing cost subject to a given
output because at the tangency point the marginal rate of
94

technical substitution is equal to the input price ratio
(the price of labor to the price of capital). For the pro-
ducer, the criterion for fixed effectiveness at the minimum
cost would be to use K0 units of capital and L0 units of
labor (Ref. 97].
FIGURE V-2
PRODUCTION ISOQUANT AND COST CONSTRAINT
50,K.
"40,0
.-4 30
a 20
14 0 Q -" 100
10 0 020 30 C 40 50 60 70 80
Labor per unit of time
This analysis can be applied to the determination of the
optimum mix of aircraft hours and simulator hours necessary
to attain a required level of effectiveness at the minimum
operating cost. In 1973, a study was conducted by Povenmire
and Roscoe in which they developed an effectiveness isoquant
by plotting the average hours needed for students to pass
their final flight check after practicing a certain number
95S~I

of hours in the Piper Cherokee and the Link GAT-1 trainer.
Table V-2 outlines the results of this study (Ref. 98].
TABLE V-2
SIMULATOR HOURS VS. AIRCRAFT HOURSNEEDED TO PASS FINAL FLIGHT CHECK
(Source: Povenmire and Roscoe, 1973)
Average Hours Needed toGroup Group Size Pass Final Flight Check
Aircraft only 14 45.4
Simulator
3 Hours 13 40.3
7 Hours 9 38. 6
11 Hours 10 37.9
If one were to plot and connect the four points, the
resultant curve would be an effectiveness isoquant because
all combinations of aircraft and simulator time result in
the student being able to pass his final flight check, i.e.,
fixed effectiveness. The next step in the procedure would
be to determine the operating cost per hour for the aircraft
and simulator. By taking these costs and dividing each into
some fixed investment dollars, a cost constraint line could
be determined. The tangency point between this line and the
effectiveness isoquant would show the optimum mix of aircraft
hours and simulato, hours needed to satisfy the fixed effec-
tiveness at the minimum cost.
96

D.COST-EFFECTIVENESS ANLSSFORTH HlELCPR
The Army conducted a cost and training effectiveness
analysis (CTEA) for the AH-l "Cobra" flight simulator
(AH-lFS) and released it through the Directorate of Training
Developments, U.S. Army Aviation Center, Fort Rucker, Ala-
bama, in November 1979.
The cost-effectiveness portion of the study was divided
into three major areas, including the task training analysis,
the cost analysis, and the task priority.I
As with most studies described in this thesis, two groups
were designated to undergo the required training with the
control group receiving all training in the aircraft and the
experimental group completing simulator training before fly-
ing the aircraft. All aviators in both groups had completed
primary rotary wing training in the UH-l "Huey" helicopter.
The co~ntrol group was comprised of 14 aviators with an average
cf 517 rotary wing hours while the experimental group had 26
aviators with an average experience level of 546 rotary wing
hours [Ref. 99].
Data were collected for both the erperimental and control
group for 44 separate tasks. The data forms were identical so
that training iAi the simulator could be compared to training
in the aircraft. Examples of tasks to be performed included:
hover flight, maximum performance takeoff, running landings,
and firing of rockets.
97

The first step in the study was to det:. ' the task
training analysis. For each of the 44 listinc,. tasks, a
curve was developed showing the relationship between task
training in the simulator and the aircraft. The equation
for this curve was in the form of Y = ble b 2x + b3 , where
x is defined as the amount of simulator training time and Y
is the amount of additional aircraft training time required
to meet the standard. The variables b1 , b 2 , and b 3 , were
numerical values determined from a least squares fit to the
collected data. The fixed effectiveness utilized was deter-
mined by Aviator Qualification Course (AQC) standards for
each of the tasks. For the task of running landings, the
equation for the curve was Y = 5 . 6-0.32x + 2.51 [Ref. 100],
The curves that were developed for each task were also
used to determine the most cost-effective mix of simulator
and aircraft training time. Instead of using the graphical
approach as previously described, the analysts used calculus
to minimize the total cost equation. This equation was in
the form of:
Ct C CY + C2X
where Ct total task training cost
C1 = aircraft task training cost per minute
C2 = simulator task training cost per minnte
X = simulator task training time (minutes)
Y = aircraft task training time (minutes).
Substituting Y = be2x + b3 into the total cost equation
98
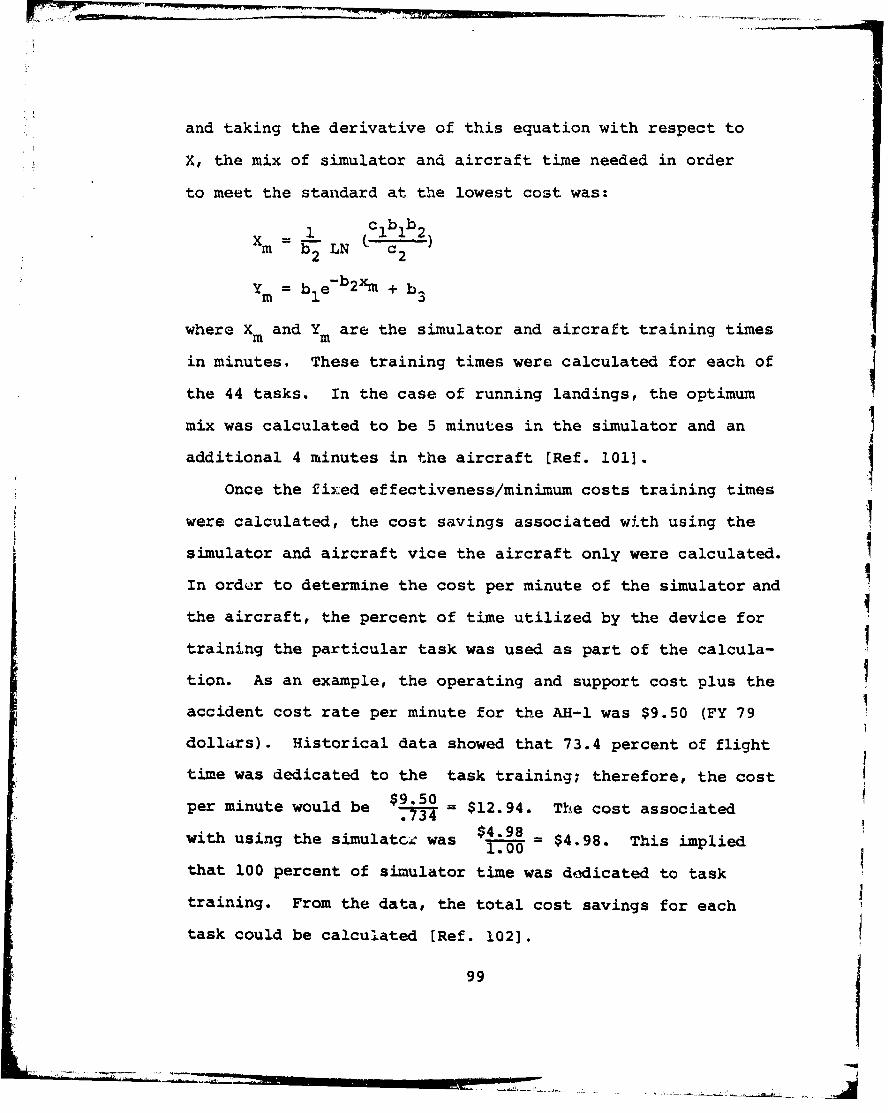
and taking the derivative of this equation with respect to
X, the mix of simulator and aircraft time needed in order
to meet the standard at the lowest cost was:
1 (cll2Xm E22 LN c
2 2
Y= b 1e-b2xm + b 3
where Xm and Ym are the simulator and aircraft training times
in minutes. These training times were calculated for each of
the 44 tasks. In the case of running landings, the optimum
mix was calculated to be 5 minutes in the simulator and an
additional 4 minutes in the aircraft [Ref. 101].Once the fixed effectiveness/minimum costs training times
were calculated, the cost savings associated with using the
simulator and aircraft vice the aircraft only were calculated.I
In order to determine the cost per minute of the simulator and
the aircraft, the percent of time utilized by the device for
training the particular task was used as part of the calcula-
tion. As an example, the operating and support cost plus the
accident cost rate per minute for the AH-1 was $9.50 (FY 79
dollars). Historical data showed that 73.4 percent of flight
time was dedicated to the task training; therefore, the costper minute would be $9.50
p mneo = $12.94. The cost associated
with using the simulatcz was $4.98 = $4.98. This implied1-.00
that 100 percent of simulator time was dedicated to task
training. From the data, the total cost savings for each
task could be calculated [Ref. 102].
99L I
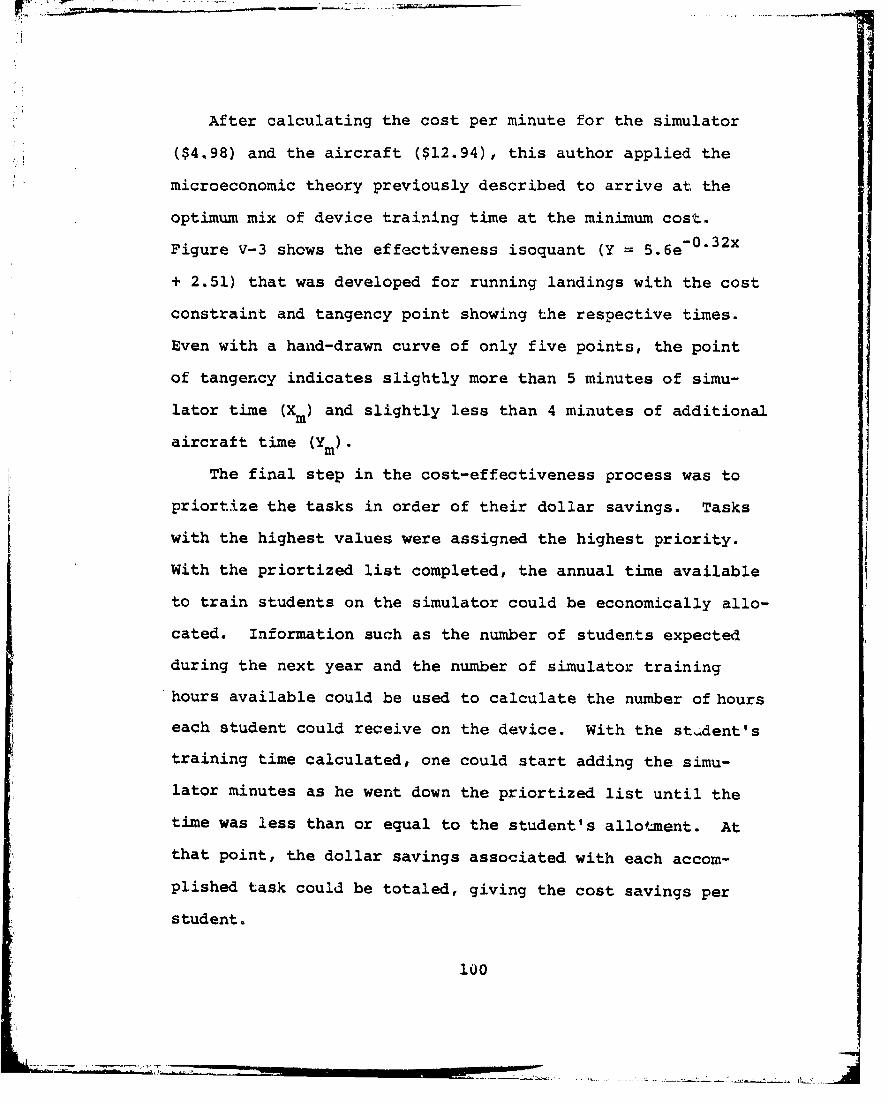
After calculating the cost per minute for the simulator
($4.98) and the aircraft ($12.94), this author applied the
microeconomic theory previously described to arrive at the
optimum mix of device training time at the minimum cost.
Figure V-3 shows the effectiveness isoquant (Y = 5.6e- 0 . 3 2 x
+ 2.51) that was developed for running landings with the cost
constraint and tangency point showing the respective times.
Even with a hand-drawn curve of only five points, the point
of tangency indicates slightly more than 5 minutes of simu-
lator time (Xm) and slightly less than 4 minutes of additional
aircraft time (Ym).
The final step in the cost-effectiveness process was to
priortize the tasks in order of their dollar savings. Tasks
with the highest values were assigned the highest priority.
With the priortized list completed, the annual time available
to train students on the simulator could be economically allo-
cated. Information such as the number of students expected
during the next year and the number of simulator training
hours available could be used to calculate the number of hours
each student could receive on the device. With the student's
training time calculated, one could start adding the simu-
lator minutes as he went down the priortized list until the
time was less than or equal to the student's allotment. At
that point, the dollar savings associated with each accom-
plished task could be totaled, giving the cost savings per
student.
100

Iv-
n -I
IIS2:
cLJW-4 V)
LLJ
ae /- V)FS cc jL
0I-/
(n ~LL./(OLu
co Ln-4-
10

The procedure used by the U.S. Army determined the most
cost-effective means of employing the flight simulator and
aircraft; however, the question of training effectiveness
still remained unanswered. To determine this effectiveness,
aircraft "checkrides" were given to both groups with scores
taken for each of the 44 tasks [Ref. 103]. This author
conducted a hypothesis test using the average scores on the
"checkrides" with the following results:
H :1" E - PC 0
H I : 1 E - PC > 0
ts = 2.796df = 66PV = .0034
where E = experimental group
C = control group.
Since the PV is less than .01, we may reject the null
hypothesis that the population checkride scores are equal
and accept the alternative hypothesis that "ciheckride"
scores for the experimental group are greater than "check-
ride" scores for the control group.
E. THE ANSER MODEL
Presently, economic analyses conducted in conjunction
with procurement of flight simulators do not evaluate the
effects of variations in training effectiveness. The Air
Force has three such models, which are utilized during the
simulator acquisition and testing cycle, to include: the
102

RCA Cost Model, the Logistic Support Cost Model, and the
Air Force Test and Evaluation Cente- (AFTEC) Cost of Owner-
ship Model. All of these models treat training effectiveness
as fixed. In other words, the assumption is made that the
training alternatives of interest are equally effective;
therefore, simple cost comparisons will suffice for cost-
effectiveniess analysis purposes [Ref. 1041.
Cost-effectiveness analysis does not simply mean collect-ting cost and effectiveness data. A methodology, or a model,
must be defined that would simultaneously consider both cost
and effectiveness inputs, and allow trade-off s between these
inputs in order to efficiently evaluate resource allocation
alternatives [Ref. 105]. The cost-effectiveness model must
have certain characteristics, to include: (1) a formalized
framework so that all alternatives can be compared in a con-
sistent manner; (2) sufficient flexibility to accommodate
differences that exist between device training applications;
(3) support decisions between various training alternatives
on the basis of measured or predicted cost and training
effectiveness indices; (4) be sensitive to change with re-
gards to performance, utilization, or capability of the
device; (5) include all relevant cost categories associated
with training; and (6) be computerized to permit practical
application [Ref. 1061. The characteristics described are
availc.ble within the ANSER model.
103

The primary purpose of the ANSER model is to identify
the most cost-effective mix of training devices (including
the aircraft, full.-mission simulators, cockpit procedures
trainers, part-task trainers, media, and cl&ssroom instruc-
tion) for aircrew training on a given weapons system. In
order to accomplish this purpose, the model requires input
data on training requirements and device training capabili-
ties. once all mixes of devices that can satisfy the training
requirements are determined, the model uses device acquisition
and operating costs to select the most cost-effective mixes
and compute the life cycle costs of these sets of devices
[Ref. 3107].
The number of training devices from which to make a
choice is modeled as a controlled variable while procurement
costs and operations and maintenance costs are considered
fixed parameters. State variables, such as utilization
rates, are dependent upon the controllable variable. By
testing all combinations of the integer values of the con-
trollable variables, the most cost-effective combination of
devices can be determined [Ref. 10831.
Input data fo.:z training requirements includes the number
of training tasks, the average number of hours required in a
device for a student to accomplish each training component,A
and the number of students to be trained. Data needed for
the training device includes the ability of each device to
satisfy each training component and the maximum time each
104
device can be used for training purposes. To determine the
ability cf a device to satisfy a training component, the
task must be evaluated in terms of whether it is transferable
or non-transferable. Transferable requirements can be accom-
plished on a number of different devices, while non-transfer-
able requirements, such as critical emergency procedures
training, can only be accomplished on a specific device.
This information is very important when trying to allocate
the time available on each device [Ref. 1091.
For each task, devices are inserted into a matrix in
order of increasing capability. Times are then assigned to
the devices to meet the total training requirement. The
times are assigned first to the least capable device up to
its maximum capability. This process is repeated for each
device until the complete training requirement is met. If
the requirements and capabilities can be successfully meshed,
an effective alternative has been determined, therefore
applicable cost data can be calculated [Raf. 110]. Figure
V-4 provides a simplified schematic for the effectiveness
determi.ation.
Input data for traiiuing costs includes procurement cost
of each training device, operating and support costs for each
device, the economic service life for each device, and appro-
priate discount and inflation factors. Figure V-5 shows the
cost process associated with the model.
105
I,-'
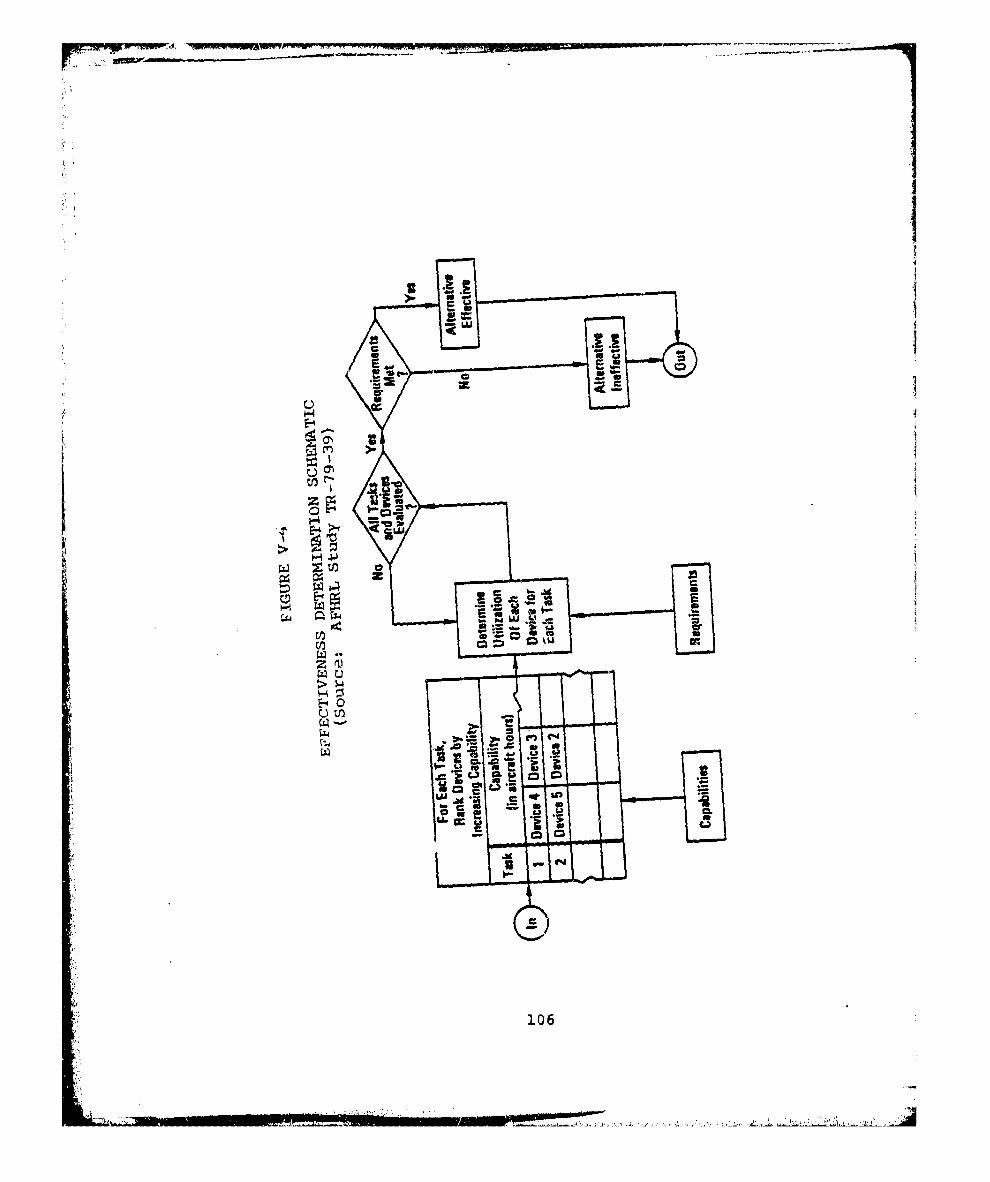
1-41
z (Uij
0
106
0. C .-

RMOR!~~--.- ~ -
C-..
ttE-4
U
J.10
p cjI

Cost comparisons are based on the average annual cost
, for each of the effective alternatives. The equation for
determining average annual cost is:
TOTAL PRESENT VALUEAVERAGE ANNUAL COST =mSUM OF ANNUAL DISCOUNT AND/ORINFLATION FACTORS
This equates to the normal present value equation ofFn
(1 + r)n ' where P = present value, Fn = future value in
year n, r = s,xm of inflation and djiscount factors, and n -
year or period (Ref. 111].
Major cost elements used in the model are,
Acquisition Costs-Research, Development, Training and Evaluation-Engineering Development-Procusement
Operation Costs-Operations Manpower-Base System raintenance Manpower-Base Maintenance Material-Misce'laneous Personnel Support-Utilities/Fuel-Costs Associated with Temporary Duty
Base Operating Support Costs-Base Services Manpower-Mi,3cellaneous Personnel Support
Logistics Support Costs-Depot Maintenance Manpower and Material-Supply Depot Manpower and Material-Second Destination Transportation-Teýhnical Order Maintenance
Personnel Support Costs-Recrui.t Technical Training Manpower-Technical Training Coats-Medical Manpower-M-.dical Material-Permanent Change of Station Costs-Miscellaneous Personnel Support
108

Recurring Investment Costs-Replenishment Spares-Recurring Modifications-Common Support Equipment [Ref. 112].
Readers of this thesis that are interested in further defin-
itions of each cost element are encouraged to obtain AFHRL
Study TR-79-39.
The final output of the model is a readout which providesinformation on ten effective alternatives. First, it lists
the number oi each device that is needed to meet the training
requirements. Secondly, it shows the investment cost, opera-
tions and support costs, annual cost, and cumulative cost
for each year of the economic service life. The investment
cost and operation and support costs are shown in constant
dollars while the annual and cumulative costs are shown in
inflated/discounted dollars. Thirdly, a matrix is depicted
outlining for each task which device would best meet the
training requirements. In other words, it ranks the devices
in order of capability. Finally, a matrix is depicted which
shows the number of hours that a student should use each
training device for each particular task.
Although the ANSER model offers sufficient promise as
a true cost-effectiveness model, it does have limitations.
The model does not consider the learning curve; theory. That
is, the model assumes that successive increments in device
use are reflected by corresponding incremcents in training
effectiveness. A second limitation is that the model is not
109
-m- -"

sensitive to significant variations in the input data [Ref.
1131. Presently the Tactical Air Wacfare Center at Eglin
AFB, Florida is working with the model to correct these
limitations. Their results will be of significant importance
to any department involved with flight simulator procurement
and utilization.
F. THE COST-EFFECTIVENESS OF USING SIMULATORS
IN THE PILOT SELECTION PROCESS
In the past, using flight simulators as a step in the
screening process iZor officers to be accepted to undergrad-
uate pillot training has not been of significant importance
because of the abundant supply of qualified applicants and
the relatively low training costs; however, with the higher
fuel costs and tne sophistication of current aircraft weapons
systems, it is very critical that the personnel that are
selected have the highest probability for successful comple-I
tion of the flight program. Objective data obtained by using
a flight simulator could provide early identification of
pilot candidates that are likely to attrite and improve the
method by which pilotc are selected for different aircraft
such as fighters, transport, or helicopters.
The Royal Air Force has completed an extensive analysis
in using a simulator test as a criterion for pilot selection.
After a four-day instruction period in basic instrument fly-
ing and use and interpretation of radio navigation aids, the
student pilots flew a predetermined routeto include take-off
110

and climb to altitude, 'Level, climbing, and descending turns,
use of navigational aids, and approach to landing. The two
main sources of data were the instructor13 assessment and
objective measures of performance. Correlations of .6 to .8
were obtained between the objective scores and the simulator
instructor's assessments. In addition, the biserial correla-
tion of the objective scores with the criterion of pass/fail
in flying training was approximately .7 [Ref. 1141.
Although the flight simulator in th-.. Royal Air Force
analysis was shown to be ai good predictor of success or fail-
ure in flight training, there were certain costs which accrued
in the process. The attrition rate for trainees entering
flight school decreased, but the introduction of the simulator
into the selection process initiated a new attrition point,
that is, the trainees who failed the simulator test. Overall,
this could result in a lower number of trainees completing
the program, creating manpower shortages for front-line
squadrons. in order to c~vercome this problem, the input
must be larger in order to maintain a fixed output. In other
words, low attrition rates can be achieved by using simulator
testing; however, for a fixed output, the cost savings assoc-
iated with this reduced attrition may be offset by an increase
in recruiting and testing costs [Ref. 115].
There are at least two models which have been developedI
to assist the decision maker in determining the optimal attri-
tion rate f or the simulator. These models are the Recruitment,

Selection, &:,d Training (RESET) cost model developed by
L. V. Bennett and H. C. Partridge (1976), and the "CAPER"model developed by W. A. Souls of the Navy Personnel Researcht
and Development Laboratory. By applying realistic costt
values to the model, it is possible to calculate: (1) the
cost savings resultiaig from lowered attrition rates and
course sizes in training; and (2) the increas"ed costs of
selection resulting from larger intake numbers to meet a
fixed output [Ref. 116]. Figure V-6 shows the combinationof these two costs as a U-shaped function. The lowest point
on the curve represents the most cost-effective attrition
rate for the simulator selection test. The x-axis represents
a base rate which is the cost of selection and training prior
to ile simulator system, and the Y-axis shows marginal costs
from the base rate as a function of the attrition rate. The
figure shows that the maximum cost savings is at a point
where the simulator attrition rate is 40 percent to 50 per-
cent, resulting in a cost savings of approximately 300,000
British pounds (Ref. 117].
Finally, the Royal Air Force analyzed thoroughly the
positiLoning of the simulator test in the complete training
process. It was determined that the most cost-effective
point to apply the simulator test was after the existing
selection tests as it was the most expensive test to admin-
ister. This allowed large numbers of the applicant popula~-
tion to be screened out with lower costs validity tests
before using the simulator [Ref. 118].
112

=x
L) V
4A 0 b
I-z0 0 -
LU ftL"
= CD
ui 0
0U-Z 0c
kn 0
V) -
SIS03 0 VI3A
'11

Within tLe present aviation selection system used by
the Navy, all pilot candidates are selected on the basis of
performance in written examinations. The written selection
tests include the Academic Qualification Test, Mechanical
Comprehension Test, Spatial Apperception Test, and Biograph-
ical Inventory. This battery of tests is followed by an
extensive flight physical and a preflight school before
flight training. This system has been basically unchanged
since World War II; however, the Navy is presently evaluating
a system entitled the D)ynamic Naval Aviation Selection Test-I
ing and Evaluation System (DYNASTES). DYNASTES is a battery
of five tests which measures performance in the followinvj
areas: complex psychomotor coordination, divided attention,
selective attention, motion reactivity, and vehicular control.
Divided attention using the Integrated Multi-Task Psychomotor
and Cognitive Testing System (IMPACT) and vehicular control.
using the Naval Automated Pilot Aptitude Measurement System
(NAPAMS) are completed on a computer system consisting of a
PDP-11/34 Central Processing Unit, a VT-il Graphic Display,
an RX02 Duel Floppy Disk, and an Audio Visual Module.
The pass-through Validation is being, conducted at the
present time with 400 subjects undergoing the testing pro-
cedure. Eight students will receive two hours of testing
a day for five consecutive days. This process will be
repeated every week for 50 weeks. The validation began in
October 1980.
114

It is estimated that the annual cost savings for a 5 per-
*cent reduction in attrition (flight hours only) would be $3.0
million. If one considers that the system has a research,
development, training, and evaluation cost, plus first-year
implementation cost of $1.3 million, this allows amortization
within the first year and a resultant savings of $1.7 million.
The importance of the DYNASTES program is effectively
emphasized when studying the cost figures associated with
Naval Air Training Command attrition rates for FY 79 in Table
V-3.
TABLE V-3
NAVAL AIR TRAINING COSTS ASSOCIATED WITH ATTRITION(JET TRAINING)
(Source: Chief of Naval Education and Training, Code N-43A)
Number of Cost per
Stage Attrites Attrite Total
Primary Stage 171 $ 36,453.97 $6,233,628.87
Basic Stage 43 155,238.37 6,675,249.91
Advanced Stage 28 407,507.40 11,410,_207.20
TOTAL COST - $24,319,085.98
[Ref. 1191
G. SUMMARY
Section V has outlined different methods used by the
military services to measure cost-effectiveness of flight
simulators. Of particular importance was the method by which
microeconomic theory could be used to determine the optimum
115

mxof time that shouJ.., be spent in the airplane and simu-
lator in order to attain a fixed level of effectiveness at
the lowest cost.
Section V also described the results of an analysij con-
ducted by the Royal Air Force when using flight simulators
as a screening point in its pilot selection process.
Finally, Section V described a program which is currently
undergoing evaluation by the U.S. Navy to reduce the student
pil.ot attrition rate by having the trainee complete a more
demanding screening process to include measuring his or herI
ability in operating a simplified flight simulator.
Section VI will discuss this author's conclusions and
recommendations concerning the training effectiveness and
cost-effectiveness of military flight simulators.
116

VI. SUMMARY, CONCLUSIONS,-ANT) RECOMMENDATIONS
A. SUMMARY
The purpose of this thesis was to conduct research in
the area of visual flight simulation and determine whether
or not systems that exist provide both training and cost
effectiveness.
Section II provided an overview o'f flight simulation to
include the historical development ol flight simulation, a
description of visual flight simulation methodology such as
model boards, computer gen~erated imagery, and computer ani-
mated photographic terrain view, and a description of military
flight simulators that are presently being used in the train-
ing syllabi for Air Force and Navy aircrait.
Section III examined the use of flight simulators withinI
the commercial aviation industry. Methods by which the major
airline companies used the systems to provide training effec-
tiveness were outlined, as well as cost savings realized by
major carriers such as American and Delta Airlines. A major
point disclosed in Section III was the improvement in standard-
ization of training and economies of scale gained by the
airlines centralizing their respective training centers.
Section IV evaluated the effectiveness of simulator
systems in training military pilots. It outlined factors such
as design of simulator systems, training programs, personnel,
117
-
and expectations, discussing how each factor could effect
the implementation of simulator systems into the military
training concept. Hypothesis testing was completed on data
that were gathered from air-to-ground training, air-to-air
training, and night carrier landing training. All itudies
examined supported the fact that flight simulators did pro-
vide effective training.
Finally, Section V discussed the cost-effectiveness of
military flight simulators. A cost-bienefit analysis used by
the Navy in the prccurement process was applied to Air Force
cost data with the result being that investment costs were
amortized in slightly less than three years. Microeconomic
theory was applied in determining the optimum mix of training
hours between the airplane and simulator that could be utilized
in meeting a predetermined fixed effectiveness at the minimum
cost. A CTEA analysis conducted by the Army for the AH-1i
"Cobra" helicopter was outlined using task training analysis,
cost analysis, and task priority. The model developed by
Analytic Services (ANSER MODEL) to determine cost-effeTtiveness
of aircrew training devices was described with the important
point being made that aircrew training devices included the
aircraft, simulators, media, and classroom instruction. The
model used input data of training requirements, device training
capabilities, and pertinent costs to determine the optimum mix
of training devices to meet the training requirements. The
model would provide ten effective alternatives with their
respective life-cycle costs.
118

The last part of Section V explained an analysis con-ducted by the Royal Air Force tc, use flight simulators in
the process of selecting personnel for pilot training, and
a procedure, DYNASTES, which is currently being validated by
the Navy in their pilot selection process. A figure was used
to depict the possible cost-tradeoffs of using a simulator in
the selection process, pointing out the importance of an
accurate attrition rate from the simulator test in order to
preclude the possibility of having the input costs, such as
recruitment and selection, be greater than the cost savings
of training fewer pilots in the aircraft.
B. CONCLUSIONS
1. Flight Simulators Improve Training Effectiveness
This thesis has determined that flight simulators
can improve the training effectiveness of military pilots.
The major problewm is convincing the pilot that the system
will not be used as a substitute for actual aircraft time.
Even though state-of-the-art technology provides accurate
"realism," the typical military pilot needs that valuable
time in the aircraft to perfect his flying techniques, thereby
increasing the probability of success in an engagement with
the enemy. There must be a minimum monthly flight hour
requirement set for military pilots so that his or Ler flying
ability can be maintained. Even though the cost associated
with this minimum flight time can be quite significant, by
119
" 'T..
Iusing flight simulation in the training process to practice
a particular maneuver or whatever Lark is required, the pilot
is able to use the actual aircraft time more effectively.
2. Flight Simulators Can Increase Long-Run Cost Savings
It is this author's opinion that short-run cost sav-
ings associated with flight time substitution has been the
key factor in determining whether or not funds are authorized
for flight simulator procurement. Using the simulator to
practice air-to-ground ordnance delivery or firing air-to-air
missiles can result in a long-run cost savings because the
pilots would not require as much practice ordnance in order
to attain a certain level of effectiveness. More importantly,
there can be a greater cost savings associated with accident
reduction as a result of the simulator/aircraft training
combination because this process has been shown to produce
better qualified aviators.
3. The Cost-Effectiveness of Flight Simulat!.onCan Be Improved
Determining the least cost mix of aircraft and simu-
lator time in order to attain a predetermined effectiveness
can significantly improve the cost-effectiveness of the
system. Objective data cen develop both the effectiveness
isoquants and the cost constraints, allowing the user of the
system to apply the microeconomic theory that was outlined
in this thesis.
120

4. All Levels of Command Must Understand and
Support the Flight Simulation System
This conclusion is of primary importance, especially
for the fleet user. Nothing is more detrimental to the
training process than to have an instructor not understand
the capabilities and/or limitations of the system or not
believe the system can improve the trainee's ability. It is
imperative that flight simulation be eagerly accepted as an
integral part of the training process; otherwise, utilization
rates will be low and costs will be high.
C. RECOMMENDATIONS
Since the Marine Corps is on the threshold of procuring
sophisticated flight simulators for both the F/A-18 and the
AV-8B, it is recommended that careful study be given to the
following areas of this thesis:
1. The factors influencing training effectiveness out-
lined in Section IV. It is imperative that training syllabi
be developed that allow an interface between the simulator
and the aircraft. and that the personnel operating the console
of the simulator be professionally trained so that the systems
can function at maximum capability.2. The hypothesis testing completed in Section IV which
supported the fact that flight simulators can provide excellent
training in different flying environments.
3. The microeconomic theory in Section V which could
be applied to pilots using the F/A-18 and AV-8B, allowing
121
...................

effectiveness isoquants to be developed for all tasks that
could be learned in either the simulator or the aircraft.
4. The ANSER MODEL, outlined in Section V, to determini
whether or not it can be utilized by the Marine Corps in
future weapons systems procurement.
i
I
? 122
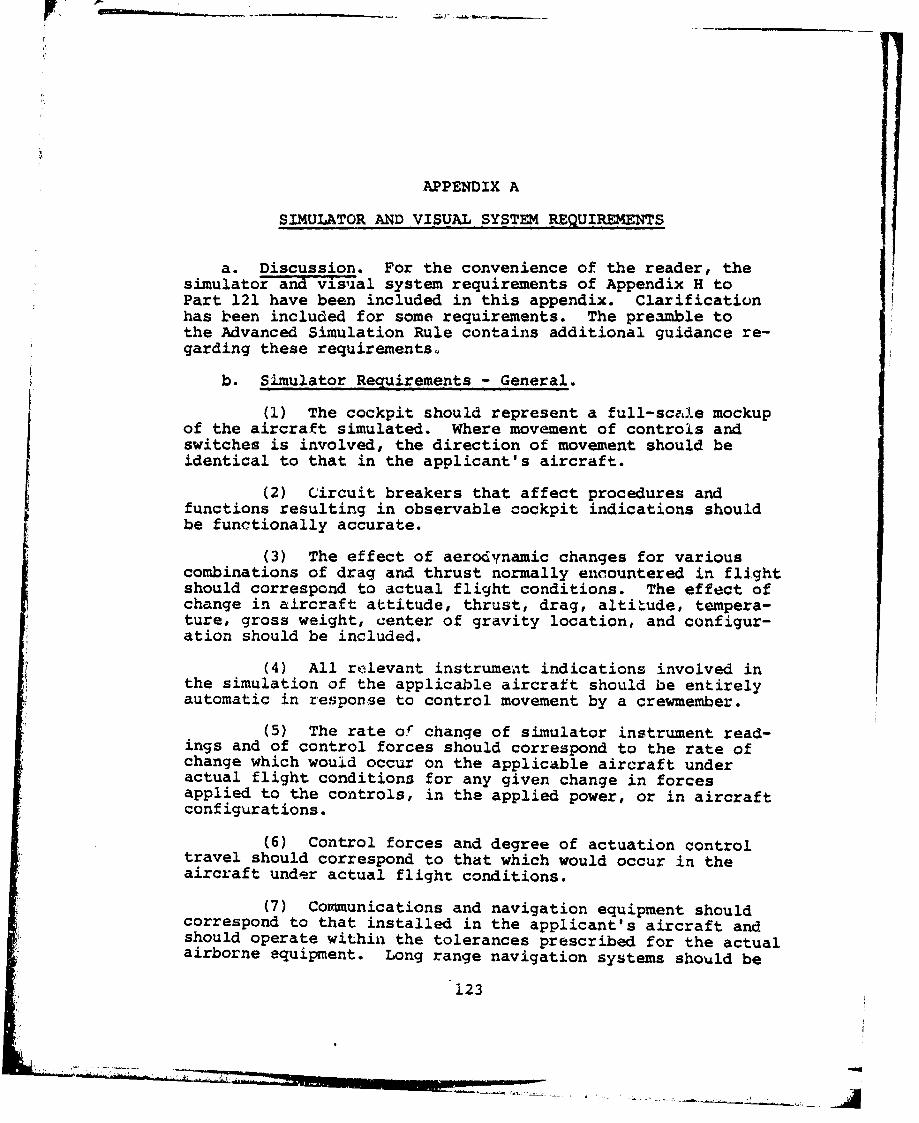
APPENDIX A
SIMULATOR AND VISUAL SYSTEM REQUIREMENTS
a. Discussion. For the convenience of the reader, thesimulator and visua system requirements of Appendix H toPart 121 have been included in this appendix. Clarificationhas been included for some requirements. The preamble tothe Advanced Simulation Rule contains additional guidance re-garding these requirements,,
b. Simulator Requirements - General.
(1) The cockpit should represent a full-scalte mockupof the aircraft simulated. Where movement of controls andswitches is involved, the direction of movement should beidentical to that in the applicant's aircraft.
(2) C~ircuit breakers that affect procedures andfunctions resulting in observable cockpit indications shouldbe functionally accurate.
(3) The effect of aerodynamic changes for variouscombinations of drag and thrust normally enc~ountered in flightshould correspond to actual flight conditions. The effect ofchange in aircraft attitude, thrust, drag, altitude, tempera-ture, gross weight, center of gravity location, and configur-ation should be included.
(4) All relevant instrumea't indications involved inthe simulation of the applicable aircraft should be entirelyautomatic in response to control movement by a crewmember.
(5) The rate of change of simulator instrument read-ings and of control forces should correspond to the rate ofchange which wouid occur on the applicable aircraft underactual flight conditions for any given change in forcesapplied to the controls, in the applied power, or in aircraftconfigurations.
(6) Control forces and degree of actuation controltravel should correspond to that which would occur in theaircraft under actual flight conditions.
(7) communications and navigation equipment shouldcorrespond to that installed in the applicant's aircraft andshould operate within the tolerances prescribed for the actualairborne equipment. Long range navigation systems should be
123

installed but need not be operative unless required by Part121, Appendix H.H
(8) In addition to the flight crewmeniber stations,there should be two suitable seat accomm~odations for theInstructor/Check Airman and FAA Inspector. Operators who Ihave the Check Airman/Instructor occupy a flightcrew positionseat need only provide one additiona~l observer seat. Theseseats should provide adequate vision to the pilot's paneland forward windows in visual system models. observer seatsneed not represent the aircraft seats.
(9) Simulator systems should simulate the applicableaircraft system operation, both on the ground and in flight.Major systems should be operative to the extent that normaloperating procedures, and abnormal and emergency proceduresincluded in the operator's programs can be accomplished.j
(10) An Instructor Control Console should be installedto enable the Instructor/Check Airman or FAA Inspector (whenappl.icable) to control the visual attachment (if installed)and insert abnormual or emergency conditions into the aircraftsystems.
c. Vis'ual Requirements - General.
(1) The visual scene should accurately portray theenvi.ronment equivalent to that which the pilot observes ont:he relat,ý simulator cockpit instrument display resultingfrom the manipulation of the controls and the effects ofvarying wind conditions.
(2) The visual display may be either a monoview orduoview display. If a monoview display is used, it should becapable of transfer of display at either pilot station.
(3). The scene should comprise the airfield, surround-ing area, airport ramp and taxiway.
(4) Representations of buildings or other outstandingfeatures should be suitably detailed to produce a realisticeffect on picture presentation.
5)Functional airfield and approach lighting shouldbe representative of the runway depicted with intensitycontrols to vary degree of lightness. Approach and runway,and lighting intensities should be independently variable.Realistic colors for approach, and runway lighting are re-quired. Computer-generated image (CGI) systems should havethe capability of portraying runway texture or surface.
124

(6) The aircraft landing lights should be operational.
(7) The optical system for Phase I and less sophis-ticated simulators should be capable of providing at least a450 field of vision. Focus should be automatic in order tokeep at optimum that part of the picture which is signifi-cant to the pilot. A minimum of 750 horizontally and 300vertically is required for Phase II and III visual systems.
(8) An instructor's control should be provided toallow control of all aspects of the visual system; i.e.,cloudbase, visibility in miles and feet, airport selection,environmental lighting controls, VASI, etc.
(9) Visual systems approved for instrument takeoffsand/or instrument approach procedures should have a means ofreducing visibility to reasonably simulate the appropriateweather conditions.
(10) Operators possessing visual systems that do notmeet all the requirements contained in this paragraph andhave received prior approval will have "grandfather rights."These systems will be eligible for continued approval for allmaneuvers originilly approved provided they are maintainedto the level of acceptability demonstrated at originalapproval. The "grandfather rights" apply only to the originaloperator and are not transferable.
d. Simulator Requirements - Phase I.
(1) Aerodynamic programming to include:
(a) Ground effect--for example, roundout, flare,and touchdown. This requires data on lift, drag, and pitchingmoment in ground effect.
(b) Ground reaction--reaction of the airplaneupon contact with the runway during landing to include strutdeflections, tire friction, and side forces.
(c) Ground handling characteristics--steeringinputs to include crosswind, braking, thrust reversing,deceleration, and turning radius.
(2) Minimum of 3-axis freedom of motion systems.
(3) Phase I landing maneuver test guide to verifysimulator data with actual airplane flight test data, andprovide simulator performance tests for initial approval.
(4) Multichannel recorders capable of recordingPhase I performance tests.
125

- • •.. . . . . . . ,,.• •. ::. - -
e. Visual Requirements - Phase I.
(1) Visual system compatibility with aerodynamicprogramming.
(2) Visual system response time from pilot controlinput to visual system output shall not exceed 300 milli-seconds more than the movement of the airplane to a similarinput. Visual system response time is defined as the comple-tion of the visual display scan of the first video fieldcontaining different information resulting from an abruptcontrol input.
(3) A means of recording the visual response timefor comparison with airplane data.
(4) Visual cues to assess sink rate and depth per-ception during landings.
(5) Visual scene to instrument correlation topreclude perceptible lags.
f. Simulator Requirements - Phase II.
(1) Representative crosswind and three-dimensionalwindshear dynamics based on airplane related data.
(2) Representative stopping and directional controlforces for at least the following runway conditions based onairplane related data:
(a) Dry.
(b) Wet.
(c) Icy.
(d) Patchy wet.
(e) Patchy icy.
(f) Wet on rubber residue in touchdown zone.
(3) Representative brake and tire failure dynamics(including antiskid) and decreased brake efficiency due tohigh brake temperatures based on airplane related data.These representations should be realistic enough to causepilot identification of the problem and implementation ofappropriate procedures. Simulator pitch, side loading anddirectional control characteristicn should be representativeof the aircraft.
126
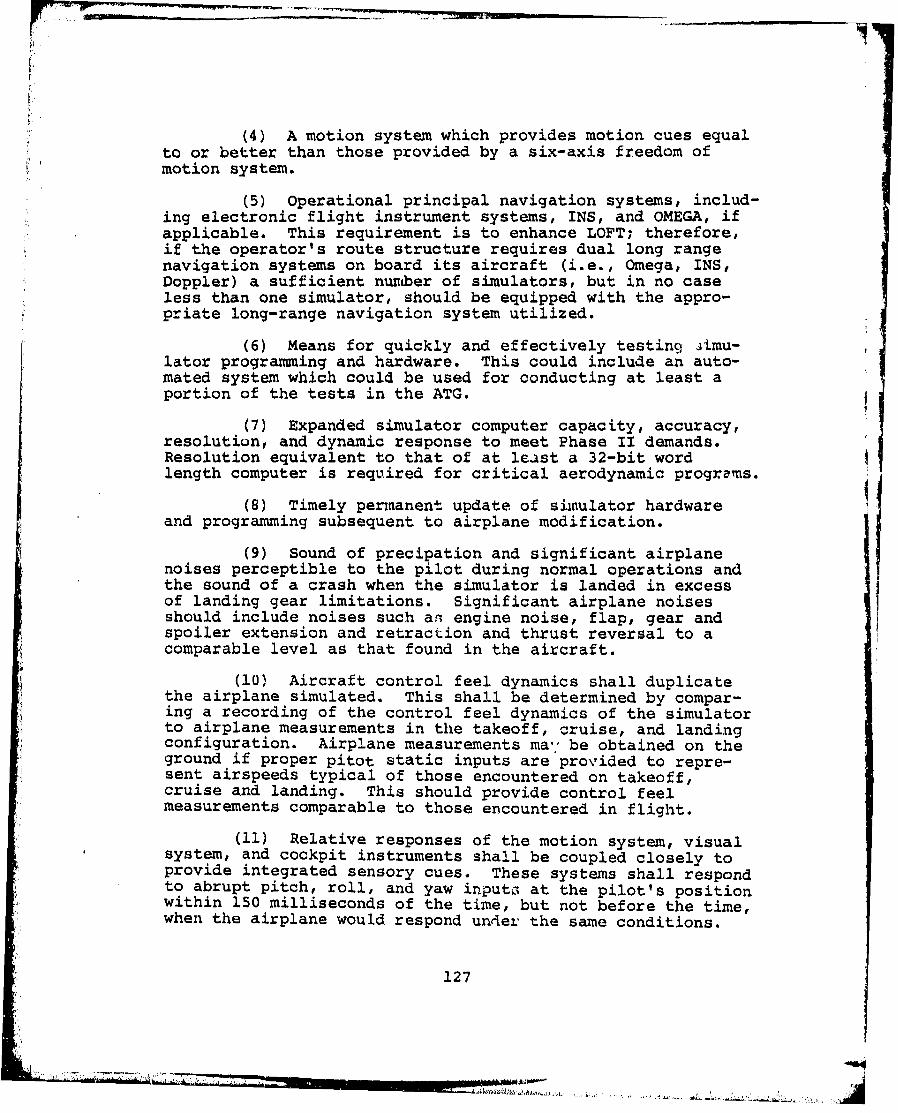
(4) A motion system which provides motion cues equalto or better than those provided by a six-axis freedom ofmotion system.
(5) operational principal navigation systems, includ-ing electronic flight instrument systems, INS, and OMEGA, ifapplicable. This requirement is to enhance LOFT; therefore,if the operator's route structure requires dual long rangenavigation systems on board its aircraft (i.e., Omega, INS,Doppler) a sufficient number of simulators, but in no caseless than one simulator, should be equipped with the appro-priate long-range navigation system utilized.
(6) Means for quickly and effectively testing ALmu-lator programming and hardware. This could include an auto-mated system which could be used for conducting at least aportion of the tests in the ATG.
(7) Expanded simulator computer capacity, accuracy,resolution, and dynamic response to meet Phase Il demands.Resolution equivalent to that of at lea~st a 32-bit wordlength computer is required for critical aerodynamic programs.
(8) Timely permanent update of simulator hardwareand programming subsequent to airplane modification.
(9) Sound of precipation and significant airplaneInoises perceptible to the pilot during normal operations andthe sound of a crash when the simulator is landed in excessof landing gear limitations. Significant airplane noisesshould include noises such an~ engine noise, flap, gear andspoiler extension and retraction and thrust reversal to acomparable level as that found in the aircraft.
(10) Aircraft control feel dynamics shall duplicatethe airplane simulated. This shall be determined by compar-ing a recording of the control feel dynamics of the simulatorto airplane measurements in the takeoff, cruise, and landingconfiguration. Airplane measurements ma", be obtained on theground if proper pitot static inputs are provided to repre-sent airspeeds typical of those encountered on takeoff,cruise and landing. This should provide control feelmeasurements comparable to those encountered in flight.
(11) Relative responses of the motion system, visualsystem, and cockpit instruments shall be coupled closely toprovide integrated sensory cues. These systems shall respondto abrupt pitch, roll, and yaw inputo at the pilot's position
-J within 150 milliseconds of the time, but not before the time,when the airplane would respond under the same conditions.
127

Visual scene changes from steady state disturbance shall notoccur before the resultant motion onset but within the systemdynamic response tolerance of 150 milliseconds. The test todetermine compliance with these requirements shall includesimultaneously recording the analog output from the pilot's
control column and rudders, the output from an accelerometerIattached to the motion system platform located at an acceptablelocation near the pilots' seats, the output signal to thevisual system display (including visual system analog delays),and the output signal to the pilot's attitude indicator or anequivalent test approved by the Administrator. The testresults in a comparison of a recording of the simulator'sresponse to actual airplane response data in the takeoff,cruise, and landing configuration.
g. Visual Requirements - Phase II.
(1) Dusk and night visual scenes with at least threespecific airport representations, including a capability ofat least 10 levels of occulting, general terrain character-istics, and significant landmarks. It is not necessary foreach airport scene to contain 10 levels of occulting butthere should be a means of demonstrating that the visualsystem has that capability.
(2) Radio navigation aids properly oriented to theairport runway layout.
(3) -Test procedures to quickly confirm visual systemcolor, RNYR, focus, intensity, level horizon, and attitude ascompared to the simulator attitude indicator.
(4) For the approach and landing phase of flight, atand below an altitude of 2,000 feet height above the airport(HAA) and within a radius of 10 miles from the airport,weather representations including the following:
(a) Variable cloud density.
(b) Partial obscuration of ground scenes; thatis, the effect of a scattered to broken cloud deck.
(c) Gradual break out.
(d) Patchy fog.
(e) The effect of fog on airport lighting.
Mf Category II and Ill weather conditions.These representations are required only if the operator isauthorized to operate under Category II or III conditions.
128
(t7

r7-~ -
(5) Continuous minimum visual field of view of 750horizontal and 300 vertical per pilot seat. Visual gapsshall occur only as they would in the airplane simulated oras required by visual system hardware. Both pilot seatvisual systems shall be able to be operated simultaneously.
(6) Capability to present ground and air hazardssuch as another airplane c:ossing the active runway or con-verging airborne traffic.
h. Simulator Requirements - Phase III.
(1) Characteristic buffet motions that; result fromoperation of the airplane (for example, high-speed buffet,extended landing gear, flaps, nose-wheel scuffing, stall)which can be sensed at the flight deck. The simulator mustbe programmed and instrumented in such a manner that thecharacteristic buffet modes can be measured and compared toairplane data. Airplane data are also required to defineflight deck motions when the airplane is subjected to atmos-pheric disturbances such as rough air and cobblestone turbulence.General piirpose disturbance models that approximate demonstrableflight test data are acceptable.
(2) Aerodynamic modeling for aircraft for which anoriginal type certificate is issued after June 1, 1980,including low-altitude, level-flight ground effect, macheffect at high altitude, effects of airframe icing, normaland reverse dynamic thrust effect on control surfaces, aero-elastic representations, and representations of nonlinearitiesdue to side slip based on airplane flight test data providedby the manufacturer.
(3) Realistic amplitude and frequency of cockpitnoises and sounds, including precipitation static and engineand airframe sounds. The sounds shall be coordinated withthe weather representations required in Phase III visualrequirement No. 3.
(4) Self-testing for simulator hardware and program-ming to determine compliance with Phase I, II, and III simu-lator requirements.
(5) Diagnostic analysis printout of simulator mal-functions sufficient to determine M1EL compliance. Theseprintouts shall be retaiaed by the operator between recurring IFAA simulator evaluations as part of the daily discrepancylog required under 121.407(a) (5).
129

i. Visual Requirements -Phase 111.
(1) Daylight, dusk, and night visual scenes withsufficient scene content to recognize a specific airport,the terrain, and major landmarks around that airport and tosuccessfully accomplish a visual landing. The daylight visualscene must be part of a total daylight cockpit environmentwhich at least represents the amount of light in the cockpiton an overcast day. For the purpose of this rule, daylightvisual system is defined as a visual system capable of pro-ducing, as a minimum, full color presentations, scene contentcomparable in detail to that produced by 4,000 edges or lj0OOsurfaces for daylight and 4,000 light points for night and
dusk scenes, 6-foot lamnberts of light at the pilot's eye(highlight brightness), 3-arc minutes resolution for theIfield of view at the pilot's eye, and a display which is freeof apparent quantization and other distracting visual effectswhile th~e simulator is in motion. The simulation of cockpitambient lighting shall be dynamically consistent with thevisual scene displayed. For daylight scenes, such ambientIlighting shall neither "washout" the displayed visual scenenor fall below 5-foot l~aunberts of light as reflected from anapproach plate at knee height at the pilot's station and/or42-foot 'Lamberts of light as reflected from the pilot's face.
(2) Visual scenes portraying representative physicalrelationships which are known to cause landing illusions insome pilots, including short runway, landing over water,runway gradient, visual topographic features, and risingterrain.
(3) Special weather representations which include thesound, visual, and motion effects of entering light, medium,and heavy precipitation near a thunderstorm on takeoff,approach, and landin9jý at and below an altitude of 2,000 feetHAA and within a radius of 10 miles from the airport.
(4) Phase II visual requirements in daylight as wellas dusk and night representations.
(5) Wet and, if appropriate for the operator, snow-covered runway representations, including runway lightingeffects.
(6) Realistic color and directionality of airportlighting.
(7) Weather radar presentations in aircraft whereradar information is presented on the pilot's navigationinstruments.
130

LIST OF REFERENCES
1. "Marine Aviation 1980: Progress, Prodlems, and a Previewof the Future," Marine Corps Gazette, May 1980, p. 46.
2. Allen, John L., "The Coming Payoffs of Improved FlightSimulators," Commanders Digest, 29 July 1976, p. 2.
3. Appleyard, James C., "Military Simulators: A BillionDollar Npket," Military Electronics/Countermeasures,October l178, p. 12.
4. Ibid., p. 45.
"5. Rolfe, J.M., "Keeping Up on the Ground," AeronauticalJournal, July 1977, p. 2.81.
6. Ibid., p. 281.
7. Ibid., p. 282.
8. Ibid., p. 282.
9. P-3C Visual System for Device 2F87(F), MaintenanceInstructions, Volume 1, 1 March 1978, p. 1-1.
10. Ibid., p. 1-2.
11. Ibid., p. 1-5.12. Beardsley, H., "Advanced Simulation in Undergraduate
Pilot Training, Computer Image Generation," AFHRL-TR-75-59(V), November 1975, p. 61.
1.3. Ibid., p. 61.
14. Ibid., p. 61.
15. Ibid., p. 63.
16. Gum, D.R., Albery, W.B., Basinger, J.D., "AdvancedSimulation in Undergraduate Pilot Training, an Overview,"AFHRL-TR-75-59(l), December 1975, p. 20.
17. Ibid., p. 20.
131

18. Ibid., p. 22.
19. Ibid., p. 22.
20. Ibid., p. 22.
21. Beardsley, H., "Advanced Simulation in UndergraduatePilot Training, Computer Image Generation," AFHRL-TR-75-59(V), November 1975, p. 45.
22. Ibid., p. 58.
23. Ibid., p. 60.
24. Ibid., p. 19.
25. McCulloch, G.V., "United Airlines' Experience withComputer Generated Visual Systems," Navigation: Journalof the Institute of Navigation, Winter 1977-78, p. 356.
26. Personal conversation with Dr. Stephen R. Osborne,Seville Research Corporation, Phoenix, Arizona, 14 Feb-ruary 1981.
27. "Transfer of Training Effectiveness: A7E Night CarrierLanding Trainer (NCLT) Device 2F103, Technical Report:NAVTRAEQUIPCEN 74-C-0079-1, Dunlap and Associates, Inc.,Western Division, LaJolla, California, August 1976, p. 12.
28. Ibid., p. 13. j29. Ibid., p. 14.
30. Ibid., p. 14.
31. A7E Weapons System Trainer Handout, G76-515, VoughtCorporation, Systems Division, Dallas, Texas, p. 1.
32. Ibid., p. 1.
33. Ibid., p. 2.
34. Gum, D.R., Albery, W.B., Basinger, J.D., "AdvancedSimulation in Undergraduate Pilot Training, an Overview,"AFHRL-TR-75-59(i), December 1975, p. 1.
35. Ibid., p. 5.
36. Ibid., p. 9.
37. "Total Simulation Crew Training Pushed," Aviation Weekand Space Technology, VIII, p. 191, 12 November 1979.
132

38. Ropelewski, R.R., "Simulators to Be Used in Crash Study,"Aviation Week and Space Technology, V.110, p. 19,4 June 1979.
39. Elson, S.M., "Simulators Slash Pilot Transition Time,"
Aviation Week and Space Technology, V. 105, p. 59,4 October 1976,
40. ?ersonal conversation with Mr. Paul Bacon, EngineeringTest Pilot for Flight Simulator Services, a major airlinecompany, 23 February 1981.
41. Lecture notes from presentation by the Society ofExperimental Test Pilots, Naval Postgraduate School,27 February 1981.
42. "Pilot Transitions Tested Using Simulators Alone,"Aviation Week and Space Technology, V. 108, p. 177,13 March 1978.
43. American Airlines letter to Author, subject: ThesisResearch Information, ll.March.1981.
44. "Total Simulation Crew Training Pushed," Aviation Weekand Space Technology, V. II, p. 1!1, 12 November 1979.
45. Stein, K.J., "Near-Term Goal of Total Simulation TrainingSeen," Aviation Week and Space Technology,9 March-19 8. ..
46. Velupillai, D., "Airliner Simulator Census," Flight
International, p. 570, 23 February 1980.
47. Ibid., p. 572.
48. Ibid., p. 572.
49. Ibid., p. 573.
50. Ibid., p. 573.
51. Ibid., p. 573.52. Ibid., p. 573.
53. "Requalification Takeoff and Landing Study," AmericanAirlines Flight Training Academy, p. 5-12, 17 February1976.
54. Ibid., p. 18-19.
133
___________________
"7"
55. "Use of Visual Simulation for the Training and Checking
I,, t~lof the Vl Engine Cut Maneuver," American Airlines FlightTraining Academy, p. 3, 1 February 1972.
S56. Ibid., p. 4-13.
57. "Maneuvering to a Landing Simulating Failure of 50% ofthe Available Power Plants," Industry Training ManeuverStudy Group, p. 7, 23 February 1968.
58. Wagg, W.L., "Recent Studies of Simulation TrainingEffectiveness," Society of Automotive Engineers TechnicalPaper Series, Aerospace Meeting, Town and Country, SanDiego, California, 27-30 November 1978, p. 2.
59. Diehl, A.E., Ryan, L.E., "Current Simulator SubstitutionPractices in Flight Training," Training Analysis andEvaluation Group, Report Number 43, February 1977,p. 9-10.
60. Orlansky, J., String, J., "Cost Effectiveness of FlightSimulators for Military Training," Vol. 1, August 1977,p. 29.
61. Ibid., p. 37.
62. Novitzki, J.E., "Realistic Trainers Help ... to a Point,"Proceedings, April 1980, p. 107-108.
63. Gray, T.H., Fuller, R.R., "Effects of Simulator Trainingand Platform Motion on Air-to-Surface Weapons DeliveryTraining," AFHRL-TR-77-29, July 1977, p. 7-17.
64. Caro, P.W., "Some Factors Influencing Transfer of Simu-lator Training," Royal Aeronautical Society Symposium,8 April 1976, p. 9.
65. Ibid., p. 10.
66. Ibid., p. 10.
67. Ibid., p. 11.
68. Ibid., p. 11.
69. Ibid., p. 13.
70. Ibid., p. 14-15.
71. Weyer, D.C., Fuller, J.H., "Evaluation of T-371FS Syllabiin the ASPT," AFHRL-TR-77-61, December 1977, p. 10.
134
Ji

72. Telephone conversation with Major M. Moorman, USAF,Chief, Simulator Training Division, Instruments FlightSimulator, Williams AFB, Arizona, 8 April 1581.
73. Gray, T.H., Chun, E.K., "Advanced Flight Simulator:Utilization in A-10 Conversion and Air-to-Surface AttackTraining," AFHRL-TR-80-20, January 1981, p. 8.
74. Ibid., p. 9.
75. Ibid., p. 11.
76. Ibid., p. 14.
77. Ibid., p. 17.
78. Ibid., p. 17-18.
79. Moore, S.B., Madison, W.G., Sepp, G.D., "Air CombatTraining: Good Stick Index Validation," AFHRL-TR-79-15,June 1979, p. 14.
80. Ibid., p. 2.
81. Ibid., p. 23.
82. Meshier, C.W., Butler, G.J., "Flight Simulation/GuidanceSystems Simulation," Advisory Group for AerospaceResearch and Development Conference Proceedings No. 198,p. 23-2.
83. Ibid., p. 23-1.
84. Brictson, C.A., Burger, W.J., "Transfer of TrainingEffectiveness: A7E Night Carrier Landing Trainer (NCLT),Device 2F103," Technical Report: Naval Training Equip-ment Center 74-C-0079-1, August 1976, p. 15-16.
85. Ibid., p. 18.
86. Ibid., p. 19.
87. Ibid., p. 23.
88. Ibid., p. 58.
89. Ibid., p. 26.
90. Ibid., p. 48. 4
135
- -' u .. . . .

91. Personal conversation with LCDR G.R. Root, USN, AttackSquadron 122, U.S. Naval Air Station, Lemoore, California,6 February 1981.
92. "Simulators, Satellites," Research and Development News,Navy Times, 27 April 1981, p. 42.
93. Orlansky, J., String, J., "Cost-Effectiveness of "lightSimulators for Military Training," Interservice/IndustryTraining Equipment Conference Proceedings, 27-29 November1979, p. 12.
94. "Cost-Effectiveness Analysis, Procurement to ProvideCH-46E Aircrew Traiaing, 2FI17 OFT w/Visual," Naval AirSystems Command, Washington, D.C., 5 January 1977, i. 1-3.
95. Safety Investigating and Reporting, U.S. Air Force Mishaps,AFR 127-4, Tabli- 2-1, p. 2-9, 18 January 1980.
96. Ferguson, C.E. and Maurice, S.C., Economic Analysis,p. 174-175, Irwin, 1974.
97. Ibid., p. 185.
98. Orlansky, J., String, J., "Cost-Effectiveness of FlightSimulators for Military Training," Vol. 1, August 19"7,p. 46.
99. Hopkins, F.C., "Cost and Training Effectiveness Analysisof the AH-l Flight Simulator (AH-lFS), Directorate ofTraining Developments, U.S. Army Aviation Center, November1979, p. 16.
100, Ibid., p. 21-21.
101. Ibid., p. 22-23.
102. Ibid., p. 27.
103. Ibid., p. 36-40.
104. Seville Research Corporation, Handbook for OperationalTest and Evaluation (OT and E) of the Training Uti1ityof Air Force Aircrew T:•aining Devices, Vol. IV (draft),W.V. Hagin, and others, p. 3-2, 1 January 1981.
105. Ibid., p. 3-11.
106. Ibid., p. 3-12.
1364i
107. Marcus, G.H., and Patterson, J.T., "A Cost-Effective-ness Methodology for Aircrew Training Devices,"Interservice/Industry Training Equiment ConferenceProceedings, 27-29 November 1979, p. 331.
108. Ibid., p. 332.
109. Ibid., p. 333-334.
110. Ibid., p. 334.
111. Ibid., p. 334.
112. Ibid., p. 335,
113. Seville Research Corporation, Handbook for OperationalTest and Evaluation (OT and E) of the Training Utilityof Air Force Aircrew Training Devices, Vol. IV, (draft),W.V. Hagin, and others, p. 3-17, 1 January 1981.
114. Lidderdale, I.G., and Bennett, L.V., "A Cost-BenefitAnalysis of a Simulator Test for Pilot Selection in theRoyal Air Force," Human Operation and SimulationSymposium, Collected Papers, March 1977, p. 26.
115. Ibid., p. 27.
116. Ibid., p. 28.
117. Ibid., p. 28.
118. Ibid., p. 29.
119. Personal correspondence with CDR N.R. Green, Chief ofNaval Education and Training, Code N-43A, dated 2 April1981.
13
•i 137j

INITIAL DISTRIBUTION LIST
No. Copies
1. Defense Technical Information Center 2Cameron StationAlexandria, Virginia 22314
2. Library, Code 0142 2Naval Postgraduate SchoolMonterey, California 93940
3. Department Chairman, Code 54 1Department of Administrative SciencesNaval Postgraduate SchoolMonterey, California 93940
4. LtCol W. H. Skierkowski, Code 54 Zs 2Department of Administrative SciencesNaval Postgraduate SchoolMonterey, California 93940
5. Prof. D. C. Boger, Code 54 Bk 1Department of Administrative SciencesNaval Postgraduate SchoolMonterey, California 93940
6. Defense Logistics Studies Information Exchange IU.S. Army Logistics Management CenterFort Lee, Virginia 23801
7. Col. A. Castalano 1Marine Corps Liaison OfficerNaval Training Equipment CenterOrlando, Florida 32813
8. i/Lt Carl Bodenschatz, USAF 1U.S. Air Force Tactical Air Warfare Center/TNTEglin AFB, Florida 32542
9. Mr. Larry Lanchoney 1Naval Training Equipment Center, Code 81AOrlando, Florida 32813
10. Maj. Bryan O'Connor, USMC 3Code CB, Johnson Space CenterHouston, Texas 77058
13• 138

11. Dr. L. E. RyanNaval Training Equipment Center, Code N-82Orlando, Florida 32813
12. Delta Airlines, IncorporatedAttn: Captain W. R. JonesContinental Colony ParkwayAtlanta, Georgia 30331
13. American Airlines Flight AcademyAttn: Mr. John HancockAmerican Airlines PlazaFort Worth, Texas 76125
14. Air Force Human Resources Laboratory 1Attn: Cdr. Larry Rasmussen, USNWilliams AFB, Arizona 85224
15. Maj. J. L. Reeve, USMC 11st Marine Aircraft WingFPO San Francisco, California 96602
16. Maj. John Lizzo, USMCVMAT-203, MAG-32MCAS Cherry Point, North Carolina 28533
17. Dr. Jesse Orlansky 1Science and Technology DivisionInstitute for Defense Analysis400 Army-Navy DriveArlington, Virginia 22202
18. Seville Research CorporationAttn: Dr. Stephen R. Osborne2121 S. Mill Avenue, Suite 202Tempe, Arizona 85282
19. Maj. George B. Mayer, Jr. 32226 Fox Horn RoadNew Bern, North Carolina 28560
20. Cdr. W. F. Moroney, Code 55 Mp 1,Operations Research DepartmentNaval Postgraduate SchoolMonterey, CA 93940
139