1st quarterly report 2018 -...
TRANSCRIPT
1st QUARTERLY2018
REPORT
ADDING VALUE
E-110, Khayaban-e-JinnahLahore Cantt., Pakistan
PABX : +92 42 111 328 462
Fax : +92 42 3662 1389
www.fatima-group.com


1
1
1st Qua
rterly
Repo
rt 20
18
Table of Content
Company Information ...........................................................................................................................02Directors’ Report to the Members ..........................................................................................................04
Separate Financial Statements
Condensed Interim Balance Sheet .........................................................................................................08Condensed Interim Profit and Loss Account .........................................................................................10Condensed Interim Statement of Comprehensive Income .....................................................................11Condensed Interim Statement of Changes in Equity .............................................................................12Condensed Interim Cash Flow Statement ..............................................................................................13Notes to and Forming Part of the Condensed Interim Financial Statements ..........................................14
Consolidated Financial Statements
Condensed Interim Consolidated Balance Sheet ...................................................................................26Condensed Interim Consolidated Profit and Loss Account....................................................................28Condensed Interim Consolidated Statement of Comprehensive Income ...............................................29Condensed Interim Consolidated Statement of Changes in Equity .......................................................30Condensed Interim Consolidated Cash Flow Statement ........................................................................31Notes to and Forming Part of the Condensed Consolidated Interim Financial Statements ....................32

2
2
Fatim
a Fert
ilizer
Comp
any L
imite
d
Company InformationBoard of Directors
Mr. Arif HabibChairman
Mr. Fawad Ahmed MukhtarChief Executive Officer
Mr. Fazal Ahmed SheikhDirector
Mr. Faisal Ahmed MukhtarDirector
Mr. M. Abad KhanDirector
Mr. Muhammad Kashif HabibDirector
Ms. Anja E. NielsenIndependent Director
Mr. Tariq JamaliNominee Director - NBP
Director Finance & Chief Financial Officer
Mr. Asad Murad
Company Secretary
Mr. Ausaf Ali Qureshi([email protected])
Key Management
Mr. Arif-ur-RehmanChief Manufacturing Officer
Mr. Rehman HanifPlant Manager
Ms. Sadia IrfanDirector HR
Mr. Iftikhar Mahmood BaigDirector Business Development
Mr. Ahsen-ud-DinDirector Technology Division
Sardar Naufil MahmudChief Information Officer
Mr. Salman AhmadHead of Internal Audit
Mr. Aftab KhanChief Supply Chain Officer
Mr. Faisal JamalCorporate HSE Manager
Audit Committee Members
Mr. Muhammad Kashif HabibChairman
Ms. Anja E. NielsenMember
Mr. Faisal Ahmed MukhtarMember
Mr. M. Abad KhanMember
Mr. Tariq JamaliMember
HR and Remuneration Committee Members
Mr. M. Abad KhanChairman
Ms. Anja E. NielsenMember
Mr. Muhammad Kashif HabibMember
Mr. Faisal Ahmed MukhtarMember

3
3
1st Qua
rterly
Repo
rt 20
18
Legal Advisors
M/s. Chima & Ibrahim Advocates1-A/245, Tufail Road, Lahore-Cantt
Auditors
M/s. Deloitte Yousuf AdilChartered Accountants, Lahore(A member firm of Deloitte Touche Tohmatsu Limited)134-A, Abu Bakar Block, New Garden Town, LahoreTel: +92 42 3591 3595-7+92 42 3544 0520Fax: +92 42 3544 0521Web: www.deloitte.com.pk
Registrar and Share Transfer Agent
Central Depository Company of Pakistan LimitedShare Registrar Department, CDC House, 99-B, Block ‘B’,S.M.C.H.S., Main Shahra-e-Faisal, Karachi-74400Tel: Customer Support Services(Toll Free) 0800-CDCPL (23275)Fax: (92-21) 3432 6053Email: [email protected]: www.cdcpakistan.com
Bankers
Allied Bank LimitedAskari Bank LimitedBank Alfalah LimitedBank Al-Habib LimitedBank Islami Pakistan LimitedCitibank N.A.Faysal Bank LimitedHabib Bank LimitedHabib Metropolitan Bank LimitedMCB Bank LimitedMeezan Bank LimitedNational Bank of PakistanSindh Bank LimitedSoneri Bank LimitedStandard Chartered Bank (Pakistan)
LimitedStandard Chartered Bank, United
Kingdom
Summit Bank LimitedThe Bank of KhyberThe Bank of PunjabUnited Bank Limited
Registered Office / Head Office
E-110, Khayaban-e-Jinnah, Lahore Cantt., PakistanUAN: 111-FATIMA (111-328-462)Fax: +92 42 3662 1389
Plant Site
Mukhtar Garh, Sadiqabad, Distt. Rahim Yar Khan, PakistanTel: 068 – 5951000Fax: 068 – 5951166

4
4
Fatim
a Fert
ilizer
Comp
any L
imite
d
Directors’ Report
Dear Shareholders,
On behalf of the Board of Directors of Fatima Fertilizer Company Limited, I am pleased to present the un-audited financial statements of the Company for the three months ended March 31, 2018 along with brief overview of operational and financial performance of the Company.
Market Overview - Global
With increase in indigenous production capacities of Urea, the global import demand is expected to falter. US, India, Mexico and Bolivia have already increased their production capacities as Nigeria, Russia and Indonesia follow suit. Regional deficits can however lead to trade opportunities in south Asia, sub-Saharan Africa and Europe, according to IFA.
DAP exports from Asia, especially China, remained limited during the first quarter of 2018. Producers focused on the domestic markets as global phosphates demand remained muted due to high prices.
Market Overview - Pakistan
Marking the closure of Rabi Season 2017-2018, the Urea industry grew by 2% as compared to the previous Rabi Season. In DAP, due to higher international prices, the total Rabi Season witnessed a decline of 12% as compared to the same period last year. However, the quarter saw a growth of 17%, with the total industry sales volume of 364 KT vs. 312 KT over the same period last year.
Company Performance:
Further bolstered by the export of 62.5 thousand MT of Urea, the Company posted its highest ever sales volumes for the first quarter of a year by a comfortable margin. Overall sale volume was 24% higher than the same period last year.
The continued sales momentum of CAN resulted in 24% higher sales volume over same period last year. The sale volume of NP remained almost same as last year. Sales of Urea increased by a hefty 50%, mainly due to the exports.
Sales Volume Jan to Mar - 2018 Jan to Mar - 2017Products (“000” Tons)Urea 149 99CAN 159 128NP 101 103Total 409 330

5
5
1st Qua
rterly
Repo
rt 20
18
Plants performance remained excellent as it achieved the highest ever production volume for the first quarter of a year. NP & CAN consistently operated above name plate capacities. Overall production volume was 4% higher than last year.
Jan to Mar - 2018 Jan to Mar - 2017Products (“000” Tons)Ammonia 145 144Nitric Acid 134 127Urea 116 122CAN 126 121NP 107 93
With improving market dynamics, the fertilizer prices continued to stabilize. Resultantly with 24% increase in sale volumes, the Company realized 38% growth in sales revenue. Improved plant efficiencies and efficient resource management created an even more profound impact on gross profit as it improved by 52% over last year comparable period. The total revenue generated amounted to PKR 11.4 Billion against PKR 8.3 billion while, Gross Profit margin for the period amounted to PKR 6.8 Billion against PKR 4.5 billion for the same period last year.
Resultantly, the Company has posted Profit before Tax of PKR 4.3 Billion and After Tax Profit of PKR 2.9 Billion higher by 49% and 27% respectively compared to PKR 2.9 billion and PKR 2.3 Billion posted for comparative period last year. Company’s earnings per share (EPS) stood at Rs 1.37 against Rs 1.08 in the corresponding period last year.
Financial Performance
Turnover Gross Profit EBITDA Profit after tax
Mar - 18 Mar - 17 Mar - 160
2,000
4,000
6,000
8,000
10,000
12,000
Fatima Plant Site achieved combined 43.38 million safe man-hours by March 31, 2018. Overall HSE performance remained excellent with Zero recordable injury. Compliance of stringent HSE systems in line with Dupont PSM model and OSHA’s guidelines is paying dividends with respect to safe and sustainable operations.

6
6
Fatim
a Fert
ilizer
Comp
any L
imite
d
Consolidated Financial Results
Fatimafert (FF) remained shut down during the quarter due to non availability of gas at viable rates. Going forward, continuous shut down of SNGPL network based fertilizer plants may lead to non availability of much needed fertilizers for the farmer.
Summary of consolidated financial results at the end of March 31, 2018 is as follows:
PKR in Million
Sale 11,599Gross Profit 6,584Profit Before Tax 3,890Profit After Tax 2,546
Future Outlook
With continued Government policy to provide the fertilizers at sustainable prices to farmers, the momentum in sales is expected to continue as the Company remains poised to achieve its aggressive sales targets. The Company is working on introducing latest farming technologies in the country to improve the farm yields. With availability of stocks of all the products and efficient and sustainable plant operations, the Company is well positioned to provide required fertilizers to the farmers leading to incremental values for its stakeholders.
Acknowledgements
The Board places on record its gratitude for the hard work and dedication of every employee of the Company. The Board also appreciates and acknowledges the assistance, guidance and cooperation of all stakeholders including the Government of Pakistan, financial institutions, commercial banks, business associates, customers and all others whose efforts and contributions strengthened the Company.
For and on behalf of the Board
Lahore April 26, 2018 Chief Executive Officer Arif Habib Chairman
1st Qua
rterly
Repo
rt 20
18
7
77
Fatima Fertilizer Company LimitedCondensed Interim
Financial Statementsfor the three months ended March 31, 2018

8
8
Fatim
a Fert
ilizer
Comp
any L
imite
dSeparate Financial Statements
Un audited Audited March 31, 2018 December 31, 2017
Note (Rupees in thousand)
EQUITY AND LIABILITIES CAPITAL AND RESERVESAuthorized share capital 2,500,000,000 (December 31, 2017: 2,500,000,000) shares of Rs 10 each 25,000,000 25,000,000 Issued,subscribed and paid up share capital 2,100,000,000 (December 31 2017: 2,100,000,000) ordinary shares of Rs 10 each 21,000,000 21,000,000
Reserves 4 35,628,865 32,741,792 56,628,865 53,741,792 NON CURRENT LIABILITIES Long term finances 5 10,704,724 10,774,286 Deferred liabilities 6 15,911,694 15,763,775 Long term deposits 51,851 51,269 26,668,269 26,589,330
CURRENT LIABILITIES Trade and other payables 12,218,875 11,459,546 Accrued finance cost 382,113 167,823 Short term finances - secured 7 856,662 1,725,938 Current maturity of long term finances 5 5,672,581 5,652,048 19,130,231 19,005,355CONTINGENCIES & COMMITMENTS 8
102,427,365 99,336,477
The annexed explanatory notes from 1 to 21 form an integral part of these condensed interim financial statements.
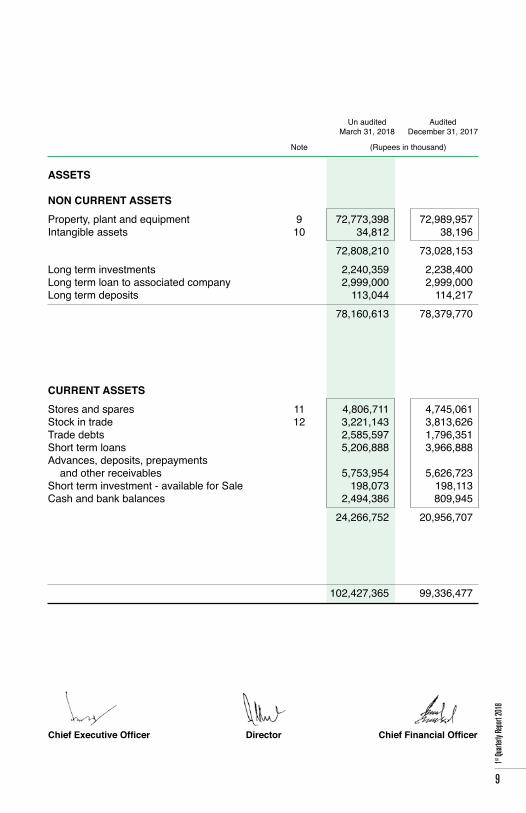
Condensed Interim Balance SheetAs at March 31, 2018
9
9
1st Qua
rterly
Repo
rt 20
18
Un audited Audited March 31, 2018 December 31, 2017
Note (Rupees in thousand)
ASSETS NON CURRENT ASSETS Property, plant and equipment 9 72,773,398 72,989,957 Intangible assets 10 34,812 38,196 72,808,210 73,028,153Long term investments 2,240,359 2,238,400 Long term loan to associated company 2,999,000 2,999,000Long term deposits 113,044 114,217 78,160,613 78,379,770 CURRENT ASSETS Stores and spares 11 4,806,711 4,745,061Stock in trade 12 3,221,143 3,813,626 Trade debts 2,585,597 1,796,351 Short term loans 5,206,888 3,966,888 Advances, deposits, prepayments and other receivables 5,753,954 5,626,723Short term investment - available for Sale 198,073 198,113 Cash and bank balances 2,494,386 809,945 24,266,752 20,956,707
102,427,365 99,336,477
Chief Executive Officer Director Chief Financial Officer

10
10
Fatim
a Fert
ilizer
Comp
any L
imite
dSeparate Financial Statements
Condensed Interim Profit And Loss Account (Un Audited)For the three months ended March 31, 2018
March 31, 2018 March 31, 2017
Note (Rupees in thousand)
Sales 13 11,388,598 8,258,694 Cost of sales 14 (4,554,766) (3,750,567)Gross profit 6,833,832 4,508,127 Distribution cost (1,342,264) (720,253)Administrative expenses (625,591) (368,059) 4,865,977 3,419,815 Finance cost 15 (323,475) (497,291)Other operating expenses (357,380) (190,956) 4,185,122 2,731,568 Other income 153,752 174,285 Profit before tax 4,338,874 2,905,853 Taxation (1,451,801) (632,227)Profit for the period 2,887,073 2,273,626 Earnings per share - basic and diluted (Rupees) 17 1.37 1.08
The annexed explanatory notes from 1 to 21 form an integral part of these condensed interim financial statements.
Chief Executive Officer Director Chief Financial Officer
11
11
1st Qua
rterly
Repo
rt 20
18
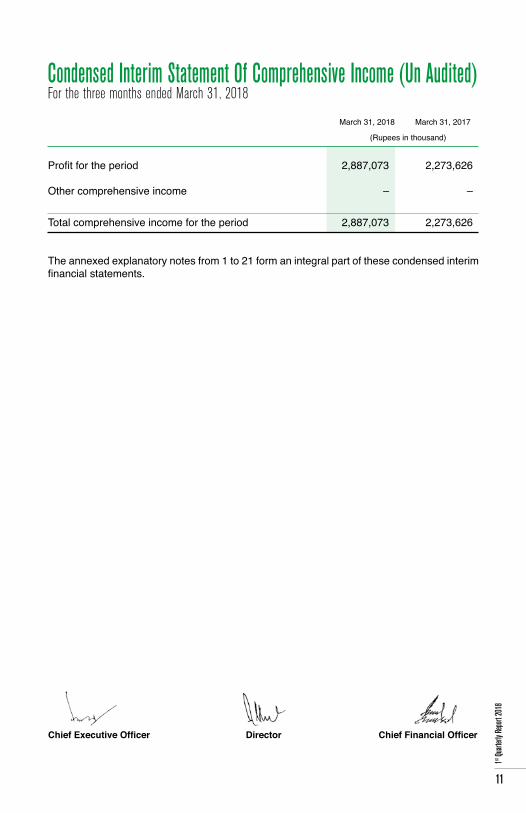
Condensed Interim Statement Of Comprehensive Income (Un Audited) For the three months ended March 31, 2018
March 31, 2018 March 31, 2017
(Rupees in thousand)
Profit for the period 2,887,073 2,273,626 Other comprehensive income – – Total comprehensive income for the period 2,887,073 2,273,626
The annexed explanatory notes from 1 to 21 form an integral part of these condensed interim financial statements.
Chief Executive Officer Director Chief Financial Officer

12
12
Fatim
a Fert
ilizer
Comp
any L
imite
dSeparate Financial Statements
Ordinary Share Unappropriated Post Surplus/ (deficit) on Total share premium profit retirement remeasurement capital benefit obligation of investment reserve available for sale
(Rupees in thousand)
Balance at December 31, 2016 (Audited) 21,000,000 1,790,000 24,626,089 (42,418) 345 47,374,016 Profit for the period – – 2,273,626 – – 2,273,626 Other comprehensive income – – – – – – Total comprehensive income – – 2,273,626 – – 2,273,626
Balance at March 31, 2017 (Un audited) 21,000,000 1,790,000 26,899,715 (42,418) 345 49,647,642 Balance at December 31, 2017 (Audited) 21,000,000 1,790,000 31,002,102 (49,073) (1,237) 53,741,792 Profit for the period – – 2,887,073 – – 2,887,073 Other comprehensive income – – – – – –
Total comprehensive income – – 2,887,073 – – 2,887,073
Balance at March 31, 2018 (Un audited) 21,000,000 1,790,000 33,889,175 (49,073) (1,237) 56,628,865
The annexed explanatory notes from 1 to 21 form an integral part of these condensed interim financial statements.
Condensed Interim Statement Of Changes In Equity For the three months ended March 31, 2018
Chief Executive Officer Director Chief Financial Officer
13
13
1st Qua
rterly
Repo
rt 20
18
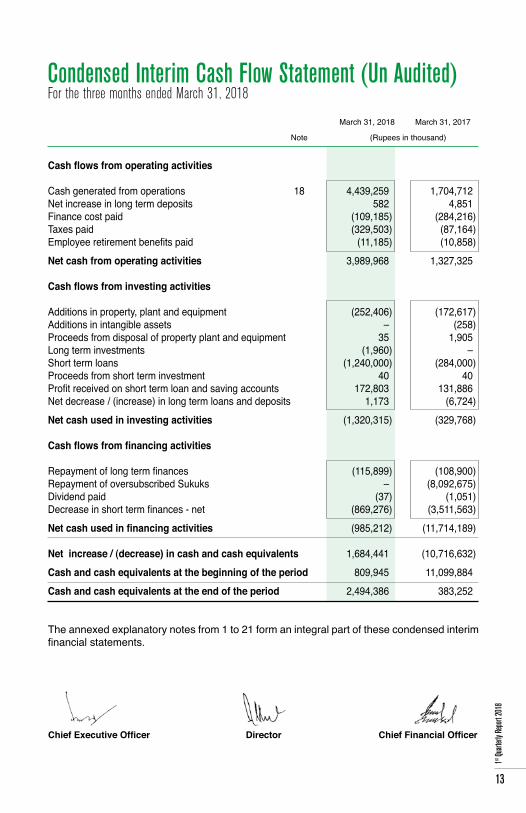
Condensed Interim Cash Flow Statement (Un Audited) For the three months ended March 31, 2018
March 31, 2018 March 31, 2017
Note (Rupees in thousand)
Cash flows from operating activities Cash generated from operations 18 4,439,259 1,704,712Net increase in long term deposits 582 4,851 Finance cost paid (109,185) (284,216)Taxes paid (329,503) (87,164)Employee retirement benefits paid (11,185) (10,858)Net cash from operating activities 3,989,968 1,327,325 Cash flows from investing activities Additions in property, plant and equipment (252,406) (172,617)Additions in intangible assets – (258)Proceeds from disposal of property plant and equipment 35 1,905Long term investments (1,960) – Short term loans (1,240,000) (284,000)Proceeds from short term investment 40 40 Profit received on short term loan and saving accounts 172,803 131,886 Net decrease / (increase) in long term loans and deposits 1,173 (6,724)Net cash used in investing activities (1,320,315) (329,768) Cash flows from financing activities Repayment of long term finances (115,899) (108,900)Repayment of oversubscribed Sukuks – (8,092,675)Dividend paid (37) (1,051)Decrease in short term finances - net (869,276) (3,511,563)Net cash used in financing activities (985,212) (11,714,189) Net increase / (decrease) in cash and cash equivalents 1,684,441 (10,716,632)Cash and cash equivalents at the beginning of the period 809,945 11,099,884Cash and cash equivalents at the end of the period 2,494,386 383,252
The annexed explanatory notes from 1 to 21 form an integral part of these condensed interim financial statements.
Chief Executive Officer Director Chief Financial Officer

14
14
Fatim
a Fert
ilizer
Comp
any L
imite
dSeparate Financial Statements
1 Legal Status and nature of business
Fatima Fertilizer Company Limited (‘the Company’), was incorporated in Pakistan on December 24, 2003 as a public company under the Companies Ordinance, 1984. The Company is listed on Pakistan Stock Exchange.
The principal activity of the Company is manufacturing, producing, buying, selling,
importing and exporting fertilizers and chemicals. Registered office of the Company is situated at E-110, Khayaban-e-Jinnah, Lahore Cantt. The manufacturing facility of the Company is located at Mukhtargarh, Sadiqabad, Pakistan.
These financial statements are the separate financial statements of the Company in
which investments in subsidiary companies and associate are accounted for on the basis of actual cost incurred to acquire subsidiaries or associates rather than on the basis of reported result. Consolidated financial statements are prepared separately.
2 Basis of preparation
2.1 These condensed interim financial statements of the Company for the three months ended March 31, 2018 have been prepared in accordance with the requirements of the International Accounting Standard - 34: “Interim Financial Reporting” and provisions of and directives issued under the Companies Act, 2017. In case where requirements differ, the provisions or directives issued under the Companies Act, 2017 have been followed.
2.2 These condensed interim financial statements do not include all the information required for full annual financial statements and should be read in conjunction with the annual financial statements of the Company for the year ended December 31, 2017. Comparative condensed interim balance sheet is extracted from annual audited financial statements for the year ended December 31, 2017 and comparative condensed interim profit and loss account, condensed interim statement of comprehensive income, condensed interim statement of changes in equity and condensed interim cash flow statement are stated from un audited condensed interim financial statements for the three months ended March 31, 2017.
2.3 These condensed interim financial statements are presented in Pak Rupees, which is
the Company’s functional and presentation currency. 3 Accounting polices and estimates
The accounting policies, related judgments, estimates and related assumptions adopted for the preparation of these condensed interim financial statements are the same as those applied in the preparation of annual financial statements of the company for the year ended December 31, 2017.
Notes to and Forming Part of the Condensed Interim Financial Statements (Un audited)For the three months ended March 31, 2018
15
15
1st Qua
rterly
Repo
rt 20
18
Un audited Audited March 31, 2018 December 31, 2017
Note (Rupees in thousand)
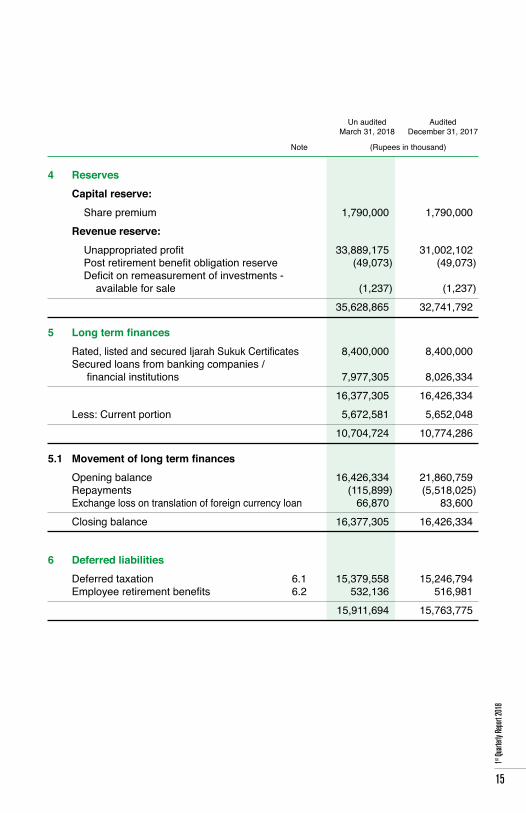
4 Reserves Capital reserve: Share premium 1,790,000 1,790,000 Revenue reserve: Unappropriated profit 33,889,175 31,002,102 Post retirement benefit obligation reserve (49,073) (49,073) Deficit on remeasurement of investments - available for sale (1,237) (1,237) 35,628,865 32,741,792 5 Long term finances Rated, listed and secured Ijarah Sukuk Certificates 8,400,000 8,400,000 Secured loans from banking companies / financial institutions 7,977,305 8,026,334 16,377,305 16,426,334 Less: Current portion 5,672,581 5,652,048 10,704,724 10,774,286 5.1 Movement of long term finances Opening balance 16,426,334 21,860,759 Repayments (115,899) (5,518,025) Exchange loss on translation of foreign currency loan 66,870 83,600 Closing balance 16,377,305 16,426,334 6 Deferred liabilities Deferred taxation 6.1 15,379,558 15,246,794 Employee retirement benefits 6.2 532,136 516,981 15,911,694 15,763,775

16
16
Fatim
a Fert
ilizer
Comp
any L
imite
dSeparate Financial Statements
Notes to and Forming Part of the Condensed Interim Financial Statements (Un audited)For the three months ended March 31, 2018
6.1 Deferred taxation March 31, 2018 (Un audited)
At Charged / Charged / At December 31, (credited) to (credited) to other March 31,
2017 profit and loss comprehensive income 2018
(Rupees in thousand)
Deferred tax liabilities: Accelerated tax depreciation 15,319,359 132,648 – 15,452,007 Short term investment - available for sale (530) – – (530) 15,318,829 132,648 – 15,451,477 Deferred tax asset: Provision for retirement benefits (50,541) 116 – (50,425) Remeasurement of defined benefit obligation (21,494) – – (21,494) (72,035) 116 – (71,919) 15,246,794 132,764 – 15,379,558 December 31, 2017 (Audited)
At Charged / Charged / At December 31, (credited) to (credited) to other December 31,
2016 profit and loss comprehensive income 2017 (Rupees in thousand)
Deferred tax liabilities: Accelerated tax depreciation 15,279,998 39,361 – 15,319,359 Short term investment - available for sale 155 – (685) (530) 15,280,153 39,361 (685) 15,318,829 Deferred tax asset: Provision for retirement benefits (34,528) (16,013) – (50,541) Remeasurement of defined benefit obligation (19,541) – (1,953) (21,494) (54,069) (16,013) (1,953) (72,035) 15,226,084 23,348 (2,638) 15,246,794

17
17
1st Qua
rterly
Repo
rt 20
18
Un audited Audited March 31, 2018 December 31, 2017
(Rupees in thousand)
6.2 Employee retirement benefits Gratuity 362,968 348,551 Accumulating compensated absences 169,168 168,430 532,136 516,981 7 Short term finances The Company has obtained short term financing facilities from various banks for working
capital requirements in the nature of Running Finance, Cash Finance and Financing against Imported Merchandise.
These facilities are secured by Pari Passu charge on present and future current assets
of the Company with 25% margin over financed amount, pledge of raw material and finished goods and personal guarantees of sponsoring directors.
These facilities carry mark up ranging from 5.78% to 7.50% (December 31, 2017:
5.78% to 7.29%) per annum for Running Finance and 6.40% to 7.25% (December 31, 2017: 6.34% to 7.28%) per annum for Cash Finance.
8 Contingencies and commitments 8.1 Contingencies As at March 31, 2018, there is no material change in the status of contingencies as
reported in the notes to the financial statements of the Company for the year ended December 31, 2017.
Un audited Audited March 31, 2018 December 31, 2017
(Rupees in thousand)
8.2 Commitments in respect of : (i) Contracts for capital expenditure 1,402,078 1,130,885 (ii) Contracts for other than capital expenditure 846,663 828,532
(iii) The amount of future payments under non-cancellable operating leases: Not later than one year 311,663 294,355 Later than one year but not later than five years 237,558 243,516 549,221 537,871

18
18
Fatim
a Fert
ilizer
Comp
any L
imite
dSeparate Financial Statements
Notes to and Forming Part of the Condensed Interim Financial Statements (Un audited)For the three months ended March 31, 2018
Un audited Audited March 31, 2018 December 31, 2017
Note (Rupees in thousand)
9 Property, plant and equipment Operating fixed assets- tangible 9.1 70,249,279 70,142,753 Capital work in progress 9.2 2,524,119 2,847,204 72,773,398 72,989,957 9.1 Movement of operating fixed assets- tangible Opening book value 70,142,753 70,493,773 Add: additions during the period 575,491 1,477,699 Less: book value of disposals during the period – 856 70,718,244 71,970,616 Less: depreciation charged during the period 468,965 1,827,863 Closing book value 70,249,279 70,142,753 9.1.1 Additions during the period Freehold land – 5,259 Building – 501,713 Plant and machinery 504,814 817,077 Furniture and fixtures 4,468 4,602 Office equipment 2,647 6,429 Electric installations and appliances 11,905 88,375 Computers 25,026 34,818 Vehicles 26,631 19,426 575,491 1,477,699 9.2 Capital work in progress Civil works 332,374 271,528 Plant and machinery 1,141,417 1,509,257 Capital stores 341,945 341,212 Advances - Freehold land 184,210 158,958 - Civil works 4,382 6,143 - Plant and machinery 219,791 260,106 - Other advances 300,000 300,000 708,383 725,207 2,524,119 2,847,204

19
19
1st Qua
rterly
Repo
rt 20
18
Un audited Audited March 31, 2018 December 31, 2017
(Rupees in thousand)
9.2.1 Movement of capital work in progress Opening balance 2,847,204 2,447,601 Addition during the period 177,376 1,538,614 3,024,580 3,986,215 Less: Capitalization during the period 500,461 1,139,011 Closing balance 2,524,119 2,847,204 10 Intangible assets Opening book value 38,196 17,909 Add: additions during the period – 29,383 38,196 47,292 Less: amortization charged during the period 3,384 9,096 Closing book value 34,812 38,196 11 Stores and spares Stores 218,423 218,082 Spares 3,693,009 3,578,721 Catalyst and chemicals 895,279 948,258 4,806,711 4,745,061
12 Stock in trade Raw material {including in transit Rs 52.50 million (December 31, 2017: 376.952 million)} 1,120,071 1,348,958 Packing material 19,311 3,543 Mid products Ammonia 17,562 6,362 Nitric Acid 11,369 3,360 Others 371 394 29,302 10,116 Finished goods Urea 900,810 1,212,219 NP 646,615 538,127 CAN 431,664 631,772 Certified emission reductions 73,370 68,891 2,052,459 2,451,009 3,221,143 3,813,626

20
20
Fatim
a Fert
ilizer
Comp
any L
imite
dSeparate Financial Statements
Notes to and Forming Part of the Condensed Interim Financial Statements (Un audited)For the three months ended March 31, 2018
For the quarter ended
March 31, 2018 March 31, 2017
(Rupees in thousand)
13 Sales Fertilizer Products : - Local sales 9,846,356 7,831,492 - Export sales 1,456,008 – Subsidy from Government of Pakistan 171,512 800,737 Mid products 65,359 79,491 Certified emission reductions – 82,924 11,539,235 8,794,644 Less: Discounts 150,637 535,950 11,388,598 8,258,694 13.1 Sales are exclusive of sales tax of Rs 771.089 million (March 31, 2017: Rs 1,166.745 million).
For the quarter ended
March 31, 2018 March 31, 2017
(Rupees in thousand) 14 Cost of sales Raw material consumed 1,600,097 1,280,620 Packing material consumed 218,279 160,791 Salaries, wages and other benefits 694,698 496,691 Fuel and power 704,620 696,714 Chemicals and catalyst consumed 116,695 113,833 Stores and spares consumed 225,366 200,386 Technical assistance 21,017 7,346 Repair and maintenance 53,983 82,518 Insurance 39,427 31,194 Travelling and conveyance 15,610 21,360 Rent, rates and taxes 10,003 10,608 Vehicle running and maintenance 11,369 10,685 Depreciation 449,668 436,793 Others 14,570 11,914 Manufacturing cost 4,175,402 3,561,453 Opening stock of mid products 10,116 15,862 Closing stock of mid products (29,302) (25,768) Cost of goods manufactured 4,156,216 3,551,547 Opening stock of finished goods 2,451,009 4,527,422 Closing stock of finished goods (2,052,459) (4,328,402) 4,554,766 3,750,567
21
21
1st Qua
rterly
Repo
rt 20
18
For the quarter ended
March 31, 2018 March 31, 2017
(Rupees in thousand)
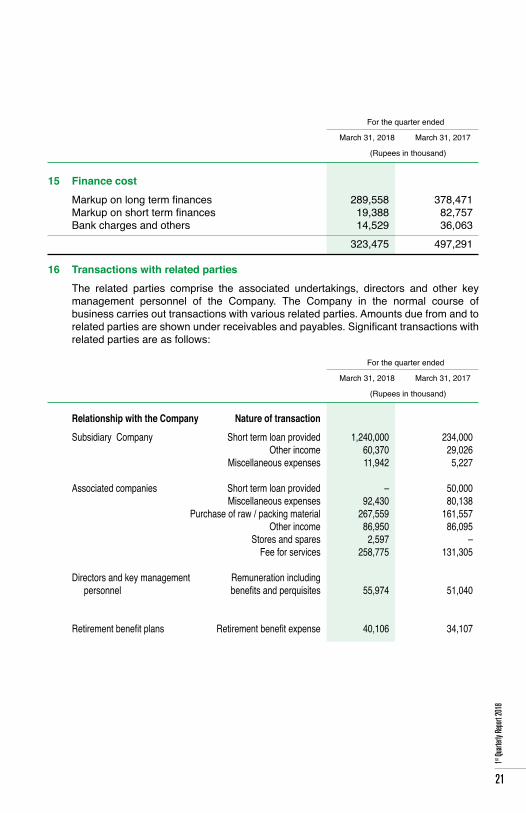
15 Finance cost Markup on long term finances 289,558 378,471 Markup on short term finances 19,388 82,757 Bank charges and others 14,529 36,063 323,475 497,291 16 Transactions with related parties The related parties comprise the associated undertakings, directors and other key
management personnel of the Company. The Company in the normal course of business carries out transactions with various related parties. Amounts due from and to related parties are shown under receivables and payables. Significant transactions with related parties are as follows:
For the quarter ended
March 31, 2018 March 31, 2017
(Rupees in thousand)
Relationship with the Company Nature of transaction Subsidiary Company Short term loan provided 1,240,000 234,000 Other income 60,370 29,026 Miscellaneous expenses 11,942 5,227 Associated companies Short term loan provided – 50,000 Miscellaneous expenses 92,430 80,138 Purchase of raw / packing material 267,559 161,557 Other income 86,950 86,095 Stores and spares 2,597 – Fee for services 258,775 131,305 Directors and key management Remuneration including personnel benefits and perquisites 55,974 51,040 Retirement benefit plans Retirement benefit expense 40,106 34,107
22
22
Fatim
a Fert
ilizer
Comp
any L
imite
dSeparate Financial Statements
Notes to and Forming Part of the Condensed Interim Financial Statements (Un audited)For the three months ended March 31, 2018
For the quarter ended
March 31, 2018 March 31, 2017
(Rupees in thousand)
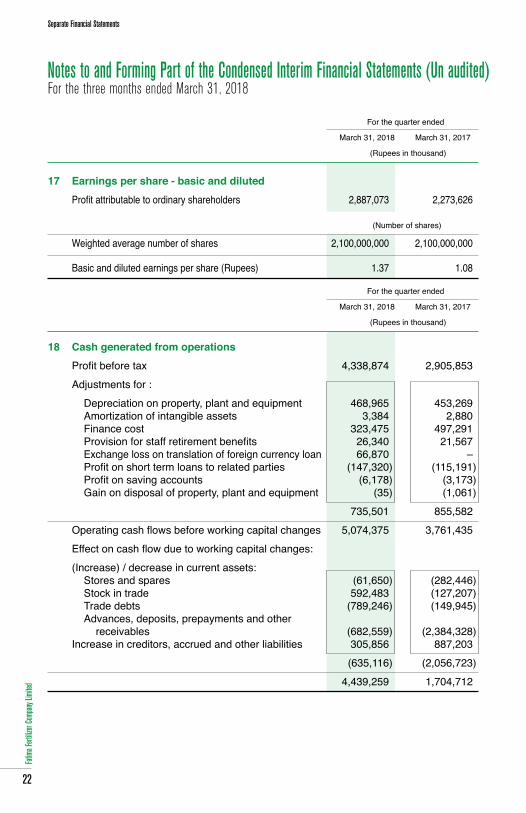
17 Earnings per share - basic and diluted Profit attributable to ordinary shareholders 2,887,073 2,273,626
(Number of shares)
Weighted average number of shares 2,100,000,000 2,100,000,000
Basic and diluted earnings per share (Rupees) 1.37 1.08
For the quarter ended
March 31, 2018 March 31, 2017
(Rupees in thousand) 18 Cash generated from operations Profit before tax 4,338,874 2,905,853 Adjustments for : Depreciation on property, plant and equipment 468,965 453,269 Amortization of intangible assets 3,384 2,880 Finance cost 323,475 497,291 Provision for staff retirement benefits 26,340 21,567 Exchange loss on translation of foreign currency loan 66,870 – Profit on short term loans to related parties (147,320) (115,191) Profit on saving accounts (6,178) (3,173) Gain on disposal of property, plant and equipment (35) (1,061) 735,501 855,582 Operating cash flows before working capital changes 5,074,375 3,761,435 Effect on cash flow due to working capital changes: (Increase) / decrease in current assets: Stores and spares (61,650) (282,446) Stock in trade 592,483 (127,207) Trade debts (789,246) (149,945) Advances, deposits, prepayments and other receivables (682,559) (2,384,328) Increase in creditors, accrued and other liabilities 305,856 887,203 (635,116) (2,056,723) 4,439,259 1,704,712

23
23
1st Qua
rterly
Repo
rt 20
18
19 Financial instruments The carrying amount of financial assets and financial liabilities as at March 31, 2018 and
as at December 31, 2017 approximate their fair values. 20 Date of Authorization of Issue These financial statements have been authorized for issue on April 26, 2018 by the
Board of Directors of the Company. 21 General Figures have been rounded off to the nearest thousand of rupees unless stated
otherwise.
Chief Executive Officer Director Chief Financial Officer

24
24
Fatim
a Fert
ilizer
Comp
any L
imite
d
24

25
1st Qua
rterly
Repo
rt 20
18
25
Fatima Fertilizer Company LimitedCondensed Interim Consolidated
Financial Statementsfor the three months ended March 31, 2018

26
26
Fatim
a Fert
ilizer
Comp
any L
imite
dConsolidated Financial Statements
Un audited Audited March 31, 2018 December 31, 2017
Note (Rupees in thousand)
EQUITY AND LIABILITIES CAPITAL AND RESERVESAuthorized share capital 2,500,000,000 (December 31, 2017: 2,500,000,000) shares of Rs 10 each 25,000,000 25,000,000 Issued, subscribed and paid up share capital 2,100,000,000 (December 31, 2017: 2,100,000,000) ordinary shares of Rs 10 each 21,000,000 21,000,000
Reserves 4 47,191,445 44,644,998 68,191,445 65,644,998 NON CURRENT LIABILITIESLong term finances 5 12,937,724 13,751,619 Deferred liabilities 6 14,852,929 14,825,896 Long term deposits 60,121 56,626 27,850,774 28,634,141 CURRENT LIABILITIESTrade and other payables 14,612,396 13,864,053 Accrued finance cost 386,302 259,961 Short term finances - secured 7 1,256,662 2,116,673 Current maturity of long term finances 5 7,161,248 7,140,715 23,416,608 23,381,402CONTINGENCIES & COMMITMENTS 8
119,458,827 117,660,541
The annexed explanatory notes from 1 to 21 form an integral part of these condensed interim consolidated financial statements.
Condensed Interim Consolidated Balance SheetAs at March 31, 2018
27
27
1st Qua
rterly
Repo
rt 20
18
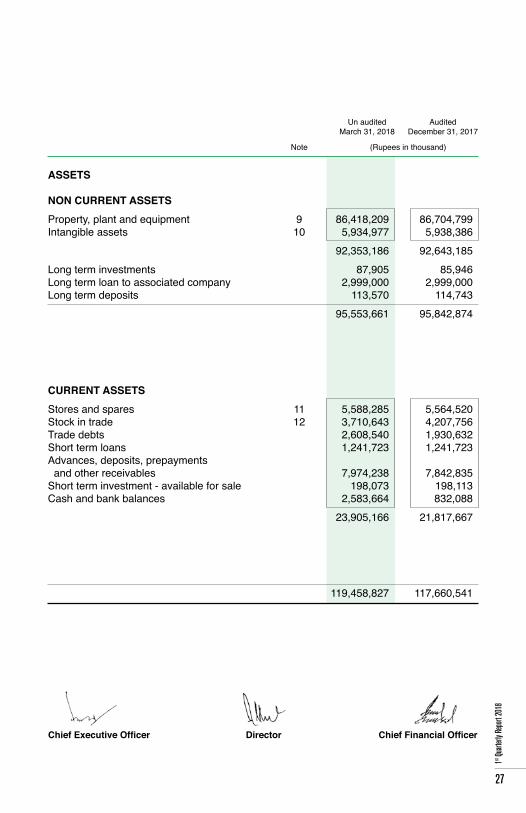
Un audited Audited March 31, 2018 December 31, 2017
Note (Rupees in thousand)
ASSETS NON CURRENT ASSETS Property, plant and equipment 9 86,418,209 86,704,799 Intangible assets 10 5,934,977 5,938,386 92,353,186 92,643,185Long term investments 87,905 85,946 Long term loan to associated company 2,999,000 2,999,000Long term deposits 113,570 114,743 95,553,661 95,842,874 CURRENT ASSETS Stores and spares 11 5,588,285 5,564,520Stock in trade 12 3,710,643 4,207,756Trade debts 2,608,540 1,930,632 Short term loans 1,241,723 1,241,723Advances, deposits, prepayments and other receivables 7,974,238 7,842,835Short term investment - available for sale 198,073 198,113 Cash and bank balances 2,583,664 832,088 23,905,166 21,817,667
119,458,827 117,660,541
Chief Executive Officer Director Chief Financial Officer

28
28
Fatim
a Fert
ilizer
Comp
any L
imite
dConsolidated Financial Statements
Condensed Interim Consolidated Profit And Loss Account (Un Audited)For the three months ended March 31, 2018
March 31, 2018 March 31, 2017
Note (Rupees in thousand)
Sales 13 11,599,311 10,392,935 Cost of sales 14 (5,015,152) (5,974,390)Gross profit 6,584,159 4,418,545 Distribution cost (1,343,261) (774,324)Administrative expenses (677,137) (408,781) 4,563,761 3,235,440 Finance cost 15 (414,100) (625,606)Other operating expenses (357,380) (190,956) 3,792,281 2,418,878 Other income 98,082 149,091 Profit before tax 3,890,363 2,567,969 Taxation (1,343,916) (655,221)Profit for the period 2,546,447 1,912,748 Earnings per share - basic and diluted (Rupees) 17 1.21 0.91
The annexed explanatory notes from 1 to 21 form an integral part of these condensed interim consolidated financial statements.
Chief Executive Officer Director Chief Financial Officer
29
29
1st Qua
rterly
Repo
rt 20
18
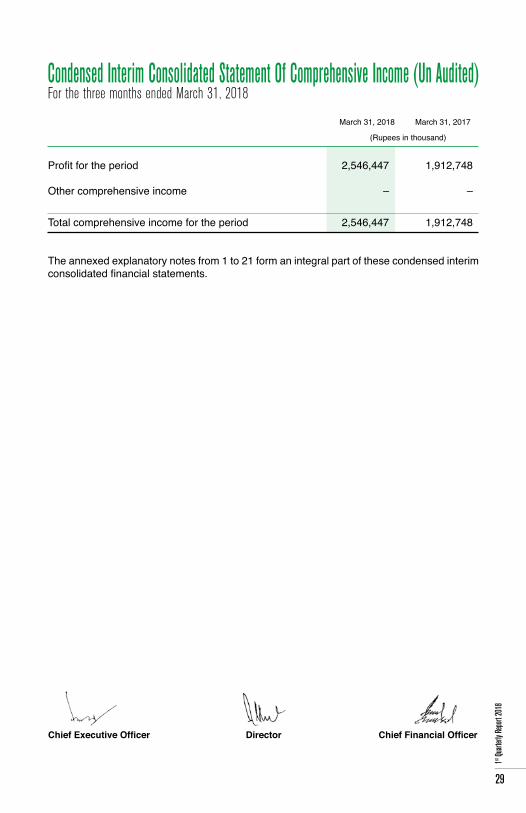
Condensed Interim Consolidated Statement Of Comprehensive Income (Un Audited) For the three months ended March 31, 2018
March 31, 2018 March 31, 2017
(Rupees in thousand)
Profit for the period 2,546,447 1,912,748 Other comprehensive income – – Total comprehensive income for the period 2,546,447 1,912,748
The annexed explanatory notes from 1 to 21 form an integral part of these condensed interim consolidated financial statements.
Chief Executive Officer Director Chief Financial Officer

30
30
Fatim
a Fert
ilizer
Comp
any L
imite
dConsolidated Financial Statements
Ordinary Share Unappropriated Post Surplus / (deficit) on Total share premium profit retirement remeasurement capital benefit obligation of investment reserve available for sale
(Rupees in thousand)
Balance as at December 31, 2016 (Audited) 21,000,000 1,790,000 37,831,111 409 345 60,621,865 Profit for the period – – 1,912,748 – – 1,912,748 Other comprehensive income – – – – – – Total comprehensive income – – 1,912,748 – – 1,912,748
Balance at March 31, 2017 (Un audited) 21,000,000 1,790,000 39,743,859 409 345 62,534,613 Balance as at December 31, 2017 (Audited) 21,000,000 1,790,000 42,899,054 (42,819) (1,237) 65,644,998 Profit for the period – – 2,546,447 – – 2,546,447 Other comprehensive income – – – – – –
Total comprehensive income – – 2,546,447 – – 2,546,447
Balance at March 31, 2018 (Un audited) 21,000,000 1,790,000 45,445,501 (42,819) (1,237) 68,191,445
The annexed explanatory notes from 1 to 21 form an integral part of these condensed interim consolidated financial statements.
Condensed Interim Consolidated Statement Of Changes In Equity For the three months ended March 31, 2018
Chief Executive Officer Director Chief Financial Officer

31
31
1st Qua
rterly
Repo
rt 20
18
Condensed Interim Consolidated Cash Flow Statement (Un Audited) For the three months ended March 31, 2018
March 31, 2018 March 31, 2017
Note (Rupees in thousand)
Cash flows from operating activities Cash generated from operations 18 4,248,751 593,420Increase in long term deposits 582 4,851 Finance cost paid (339,499) (518,606)Taxes paid (344,161) (150,313)Employee retirement benefits paid (15,156) (14,266)Net cash generated from / (used in) operating activities 3,550,517 (84,914) Cash flows from investing activities Additions in property, plant and equipment (254,400) (179,693)Additions in intangible assets – (258)Long term investment (1,960) – Short term loan to associated company - net – (50,000)Proceeds from disposal of property plant and equipment 769 2,143 Net increase in long term deposits 4,086 (6,724)Proceeds from short term investment 40 40Profit received on short term loan and saving accounts 172,804 132,100 Net cash used in investing activities (78,661) (102,392) Cash flows from financing activities Repayment of long term finances (860,232) (108,900)Repayment of oversubscribed Sukuks – (8,092,675)Dividend paid (37) (1,051)Decrease in short term finances - net (860,011) (2,798,252)Net cash used in financing activities (1,720,280) (11,000,878) Net increase / (decrease) in cash and cash equivalents 1,751,576 (11,188,184)Cash and cash equivalents at the beginning of the period 832,088 11,583,670Cash and cash equivalents at the end of the period 2,583,664 395,486
The annexed explanatory notes from 1 to 21 form an integral part of these condensed interim consolidated financial statements.
Chief Executive Officer Director Chief Financial Officer

32
32
Fatim
a Fert
ilizer
Comp
any L
imite
dConsolidated Financial Statements
1 Legal Status and nature of business
Fatima Fertilizer Company Limited (the Holding Company) and its wholly owned subsidiary - Fatimafert Limited (FF) collectively referred to as ‘the Group’ are incorporated in Pakistan under the Companies Ordinance, 1984. The Holding Company is listed on Pakistan Stock Exchange Limited. The control of FF was transferred to the Holding Company on July 01, 2015.
The principal activity of the Holding Company and FF is manufacturing, producing,
buying, selling, importing and exporting fertilizers and chemicals. Registered offices of the Holding Company and FF are located in Lahore, Pakistan. The
manufacturing facility of the Holding Company is located at Mukhtargarh, Sadiqabad, Pakistan and that of FF is located near Chichoki Mallian at Sheikhupura Road.
2 Basis of preparation
2.1 These condensed interim consolidated financial statements of the Group for the three months ended March 31, 2018 have been prepared in accordance with the requirements of the International Accounting Standard - 34: “Interim Financial Reporting” and provisions of and directives issued under the Companies Act, 2017. In case where requirements differ, the provisions or directives issued under the Companies Act, 2017 have been followed.
2.2 These condensed interim consolidated financial statements do not include all the
information required for full annual financial statements and should be read in conjunction with the annual consolidated financial statements of the Group for the year ended December 31, 2017. Comparative condensed interim consolidated balance sheet is extracted from annual audited consolidated financial statements for the year ended December 31, 2017 and comparative condensed interim consolidated profit and loss account, condensed interim consolidated statement of comprehensive income, condensed interim consolidated statement of changes in equity and condensed interim consolidated cash flow statement are stated from un audited condensed interim consolidated financial statements for the three months ended March 31, 2017.
2.3 These condensed interim consolidated financial statements are presented in Pak
Rupees, which is the Group functional and presentation currency. 3 Accounting polices and estimates
The accounting policies, related judgments, estimates and related assumptions adopted for the preparation of these condensed interim consolidated financial statements are the same as those applied in the preparation of annual consolidated financial statements of the Group for the year ended December 31, 2017.
NOTES TO AND FORMING PART OF THE CONDENSED INTERIM CONSOLIDATED FINANCIAL STATEMENTS (Un audited) For the three months ended March 31, 2018
33
33
1st Qua
rterly
Repo
rt 20
18
Un audited Audited March 31, 2018 December 31, 2017
Note (Rupees in thousand)
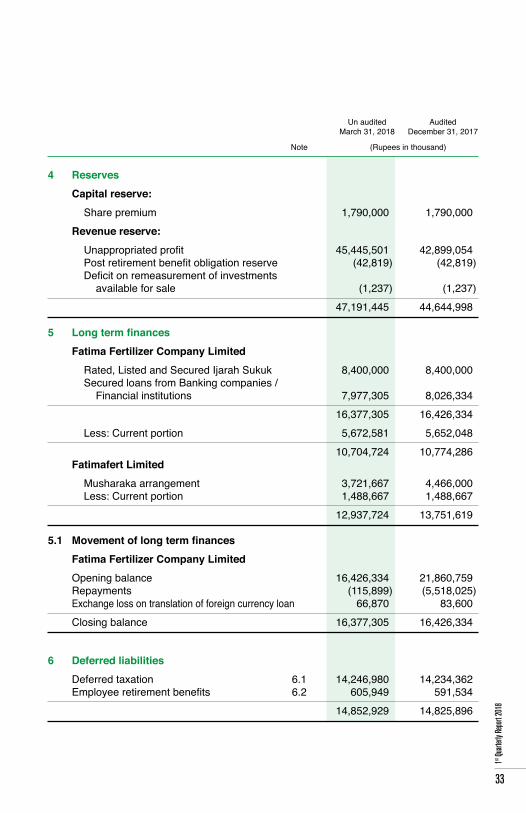
4 Reserves Capital reserve: Share premium 1,790,000 1,790,000 Revenue reserve: Unappropriated profit 45,445,501 42,899,054 Post retirement benefit obligation reserve (42,819) (42,819) Deficit on remeasurement of investments available for sale (1,237) (1,237) 47,191,445 44,644,998 5 Long term finances Fatima Fertilizer Company Limited Rated, Listed and Secured Ijarah Sukuk 8,400,000 8,400,000 Secured loans from Banking companies / Financial institutions 7,977,305 8,026,334 16,377,305 16,426,334 Less: Current portion 5,672,581 5,652,048 10,704,724 10,774,286 Fatimafert Limited Musharaka arrangement 3,721,667 4,466,000 Less: Current portion 1,488,667 1,488,667 12,937,724 13,751,619 5.1 Movement of long term finances Fatima Fertilizer Company Limited Opening balance 16,426,334 21,860,759 Repayments (115,899) (5,518,025) Exchange loss on translation of foreign currency loan 66,870 83,600 Closing balance 16,377,305 16,426,334 6 Deferred liabilities Deferred taxation 6.1 14,246,980 14,234,362 Employee retirement benefits 6.2 605,949 591,534 14,852,929 14,825,896

34
34
Fatim
a Fert
ilizer
Comp
any L
imite
dConsolidated Financial Statements
6.1 Deferred taxation March 31, 2018 (Un audited)
At Charged / Charged / At December 31, (credited) to (credited) to other March 31,
2017 profit and loss comprehensive income 2018
(Rupees in thousand)
Deferred tax liabilities: Accelerated tax depreciation 15,552,975 132,648 – 15,685,623 Short Term Investment - available for sale (530) – – (530) 15,552,445 132,648 – 15,685,093 Deferred tax asset: Carry forward losses (1,223,356) (120,368) – (1,343,724) Provision for retirement benefits (73,233) 338 – (72,895) Remeasurement of defined benefit obligation (21,494) – – (21,494) (1,318,083) (120,030) – (1,438,113) 14,234,362 12,618 – 14,246,980
December 31, 2017 (Audited)
At Charged / Charged / At December 31, (credited) to (credited) to other December 31,
2016 profit and loss comprehensive income 2017 (Rupees in thousand)
Deferred tax liabilities: Accelerated tax depreciation 15,507,134 45,841 – 15,552,975 Short Term Investment - available for sale 155 – (685) (530) 15,507,289 45,841 (685) 15,552,445 Deferred tax asset: Carry forward losses (236,000) (987,356) – (1,223,356) Provision for retirement benefits (41,656) (15,903) (15,674) (73,233) Remeasurement of defined benefit obligation (19,541) – (1,953) (21,494) (297,197) (1,003,259) (17,627) (1,318,083) 15,210,092 (957,418) (18,312) 14,234,362
Un audited Audited March 31, 2018 December 31, 2017
(Rupees in thousand)
6.2 Employee retirement benefits Gratuity 380,057 365,639 Accumulating compensated absences 225,892 225,895 605,949 591,534
NOTES TO AND FORMING PART OF THE CONDENSED INTERIM CONSOLIDATED FINANCIAL STATEMENTS (Un audited) For the three months ended March 31, 2018

35
35
1st Qua
rterly
Repo
rt 20
18
7 Short term finances The Group has obtained short term financing facilities from various banks for working
capital requirements in the nature of Running Finance, Cash Finance and Financing against Imported Merchandise.
These facilities are secured by Pari Passu charge on present and future current assets of the Group companies with 25% margin over financed amount, pledge of raw material and finished goods and personal guarantees of sponsoring directors.
These facilities carry mark up ranging from 5.78% to 7.50% (December 31, 2017: 5.78% to 7.29%) per annum for Running Finance, 6.40% to 7.25% (December 31, 2017: 6.34% to 7.53%) per annum for Cash Finance and 7.28% (December 31, 2017: 6.54% to 7.28%) for Finance against Imported Merchandise (FIM).
8 Contingencies and commitments 8.1 Contingencies As at March 31, 2018, there is no material change in the status of contingencies as
reported in the notes to the consolidated financial statements of the Group for the year ended December 31, 2017.
Un audited Audited March 31, 2018 December 31, 2017
(Rupees in thousand)
8.2 Commitments in respect of :8.2.1 Fatima Fertilizer Company Limited (i) Contracts for capital expenditure 1,402,078 1,130,885 (ii) Contracts for other than capital expenditure 846,663 828,532 (iii) The amount of future payments under non cancellable operating leases: Not later than one year 311,663 294,355 Later than one year but not later than five years 237,558 243,516 549,221 537,871 8.2.2 Fatimafert Limited Letters of credit for purchase of raw materials and spares 4,126 3,764

36
36
Fatim
a Fert
ilizer
Comp
any L
imite
dConsolidated Financial Statements
Un audited Audited March 31, 2018 December 31, 2017
Note (Rupees in thousand)
9 Property, plant and equipment Operating fixed assets- tangible 9.1 83,666,700 83,626,121 Capital work in progress 9.2 2,751,509 3,078,678 86,418,209 86,704,799 9.1 Movement of operating fixed assets- tangible Opening book value 83,626,121 84,258,748 Add: additions during the period 9.1.1 581,568 1,485,687 Less: book value of disposals during the period 26 936 84,207,663 85,743,499 Less: depreciation charged during the period 540,963 2,117,378 Closing book value 83,666,700 83,626,121 9.1.1 Additions during the period Freehold land – 5,259 Building – 501,713 Plant and machinery 504,814 817,077 Furniture and fixtures 7,776 4,685 Office equipment 2,647 6,776 Electric installations and appliances 11,905 88,375 Computers 27,732 42,376 Vehicles 26,694 19,426 581,568 1,485,687 9.2 Capital work in progress Civil works 338,481 277,633 Plant and machinery 1,162,673 1,534,598 Capital stores 541,972 541,240 Advances - Freehold land 184,210 158,958 - Civil works 4,382 6,143 - Plant and machinery 219,791 260,106 - Other advances 300,000 300,000 708,383 725,207 2,751,509 3,078,678
NOTES TO AND FORMING PART OF THE CONDENSED INTERIM CONSOLIDATED FINANCIAL STATEMENTS (Un audited) For the three months ended March 31, 2018
37
37
1st Qua
rterly
Repo
rt 20
18
Un audited Audited March 31, 2018 December 31, 2017
(Rupees in thousand)
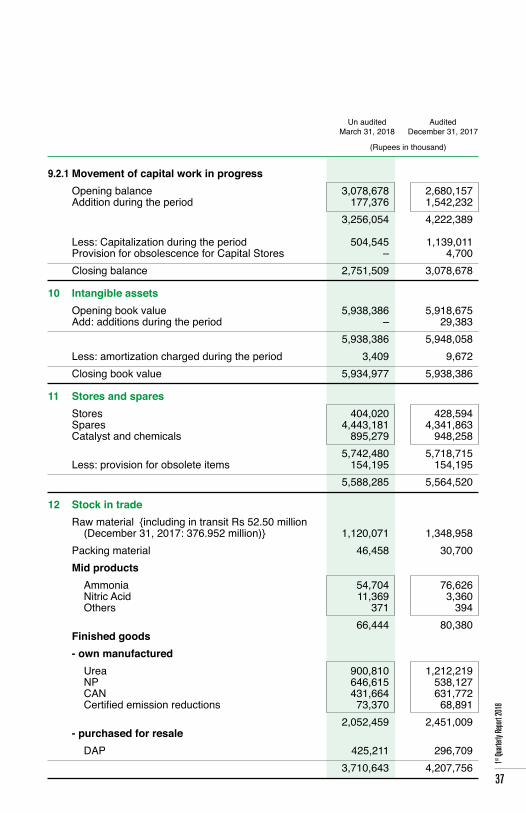
9.2.1 Movement of capital work in progress Opening balance 3,078,678 2,680,157 Addition during the period 177,376 1,542,232 3,256,054 4,222,389 Less: Capitalization during the period 504,545 1,139,011 Provision for obsolescence for Capital Stores – 4,700 Closing balance 2,751,509 3,078,678 10 Intangible assets Opening book value 5,938,386 5,918,675 Add: additions during the period – 29,383 5,938,386 5,948,058 Less: amortization charged during the period 3,409 9,672 Closing book value 5,934,977 5,938,386 11 Stores and spares Stores 404,020 428,594 Spares 4,443,181 4,341,863 Catalyst and chemicals 895,279 948,258 5,742,480 5,718,715 Less: provision for obsolete items 154,195 154,195 5,588,285 5,564,520
12 Stock in trade Raw material {including in transit Rs 52.50 million (December 31, 2017: 376.952 million)} 1,120,071 1,348,958 Packing material 46,458 30,700 Mid products Ammonia 54,704 76,626 Nitric Acid 11,369 3,360 Others 371 394 66,444 80,380 Finished goods - own manufactured Urea 900,810 1,212,219 NP 646,615 538,127 CAN 431,664 631,772 Certified emission reductions 73,370 68,891 2,052,459 2,451,009 - purchased for resale DAP 425,211 296,709 3,710,643 4,207,756

38
38
Fatim
a Fert
ilizer
Comp
any L
imite
dConsolidated Financial Statements
For the quarter ended
March 31, 2018 March 31, 2017
(Rupees in thousand)
13 Sales Fertilizer Products - own manufactured - Local sales 9,846,356 9,259,280 - Export sales 1,456,008 – - purchased for resale 139,754 623,520 Subsidy from Government of Pakistan 171,512 800,737 Mid products 136,318 162,424 Certified emission reductions – 82,924 11,749,948 10,928,885 Less: Discounts 150,637 535,950 11,599,311 10,392,935 13.1 Sales are exclusive of sales tax of Rs 788.369 million (March 31, 2017: Rs 1,369.955 million). For the quarter ended
March 31, 2018 March 31, 2017
(Rupees in thousand) 14 Cost of sales Raw material consumed 1,600,097 2,749,537 Packing material consumed 218,279 195,285 Salaries, wages and other benefits 820,285 646,249 Fuel and power 704,720 931,014 Chemicals and catalyst consumed 125,487 130,409 Stores and spares consumed 279,390 245,492 Technical assistance 21,022 7,373 Repair and maintenance 59,784 83,060 Insurance 48,212 39,978 Travelling and conveyance 25,484 31,145 Rent, rates and taxes 12,997 13,958 Vehicle running and maintenance 14,898 13,167 Depreciation 520,885 508,070 Others 41,731 31,316 Manufacturing cost 4,493,271 5,626,053 Opening stock of mid products 80,380 100,459 Closing stock of mid products (66,444) (106,557) Cost of goods manufactured 4,507,207 5,619,955 Opening stock of finished goods 2,451,009 7,208,998 Closing stock of finished goods (2,052,459) (7,347,116) Cost of sales - own manufactured 4,905,757 5,481,837 Cost of sales - purchased for resale 109,395 492,553 5,015,152 5,974,390
NOTES TO AND FORMING PART OF THE CONDENSED INTERIM CONSOLIDATED FINANCIAL STATEMENTS (Un audited) For the three months ended March 31, 2018

39
39
1st Qua
rterly
Repo
rt 20
18
For the quarter ended
March 31, 2018 March 31, 2017
(Rupees in thousand)
15 Finance cost Markup on long term finances 373,680 461,854 Markup on short term finances 21,271 121,116 Bank charges and others 19,149 42,636 414,100 625,606 16 Transactions with related parties The related parties comprise the associated undertakings, directors and other key
management personnel of the Group. The Group in the normal course of business carries out transactions with various related parties. Amounts due from and to related parties are shown under receivables and payables. Other significant transactions with related parties are as follows:
For the quarter ended
March 31, 2018 March 31, 2017
(Rupees in thousand)
Relationship with the Company Nature of transaction Associated companies Short term loan – 50,000 Miscellaneous expenses 95,894 83,305 Purchase of raw / packing material 267,559 171,988 Other income 86,950 86,095 Stores and spares 2,597 – Fee for services 259,363 158,836 Directors and key management Remuneration including personnel benefits and perquisites 75,304 73,193 Retirement benefit plans Retirement benefit expense 49,198 42,997
For the quarter ended
March 31, 2018 March 31, 2017
(Rupees in thousand)
17 Earnings per share - basic and diluted Profit attributable to ordinary shareholders 2,546,447 1,912,748
(Number of shares)
Weighted average number of shares 2,100,000,000 2,100,000,000
Basic and diluted earnings per share (Rupees) 1.21 0.91
40
40
Fatim
a Fert
ilizer
Comp
any L
imite
dConsolidated Financial Statements
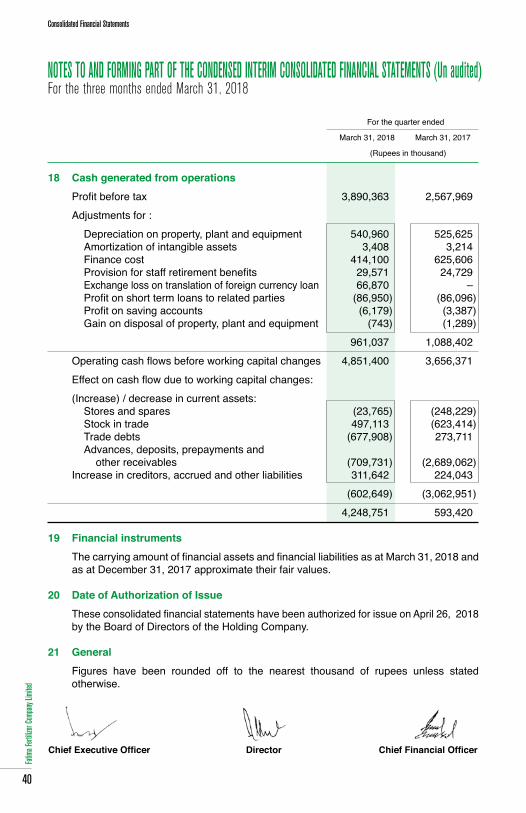
For the quarter ended
March 31, 2018 March 31, 2017
(Rupees in thousand) 18 Cash generated from operations Profit before tax 3,890,363 2,567,969 Adjustments for : Depreciation on property, plant and equipment 540,960 525,625 Amortization of intangible assets 3,408 3,214 Finance cost 414,100 625,606 Provision for staff retirement benefits 29,571 24,729 Exchange loss on translation of foreign currency loan 66,870 – Profit on short term loans to related parties (86,950) (86,096) Profit on saving accounts (6,179) (3,387) Gain on disposal of property, plant and equipment (743) (1,289) 961,037 1,088,402 Operating cash flows before working capital changes 4,851,400 3,656,371 Effect on cash flow due to working capital changes: (Increase) / decrease in current assets: Stores and spares (23,765) (248,229) Stock in trade 497,113 (623,414) Trade debts (677,908) 273,711 Advances, deposits, prepayments and other receivables (709,731) (2,689,062) Increase in creditors, accrued and other liabilities 311,642 224,043 (602,649) (3,062,951) 4,248,751 593,420
19 Financial instruments The carrying amount of financial assets and financial liabilities as at March 31, 2018 and
as at December 31, 2017 approximate their fair values. 20 Date of Authorization of Issue These consolidated financial statements have been authorized for issue on April 26, 2018
by the Board of Directors of the Holding Company.
21 General Figures have been rounded off to the nearest thousand of rupees unless stated
otherwise.
Chief Executive Officer Director Chief Financial Officer
NOTES TO AND FORMING PART OF THE CONDENSED INTERIM CONSOLIDATED FINANCIAL STATEMENTS (Un audited) For the three months ended March 31, 2018

42
1st QUARTERLY2018
REPORT
ADDING VALUE
E-110, Khayaban-e-JinnahLahore Cantt., Pakistan
PABX : +92 42 111 328 462
Fax : +92 42 3662 1389
www.fatima-group.com