1qfy12 review -...
TRANSCRIPT

India StrategyIndia Strategy
June-11 Review Results In-line; Aggregate PAT up
12%, Sensex PAT up 10% FY12 S EPS d d f 2%
August 2011 0
FY12 Sensex EPS downgrade of 2% FY11-13 Sensex EPS CAGR at 16%

India Strategy: June-11 Results Review Aggregate performance in line with estimates Aggregate performance in line with estimates
MOSL Universe (ex-RMs) 1QFY12 Sales grew 26% (est 26%), EBITDA 15% (est 19%), and PAT 12% (est 15%). Sensex aggregate performance was also In-line with estimates, EBITDA growth of 15% (est 17%) and PAT growth of 10% YoY (est growth of 13%).
Several large-caps perform below estimates across sectorsBelow estimates: Cipla, Tata Steel, Nestle, ONGC, NTPC, JSPL, SAIL, Bharti & Siemens.
Above estimates: Sun Pharma, Ultratech, Idea, Sterlite, M&M, Dr Reddy’s, Coal India & Maruti.
Downgrades exceed upgrades7 Sensex stocks witnessed downgrade in FY12 estimate (over 5%) while only 2 stocks (Sterlite & S Ph ) i d d ( 5%)Sun Pharma) witnessed upgrade (over 5%) .
Revised Sensex FY12 EPS at 1,158 (growth of 13.4%), downgrade of 2%.Also refer our June-11 Quarter Preview
August 2011 1

June-11 Quarter Results ReviewAggregate performance in line with estimatesAggregate performance in line with estimates Aggregate performance (ex-RMs) is in line with estimates: Sales grew 26% YoY (v/s est of 26%), EBIDTA grew
15% (v/s est 19%) and PAT 12% (v/s est 15%). Aggregate EBITDA margin (ex financials and RMs) is down 170bp YoY; all major sectors are facing EBITDA
margin pressure. 47 companies in our Universe reported PAT higher than estimate, 41 in-line and 47 below estimate. On the
EBITDA front, 41 companies reported above estimate, 45 in-line, and 49 below estimate.
Sector performance: Oil & Gas, Private Banks lead PAT growth PAT growth was led by Oil & Gas (+58% YoY, driven by Cairn India), Utilities (Coal India) followed by PrivatePAT growth was led by Oil & Gas ( 58% YoY, driven by Cairn India), Utilities (Coal India) followed by Private
Banks (+31%, in line with estimate). Sectors that had an adverse impact on aggregates were PSU Bank (down 20%), Telecom (down 25%) and
other sectors which grew in low single digits (Autos, Cement Pharma, Metals etc).
S f PAT 10% i liSensex performance: PAT up 10%, in-line Sensex aggregate PAT grew at 10% YoY vs estimate of 13%. EBIDTA growth is 15% v/s estimate of 17%. The 5 highest growth Sensex companies are Sterlite (+82%), Coal India (+63%), HDFC Bank (34%), Tata
Power (34%) and ICICI Bank (+30%), The 7 companies to report PAT de-growth are SBI (-46%), Bharti (-28%), Tata Steel (-24%), DLF (-13%) Sunp p g ( ), ( ), ( ), ( )
Pharma (-11%), JSPL (-2%) and Cipla (-2%). The top 5 outperformers over our estimates are DLF (+19%), Maruti (+17%), Sun Pharma (+17%), Coal India
(+14%) and Sterlite (+12%). The top 5 underperformers are Tata Steel (-29%), JSPL (-20%), ONGC (-18%)Cipla (-15%) and Bharti (-14%).
August 2011 2

June-11 Quarter: Key sectoral highlights AUTOS: Volume growth moderation visible in passenger vehicles and M&HCVs. Other segments’ volume growth continues to
be good. 1QFY12 witnessed margin contraction on RM cost push, partly diluted by better operating leverage. FY12 EPSdowngrade for Tata Motors (~14.6%), Bajaj Auto (~3.8%) and M&M (~5.2%). Prefer M&M and Bajaj Auto.
CEMENT: 1QFY12 volumes continued to disappoint, flat YoY. Realizations positively surprised, up INR10/bag QoQ translatinginto EBITDA/ton with improvement of ~INR7/bag QoQ. However, weakness in cement prices from May-11 onwards would havefull impact in 2HCY11. FY12 EPS upgrades: UTCEM ~12% , ACC 4% and ICEM 40% . ACEM saw downgrade of ~9% andSRCM ~13%. Prefer Ambuja, UltraTech and Birla Corp.
ENGINEERING: Except L&T and Thermax, all companies posted below estimate results. EBITDA margin declined, as input costrose across segments Order inflow remained muted with few power orders awarded during the period Crompton and ABBrose across segments. Order inflow remained muted, with few power orders awarded during the period. Crompton and ABBwitnessed significant earnings cut during the quarter; Siemens downgraded to Neutral as it achieved our target price. L&T istop pick.
FINANCIALS: Performance has largely been in-line with expectation. PSU banks NIMs moderated QoQ led by lag impact ofdeposit re-pricing and higher slippages. On asset quality, most PSU banks saw higher slippages (partly led by CBS-led NPAdeposit re pricing and higher slippages. On asset quality, most PSU banks saw higher slippages (partly led by CBS led NPArecognition and Agri NPAs). Valuations are at the average of last five years; we believe risk-reward ratio is favorable. Our toppicks are SBIN, AXSB, ICICI and PNB.
FMCG: FMCG performance has been broadly in-line. Gross margins have been under pressure due to high input costs; adspends have been cut to maintain margins. HUL has seen moderation in volume growth to 8.3%; ITC’s cigarette volumes haveincreased ~8%. Nestle and GSK Consumer have been downgraded to Neutral due to rich valuations; ITC remains top pickin the space.
IT: IT top-tier revenue growth and operating margins were largely in-line, but volume growth disappointed, especially at Infosysand HCL Tech. Cross currency movements facilitated revenue growth despite lower than
August 2011 3

Key sectoral highlights (contd.)
estimated volumes. TCS led revenue growth, while HCL Tech outperformed on margins. Infosys earnings saw a downgrade of2.7-5.5%. Infosys, HCL Tech and Wipro are our top picks.
METALS: Steel companies’ performance was below expectation except JSW Steel. Average realization moved up despitedeclining price trend and sluggish demand; operating costs moved up as well. Staff cost was up again for SAIL. Rising interestrates hit midcaps more Hindalco faced challenges in sourcing bauxite and reported sluggish demand for rolled products Tatarates hit midcaps more. Hindalco faced challenges in sourcing bauxite and reported sluggish demand for rolled products. TataSteel, Hindalco are our top picks.
OIL & GAS: Sector performance was largely in-line but for OMCs which reported losses due to lower than expected governmentcompensation. Highlights: 1) Refining margins were impacted by inventory loss due to crude price decline, 2) Petchem marginswere under pressure QoQ, and 3) Lower KG-D6 production impacted transmission companies (GAIL India, GSPL) but helpedLNG importer Petronet LNGLNG importer, Petronet LNG.
PHARMA: Overall results were in-line. Most companies’ India formulations business was disappointing due to increasedcompetitive intensity. CRAMS players are witnessing a recovery in supplies from Indian facilities post two bad years (FY10 &FY11). Top picks are Cipla (large cap), Divi’s (CRAMS) and Torrent (mid-cap).
REAL ESTATE: Most numbers were below estimate While gross margins remain under pressure net margin was impacted REAL ESTATE: Most numbers were below estimate. While gross margins remain under pressure, net margin was impactedeven more due to rise in interest cost. Most of the companies witnessed increase in leverage; DLF is yet to depict traction in itsde-leveraging plan.
TELECOM: Idea’s numbers were significantly above estimates. Bharti reported in-line EBITDA but PAT was below estimatesimpacted by forex loss and higher tax rate. RCom’s numbers were disappointing. Recent tariff hikes, strong volume growth,uptick in 3G revenue and expected regulatory clarity post upcoming NTP 2011 are key positives for the sector Bharti and Ideauptick in 3G revenue, and expected regulatory clarity post upcoming NTP 2011 are key positives for the sector. Bharti and Ideaare our top picks.
UTILITIES: 1QFY12 for most companies was marked by lower generation, merchant realization. Performance of NTPC andPowergrid was lower due to SEBs backdown / lower capitalization. Coal India performance was marginally above estimates dueto better e-auction volume/realization and lower cost. Our top picks in the sector are NTPC, Coal India and Powergrid.
August 2011 4

MOSL Universe: Jun-11 Quarter Performance (Rs b)
August 2011 5

MOSL Universe: Jun-11 Quarter Performance1QFY12 SECTOR PAT GROWTH (YOY, %): OIL & GAS, PRIVATE BANKS LEAD THE PACK1QFY12 SECTOR PAT GROWTH (YOY, %): OIL & GAS, PRIVATE BANKS LEAD THE PACK
PAT growth was led by Oil & Gas Ex-RMs (+41% YoY, led by Cairn India), , y ),
Utilities (Coal India) followed by Private
Banks (+31%). Several domestic sectors grew well below the average
SECTOR PAT VARIANCE FROM ESTIMATES (%): OIL & GAS, INFRASTRUCTURE DISAPPOINTS
well below the average.
Underperformers over our estimates Infra (-
11%), Metals (-10%), Oil & Gas Ex RMs ( 8%)Gas Ex RMs (-8%)
August 2011 6
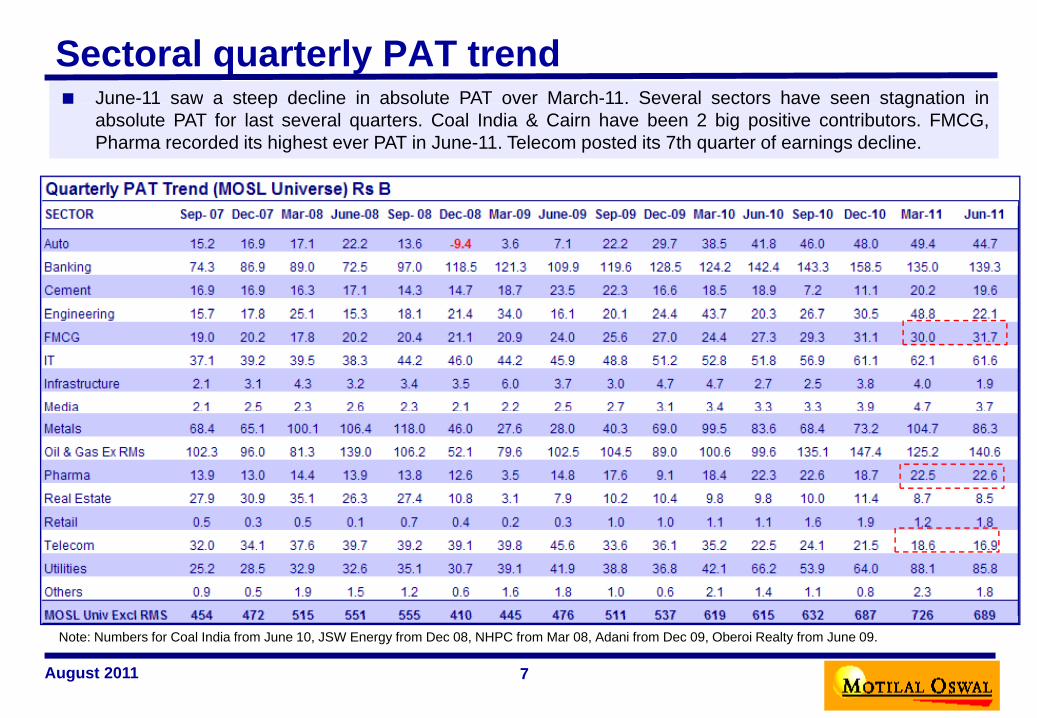
Sectoral quarterly PAT trend June-11 saw a steep decline in absolute PAT over March-11. Several sectors have seen stagnation inJune 11 saw a steep decline in absolute PAT over March 11. Several sectors have seen stagnation in
absolute PAT for last several quarters. Coal India & Cairn have been 2 big positive contributors. FMCG,Pharma recorded its highest ever PAT in June-11. Telecom posted its 7th quarter of earnings decline.
August 2011 7
Note: Numbers for Coal India from June 10, JSW Energy from Dec 08, NHPC from Mar 08, Adani from Dec 09, Oberoi Realty from June 09.

1QFY12: PAT growth of 12% YoY
MOSL Universe (Excl RMs) PAT has flattened for
last 3 qtrslast 3 qtrs.
MOSL Universe (Excl RMs)
growth of 12% YoY and decline
of 5% QoQ in 1QFY12.
August 2011 8

Sensex Performance: Actual v/s EstimatesTREND IN SENSEX SALES GROWTH (%): ACTUAL V/S ESTIMATES
1QFY12 sales grew 26%, in-line with estimates of 25%. Several sectors saw sales growth of >20%, with leaders being Oil & Gas (40%),
( %) ( %)Metals (26%), Telecom (26%).
While inflation has been a key contributor to growth, volumes have seen moderation.
Sectors to report low growth were
TREND IN SENSEX EBITDA GROWTH (%): ACTUAL V/S ESTIMATES
Sectors to report low growth were Infra, Pharma, Media & Real estate.
EBIDTA grew 15%, against estimate of 17%. Margin pressures were seen across sectors.
Oil & Gas (25%), Utilities (25%)Oil & Gas (25%), Utilities (25%) and Telecom (23%) were big drivers.
Sectors where growth rates were low: Metals, Financials & Autos.
August 2011 9

TREND IN SENSEX PAT GROWTH (%): ACTUAL V/S ESTIMATES
Sensex Performance: Actual v/s EstimatesTREND IN SENSEX PAT GROWTH (%): ACTUAL V/S ESTIMATES
1QFY12 performance has been in-line with estimates.
7 companies lagged, while 10 outperformed.
1QFY12 PAT GROWTH (YOY, %): SBI, BHARTI, TATA STEEL AMONG KEY LAGGARDS
SBI, Bharti, Tata Steel, DLF, Sun Pharma, JSPL and Cipla were laggards.
Sterlite, Coal India, HDFC Bank, ICICI Bank, TCS, ITC were among key leaders.
August 2011 10

Sensex Companies’ Performance
August 2011 11

Comparison of Earnings Based on Growth Rates For 1QFY12, 21% of the companies in MOSL
Universe reported earnings growth of over 30%. This is lowest in past years.
31% of MOSL universe companies reported 31% of MOSL universe companies reported negative earnings growth.
23% of MOSL Universe companies reported earnings growth of 15-30%.
% OF COMPANIES EARNINGS GROWTH > 30%
August 2011 12

PAT Deviation (Above vs Below)
The performance of Sensex companies was better than the MOSL Universe.
August 2011 13

Jun-11 Quarter Results: The Best & The Worst (>$5B Mktcap)
August 2011 14

Jun-11 Quarter Results: The Best & The Worst (<$5B Mktcap)
August 2011 15

Highest Earnings Upgrade / Downgrade (>$5B Mktcap)
August 2011 16

Highest Earnings Upgrade / Downgrade (<$5B Mktcap)
August 2011 17

Sensex Companies’ EPS Upgrade/Downgrade
August 2011 18

Sectoral EBIDTA Margin Trend (%)EBIDTA Margins have declined for many sectors in MOSL Universe in 1QFY12. At aggregate level, EBIDTA margins dropped by 170bps YoY.
August 2011 19
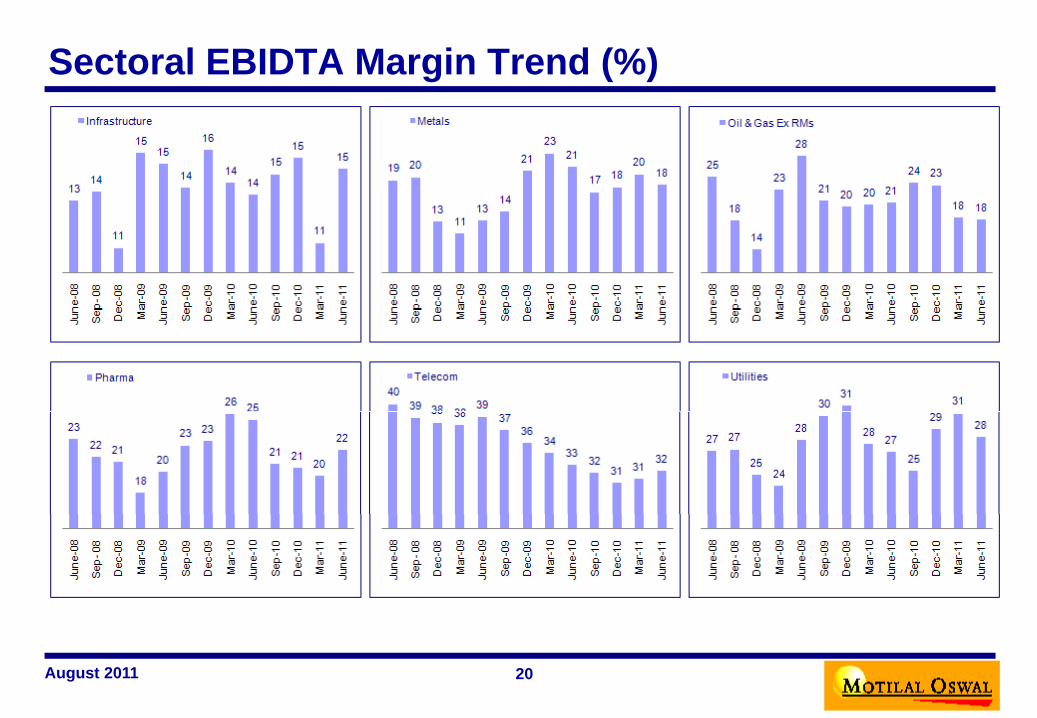
Sectoral EBIDTA Margin Trend (%)
August 2011 20

Markets reaction on quarter performance
August 2011 21

FY12 EPS downgrade by 2% at Rs1158; CAGR of 16% till FY13EARNINGS GROWTH REVIVAL FROM FY11 AFTER FY08-10 GROWTH HOLIDAYEARNINGS GROWTH REVIVAL FROM FY11 AFTER FY08-10 GROWTH HOLIDAY
TREND IN FY12E SENSEX EPS REVISION TREND IN FY13E SENSEX EPS REVISION
August 2011 22
New Series is inclusion of Coal India & Sun Pharma in Sensex

Current valuations below decadal averageSENSEX P/E (x) SENSEX P/B (x)SENSEX P/E (x) SENSEX P/B (x)
SENSEX ROE (%) SENSEX EARNINGS YIELD Vs BOND YIELD (%)
August 2011 23

June-11 Quarter Results: Deviation from Est. (Companies)PAT DEVIATION (135 COMPANIES)EBITDA DEVIATION (135 COMPANIES)
O th EBITDA f t 41 i d ti t hil 49 f ll h t On the EBITDA front, 41 companies surpassed estimates while 49 fell short.
On the PAT front, 47 companies surpassed estimates while 47 fell short.
August 2011 24

1QFY12 Results Review: Sectoral ContributionSECTORAL CONTRIBUTION TO EBIDTA (%) 1QFY12SECTORAL CONTRIBUTION TO EBIDTA (%) – 1QFY12
Oil & Gas (15%) and PSU BanksOil & Gas (15%) and PSU Banks (15%) are the biggest
contributors to EBITDA for 1QFY12.
SECTORAL CONTRIBUTION TO PAT (%) – 1QFY12
Metals (14%) and Utilities (14%) are the biggest contributors to gg
PAT for 1QFY12.
August 2011 25

June-11 Quarter Sector Margins: Actual v/s Estimates
August 2011 26

Sector Snapshots
August 2011 27

AUTO: Mixed bag; RM cost hit marginsSummary
3,800
4,400
40%
60%Industry ('000 units) Growth (%)
y Volume growth moderation visible in passenger vehicles
and M&HCVs only. Other segments’ volume growth continues to be good.
Margin contraction on account of RM cost push, partly diluted by better operating leverage. RM cost has stabilized t hi h l l t d ti i th i t
2,000
2,600
3,200
1QFY08 3QFY08 1QFY09 3QFY09 1QFY10 3QFY10-20%
0%
20%
at higher levels; expect moderation in the coming quarters. FY12 EPS downgrades: Tata Motors (14.6% due to higher
cost push and tax in JLR), Bajaj Auto (3.8% due to lower treasury income) and M&M (5.2% due to consolidation of Ssangyong).
Multiple headwinds in form of increasing cost ofMultiple headwinds in form of increasing cost of ownership (price hike, hardening interest rates) and cost of operations (fuel prices hike) would impact demand in near term. However, softening commodity prices and peaking-out of interest rates positive sign for medium term.
Top picks: M&M and Bajaj Auto.
Volume growth moderation in cars & M&HCVs RM stable at higher levels; expected to moderate TTMT: 2nd consecutive qtr of negative surprise
August 2011 28

CEMENT: Above est on higher realizations; upgrades exceed downgrades
SummarySummary 1QFY12 volumes continue to disappoint, flat YoY. Realizations surprised positively, up INR10/bag QoQ;
EBITDA/ton improved INR7/bag QoQ. FY12 EPS changes: Upgrades of ~12% for UTCEM, 4% g pg
for ACC and 40% for ICEM. However, ACEM saw downgrade of ~9% and SRCM ~13%.
Next six months would be challenging for the industry as it enters seasonally weak period with muted demand. Prices have already corrected INR10-20/bag. We estimate INR15-20/bag lower realizations in 2HCY11 from 1QFY12 level. Expect high volatility in cement prices and cement companies’ performance over next 6-9 months.
Top Picks: Ambuja Cement, UltraTech and Birla Corp.
1QFY12 industry volume growth remains muted since 4QFY10 Profitability significantly below peak levels, despite peak realizations
August 2011 29

Summary 1QFY12: ACTUAL VS ESTIMATES
CONSTRUCTION: Poor order intake, interest burden impacting profitabilityy
Order intake weak: Order intake remained poor duringthe quarter, declining by 37% YoY. Order intake remainedmuted for Simplex (INR8.7, down 70%) and HCC (INR10,down 37%). Gammon reported no new orders during thequarter. Adverse macro environment and rising interestrates have badly impacted project awards in recentquarters, which is expected to continue in the near term.
Payment delays by clients have forced constructioncompanies to slow down execution, which has impactedrevenue growth in recent times. Revenues grew by 5.1%YoY d ring the q arter s 13 5% in 1QFY11
Aggregate sales growth remains subdued due to execution concerns
64.1%
64.3%
70.7%
64.8%
33.7% 49
.6%34
.5%
30.5%
4.0%
5.9%
% % .5% % 7.1%
% %YoY during the quarter vs. 13.5% in 1QFY11. EBITDA margins remained flat YoY. However increasing
interest rates have impacted PAT margins. Interest rateswhich stood at 3.4% of revenues in 1QFY11 has jumped to5.4% in 1QFY12.
Top Pick: NCC
14 15
7.6%
5.9% 13
5.8% 17
5.4%
5.1%
1QFY08
2QFY083QFY084QFY08
1QFY092QFY09
3QFY094QFY091QFY10
2QFY103QFY10
4QFY101QFY112QFY11
3QFY114QFY11
1QFY12
Top Pick: NCCPoor order intake growth in 1QFY12; at INR41b, down 37% YoY EBITDA margins flat YoY; Higher working capital and rising interest
rates impact net margins
160200
Gammon HCC IVRCL NCC Simplex
10.110.211.09.89.79.59.19.610.39.99.5
7 69.810.29.7
7 1
9.7
EBITDA Margin (%) PAT Margin (%)
04080
120160
QFY08
QFY08
QFY09
QFY09
QFY10
QFY10
QFY11
QFY11
QFY12
7.6 7.15.1
4.04.53.83.73.52.74.4
2.83.32.83.72.92.42.02.81.4
FY08
FY08
FY09
FY09
FY10
FY10
FY11
FY11
FY12
30
1Q 3Q 1Q 3Q 1Q 3Q 1Q 3Q 1Q 1QF
3QF
1QF
3QF
1QF
3QF
1QF
3QF
1QF

ENGINEERING: Growth moderates; margins declineSummary Results below estimates; only L&T beats estimatesy Sector performance was below estimates except for
L&T and Thermax. BHEL, Crompton Greaves and Cummins revenue was below estimate. Profitability was hit by rising input costs, though L&T surprised positively. Sector OPM at 12.3% was down 98bp impacted by rising input costs. Crompton Greaves reported disappointing results, with consolidated profit declining by 59% YoY.
Order intake declined 21% YoY impacted by declining orders in power sector. BHEL and CG saw significant decline in orders. L&T posted 4% YoY growth in orders dri en b pick p in infrastr ct re and oil & gas Onl
Margins under pressure impacted by rising input pricesdriven by pick up in infrastructure and oil & gas. Only Siemens and ABB posted good growth driven by industrial demand.
Top picks: Crompton Greaves and ABB witnessed significant earnings cut during the quarter; Siemens was downgraded to Neutral as it achieved our target price
Order intake: down 21% YoY led by decline in Power segment
Revenue growth (% YoY): 1QFY12 growth buoyant at 16%
downgraded to Neutral as it achieved our target price. L&T is top pick in the space.
August 2011 31

FINANCIALS: PSUs – operationally weak qtr; Pvt banks outperform Profits in-line with expectation; though a mixed bag: For CU Moderation in business growth: Our coverage universe (CU)
NII growth of 20% was marginally lower than estimates on highermargin declines. BOI and Canara disappointed. Positive marginsurprise came from SBI. Operating profit growth was lower thanexpected due to muted fees and higher opex. BoB and Axissurprised positively on fees. Lower provisions for Axis, OBC andmid-cap private banks led to higher than expected profit growth.
witnessed moderation in business growth with loans anddeposits growth of 1-2% QoQ vs industry growth of 4-5% each.CU Credit to Deposit ratio remained stable QoQ at 77%.
Sharp moderation in margins for PSU banks: PSU banks’margins moderated sharply QoQ led by higher slippages andlag impact of deposit repricing SBI and Andhra surprised p p g p p g
Valuations at 5-year average though near-term uncertaintyprevails: In FY12, we expect significant volatility in quarterlyearnings due to highly volatile quarterly earnings of FY11 onaccount of opex and provisions. While margins are likely todecline, they will still be near the FY04-09 average. Strongoperating leverage and lower credit cost will be the key earnings
lag impact of deposit repricing. SBI and Andhra surprisedpositively with 25bp+ and 10bp improvement in margins. Sharpmoderation of 40bp+ QoQ in margins witnessed for BOI, Canaraand Indian Bank. Private banks’ NIM performance was relativelybetter than PSUs with max drop of 20bp (except IVB at 28bp).
Slippages up; pvt banks fare better: For CU, GNPAs were up 8% Q Q M t PSU b k hi h li tl l d b
NIM %NII Fee Income PAT Gross NPADeposits Loans
operating leverage and lower credit cost will be the key earningsdrivers in FY12. Valuations are at the average of last five years,and we believe risk-reward ratio is favorable. Our top sector picksare: SBIN, AXSB, ICICI and PNB.
8%+ QoQ. Most PSU banks saw higher slippages partly led by CBS-led NPA recognition and agri NPAs – Canara, SBI, BoI. Upgradations were impressive for SBI, PNB, Union Bank. Private banks continued to enjoy strong asset quality.
% Growth QoQ % YoY % QoQ % YoY % QoQ % YoY % QoQ % YoY % QoQ % YoY % QoQ % YoY % 1QFY11 4QFY11 1QFY12SBI 20.4 32.8 -29.4 9.3 N.A. -45.7 1.7 16.5 1.9 18.0 9.6 33.3 3.18 3.07 3.62 PNB 2.8 19.9 4.4 36.8 -8.0 3.4 3.6 26.9 0.3 23.4 11.7 35.4 3.91 3.91 3.84 Canara -9.2 3.8 -13.1 27.0 -19.4 -28.4 2.1 25.7 1.2 23.7 16.7 41.5 3.01 2.85 2.42 BoB -12.1 23.6 -17.4 27.8 -20.2 20.2 2.5 22.9 1.6 25.2 8.7 28.9 2.90 3.10 2.87 BoI -20.2 5.8 -21.0 16.9 4.8 -28.6 -1.9 25.4 -0.6 21.6 20.4 20.8 2.89 2.94 2.19 UBoI -7.4 18.0 -22.1 3.4 -22.3 -22.8 -1.6 16.4 -4.9 16.7 3.4 36.9 3.03 3.44 3.10 Coverage PSU 2.7 20.9 -21.9 12.9 17.6 -20.1 1.5 20.7 1.2 20.7 12.2 31.2 NA NA NAPrivate BankICICI Bk -3.9 21.1 -11.9 11.6 -8.3 29.8 2.2 14.8 2.0 19.7 -0.5 0.9 2.50 2.70 2.60 HDFC Bk 0.3 18.6 -6.9 19.9 -2.7 33.7 1.2 15.4 9.7 20.0 8.2 2.3 4.30 4.20 4.20 Axis 1.4 13.9 -14.1 40.4 -7.6 27.0 -3.0 24.5 -7.4 21.4 -1.6 17.3 3.71 3.44 3.28
August 2011
Coverage PVT -0.5 18.9 -11.1 20.6 -4.2 30.7 0.2 20.3 1.8 21.1 1.3 4.0 NA NA NACoverage Universe 1.8 20.3 -17.4 16.3 8.0 -5.7 1.2 20.6 1.3 20.8 7.7 19.0 NA NA NA
32

NIMs (QoQ chg in bp) contracted sharply for most banks
FINANCIALS: PSUs operationally weak qtr; Private bank outperform
SBI margin improve sharply; Mgmt guides for margin of 3 5%+NIMs (QoQ chg in bp) contracted sharply for most banks SBI margin improve sharply; Mgmt guides for margin of 3.5%+
0 08 10
55
2 73.0
3.2
3.43.6
3.1
3.6
-75
-43 -38 -34 -28
-4-13 -7 -9
oI * * oI B C al B B B s a K BI
2.42.3
2.6
2.7
09 10 10 10 10 11 11 11 11 12
Slippages remain at an elevated level (INR b)Fee income growth: PNB, BoB surprised +ve while SBI disappointed (%)
Bo
Can
ara
SIB
UB
o
IVB
OB
C
Fede
ra
PN
B IIB
HD
FCB
Yes
Andh
ra
J&K
SB
8 4 4 8
4QFY
0
1QFY
1
2QFY
1
3QFY
1
4QFY
1
1QFY
1
2QFY
1
3QFY
1
4QFY
1
1QFY
1
3.4
3.7 5.3 7.6 9.3 11
.6
13.1
16.0
16.9 19.9 27
.0
27.8 36
.
40.
44.
56.5 61
.84QFY11 1QFY12
-27.
5
-5.3
-4.4
ndia
n
J&K
ndhr
a
UBo
I
dera
l
OB
C
IVB
SB
I
ICIC
I
SIB
Yes
BoI
DFC
B
anar
a
BoB
PN
B
Axi
s
IIB
2.8
1.9 6.
5
6.7
4.1
12.5 18
.4
10.0
1.7
2.4 3.8 5.8 7.7 11
.8
13.7 16
.8
August 2011 33
In An
Fed I
HD Ca Indian Andhra OBC BoB UBoI PNB Canara BoI SBI

FMCG: Healthy volume growth; RM pressure continues to dent marginsSummary Quarterly Financial Highlights
3,800
4,400
40%
60%Industry ('000 units) Growth (%)
y Volume growth healthy: Except for HUL and Dabur, all
others posted healthy volume growth with Marico, GSK Consumer and Godrej Consumer positively surprising; ITC’s cigarette volumes increased by ~8%.
Input cost pressures continued with gross margin
2,000
2,600
3,200
1QFY08 3QFY08 1QFY09 3QFY09 1QFY10 3QFY10-20%
0%
20%decline of 300bp for coverage universe
Steep ad spend cuts in HUL, Dabur and Marico enabled to protect margins; low levels of ad-spend unsustainable
PFAD prices steady after decline in 1Q; LAB and milk prices at life high; copra prices up 10% after 20% decline.
Top picks: ITC and Pidilite Downgrades: Nestle and GSK Consumer cut to Neutral
on rich valuations.
Healthy volume growth trend across companies (except HUL)Gross margin contraction for 11 out of 12 companies
August 2011 34

IT SERVICES – Volumes disappoint, margins in-lineSummary 1QFY12 volume growth disappointed for Infosys and HCL
Tech; Wipro volumes, though above estimate, grew only 1.4% QoQ. But revenue growth was in-line on cross-currency gains.
Pricing trend took a breather in 1Q, and any upticks seen in the quarter were on reported currency (aided by cross currency) and on revenue mix shift in favor of onsiteon revenue mix shift in favor of onsite.
Margin decline for TCS and Infosys were in-line, Wipro was marginally below estimates, HCL was above estimate.
Infosys’ FY guidance of 18-20% was in-line; but 2Q guidance of 3.5-5% puts the burden of growth on 2H. Wipro’ organic growth guidance of 0-1.9% QoQ implies continued restructuring impact.
EPS upgrade at TCS, downgrades at Infosys and Patni
g g EPS CAGR of 12.7-24%: Over FY11-13, expect top-4 US$
revenue CAGR of 16.2-23.5% and EPS CAGR of 12.7-24.1%. Double-dip a key risk: Uncertain macro leading to deferral in
spends and cutback on a double-dip recession are key risks. Top picks: Infosys, HCL Tech, Wipro.
US$ Revenue Growth - QoQ (%)
10.211.7
Infosys TCS Wipro HCLTQoQ Volume growth - %
5.8 5.6
7.4 Estimate Actual
EBITDA Margins across top-tier
34%38%
Infosys TCS Wipro (overall) HCLT
Volumes above est. at TCS, Wipro (organic)Revenue: Only TCS surprised positively Margins: Declined (ex HCL) on wage hikes
0.54.34.8
1.1
5.9
10.2
7.56.44.7
7.0
3.2 4.2
5.7 5.6
7.5
5.3
9.0
5.87.7
Jun-10 Sep-10 Dec-10 Mar-11 Jun-11
3.9
0.1
3.2
1.4
3
TCS Infosys - Overall Wipro - ITServices
HCL Tech - S/WServices
14%18%22%26%30%
1QFY
10
2QFY
10
3QFY
10
4QFY
10
1QFY
11
2QFY
11
3QFY
11
4QFY
11
1QFY
12
35

Summary 1QFY12: Actual v/s estimates
MEDIA: Strong ad momentum; Newsprint inflation a concern for print
2QFY10 3QFY10 4QFY10 1QFY11 2QFY11
y Ad revenue was impacted by overhang of heavy advertising in
sports segment (CWC, IPL), and relatively weak macro environment. HT Media had the highest ad growth driven by English segment.
All media companies in our universe reported lower-than t d d PAT J did t t lid t d
832
1,38
7
646
653
1,26
6
746
633
813
929
902
1,19
9
799
908
1,17
9
791
Jagran Prakashan Deccan Chronicle HT Media
expected revenue and PAT. Jagran did not report consolidated results (including Mid-Day), excluding which the revenue and PAT miss was relatively lower.
Zee reported INR566m EBITDA loss in sports business (in line) and ~15% YoY EBITDA growth in non-sports (below est).
International newsprint prices have stabilized; domestic prices
YoY Ad revenue growth (%)
Jagran Prakashan Deccan Chronicle HT Media International newsprint prices have stabilized; domestic prices continue to firm up due to high prices of scrap paper.
Ad revenue growth could moderate further in 2QFY12 as recent commentary from media companies indicates no meaningful uptick in media spends. Pick-up in the festive season would be the key variable to watch-out.
EBITDA under pressure for DCHL and Jagran (INR m) Traction in DTH continues (INR m)
August 2011

METALS: Rising costs offsetting higher metal pricesSummary
1QFY12 PERFORMANCE SNAPSHOTNet Sales EBITDA Adj PATSummary
Despite softening steel prices, average realizations of key steelproducers increased 1-5% QoQ due to strong long product pricesand contracted volumes of flat products. Domestic steel demandremained sluggish due to seasonal factors and weakness in steelprices. However production volumes were in line.
Net Sales EBITDA Adj PATRs b YoY (%) Rs b YoY (%) Rs b YoY (%)
Tata Steel 330.0 21 44.2 0 14.3 -24JSW Steel 70.7 51 13.9 35 5.7 67SAIL 111.9 23 13.1 -29 8.4 -29JSPL 39.4 31 16.3 4 9.2 -2Sesa Goa 21.1 -13 11.5 -26 8.4 -39
There has been overall cost pressure due to rising coal and fuel oilprices for metal companies. Margins of key producers declinedQoQ (except Tata) due to higher operating costs mainly power andfuel. Higher RM costs were largely in line. Tata Steel’s marginexpansion was higher than estimates as it contained its operatingcosts although energy costs increased SAIL disappointed again
Nalco 17.6 35 5.3 35 3.8 33Hindal std. 60.3 16 8.7 4 6.4 21Sterlite 98.6 65 27.6 84 15.7 82Hind Zinc 28.5 44 15.9 56 15.0 68
costs although energy costs increased. SAIL disappointed againdue to higher than expected costs and further delays in expansion.
Mid-cap companies were affected due to (1) sluggish demand,(2) falling steel prices, (3) higher coal, and (4) interest rates.Godawari and Prakash Industries outperformed amongst peers dueto good performance of pellet plant and captive mines. STEEL: REALISATION PER TON (US$/TON)
Performance of non-ferrous companies was in-line due tostrong LME which compensated for higher coal costs and slightlysluggish demand; although metal volumes were in-line. Hindalcoexperienced sluggish demand in domestic FRP market in 1Q.
JPC data suggests slowdown in real finished steel consumptiond i 1Q j t 1 5% Y Y d t 10 6% f FY11during 1Q, up just 1.5% YoY as compared to 10.6% for FY11.
Top picks: Tata Steel and Hindalco. Tata’s earnings will grow dueto strong volume growth in high-margin business while Hindalcoappears attractive on less volatile cash flows, strong volume growthin emerging markets by Novelis, and ongoing high-margin domesticgreenfield projects.
STEEL: EBITDA PER TON (US$/TON)
August 2011
g p j

OIL & GAS: OMCs report loss; GRMs hit; petchem margins lowerSummary 1QFY12: ACTUAL VS ESTIMATESummary OMCs in loss due to lower govt sharing: As against our
estimate of 58%, govt shared only 33% under-recovery in 1QFY12 resulting in OMCs reporting losses. We expect final subsidy sharing to be clear in 4Q. We model upstream share at 38.7%/33% in FY12/13 and downstream share at 6%/13%
bli h R E b 10%enabling them to report RoE above 10%.
Upstream: KG-D6 production down, Cairn’s Rajasthan production stuck at 125kbpd: KG-D6 volume decline continued in 1Q with volumes at 48.6mmscmd (v/s 51 in 4QFY11); concerns remain on timelines of further ramp up.4QFY11); concerns remain on timelines of further ramp up. Cairn’s Rajasthan production is stuck at 25kbpd.
Midstream: Lower domestic gas production benefits Petronet LNG. Headwinds for volume ramp-up remain for gas transmission companies, GAIL and GSPL. Singapore GRM up QoQ to USD8.5/bbl in 1QFY12
Refining: Crude inventory loss impacts GRM; expect to remain range bound: Led by US$7/bbl decrease in crude prices in 1QFY12, reported GRMs of oil PSUs were impacted. RIL’s premium to benchmark Reuters Singapore GRM remained flat QoQ at USD1.8/bbl. Q Q
Petchem margins hit by de-stocking: Polyester margins were impacted by lower cotton prices while de-stocking at customer end due to price volatility impacted polymer margins. Except pressure to remain in near-term.
August 2011 38
Top Picks: Petronet LNG, ONGC

OIL & GAS: KG-D6 production down; Cairn’s production stuck at 125kbpd ONGC: Higher well write-off increase D,D&A YoY (INRb)Subsidy ad-hoc; model 38 7% upstream sharing in FY12 ONGC: Higher well write off increase D,D&A YoY (INRb)Subsidy ad hoc; model 38.7% upstream sharing in FY12
Cairn production stuck at 125kbpd for government approvals KG-D6 volume decline benefits Petronet LNG (mmscmd)
August 2011 39

PHARMA: CRAMS above est; Generics/MNCs below estSSummary Sector aggregate: Overall performance was in-line. Revenues in-line except for CRAMS players which outperformed. Revenue
above/in-line with estimates except for Cipla, Cadila, and Biocon. EBITDA above/in-line with estimates except for Aventis, Biocon,Cadila, DRL, GSK and Ranbaxy.
Generics: Adj PAT in line; Sun Pharma , Dr Reddy, Glenmark, Torrent Pharma and Strides outperform while Cipla, Biocon andCadila disappoint.
CRAMS: Divi’s PAT in-line with estimates; Dishman and Jubilant above estimates led by better operational performance Top Picks: Cipla, Torrent Pharma, Divi’s Labs and GSK Pharma.
August 2011

REAL ESTATE: Margin declined; new launches sluggish; leverage widenedSummary Launch muted for most players, sales volume down Sluggish launch and sales momentum continues barring
encouraging response in some mid-income projects and plotted sales . Bangalore remained the steadiest metro. Approval delay continues to impact launch plan.
Commercial leasing has been mixed bag. DLF, IBREL witnessed slower run-rate; Prestige volumes were stronger withwitnessed slower run rate; Prestige volumes were stronger with 1msf leasing as against overall 1.9msf in FY11.
EBITDA margin declined YoY for our coverage universe due to cost pressure and change in revenue-mix. PAT impact was higher due to increasing interest cost (PAT margin of 22% v/s 27% in 1QFY11).L i d f t d l l ith hi h t Leverage increased for most developers along with higher cost of debt (50-125bp) worsening the liquidity pressure. De-leverage plan is yet to gain traction for DLF.
Focus on faster cash flow generation is visible including plotted sales (DLF, Anant Raj), FSI sales (HDIL), project level equity dilution (GPL) or lower capex to annuity assets.
Net debt up for most cos. …so also cost of debt (%)
q y ( ) p y Top picks: Oberoi Realty, Prestige in mid caps. DLF will
outperform if de-leveraging plan takes off.
YoY growth indicates margin pressure continues, while liquidity pressure has increased DLF: Yet to see traction in de-leveraging plan
August 2011 41

S
TELECOM: Stable quarter; tariff hikes to flow through in a yearSummary 3-7% traffic growth: Wireless traffic grew 7% QoQ for
Vodafone/Idea, 5% for Bharti (India) and 3% for Rcom. Stable RPM trends; on average RPM declined by 1% QoQ. Divergent revenue growth; Idea lead the pack with 7% QoQ
revenue growth followed by Bharti/Vodafone India at 4-5%. RCom reported 7% QoQ decline in adjusted revenue primarily led by global and broadband segment.
Margins improve: Idea’s margin improved sharply led by operating leverage. RCom reported improvement in margin thus leading to flat QoQ EBITDA despite sharp revenuethus leading to flat QoQ EBITDA despite sharp revenue decline. Bharti’s EBITDA margin remained broadly stable QoQ.
Multiple factors hit PAT: Increased D&A, finance costs (primarily related to 3G licence fee amortization) and higher tax rates (80IA benefits expired for older circles).
Recent tariff hikes (take by all four majors) should lead to ( y j )gradual improvement in voice RPM over the next four quarters. 3G services should also add 3-5% incremental RPM by FY13.
Outlook positive: New National Telecom Policy (NTP) 2011 will be finalized by end-2011 and is expected to establish liberal M&A, spectrum sharing, uniform license fee pan-India, and regulatory clarity on 2G spectrum pricing Revenue &
QOQ WIRELESS TRAFFIC GROWTH and average RPM (%)
# Adj for change in accounting for IRU sales
and regulatory clarity on 2G spectrum pricing. Revenue & EBITDA growth is expected to rebound in FY12 driven by robust traffic growth, RPM inflection and launch of 3G services. Recent tariff hikes, steps to rationalize channel incentives/ commissions, and organizational restructuring by telecom companies point towards decline in the competitive intensity.
August 2011
Top picks: Bharti, Idea

UTILITIES: Operational performance muted, Lower PLF across the sector 1QFY12 operational performance for most companies was Reported v/s Estimated performancep p p
lower / in-line, due to lower generation, merchant realization. NTPC coal plants’ PLFs declined 250bp YoY, while PAT was
higher due to gross up of corporate tax. Generation at NHPCplants was robust at 11% YoY. FY12 capacity addition targetreduced to 0.5GW v/s 1.1GW earlier. PGCIL capitalization
d INR8b / i f INR20b PAT b d bstood at INR8b v/s our estimates of INR20b; PAT boosted byhigher other income.
Tata Power standalone PAT was impacted due to lowergeneration / merchant profitability. Reported PAT includedhigher dividend income from Coal SPVs.
CESC’s power profitability intact Spencer store level CESC s power profitability intact, Spencer store levelEBITDA increased to INR36/sft/mth v/s INR6/sft/mth YoY.Reliance Infra performance boosted by higher EPCbusiness revenues and margins.
Adani Power and JSWEL saw lower generation by 24%and 20% compared to estimates. Lower generation was led
EPS revision (INR)
p gby less drawal from SEB and plant maintenance.
Coal India PAT boosted by higher e-auction volumes/realization and higher other income.
Top picks: Coal India, NTPC and Powergrid.
Merchant realization (INR/Unit)Merchant realization (INR/Unit)
August 2011

MOSL Universe: Annual Performance (Rs b)
August 2011 44

MOSL Universe: Valuations
August 2011 45

For information, please contact
Navin Agarwal, ACA, CFACEO I tit ti l E iti
Rajat Rajgarhia, ACA, MBADi t R hCEO - Institutional Equities
Tel: +91 22 39825450 Mobile: +91 98201 58913
Email: [email protected]
Bl b i 100@bl b t
Director - Research
Tel: +91 22 39825441 Mobile: +91 98202 69614
Email: [email protected]
Bl b j t j@bl b tBloomberg: [email protected] Bloomberg: [email protected]
Motilal Oswal Securities Ltd, 3rd Floor, Hoechst House, Nariman Point, Mumbai 400 021
BOARD: +91 22 39825500 DEALING: +91 22 22811800 FAX: +91 22 22885038
BLOOMBERG: [email protected] WEBSITE: www.motilaloswal.com

This report is for the personal information of the authorized recipient and does not construe to be any investment, legal or taxationadvice to you. Motilal Oswal Securities Limited (hereinafter referred as MOSt) is not soliciting any action based upon it. This report isnot for public distribution and has been furnished to you solely for your information and should not be reproduced or redistributed toany other person in any form.
The report is based upon information that we consider reliable, but we do not represent that it is accurate or complete, and it shouldnot be relied upon such. MOSt or any of its affiliates or employees shall not be in any way responsible for any loss or damage thatmay arise to any person from any inadvertent error in the information contained in this report. MOSt or any of its affiliates oremployees do not provide, at any time, any express or implied warranty of any kind, regarding any matter pertaining to this report,including without limitation the implied warranties of merchantability, fitness for a particular purpose, and non-infringement. Therecipients of this report should rely on their own investigations.
MOSt d/ it ffili t d/ l h i t t / iti fi i l th i i th iti ti d i thiMOSt and/or its affiliates and/or employees may have interests/ positions, financial or otherwise in the securities mentioned in thisreport. To enhance transparency, MOSt has incorporated a Disclosure of Interest Statement in this document. This should, however,not be treated as endorsement of the views expressed in the report.
This information is subject to change without any prior notice. MOSt reserves the right to make modifications and alternations to thisstatement as may be required from time to time. Nevertheless, MOSt is committed to providing independent and transparentrecommendations to its clients and would be happy to provide information in response to specific client queriesrecommendations to its clients, and would be happy to provide information in response to specific client queries.
47

Motilal Oswal India Strategy Gallery