1q’17 - srenc.com county 31,827,419 602 2,164,391 3.8% 346,904 0 0 $2.58 cleveland county...
TRANSCRIPT

Charlotte Industrial Market Report1Q’17

Charlotte’s 4.4% Unemployment Rate is below 2016 levels and below the national average as well.Charlotte’s Local Economy
Charlotte’s economy kept chugging along in 2016, with better-than-average GDP and job growth. This year’s economic picture is less clear. The U.S. economy grew at its slowest pace in three years during the first quarter amid sluggish consumer spending. The national GDP grew at a 0.7% annual rate, according to the Commerce Department. This was below estimates and marked the lowest growth in three years.
On the upside, the U.S. labor market is near full employment, so the first-quarter setback might be temporary. The Charlotte Chamber reports that Mecklenburg County’s unemployment rate fell to 4.4% in March, down from 5.3% the prior year. The number of people employed locally is rising at a faster pace than the country as a whole.
Mecklenburg County’s Consumer Price Index in March was unchanged from the previous month. The average home price for March rose 10% from the prior year to a new high of $307,412, according to the Charlotte Chamber. Monthly retail sales volume rose sharply early in the first quarter but has since declined.
Charlotte Market Overview
The vacancy rate for Charlotte’s industrial market stood at 4.6% during the first quarter, slightly lower than the rate at the end of 2016 and down from 6.7% a year earlier. It was the first time this decade the rate dipped below 5%.
Tenants moving into large blocks of space during the quarter included Pinpoint Warehousing, which took over 175,000 square feet on Tar Heel Road in Northwest Charlotte. Elite Logistix moved into 126,000 square feet at Rock Hill’s Legacy Park.
The largest lease signing during the quarter was Fireside Heart and Home Technologies’ deal for a 102,660-square-foot showroom and distribution center at Steele Creek Commerce Center in Southwest Charlotte. The new facility will have about 40,000 square feet more space than the company’s former facility at NorthPark Business Park.
Greater Charlotte Area(28 ± Mile Radius from Uptown Charlotte)
2017 1Q
Total Number of Buildings 5,733
Total Square Feet 221,445,105
Average Asking Rates $4.46
Overall Vacancy 4.4%
Net Absorption 1,137,788 SF
Deliveries 281,162 SF
Under Construction 4,068,372 SF
Charlotte, North Carolina
1Q 2017 INDUSTRIAL Market Report
9.7%9.3%
9.1%8.7% 8.6% 8.3%
7.8%
6.7%
6.3%6.1%
6.4%6.1%
6.5%6.1%
5.8%
5.0% 4.4%
3%
4%
5%
6%
7%
8%
9%
10%
7.1% Average Vacancy Rate
Vacancy Rates
$2.00
$2.50
$3.00
$3.50
$4.00
$4.50
$5.00
-1,000,000-500,000
0500,000
1,000,0001,500,0002,000,0002,500,0003,000,0003,500,0004,000,0004,500,000
Absorption (RSF) / Asking Rates
2.0%3.0%4.0%5.0%6.0%7.0%8.0%9.0%
10.0%11.0%12.0%13.0%14.0%
Charlotte Unemployment Rate
Avg. Asking Rate Absorption SF
Copyright: NAI Southern Real Estate 2017Sources: CoStar, NAI Southern Real Estate
1Q16 vs. 1Q17
DELIVERIES ASKINGRATES
VACANCYRATE
NETABSORPTION

Other large lease signings were the 65,000-square-foot deal signed by Utility Partners of America in Gaston County; and the 36,122-square-foot lease signed by Maslo on Tar Heel Road in Northwest Charlotte.
Boston-based Albany Road Real Estate Partners spent more than $60 million to purchase 14 flex and industrial buildings in the Charlotte area in a handful of separate transactions. The properties total nearly 600,000 square feet and include 77 Overlook in north Charlotte, Lakefield Corporate Center in Mooresville, Southcross Corporate Center in Rock Hill, and International Corporate Center in Concord.
The industrial market’s net absorption for the quarter was 942,312 square feet. That compares to positive 2.2 million square feet the previous quarter and negative-389,065 square feet the previous year.
The average rental rate for service-type properties was $4.34 per square foot, which was the highest this decade. The rate was largely unchanged from the end of 2016 and up from $4.11 a year earlier. Average rental rates for net lease properties was $4.44 per square foot during Q1, about the same as the previous quarter and up from $4.27 the previous year.
Southwest CharlotteFireside Hearth & Home’s 102,660-square-foot deal at Steele Creek Commerce Center was the biggest lease signing in the Southwest Charlotte submarket during the first quarter. Other major deals in the submarket include a lease signing for 83,200 square feet at Ridge Creek West III; 40,000 square feet at 3311 Beam Road; and 24,054 square feet at Nations Ford Business Park.
Northwest CharlotteMaslo’s lease for 36,122 square feet on Tar Heel Road was the quarter’s biggest lease deal in the Northwest submarket. Another top transaction was for 41,600 square feet at Northpark XVII.
AirportFoundry Commercial purchased a 106-acre tract of land for an industrial project in the Airport submarket. The property, formerly known as the Beltway Business Park, will be renamed WestPark 85. Foundry Commercial and capital partner Principal Real Estate Investors will develop 1.1 million square feet of industrial space at the site
Outlook Bullishness over Charlotte’s industrial market is reflected in a recent flurry of activity. A total of 18 buildings were under construction during the first quarter, covering 3.2 million square feet. The number of buildings matched the highest quarterly total over the past 10 years, while the square footage was the highest since the 2014 third quarter. Those are the only two quarters in the past decade when square footage under construction topped 2 million.
$3.00
$3.50
$4.00
$4.50
$5.00
2013
Q1
Q2
Q3
Q4
2014
Q1
Q2
Q3
Q4
2015
Q1
Q2
Q3
Q4
2016
Q1
Q2
Q3
Q4
2017
Q1
Class A Class B Class C
Meanwhile, Charlotte’s overall business environment is upbeat. A recent survey of business owners – conducted by SunTrust and reported on in the Charlotte Business Journal – reflected a generally bullish attitude about the national and local economies.
According to the survey, about 85% of Charlotte business owners surveyed say they are ready to achieve their financial plans and goals over the next five years. That’s higher than the national average of 77%. About 93% of Charlotte business owners say the current financial well-being of their companies is strong.
Asking Rates by Building Class
$2 $3 $4 $5 $6 $7 $8 $9 $10 $11
SouthCBD
Stanly CountyCleveland CountyCatawba County
Gaston CountyIredell County
I-85 / Beatties Ford RdLincoln CountyUnion County
Sugar CreekNortheast / University
Airport / WestNorth
Cabarrus CountySouthwest / 77
I-277 / 30th StreetYork County
EastTyvola Road
Freedom DriveI-277 / Remount Rd
Rates by Submarket
Copyright: NAI Southern Real Estate 2017Sources: CoStar, NAI Southern Real Estate
Charlotte, North Carolina
1Q 2017 INDUSTRIAL Market Report
*Class A-C covers the entire 28± Mile Radius Market
Total SFTotal #
of BuildingsTotal
Available SFVacancyRate %
NetAbsorption
DeliveriesUnder
ConstructionEnd of 1Q
Average Rental Rate
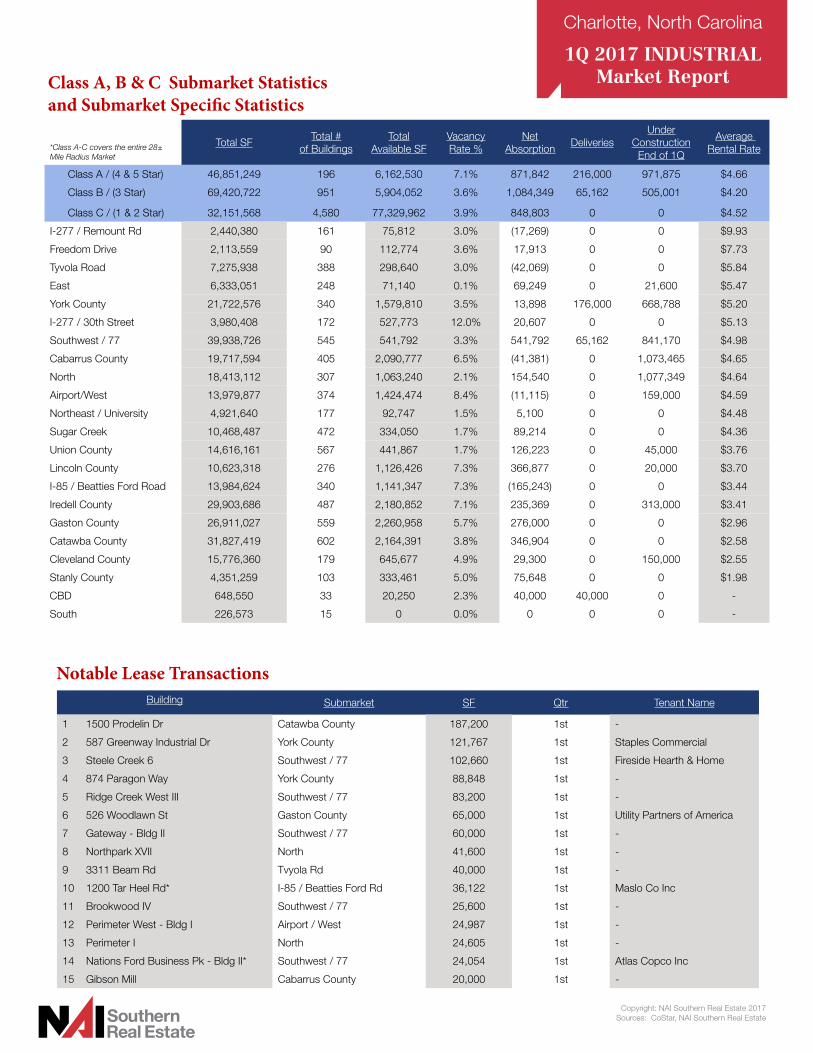
Class A / (4 & 5 Star) 46,851,249 196 6,162,530 7.1% 871,842 216,000 971,875 $4.66
Class B / (3 Star) 69,420,722 951 5,904,052 3.6% 1,084,349 65,162 505,001 $4.20
Class C / (1 & 2 Star) 32,151,568 4,580 77,329,962 3.9% 848,803 0 0 $4.52
I-277 / Remount Rd 2,440,380 161 75,812 3.0% (17,269) 0 0 $9.93
Freedom Drive 2,113,559 90 112,774 3.6% 17,913 0 0 $7.73
Tyvola Road 7,275,938 388 298,640 3.0% (42,069) 0 0 $5.84
East 6,333,051 248 71,140 0.1% 69,249 0 21,600 $5.47
York County 21,722,576 340 1,579,810 3.5% 13,898 176,000 668,788 $5.20
I-277 / 30th Street 3,980,408 172 527,773 12.0% 20,607 0 0 $5.13
Southwest / 77 39,938,726 545 541,792 3.3% 541,792 65,162 841,170 $4.98
Cabarrus County 19,717,594 405 2,090,777 6.5% (41,381) 0 1,073,465 $4.65
North 18,413,112 307 1,063,240 2.1% 154,540 0 1,077,349 $4.64
Airport/West 13,979,877 374 1,424,474 8.4% (11,115) 0 159,000 $4.59
Northeast / University 4,921,640 177 92,747 1.5% 5,100 0 0 $4.48
Sugar Creek 10,468,487 472 334,050 1.7% 89,214 0 0 $4.36
Union County 14,616,161 567 441,867 1.7% 126,223 0 45,000 $3.76
Lincoln County 10,623,318 276 1,126,426 7.3% 366,877 0 20,000 $3.70
I-85 / Beatties Ford Road 13,984,624 340 1,141,347 7.3% (165,243) 0 0 $3.44
Iredell County 29,903,686 487 2,180,852 7.1% 235,369 0 313,000 $3.41
Gaston County 26,911,027 559 2,260,958 5.7% 276,000 0 0 $2.96
Catawba County 31,827,419 602 2,164,391 3.8% 346,904 0 0 $2.58
Cleveland County 15,776,360 179 645,677 4.9% 29,300 0 150,000 $2.55
Stanly County 4,351,259 103 333,461 5.0% 75,648 0 0 $1.98
CBD 648,550 33 20,250 2.3% 40,000 40,000 0 -
South 226,573 15 0 0.0% 0 0 0 -
Class A, B & C Submarket Statisticsand Submarket Specific Statistics
Notable Lease TransactionsBuilding Submarket SF Qtr Tenant Name
1 1500 Prodelin Dr Catawba County 187,200 1st -
2 587 Greenway Industrial Dr York County 121,767 1st Staples Commercial
3 Steele Creek 6 Southwest / 77 102,660 1st Fireside Hearth & Home
4 874 Paragon Way York County 88,848 1st -
5 Ridge Creek West III Southwest / 77 83,200 1st -
6 526 Woodlawn St Gaston County 65,000 1st Utility Partners of America
7 Gateway - Bldg II Southwest / 77 60,000 1st -
8 Northpark XVII North 41,600 1st -
9 3311 Beam Rd Tvyola Rd 40,000 1st -
10 1200 Tar Heel Rd* I-85 / Beatties Ford Rd 36,122 1st Maslo Co Inc
11 Brookwood IV Southwest / 77 25,600 1st -
12 Perimeter West - Bldg I Airport / West 24,987 1st -
13 Perimeter I North 24,605 1st -
14 Nations Ford Business Pk - Bldg II* Southwest / 77 24,054 1st Atlas Copco Inc
15 Gibson Mill Cabarrus County 20,000 1st -
Copyright: NAI Southern Real Estate 2017Sources: CoStar, NAI Southern Real Estate
Charlotte, North Carolina
1Q 2017 INDUSTRIAL Market Report

Notable Lease TransactionsBuilding Submarket SF Qtr Tenant Name
16 Whitehall Technology Center II Southwest / 77 16,000 1st -
17 11301 Granite St Southwest / 77 13,201 1st The Life Center International
18 5100 Reagan Dr Sugar Creek 13,020 1st -
19 Shopton Ridge, 18-A Southwest / 77 12,800 1st Windy City Wire and Cable
20 3937 Corporation Cir I-85 / Beatties Ford Rd 12,290 1st -
21 1535 Center Park Dr Tyvola Rd 12,150 1st TiMotion
22 119 Spurgeon Brg Cleveland County 12,000 1st -
23 10350 Bailey Rd North 10,000 1st -
24 1846 Weinig St Iredell County 10,000 1st -
25 1846 Weinig St Iredell County 10,000 1st -
26 CLT Logistics Center - Building I Airport / West 8,654 1st -
27 7575 West Winds Blvd NW Cabarrus County 8,167 1st Osasis Alignment Services
28 Beltway Park at Union West Business Park Union County 8,000 1st Omni Elite Athletix
29 3204 Smith Farm Rd Union County 8,000 1st CEM Corporation
30 The Crossings @ Nations Ford E - E Blvd Southwest / 77 8,000 1st -
31 532 Patterson Ave Iredell County 7,895 1st -
32 9930 Industrial Dr Southwest / 77 7,500 1st -
33 3715 S Scott Futrell Dr Airport / West 7,320 1st -
34 Pinebrook I Southwest / 77 7,290 1st -
35 Pine Brook XI Southwest / 77 7,240 1st Med World Live
36 4901 Dwight Evans Rd Tyvola Rd 6,600 1st -
37 4901 Dwight Evans Rd Tyvola Rd 6,600 1st -
38 205 Quantz St York County 6,538 1st -
39 Whitehall Technology Park III Southwest / 77 6,447 1st -
40 3001 Chamber Dr Union County 6,000 1st -
Major Sales Transactions: 2016 through 1Q 2017Building(s)
Price SFPrice PSF
Seller Buyer
Lakemont West Business Park $63,000,000 969,633 $64.97 JP Morgan Investment Mgmt, Inc Hartz Mountain Industries, Inc
838 Lincoln County Pkwy $55,700,000 1,000,000 $55.70 Hartz Mountain Industries, Inc Stoneridge Realty & Investments
Carolina Beverage Group $14,900,000 155,417 $95.87 Carolina Beverage Group Columbus Nova MB, LLC
22 Pepsi Way $14,714,902 209,000 $70.41 The Keith Corporation Pepsi Bottling Ventures, LLC
10601 Westlake Drive $13,501,500 333,830 $40.44 L & J Schmier Mgmt & Investment AEGON USA Realty Advisors, Inc
6733 Craig Street $12,850,000 312,202 $41.16 Philip M Ramey Duke Energy Corporation
1001 Bond Street $12,200,000 404,351 $30.17 Global Logistic Properties, Ltd SilverCap Partners, LLC
The International Corporate Center $11,850,000 73,929 $160.29 J Portnoy Realty Albany Road Real Estate Partners
6301 Performance Drive SW $11,000,000 184,784 $59.53 Performance Drive Properties, LLC Haas Automation, Inc
Copyright: NAI Southern Real Estate 2017Sources: CoStar, NAI Southern Real Estate
* Renewal
Charlotte, North Carolina
1Q 2017 INDUSTRIAL Market Report

Charlotte
Concord
Rock Hill
Monroe
Fairview
Huntersville
Mint Hill
Kannapolis
Unionville
Weddington
Indian Trail
Fort Mill
Matthews
Mooresville
Cornelius
Midland
Belmont
Lake Norman of Catawba
Waxhaw
Newport
Lake Wylie
Catawba
Stallings
Denver
Lesslie
Pineville
Maiden
Mount HollyHarrisburg
Wesley Chapel
Lowesville
Westport
Tega Cay
Mineral Springs
Marvin
Landis
Enochville
Dallas
Lowell
Davidson
Cramerton
India Hook
Stanley
Salisbury
Ranlo
Wingate
High Shoals
Faith
Iron Station
Granite Quarry
China Grove
Riverview
Hemby Bridge
Mount Pleasant
JAARS
McAdenville
77
85
8585
74
74
485
485
485
485
485
49
29
7429
29
85
85
7477
601
601
321
5211677
21
21
16
16
521
28 ± Mile Radius
277
85
77
77
77
2949
16
Mecklenburg County
Gaston County Cabarrus County
Union County
York County
Lincoln County
Rowan County
LancasterCounty
Iredell County
1
98
2
6
10
5
7
34
Industrial Submarkets
1 Southwest / I-772 Tyvola Rd3 I-277 / Remount Rd4 Airport / West5 I-85 / Beatties Ford Rd6 North7 Northeast / University8 Sugar Creek9 I-277 / 30th St10 Freedom Dr11 CBD12 East13 South
11
12
13
Copyright: NAI Southern Real Estate 2017Sources: CoStar, NAI Southern Real Estate
Charlotte, North Carolina
1Q 2017 INDUSTRIAL Market Report

Charlotte, North Carolina
1Q 2017RETAIL Market Report
NAI Southern Real Estate4201 Congress StreetCharlot te, NC 28209
704-375-1000www.srenc.com
NAI Southern Real Estate-Charlotte, NC. We obtained the information above from sources we believe to be reliable. However, we have not verified its accuracy and make no guarantee, warranty, or representation about it. No part of this document is to be reproduced without our written permission. This document has been prepared and issued by NAI Southern Real Estate on the basis of publicly available information, internally developed data and other sources believed to be reliable. The information contained herein is not guaranteed, does not purport to be comprehensive and is strictly for information purposes only. NAI Southern Real Estate or its affiliates does not assume any liability for any direct, indirect or consequential loss that may result from the reliance by any person upon any such information or opinions provided herein. Any expressions of opinions are subject to change without notice. This document does not constitute an offer or an invitation to invest, lease, rent, purchase or conduct any real estate activity, business activity, or personal activity based upon its data or purpose. No party should treat any of the contents herein as advice.
Copyright: NAI Southern Real Estate 2017Sources: CoStar, NAI Southern Real Estate
704-632-7618
Jay Vaughn, [email protected]
704-632-7627
Charlotte, North Carolina
1Q 2017 INDUSTRIAL Market Report