1q earnings review - media.ford.com america/us/2018... · first-ever ranger raptor in asia pacific...
TRANSCRIPT

1Q Earnings ReviewApril 25, 2018
2
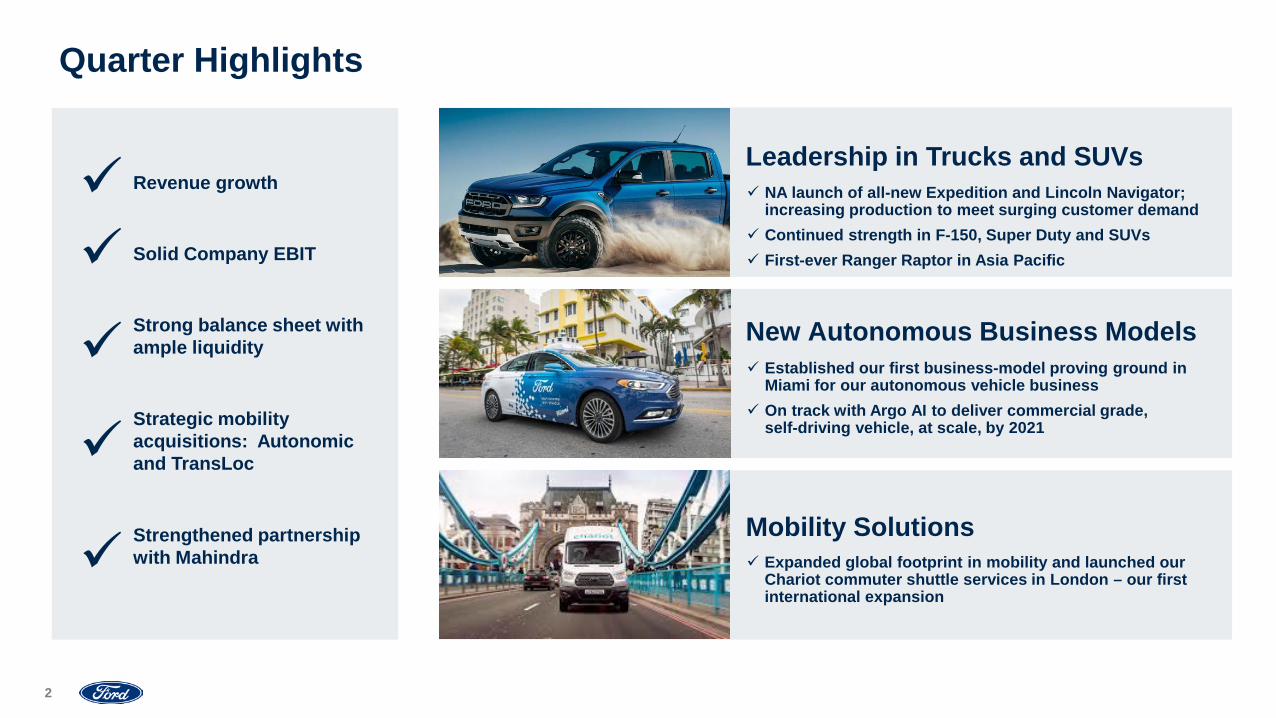
Quarter Highlights
NA launch of all-new Expedition and Lincoln Navigator; increasing production to meet surging customer demand
Continued strength in F-150, Super Duty and SUVs First-ever Ranger Raptor in Asia Pacific
Established our first business-model proving ground inMiami for our autonomous vehicle business
On track with Argo AI to deliver commercial grade, self-driving vehicle, at scale, by 2021
Expanded global footprint in mobility and launched our Chariot commuter shuttle services in London – our first international expansion
Leadership in Trucks and SUVs
New Autonomous Business Models
Mobility Solutions
Revenue growth
Solid Company EBIT
Strong balance sheet with ample liquidity
Strategic mobility acquisitions: Autonomic and TransLoc
Strengthened partnership with Mahindra
3
Fitness: Identify and capture improvements in cost and efficiencies; reduce capital intensity of business
Focus capital on high performing businessesFix or disposition low performing businesses
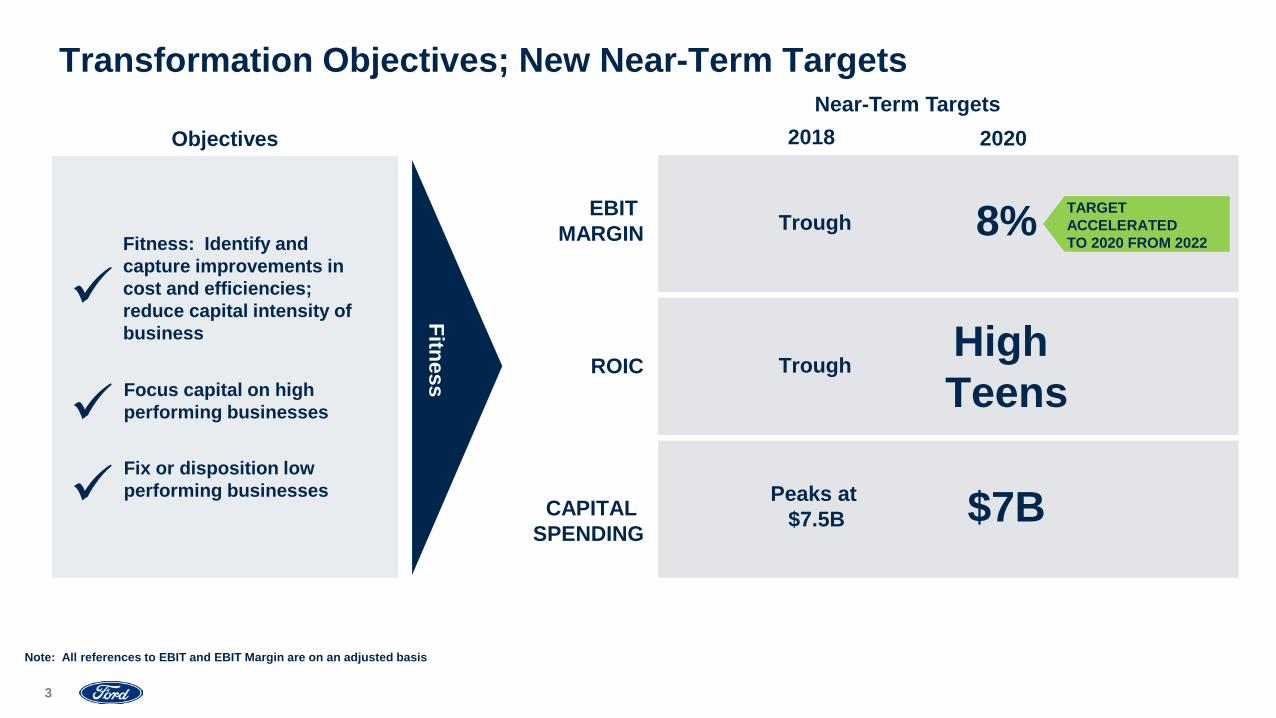
Transformation Objectives; New Near-Term Targets
Note: All references to EBIT and EBIT Margin are on an adjusted basis
2018 2020
ROIC TroughHigh Teens
EBIT MARGIN Trough 8% TARGET
ACCELERATED TO 2020 FROM 2022
CAPITAL SPENDING
Peaks at $7.5B $7B
Fitness
Near-Term TargetsObjectives

4
• Taking the necessary actions, with urgency, to optimize portfolio and drive profitable growth with appropriate returns
• Shifting capital to higher-return businesses and investments, such as mobility, that are critical for future growth
• Raising the returns of underperforming assets where we can via fitness and alternative business models
• Will disposition the rest
Focusing Capital On High-Margin, High-Growth Businesses
ROIC (%)
EBIT Margin
+
- +
Circle size = 2017 +/- EBIT (Bils)
Expense ForFuture Growth
Low Performing
H I G H L Y D I L U T I V E
H I G H L Y A C C R E T I V E
Profitable
High Performing
150% ofCompany
EBIT
(10)%10%(10)%
10%
-
30%
20%
40%
50%
(20)%
(30)%
20%(15)%
Note: All references to EBIT and EBIT Margin are on an adjusted basis
5
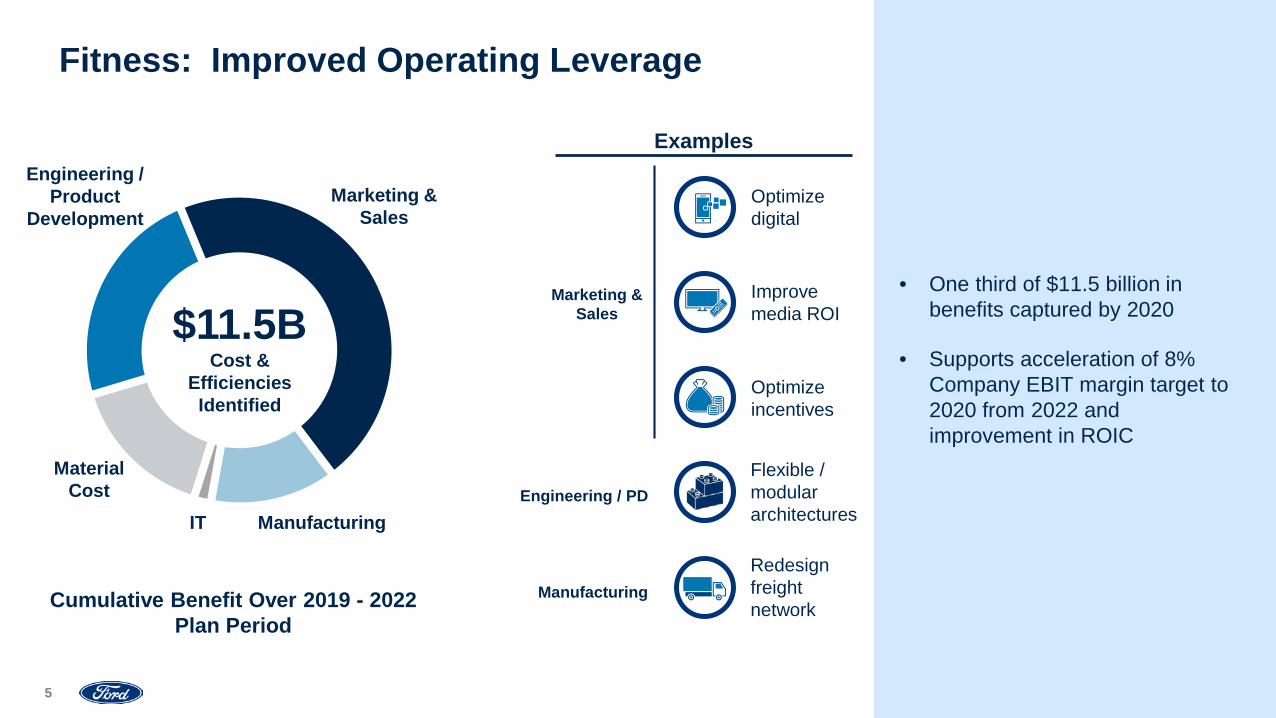
• One third of $11.5 billion in benefits captured by 2020
• Supports acceleration of 8% Company EBIT margin target to 2020 from 2022 and improvement in ROIC
Fitness: Improved Operating Leverage
$11.5BCost &
Efficiencies Identified
Manufacturing
Marketing & Sales
IT
MaterialCost
Engineering / Product
Development
Cumulative Benefit Over 2019 - 2022Plan Period
Examples
Optimize incentives
Improve media ROI
Optimize digital
Marketing & Sales
Flexible / modular architectures
Engineering / PD
ManufacturingRedesign freight network

6
• Target reduction in cumulative capital spend of $5 billion over Plan period
• Spend reaches high point of $7.5 billion in 2018, then declines
• Balanced capital spending and depreciation and amortization by 2022
Fitness: Capital Efficiency
Re-use of equipment and tools
Examples: Manufacturing
Common modules to account for 70 percent of the value of each vehicle
$34B
$5B
Cumulative Reduction
$29B
Cumulative CapitalSpending Over
2019 - 2022 Plan Period
7
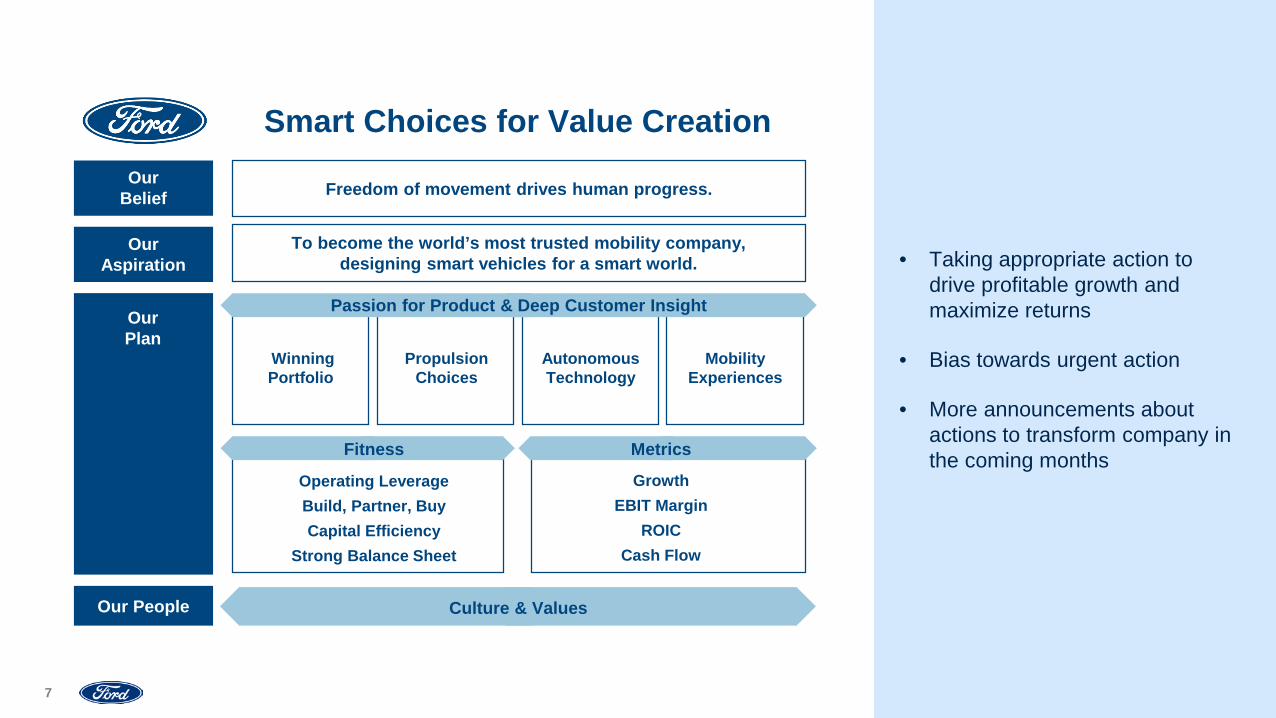
OurBelief
OurPlan
Smart Choices for Value Creation
WinningPortfolio
Propulsion Choices
Autonomous Technology
MobilityExperiences
Operating LeverageBuild, Partner, BuyCapital Efficiency
Strong Balance Sheet
Fitness
Culture & Values
Metrics
GrowthEBIT Margin
ROICCash Flow
Passion for Product & Deep Customer Insight
Our People
OurAspiration
Freedom of movement drives human progress.
To become the world’s most trusted mobility company,designing smart vehicles for a smart world. • Taking appropriate action to
drive profitable growth and maximize returns
• Bias towards urgent action
• More announcements about actions to transform company in the coming months
Bob ShanksChief Financial OfficerFinancial Review
9
Wholesales (000)
Market Share (Pct)
Gaap
Revenue (Bils)
Net Income (Bils)
EPS (Diluted)
Cash Flows From Op. Activities (Bils)
Non-gaap*
Company Adj. EBIT Margin* (Pct)
Company Adj. EBIT* (Bils)
Adj. Effective Tax Rate* (Pct)
Adjusted EPS* (Diluted)
Company Op. Cash Flow* (Bils)
ROIC (Trailing Four Qtrs)
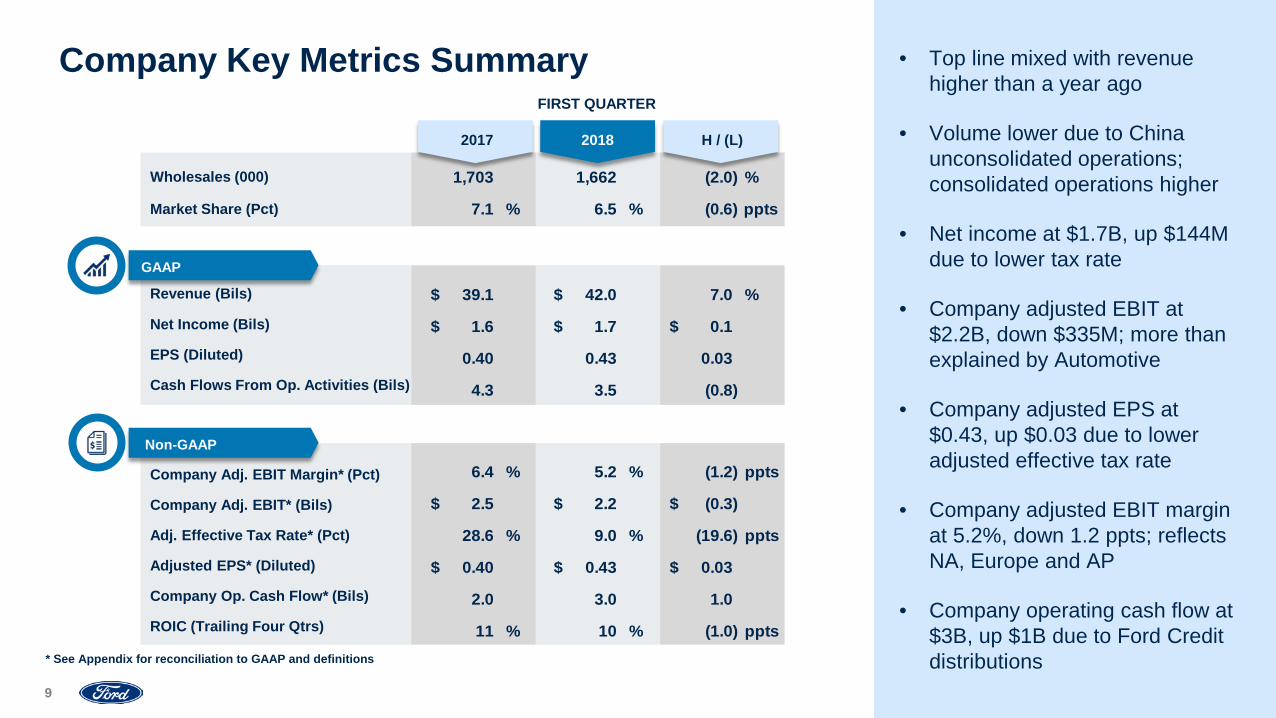
1,703 1,662 (2.0) %
7.1 % 6.5 % (0.6) ppts
39.1$ 42.0$ 7.0 %
1.6$ 1.7$ 0.1$
0.40 0.43 0.03
4.3 3.5 (0.8)
6.4 % 5.2 % (1.2) ppts
2.5$ 2.2$ (0.3)$
28.6 % 9.0 % (19.6) ppts
0.40$ 0.43$ 0.03$
2.0 3.0 1.0
11 % 10 % (1.0) ppts
2018 H / (L)
FIRST QUARTER
GAAP
Non-GAAP
• Top line mixed with revenue higher than a year ago
• Volume lower due to China unconsolidated operations; consolidated operations higher
• Net income at $1.7B, up $144M due to lower tax rate
• Company adjusted EBIT at$2.2B, down $335M; more than explained by Automotive
• Company adjusted EPS at $0.43, up $0.03 due to lower adjusted effective tax rate
• Company adjusted EBIT margin at 5.2%, down 1.2 ppts; reflects NA, Europe and AP
• Company operating cash flow at $3B, up $1B due to Ford Credit distributions
Company Key Metrics Summary
* See Appendix for reconciliation to GAAP and definitions
2017

10
Revenue And Operating Cash Flow Up YoY And Sequentially; Adjusted EBIT And EBIT Margin Lower YoY And Better Sequentially
Company Key Financial TrendsCompany Adjusted EBIT Margin (Pct)
Company Adjusted EBIT (Bils)
Note: See Appendix for reconciliation to GAAP and definitions
Company Operating Cash Flow (Bils)
Company Revenue (Bils)
1Q 2017 3Q 2017 1Q 20182Q 2017 4Q 2017
$39.1 $39.9 $36.5
$41.3 $42.0 6.4%
7.0%6.3%
4.9% 5.2%
1Q 2017 3Q 2017 1Q 20182Q 2017 4Q 2017
$2.5 $2.8
$2.3 $2.0 $2.2
1Q 2017 3Q 2017 1Q 20182Q 2017 4Q 2017
$2.0 $1.3
$(1.3)
$2.2 $3.0
1Q 2017 3Q 2017 1Q 20182Q 2017 4Q 2017

11
• Auto and Ford Credit results drove Company adjusted EBIT; EBIT losses at Mobility and Corporate Other
• Interest On Debt about unchanged from year ago
• Special items minor and about the same as a year ago
• Taxes reflect lower U.S. statutory rate and one-time valuation allowance
1Q 2018 Company Results (Mils)
Auto Net Income (GAAP)
Ford CreditMobility Corporate Other
Company Adj. EBIT*
Interest On Debt
SpecialItems
Taxes / Non-
Controlling
B / (W) 1Q 2017 $(443) $(38) $160 $(14) $(335) $4 $(1) $476 $144
$1,732
$(102)
$641
$(86)
$2,185
$(289)
$23
$(183)
$1,736
* See Appendix for reconciliation to GAAP and definitions
12
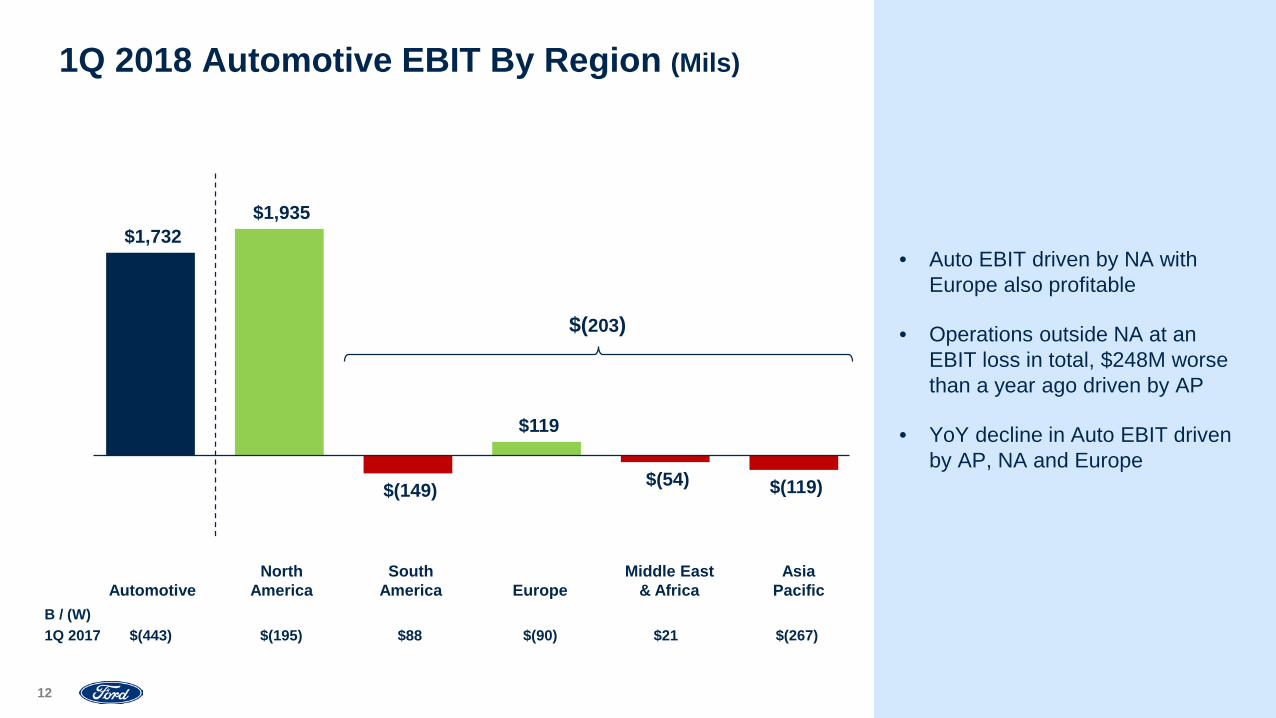
• Auto EBIT driven by NA with Europe also profitable
• Operations outside NA at an EBIT loss in total, $248M worse than a year ago driven by AP
• YoY decline in Auto EBIT driven by AP, NA and Europe
1Q 2018 Automotive EBIT By Region (Mils)
$1,732 $1,935
$(149)
$119
$(54) $(119)
$(203)
B / (W)1Q 2017 $(443) $(195) $88 $(90) $21 $(267)
SouthAmericaAutomotive
NorthAmerica Europe
Middle East& Africa
AsiaPacific

13
2017 2018 H / (L)
FIRST QUARTER
U.S. retail sales of the all-new Ford Expedition were up 48% in the quarter,
with an average transaction price of $62,175*
• Auto top-line metrics mixed YoY; financial metrics lower
• Global SAAR up 7%; all regions higher. Largest increase in AP, mainly China
• Global market share lower; primarily China, U.S. and U.K.
• Volume lower due to unconsolidated JVs in China
• Auto revenue up; reflects mainly higher volume at consolidated operations, favorable exchange-related effects and higher net pricing
Automotive Key Metrics
Global SAAR (Mils) 89.1 95.5 7 %
Market Share (Pct) 7.1 % 6.5 % (0.6) ppts
Wholesales (000) 1,703 1,662 (2) %
Revenue (Bils) 36.5$ 39.0$ 7 %
EBIT (Mils) 2,175$ 1,732$ (443)$
EBIT Margin (Pct) 6.0 % 4.4 % (1.6) ppts
* Source: JD Power PIN ISR as of 4/2/18

Volume /Mix
NetPricing OtherCost 1Q 20181Q 2017
14
Automotive1Q 2018 EBIT YoY Bridge (Mils)
• Auto EBIT $443M lower YoY due to higher commodity cost and unfavorable exchange
• Higher volume reflects favorable stock changes in NA
• Mix adverse due to unfavorable product mix in NA
• Higher net pricing driven by Europe, mainly new products and Brexit-related increases
• Cost about flat excluding commodities
• Unfavorable exchange reflects sterling, Thai baht, Canadian dollar and Argentine peso
Industry $ 224Share (442)Stocks 609Mix (77)Other (145)
Exchange $(240)China JVs (136)Other 20
$432Market Factors
Commodities $(483)Other Contribution Cost 114Structural Cost (150)
15
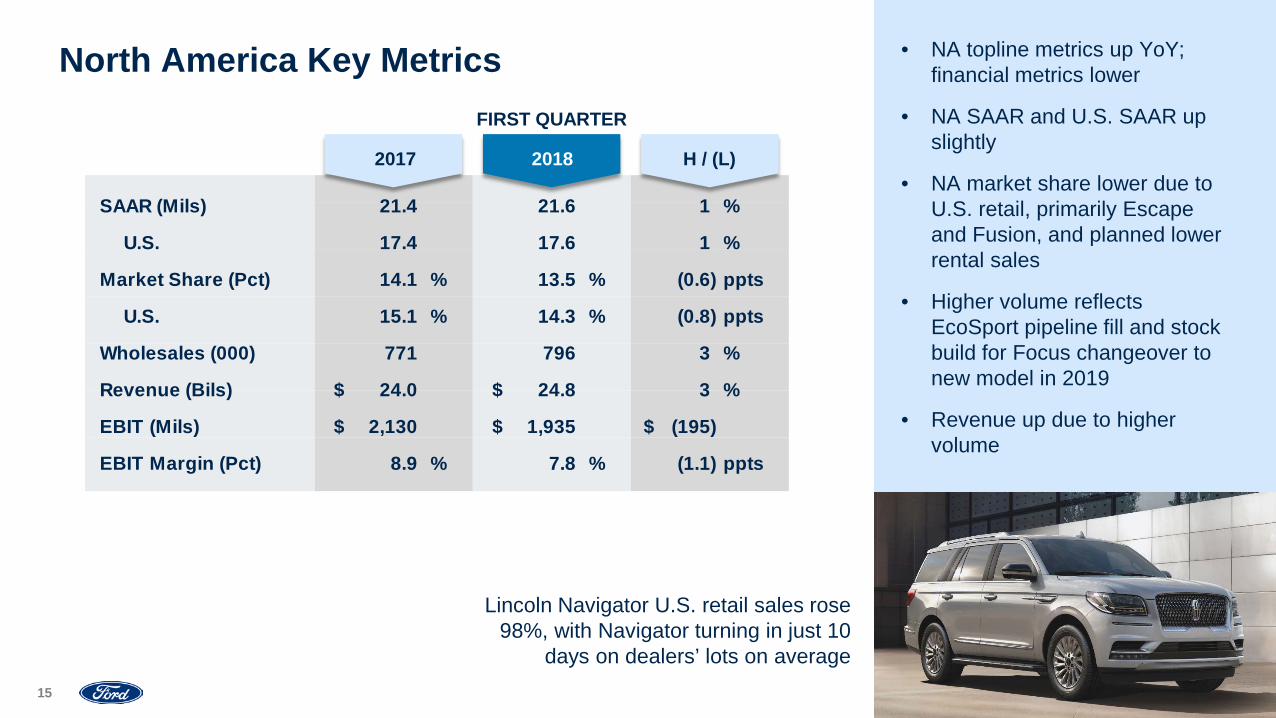
Lincoln Navigator U.S. retail sales rose 98%, with Navigator turning in just 10
days on dealers’ lots on average
• NA topline metrics up YoY; financial metrics lower
• NA SAAR and U.S. SAAR up slightly
• NA market share lower due to U.S. retail, primarily Escape and Fusion, and planned lower rental sales
• Higher volume reflects EcoSport pipeline fill and stock build for Focus changeover to new model in 2019
• Revenue up due to higher volume
North America Key Metrics
2017 2018 H / (L)
FIRST QUARTER
SAAR (Mils) 21.4 21.6 1 %
U.S. 17.4 17.6 1 %
Market Share (Pct) 14.1 % 13.5 % (0.6) ppts
U.S. 15.1 % 14.3 % (0.8) ppts
Wholesales (000) 771 796 3 %
Revenue (Bils) 24.0$ 24.8$ 3 %
EBIT (Mils) 2,130$ 1,935$ (195)$
EBIT Margin (Pct) 8.9 % 7.8 % (1.1) ppts
Volume /Mix
NetPricing OtherCost 1Q 20181Q 2017
16
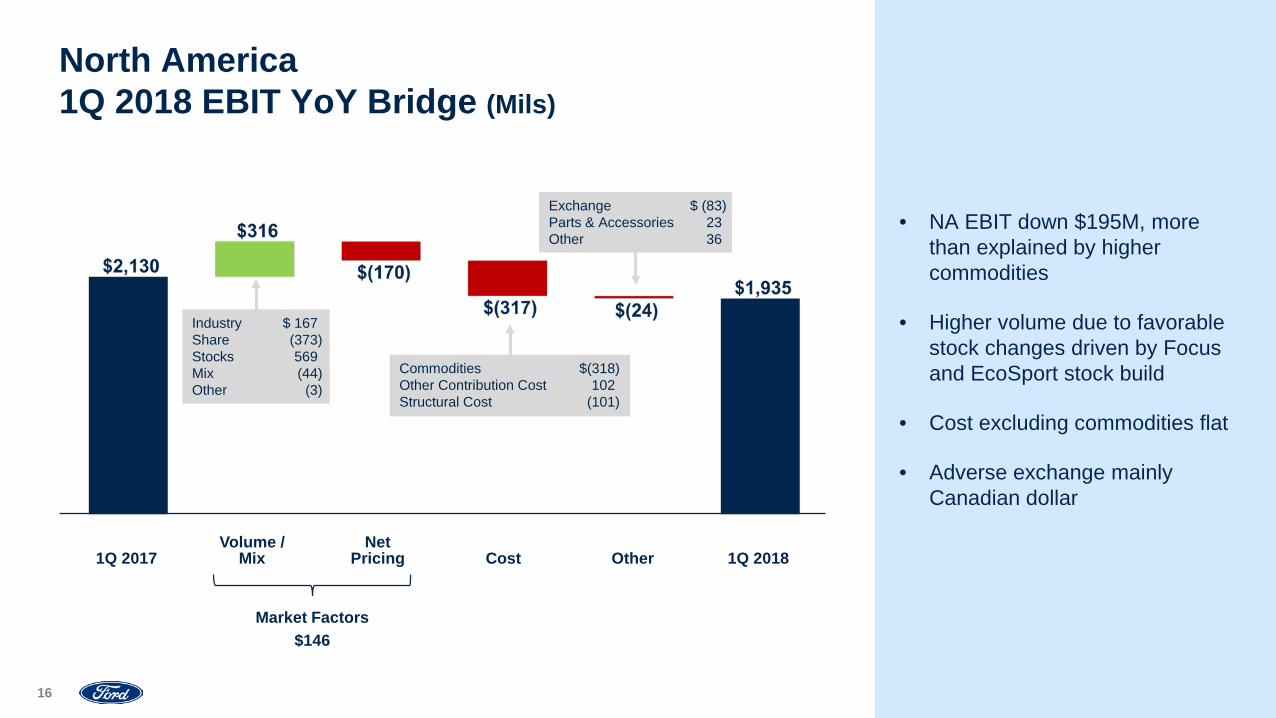
North America 1Q 2018 EBIT YoY Bridge (Mils)
• NA EBIT down $195M, more than explained by higher commodities
• Higher volume due to favorable stock changes driven by Focus and EcoSport stock build
• Cost excluding commodities flat
• Adverse exchange mainly Canadian dollar
Industry $ 167Share (373)Stocks 569Mix (44)Other (3)
Exchange $ (83)Parts & Accessories 23Other 36
Commodities $(318)Other Contribution Cost 102Structural Cost (101)
$146Market Factors
17
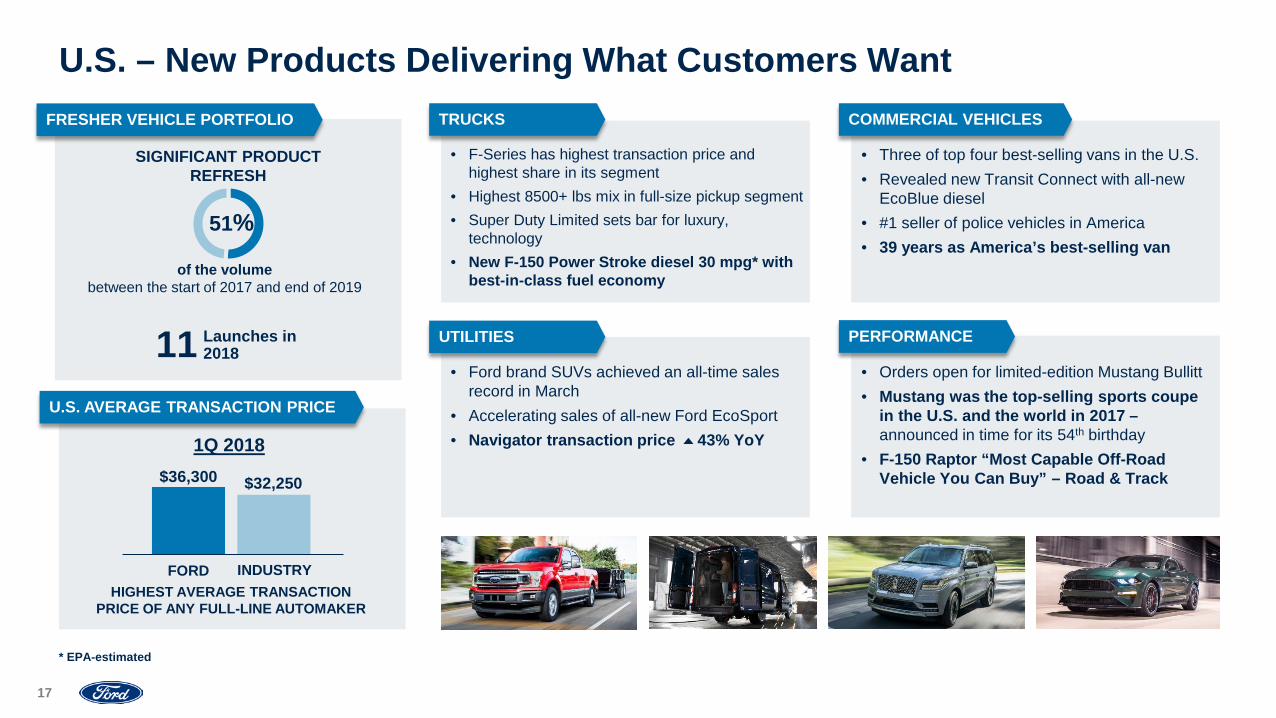
U.S. – New Products Delivering What Customers WantTRUCKS
UTILITIES
COMMERCIAL VEHICLES
PERFORMANCE
* EPA-estimated
• Three of top four best-selling vans in the U.S.• Revealed new Transit Connect with all-new
EcoBlue diesel• #1 seller of police vehicles in America• 39 years as America’s best-selling van
U.S. AVERAGE TRANSACTION PRICE
1Q 2018
FORD INDUSTRY
$36,300 $32,250
HIGHEST AVERAGE TRANSACTION PRICE OF ANY FULL-LINE AUTOMAKER
• Ford brand SUVs achieved an all-time sales record in March
• Accelerating sales of all-new Ford EcoSport• Navigator transaction price 43% YoY
• F-Series has highest transaction price and highest share in its segment
• Highest 8500+ lbs mix in full-size pickup segment• Super Duty Limited sets bar for luxury,
technology• New F-150 Power Stroke diesel 30 mpg* with
best-in-class fuel economy
• Orders open for limited-edition Mustang Bullitt• Mustang was the top-selling sports coupe
in the U.S. and the world in 2017 –announced in time for its 54th birthday
• F-150 Raptor “Most Capable Off-Road Vehicle You Can Buy” – Road & Track
SIGNIFICANT PRODUCT REFRESH
51%
FRESHER VEHICLE PORTFOLIO
11 Launches in 2018
of the volumebetween the start of 2017 and end of 2019
18
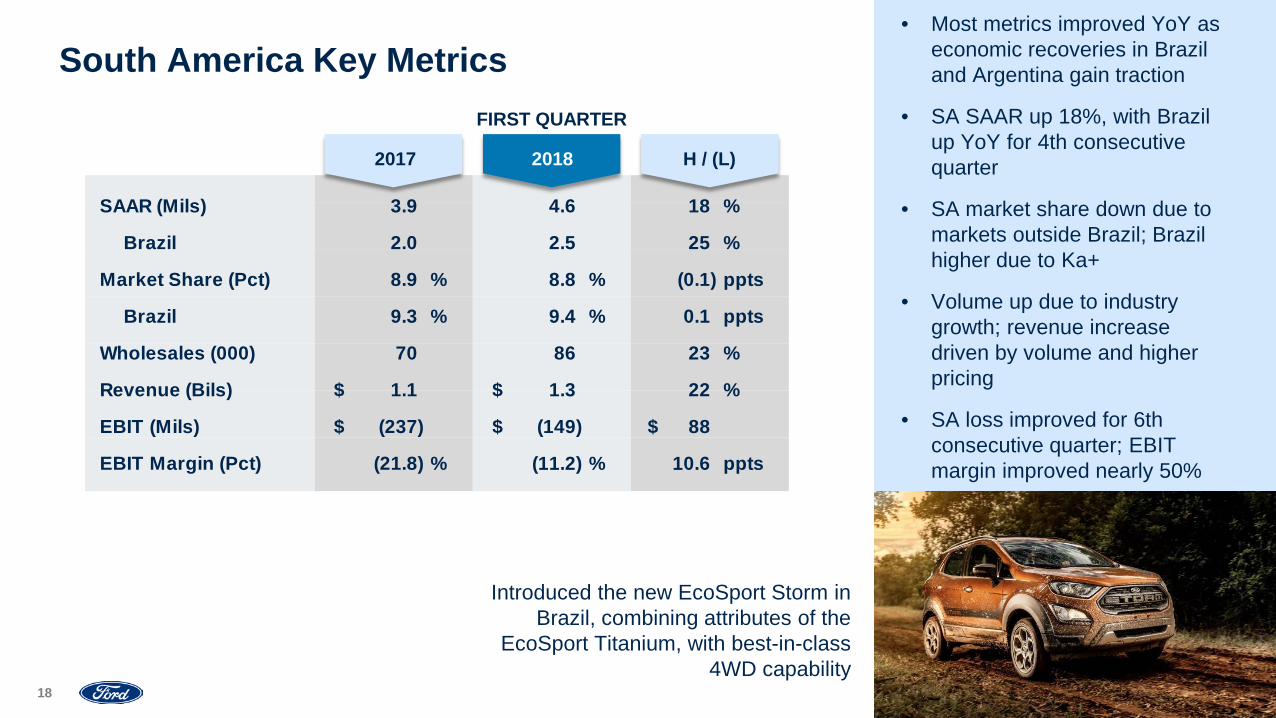
Introduced the new EcoSport Storm in Brazil, combining attributes of the
EcoSport Titanium, with best-in-class 4WD capability
• Most metrics improved YoY as economic recoveries in Brazil and Argentina gain traction
• SA SAAR up 18%, with Brazil up YoY for 4th consecutive quarter
• SA market share down due to markets outside Brazil; Brazil higher due to Ka+
• Volume up due to industry growth; revenue increase driven by volume and higher pricing
• SA loss improved for 6th consecutive quarter; EBIT margin improved nearly 50%
South America Key Metrics
2017 2018 H / (L)
FIRST QUARTER
SAAR (Mils) 3.9 4.6 18 %
Brazil 2.0 2.5 25 %
Market Share (Pct) 8.9 % 8.8 % (0.1) ppts
Brazil 9.3 % 9.4 % 0.1 ppts
Wholesales (000) 70 86 23 %
Revenue (Bils) 1.1$ 1.3$ 22 %
EBIT (Mils) (237)$ (149)$ 88$
EBIT Margin (Pct) (21.8) % (11.2) % 10.6 ppts
Volume /Mix
NetPricing OtherCost 1Q 20181Q 2017
19
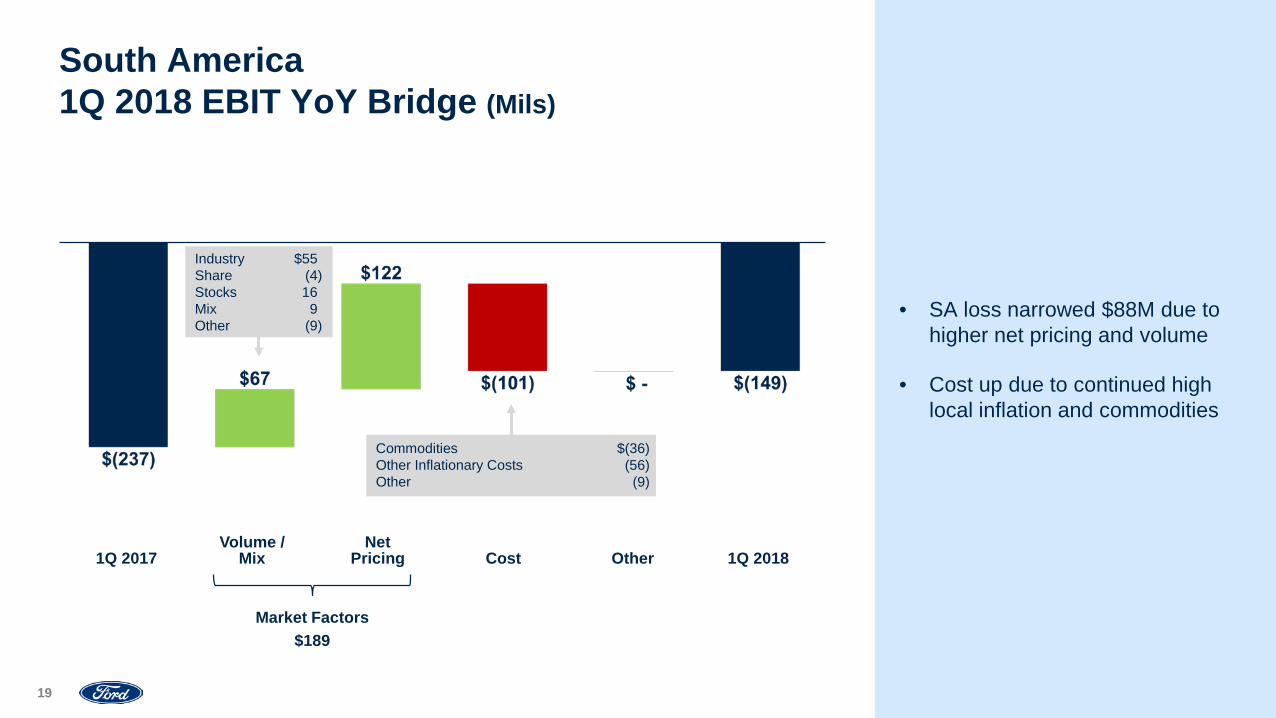
South America 1Q 2018 EBIT YoY Bridge (Mils)
• SA loss narrowed $88M due to higher net pricing and volume
• Cost up due to continued high local inflation and commodities
Industry $55Share (4)Stocks 16Mix 9Other (9)
$189
Commodities $(36)Other Inflationary Costs (56)Other (9)
Market Factors
20
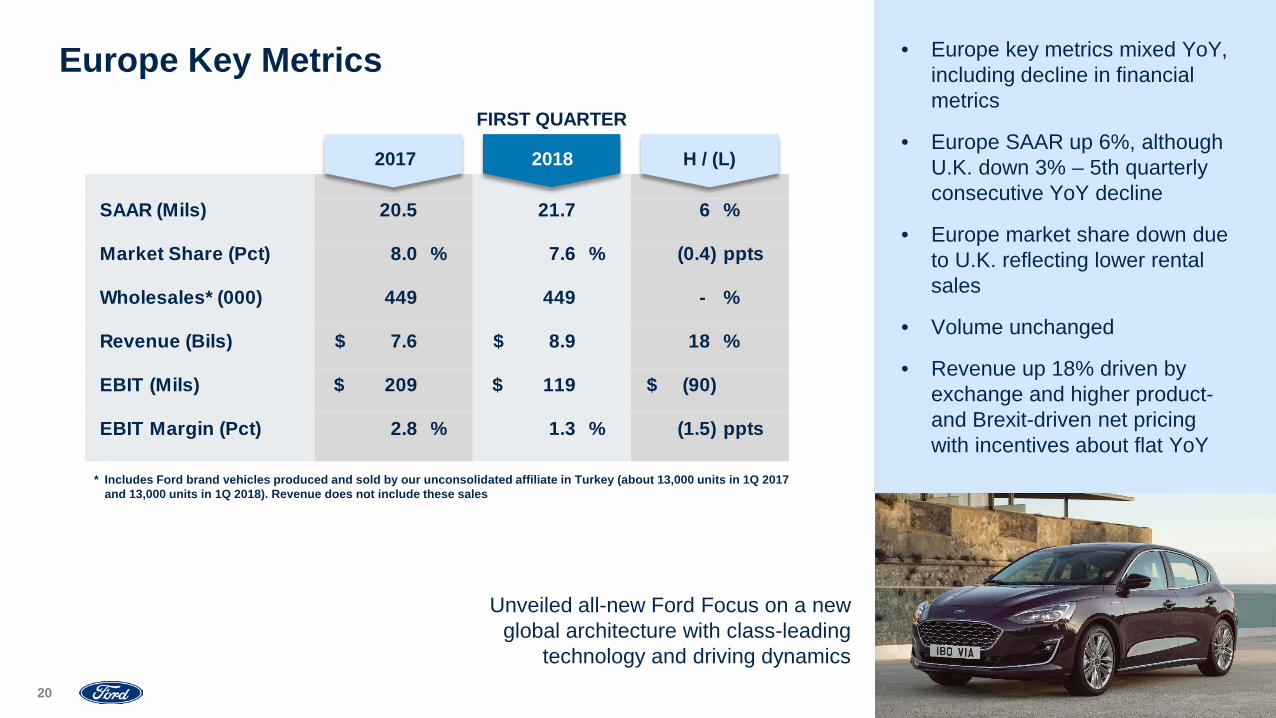
Unveiled all-new Ford Focus on a new global architecture with class-leading
technology and driving dynamics
• Europe key metrics mixed YoY, including decline in financial metrics
• Europe SAAR up 6%, although U.K. down 3% – 5th quarterly consecutive YoY decline
• Europe market share down due to U.K. reflecting lower rental sales
• Volume unchanged
• Revenue up 18% driven by exchange and higher product-and Brexit-driven net pricing with incentives about flat YoY
Europe Key Metrics
2017 2018 H / (L)
FIRST QUARTER
SAAR (Mils) 20.5 21.7 6 %
Market Share (Pct) 8.0 % 7.6 % (0.4) ppts
Wholesales* (000) 449 449 - %
Revenue (Bils) 7.6$ 8.9$ 18 %
EBIT (Mils) 209$ 119$ (90)$
EBIT Margin (Pct) 2.8 % 1.3 % (1.5) ppts
* Includes Ford brand vehicles produced and sold by our unconsolidated affiliate in Turkey (about 13,000 units in 1Q 2017 and 13,000 units in 1Q 2018). Revenue does not include these sales
Volume /Mix
NetPricing OtherCost 1Q 20181Q 2017
21
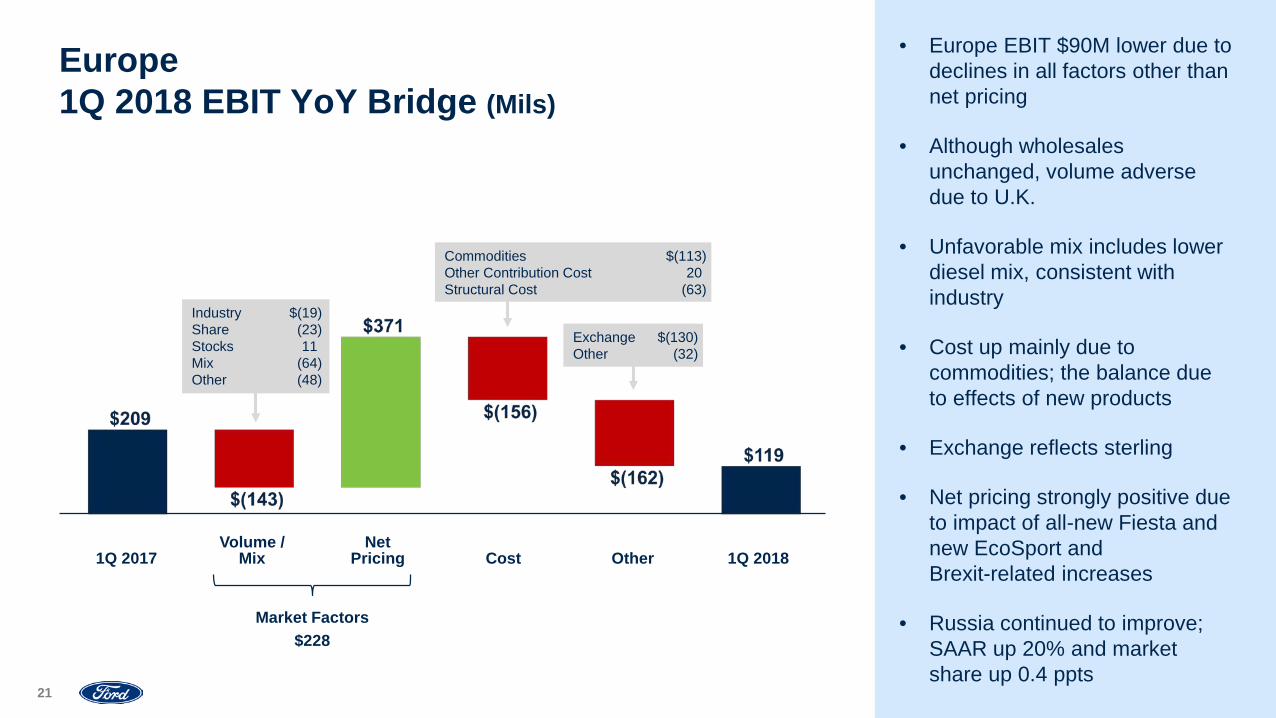
Europe 1Q 2018 EBIT YoY Bridge (Mils)
• Europe EBIT $90M lower due to declines in all factors other than net pricing
• Although wholesales unchanged, volume adverse due to U.K.
• Unfavorable mix includes lower diesel mix, consistent with industry
• Cost up mainly due to commodities; the balance due to effects of new products
• Exchange reflects sterling
• Net pricing strongly positive due to impact of all-new Fiesta and new EcoSport and Brexit-related increases
• Russia continued to improve; SAAR up 20% and market share up 0.4 ppts
Industry $(19)Share (23)Stocks 11Mix (64)Other (48)
Exchange $(130)Other (32)
Commodities $(113)Other Contribution Cost 20Structural Cost (63)
$228Market Factors

22
Europe – SUV And CV Growth; Product Renaissance Underway
* 20 European traditional markets
FOCUSFRESHER VEHICLE PORTFOLIO
of the volumebetween the start of 2017 and end of 2019
SignificantProductRefresh
88%
21 Launches in 2018
FORD SUV SALES
COMMERCIAL VEHICLES FIESTA
• Europe’s #1 small car• Active, Vignale, ST and ST-Line derivatives• 5 Star safety rating by Euro NCAP• Customer Orders 28% YoY
• Record EcoSport and Kuga sales in February• 1Q sales up 15%
• All-new Focus in dealerships by summer• Technology: Internet connectivity, Co-Pilot360
suite of driver assist technologies• Active, Wagon, Vignale and ST-Line derivatives• 7M sold since introduced in 1998
• Transit best-selling commercial vehicle nameplate in Europe
• Ford brand #1 in sales• Best 1Q sales in 25 years*
23
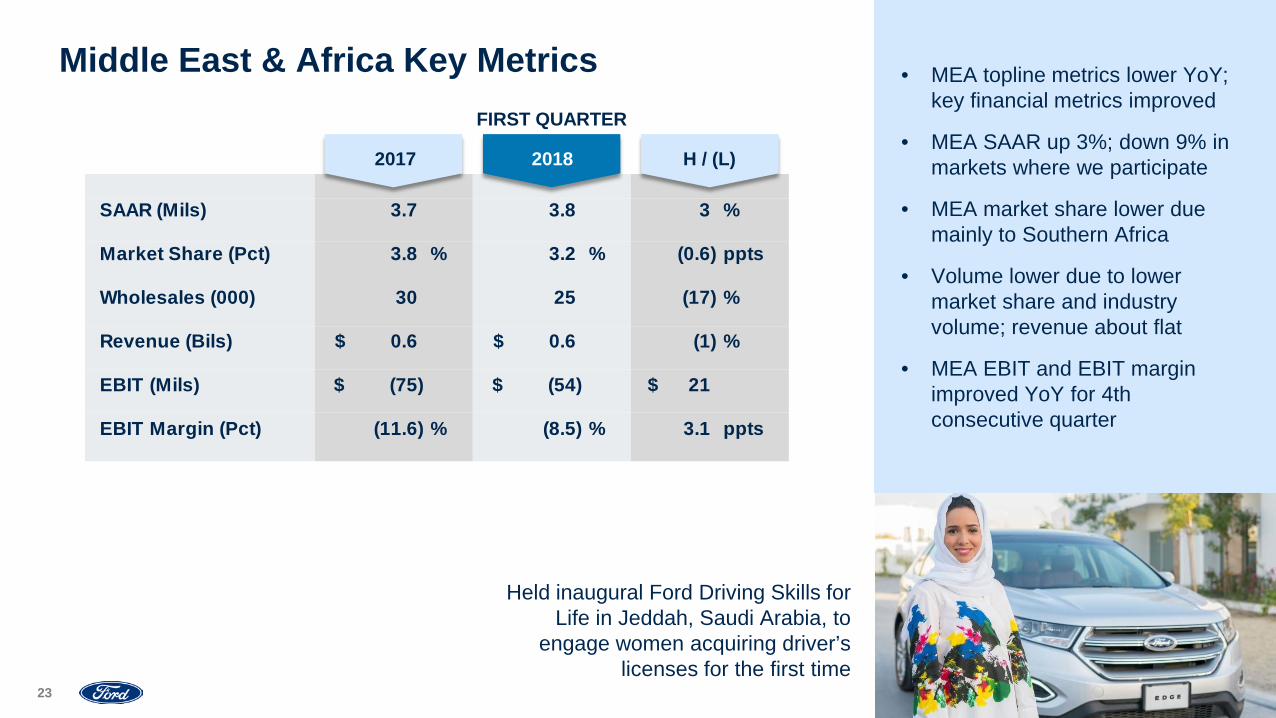
Held inaugural Ford Driving Skills for Life in Jeddah, Saudi Arabia, to
engage women acquiring driver’s licenses for the first time
• MEA topline metrics lower YoY; key financial metrics improved
• MEA SAAR up 3%; down 9% in markets where we participate
• MEA market share lower due mainly to Southern Africa
• Volume lower due to lower market share and industry volume; revenue about flat
• MEA EBIT and EBIT margin improved YoY for 4th consecutive quarter
Middle East & Africa Key Metrics
2017 2018 H / (L)
FIRST QUARTER
SAAR (Mils) 3.7 3.8 3 %
Market Share (Pct) 3.8 % 3.2 % (0.6) ppts
Wholesales (000) 30 25 (17) %
Revenue (Bils) 0.6$ 0.6$ (1) %
EBIT (Mils) (75)$ (54)$ 21$
EBIT Margin (Pct) (11.6) % (8.5) % 3.1 ppts
Volume /Mix
NetPricing OtherCost 1Q 20181Q 2017
24
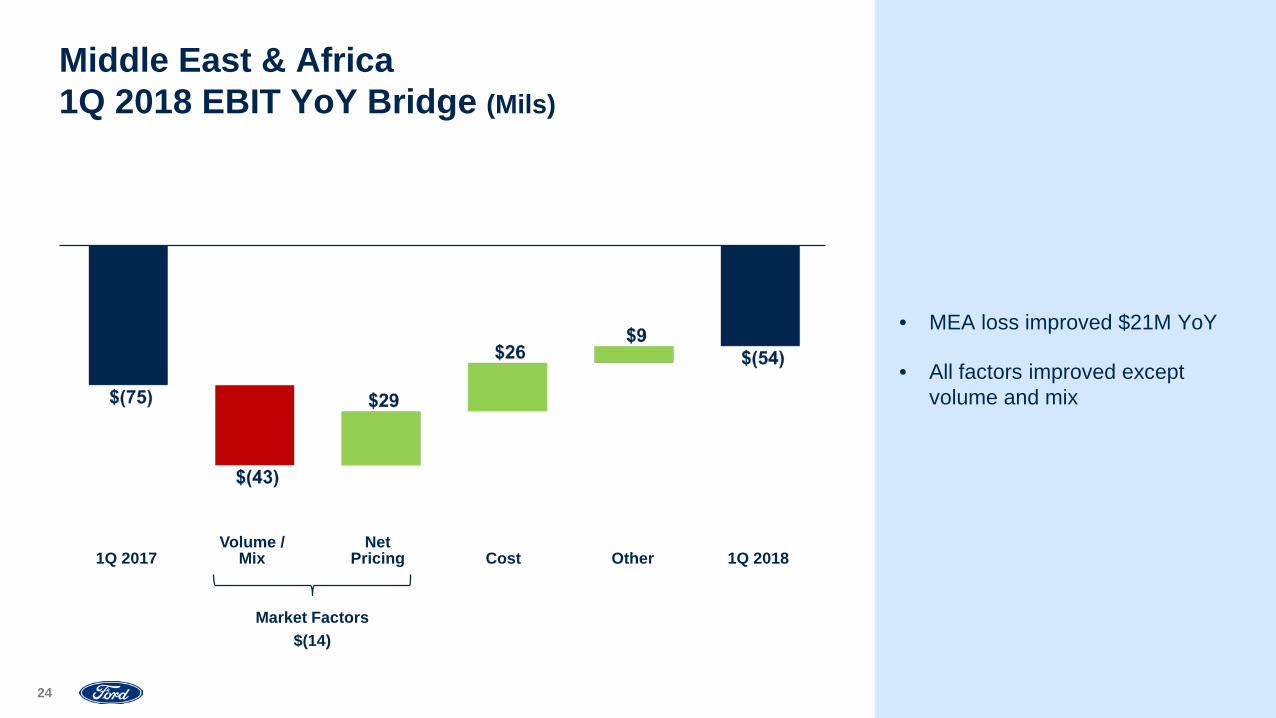
Middle East & Africa1Q 2018 EBIT YoY Bridge (Mils)
• MEA loss improved $21M YoY
• All factors improved except volume and mix
$(14)Market Factors
25
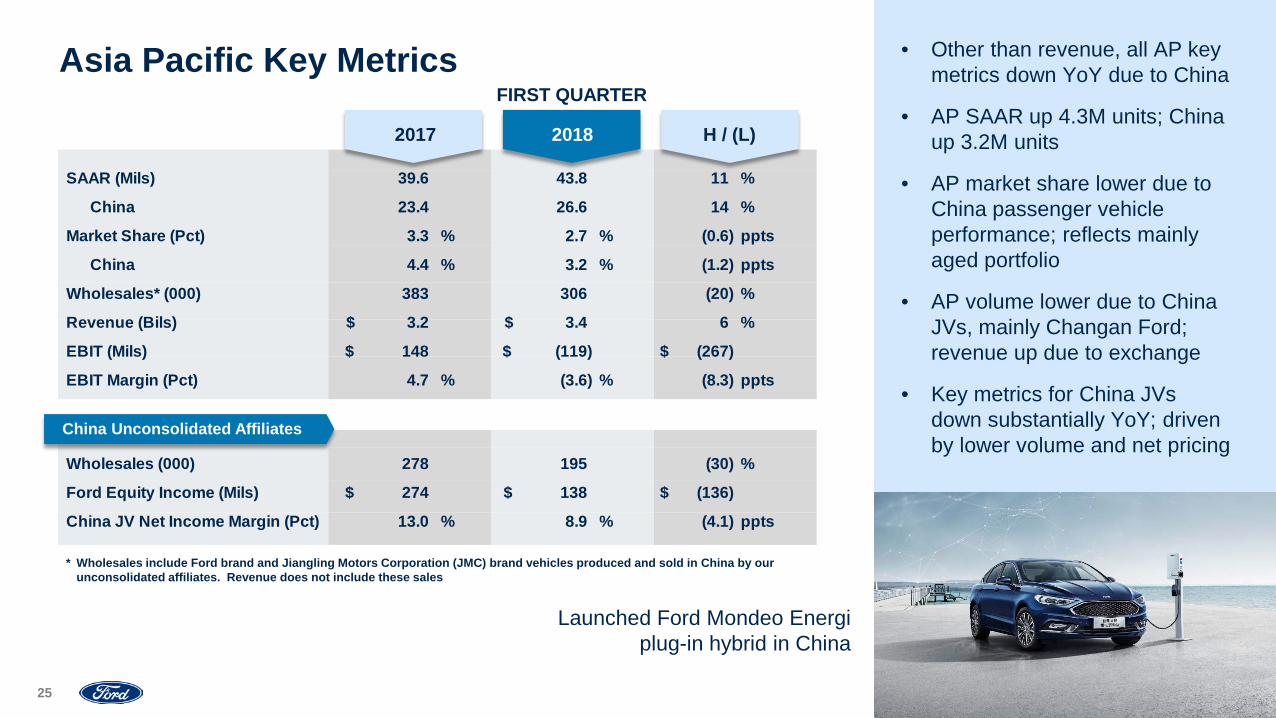
Launched Ford Mondeo Energi plug-in hybrid in China
• Other than revenue, all AP key metrics down YoY due to China
• AP SAAR up 4.3M units; China up 3.2M units
• AP market share lower due to China passenger vehicle performance; reflects mainly aged portfolio
• AP volume lower due to China JVs, mainly Changan Ford; revenue up due to exchange
• Key metrics for China JVs down substantially YoY; driven by lower volume and net pricing
Asia Pacific Key Metrics
China Unconsolidated Affiliates
2017 2018 H / (L)
FIRST QUARTER
SAAR (Mils) 39.6 43.8 11 %
China 23.4 26.6 14 %
Market Share (Pct) 3.3 % 2.7 % (0.6) ppts
China 4.4 % 3.2 % (1.2) ppts
Wholesales* (000) 383 306 (20) %
Revenue (Bils) 3.2$ 3.4$ 6 %
EBIT (Mils) 148$ (119)$ (267)$
EBIT Margin (Pct) 4.7 % (3.6) % (8.3) ppts
Wholesales (000) 278 195 (30) %
Ford Equity Income (Mils) 274$ 138$ (136)$
China JV Net Income Margin (Pct) 13.0 % 8.9 % (4.1) ppts
* Wholesales include Ford brand and Jiangling Motors Corporation (JMC) brand vehicles produced and sold in China by our unconsolidated affiliates. Revenue does not include these sales

Volume /Mix
NetPricing OtherCost 1Q 20181Q 2017
26
Asia Pacific 1Q 2018 EBIT YoY Bridge (Mils)
• AP EBIT YoY decline of $267M due mainly to China – lower equity income from China JVs and lower net pricing, mainly industry-related, for Ford and Lincoln products imported to China
• Cost performance slightly improved
• Outside China, EBIT positive and improved; India results at a small loss, substantially improved from a year ago
Industry $ 28Share (37)Stocks 16Mix 26Other (60)
China JVs $(136)Exchange (26)Other (17)
$(116)Market Factors
$148
27
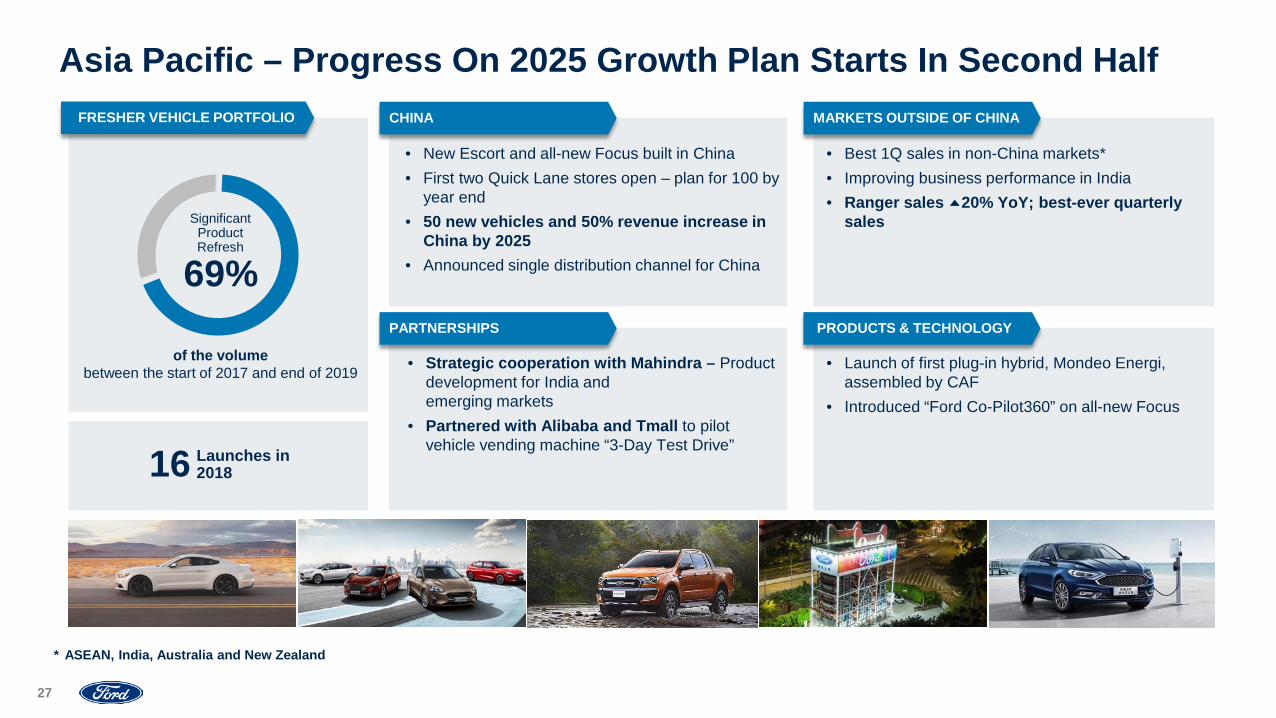
Asia Pacific – Progress On 2025 Growth Plan Starts In Second Half
* ASEAN, India, Australia and New Zealand
CHINAFRESHER VEHICLE PORTFOLIO
of the volumebetween the start of 2017 and end of 2019
SignificantProductRefresh
69%
16 Launches in 2018
MARKETS OUTSIDE OF CHINA
PARTNERSHIPS PRODUCTS & TECHNOLOGY
• Launch of first plug-in hybrid, Mondeo Energi, assembled by CAF
• Introduced “Ford Co-Pilot360” on all-new Focus
• Best 1Q sales in non-China markets*• Improving business performance in India• Ranger sales 20% YoY; best-ever quarterly
sales
• New Escort and all-new Focus built in China• First two Quick Lane stores open – plan for 100 by
year end• 50 new vehicles and 50% revenue increase in
China by 2025• Announced single distribution channel for China
• Strategic cooperation with Mahindra – Product development for India and emerging markets
• Partnered with Alibaba and Tmall to pilot vehicle vending machine “3-Day Test Drive”
28
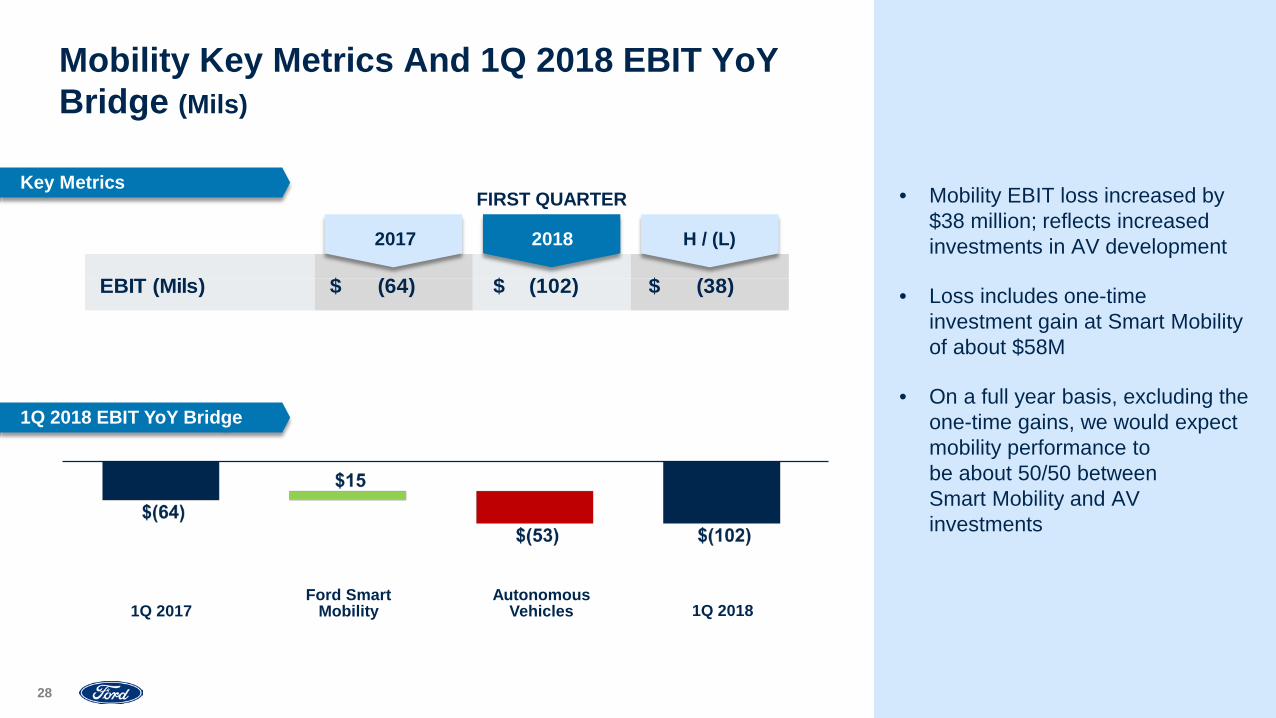
• Mobility EBIT loss increased by$38 million; reflects increased investments in AV development
• Loss includes one-time investment gain at Smart Mobility of about $58M
• On a full year basis, excluding the one-time gains, we would expect mobility performance to be about 50/50 between Smart Mobility and AV investments
Mobility Key Metrics And 1Q 2018 EBIT YoY Bridge (Mils)
Ford Smart Mobility
AutonomousVehicles 1Q 20181Q 2017
1Q 2018 EBIT YoY Bridge
Key Metrics
2017 2018 H / (L)
FIRST QUARTER
EBIT (Mils) (64)$ (102)$ (38)$
29
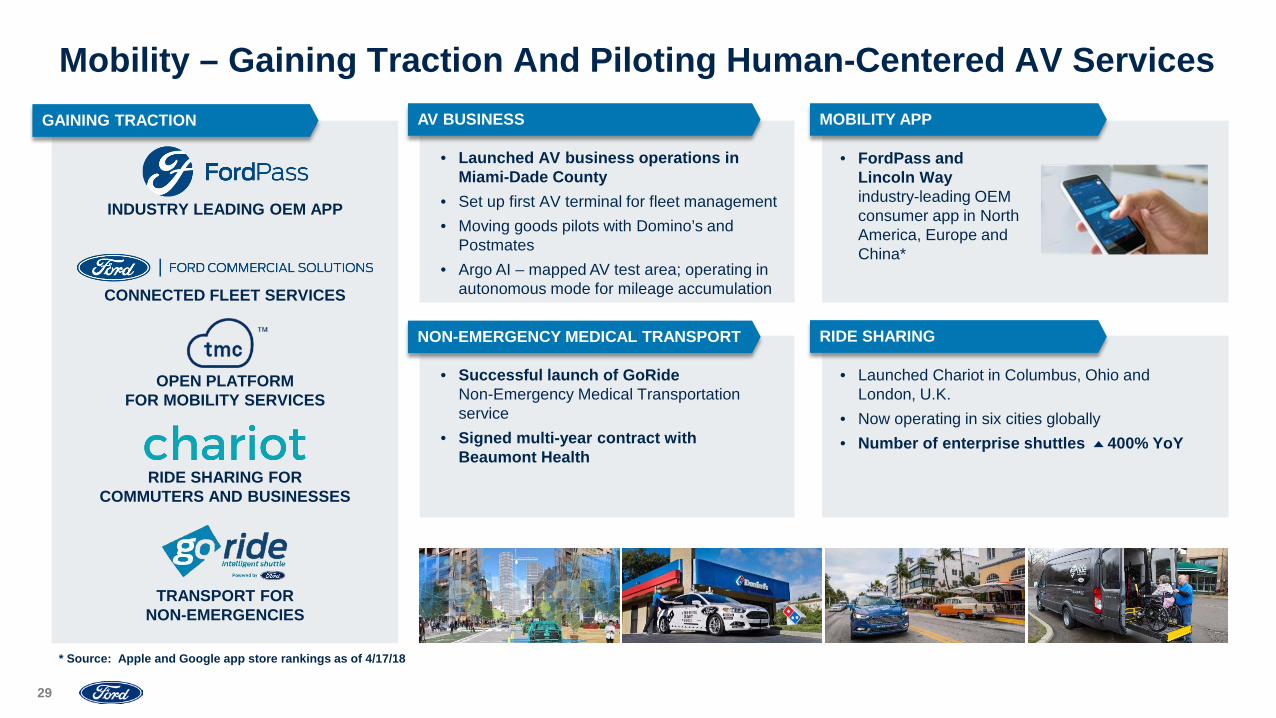
Mobility – Gaining Traction And Piloting Human-Centered AV ServicesAV BUSINESS
NON-EMERGENCY MEDICAL TRANSPORT
MOBILITY APP
RIDE SHARING
GAINING TRACTION
INDUSTRY LEADING OEM APP
CONNECTED FLEET SERVICES
RIDE SHARING FOR COMMUTERS AND BUSINESSES
TRANSPORT FOR NON-EMERGENCIES
• Launched AV business operations in Miami-Dade County
• Set up first AV terminal for fleet management• Moving goods pilots with Domino’s and
Postmates• Argo AI – mapped AV test area; operating in
autonomous mode for mileage accumulation
• Successful launch of GoRideNon-Emergency Medical Transportation service
• Signed multi-year contract with Beaumont Health
• FordPass and Lincoln Way industry-leading OEM consumer app in North America, Europe and China*
• Launched Chariot in Columbus, Ohio and London, U.K.
• Now operating in six cities globally• Number of enterprise shuttles 400% YoY
OPEN PLATFORM FOR MOBILITY SERVICES
* Source: Apple and Google app store rankings as of 4/17/18
30
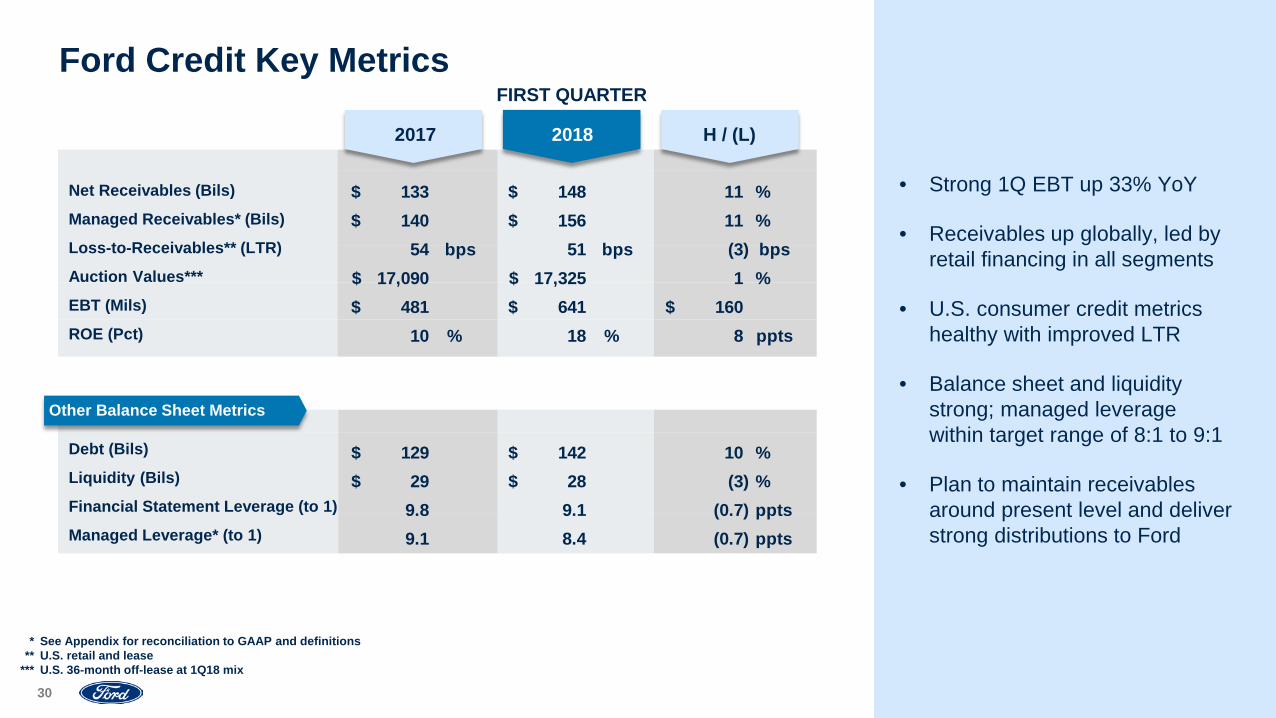
Net Receivables (Bils)
Managed Receivables* (Bils)
Loss-to-Receivables** (LTR)
Auction Values***
EBT (Mils)
ROE (Pct)
Debt (Bils)
Liquidity (Bils)
Financial Statement Leverage (to 1)
Managed Leverage* (to 1)
• Strong 1Q EBT up 33% YoY
• Receivables up globally, led by retail financing in all segments
• U.S. consumer credit metrics healthy with improved LTR
• Balance sheet and liquidity strong; managed leverage within target range of 8:1 to 9:1
• Plan to maintain receivables around present level and deliver strong distributions to Ford
Ford Credit Key Metrics
* See Appendix for reconciliation to GAAP and definitions** U.S. retail and lease
*** U.S. 36-month off-lease at 1Q18 mix
Other Balance Sheet Metrics
2017 2018 H / (L)
FIRST QUARTER
133$ 148$ 11 %140$ 156$ 11 %54 bps 51 bps (3) bps
17,090$ 17,325$ 1 %481$ 641$ 160$ 10 % 18 % 8 ppts
129$ 142$ 10 %29$ 28$ (3) %
9.8 9.1 (0.7) ppts9.1 8.4 (0.7) ppts
31
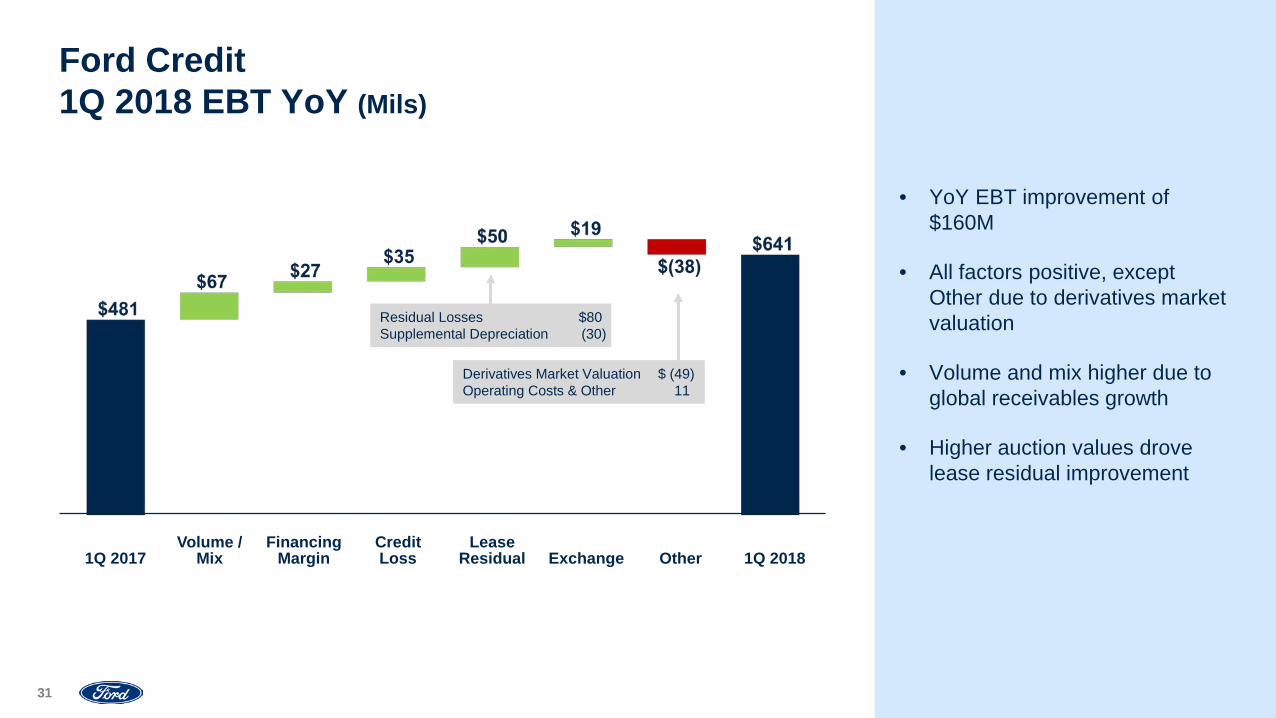
Volume /Mix
FinancingMargin
LeaseResidual
Credit Loss 1Q 20181Q 2017 Exchange Other
Ford Credit 1Q 2018 EBT YoY (Mils)
• YoY EBT improvement of $160M
• All factors positive, except Other due to derivatives market valuation
• Volume and mix higher due to global receivables growth
• Higher auction values drove lease residual improvement
Derivatives Market Valuation $ (49)Operating Costs & Other 11
Residual Losses $80Supplemental Depreciation (30)

32
• Lease share continues to be below industry reflecting Ford sales mix
• Auction values stronger than expected and higher YoY
• Now expect 2018 average auction values to be about 1% to 2% lower at constant mix
• Strong loss metrics reflect healthy consumer credit conditions
Ford CreditU.S. Automotive Financing Trends
* Source: JD Power PIN** At 1Q 2018 mix
6579 80 70 61 68
4Q16 1Q17 2Q17 3Q17 4Q17 1Q18
$16,935 $17,090$17,385
$17,665$17,365 $17,325
$10.7 $10.6 $10.5$9.8 $10.2 $10.3
1.16% 1.16% 1.06% 1.12% 1.16% 1.22%
4Q16 1Q17 2Q17 3Q17 4Q17 1Q18
Lease Share of Retail Sales (Pct)
Retail and Lease Repossession Ratio (Pct)and Severity (000)
Lease Return Vol. (000) and Auction Values**
19%24% 22%
19% 17%23%
29% 31% 30% 28% 28%31%
4Q16 1Q17 2Q17 3Q17 4Q17 1Q18
Retail and Lease Charge-Offs (Mils)and LTR Ratio (Pct)
$108 $96 $82 $95 $109 $93
0.59% 0.54% 0.46% 0.53% 0.60% 0.51%
4Q16 1Q17 2Q17 3Q17 4Q17 1Q18
36-Month Return VolumeFord Credit Industry*
LTR Charge-OffsRepo Ratio Severity
33
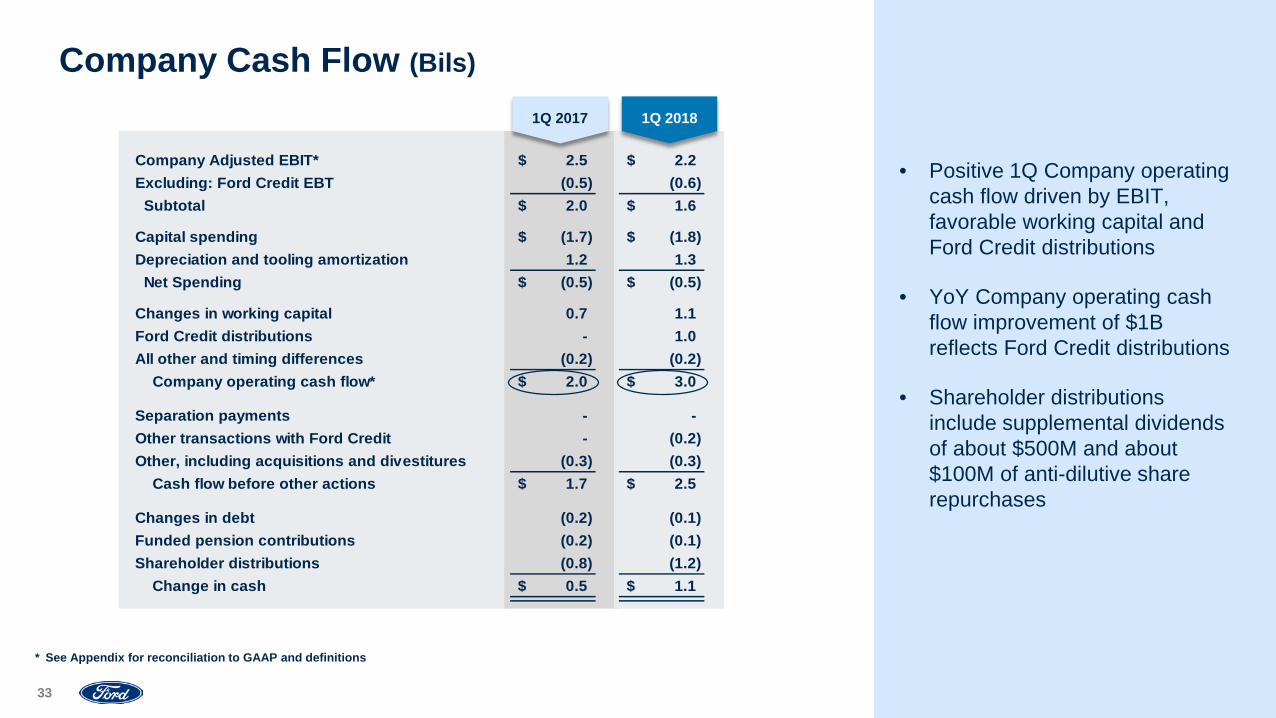
• Positive 1Q Company operating cash flow driven by EBIT, favorable working capital and Ford Credit distributions
• YoY Company operating cash flow improvement of $1B reflects Ford Credit distributions
• Shareholder distributions include supplemental dividends of about $500M and about $100M of anti-dilutive share repurchases
Company Cash Flow (Bils)
* See Appendix for reconciliation to GAAP and definitions
1Q 2017
Company Adjusted EBIT* 2.5$ 2.2$ Excluding: Ford Credit EBT (0.5) (0.6)
Subtotal 2.0$ 1.6$
Capital spending (1.7)$ (1.8)$ Depreciation and tooling amortization 1.2 1.3
Net Spending (0.5)$ (0.5)$
Changes in working capital 0.7 1.1 Ford Credit distributions - 1.0 All other and timing differences (0.2) (0.2)
Company operating cash flow* 2.0$ 3.0$
Separation payments - - Other transactions with Ford Credit - (0.2) Other, including acquisitions and divestitures (0.3) (0.3)
Cash flow before other actions 1.7$ 2.5$
Changes in debt (0.2) (0.1) Funded pension contributions (0.2) (0.1) Shareholder distributions (0.8) (1.2)
Change in cash 0.5$ 1.1$
1Q 2018

34
• Company cash and liquidity balances strong
• Expect by April 26 to extend maturity dates of corporate credit facility with terms and conditions unchanged
Company Balance Sheet And Liquidity (Bils)
* See Appendix for definition** Balances at March 31, 2018 reflect net underfunded status at December 31, 2017, updated for service and interest costs, expected return on
assets, separation expense, interim remeasurement expense, actual benefit payments and cash contributions. The discount rate and rate of expected return assumptions are unchanged from year end 2017
2017Dec 31
2018Mar 31
Company Cash* 26.5$ 27.6$ Liquidity 37.4 38.6
Debt 16.5$ 16.4$ Cash Net Of Debt 10.0 11.2
U.S. Pension 2.2$ 1.9$ Non-U.S. Pension 4.4 4.4
Total Global Pension 6.6$ 6.3$
Total Unfunded OPEB 6.2$ 6.1$
Company excl. Ford Credit
Company Balance Sheet Underfunded Status**
35
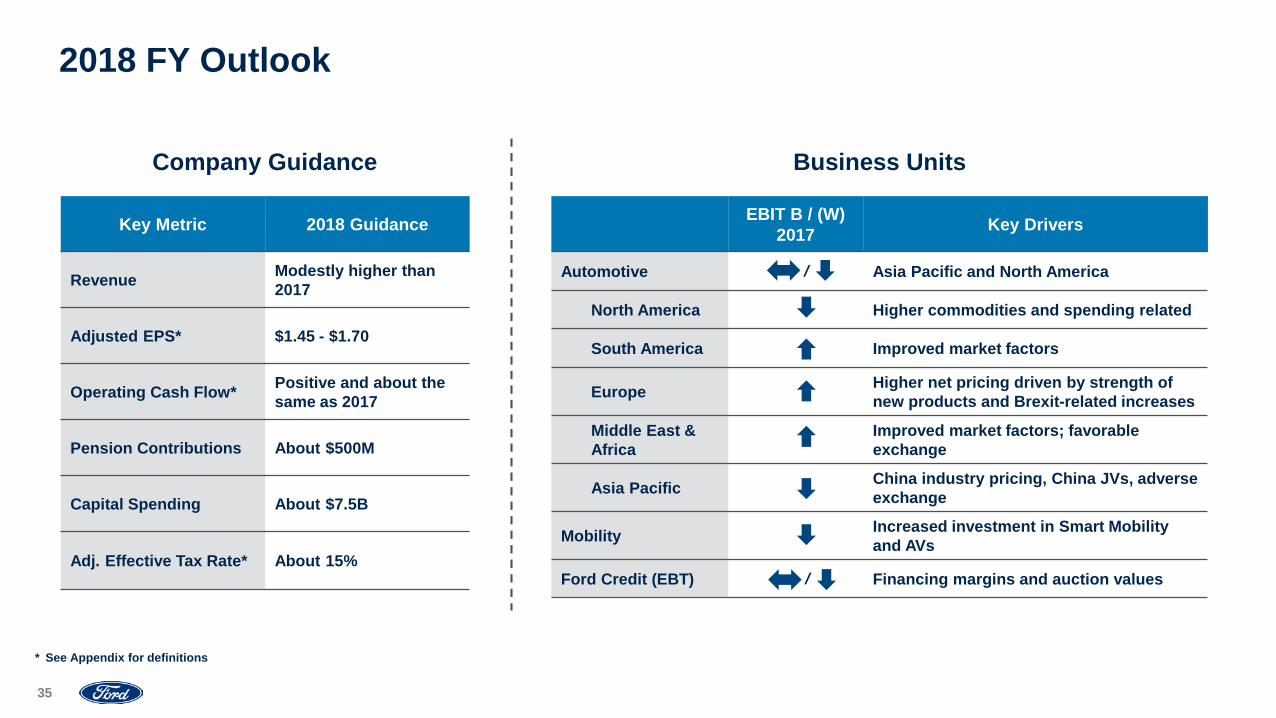
2018 FY Outlook
EBIT B / (W) 2017 Key Drivers
Automotive / Asia Pacific and North America
North America Higher commodities and spending related
South America Improved market factors
Europe Higher net pricing driven by strength of new products and Brexit-related increases
Middle East & Africa
Improved market factors; favorable exchange
Asia Pacific China industry pricing, China JVs, adverse exchange
Mobility Increased investment in Smart Mobility and AVs
Ford Credit (EBT) / Financing margins and auction values
Key Metric 2018 Guidance
Revenue Modestly higher than 2017
Adjusted EPS* $1.45 - $1.70
Operating Cash Flow* Positive and about the same as 2017
Pension Contributions About $500M
Capital Spending About $7.5B
Adj. Effective Tax Rate* About 15%
* See Appendix for definitions
Company Guidance Business Units

Questions & Answers
37
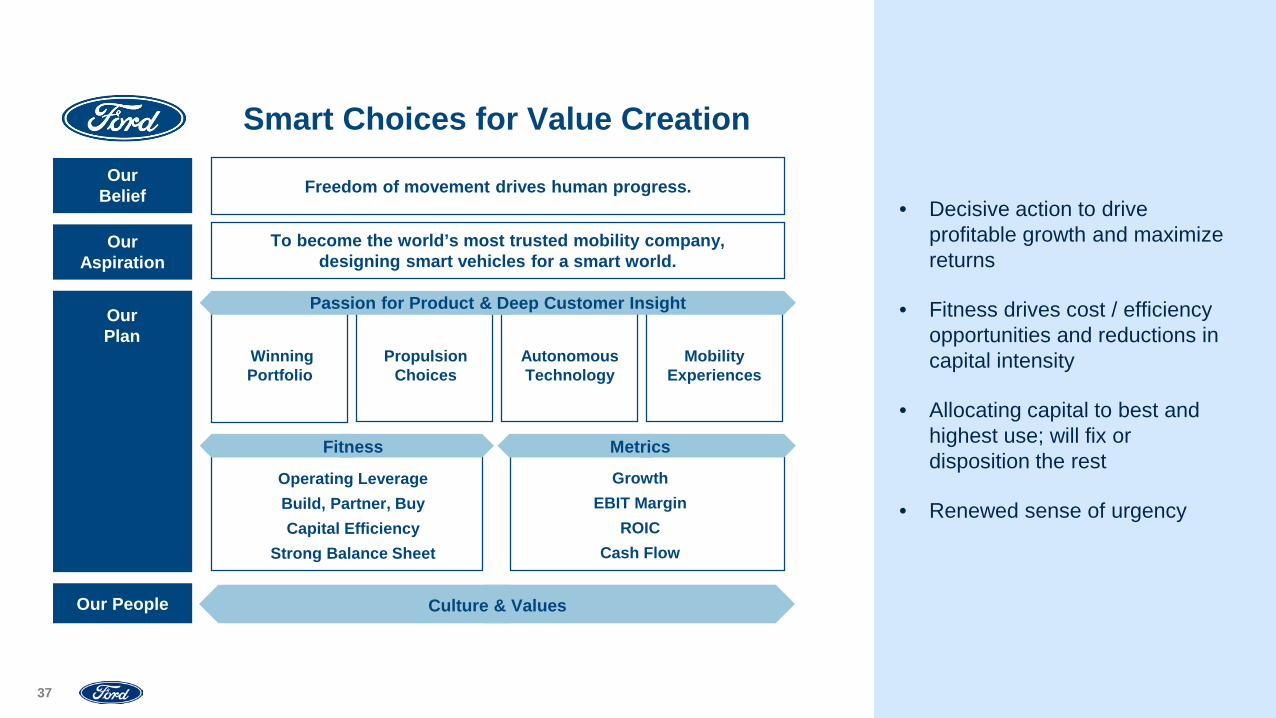
OurBelief
OurPlan
Smart Choices for Value Creation
WinningPortfolio
Propulsion Choices
Autonomous Technology
MobilityExperiences
Operating LeverageBuild, Partner, BuyCapital Efficiency
Strong Balance Sheet
Fitness
Culture & Values
Metrics
GrowthEBIT Margin
ROICCash Flow
Passion for Product & Deep Customer Insight
Our People
OurAspiration
Freedom of movement drives human progress.
To become the world’s most trusted mobility company,designing smart vehicles for a smart world.
• Decisive action to drive profitable growth and maximize returns
• Fitness drives cost / efficiency opportunities and reductions in capital intensity
• Allocating capital to best and highest use; will fix or disposition the rest
• Renewed sense of urgency
38
Cautionary Note On Forward-Looking StatementsStatements included or incorporated by reference herein may constitute “forward-looking statements” within the meaning of the Private Securities Litigation Reform Act of 1995. Forward-looking statements are based on expectations, forecasts, and assumptions by our management and involve a number of risks, uncertainties, and other factors that could cause actual results to differ materially from those stated, including, without limitation:• Ford’s long-term competitiveness depends on the successful execution of fitness actions;• Industry sales volume, particularly in the United States, Europe, or China, could decline if there is a financial crisis, recession, or significant geopolitical event;• Ford’s new and existing products and mobility services are subject to market acceptance;• Ford’s results are dependent on sales of larger, more profitable vehicles, particularly in the United States;• Ford may face increased price competition resulting from industry excess capacity, currency fluctuations, or other factors;• Fluctuations in commodity prices, foreign currency exchange rates, and interest rates can have a significant effect on results;• With a global footprint, Ford’s results could be adversely affected by economic, geopolitical, protectionist trade policies, or other events;• Ford’s production, as well as Ford’s suppliers’ production, could be disrupted by labor disputes, natural or man-made disasters, financial distress, production difficulties, or other factors;• Ford’s ability to maintain a competitive cost structure could be affected by labor or other constraints;• Pension and other postretirement liabilities could adversely affect Ford’s liquidity and financial condition;• Economic and demographic experience for pension and other postretirement benefit plans (e.g., discount rates or investment returns) could be worse than Ford has assumed;• Ford’s vehicles could be affected by defects that result in delays in new model launches, recall campaigns, or increased warranty costs;• Safety, emissions, fuel economy, and other regulations affecting Ford may become more stringent;• Ford could experience unusual or significant litigation, governmental investigations, or adverse publicity arising out of alleged defects in products, perceived environmental impacts, or otherwise;• Ford’s receipt of government incentives could be subject to reduction, termination, or clawback;• Operational systems, security systems, and vehicles could be affected by cyber incidents;• Ford Credit’s access to debt, securitization, or derivative markets around the world at competitive rates or in sufficient amounts could be affected by credit rating downgrades, market volatility, market disruption,
regulatory requirements, or other factors;• Ford Credit could experience higher-than-expected credit losses, lower-than-anticipated residual values, or higher-than-expected return volumes for leased vehicles;• Ford Credit could face increased competition from banks, financial institutions, or other third parties seeking to increase their share of financing Ford vehicles; and• Ford Credit could be subject to new or increased credit regulations, consumer or data protection regulations, or other regulations.We cannot be certain that any expectation, forecast, or assumption made in preparing forward-looking statements will prove accurate, or that any projection will be realized. It is to be expected that there may be differences between projected and actual results. Our forward-looking statements speak only as of the date of their initial issuance, and we do not undertake any obligation to update or revise publicly any forward-looking statement, whether as a result of new information, future events, or otherwise. For additional discussion, see “Item 1A. Risk Factors” in our Annual Report on Form 10-K for the year ended December 31, 2017, as updated by subsequent Quarterly Reports on Form 10-Q and Current Reports on Form 8-K.
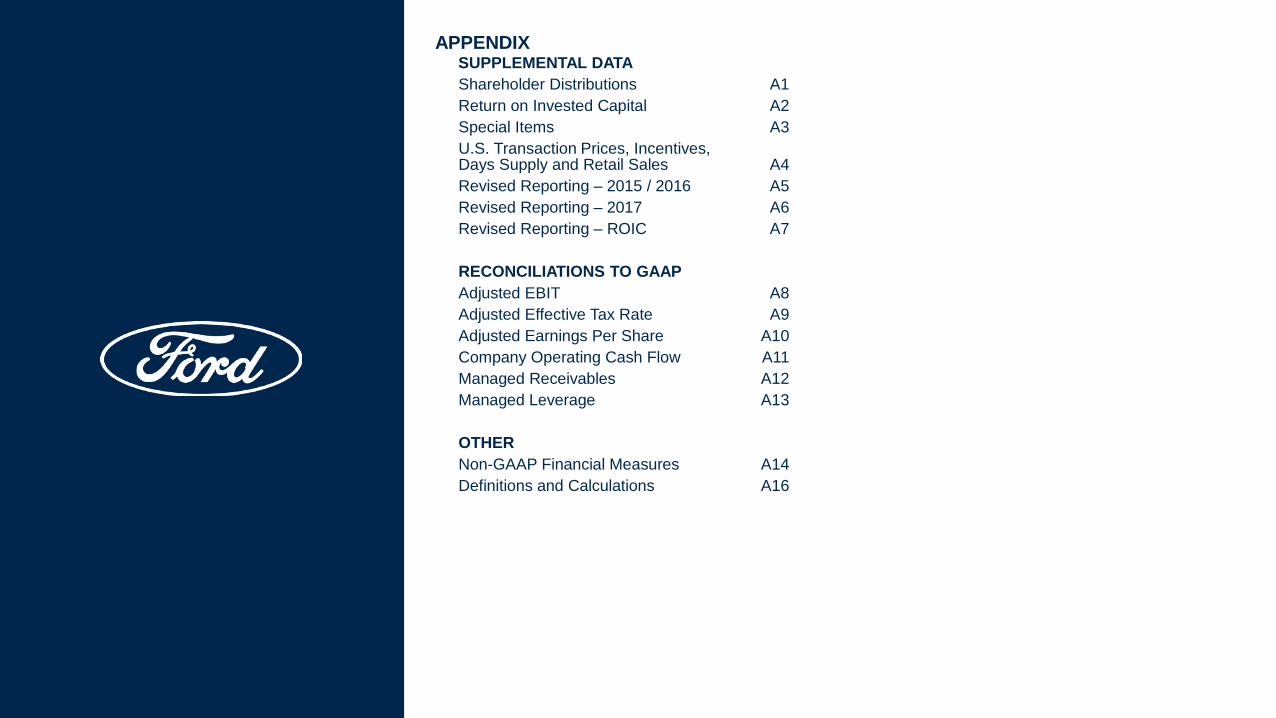
APPENDIXSUPPLEMENTAL DATAShareholder Distributions A1Return on Invested Capital A2Special Items A3U.S. Transaction Prices, Incentives,Days Supply and Retail Sales A4Revised Reporting – 2015 / 2016 A5Revised Reporting – 2017 A6Revised Reporting – ROIC A7
RECONCILIATIONS TO GAAP Adjusted EBIT A8Adjusted Effective Tax Rate A9Adjusted Earnings Per Share A10Company Operating Cash Flow A11Managed Receivables A12Managed Leverage A13
OTHERNon-GAAP Financial Measures A14Definitions and Calculations A16

40
Shareholder Distributions (Bils)
• 2018 planned distributions of about $3B for a total of $18.3B for 2012 - 2018
• Paid a first quarter regular dividend of 15¢ per share and a supplemental dividend of 13¢ per share
$1.7 $2.4 $2.4 $2.4
Average2012 - 2015
2012 - 2018
$2.7$1.0
2016
$0.6$2.3
Supplemental Dividend Anti-Dilutive Share RepurchasesRegular Dividends
2017
$1.7
$2.8
$13.8
$18.3
$3.5 $3.0
2018
A1

41
Four Quarters Four QuartersEnding 1Q 2017 Ending 1Q 2018
Net Operating Profit After Tax (NOPAT)Net income attributable to Ford 3.7$ 7.9$ Add: Non-controlling interest 0.0 0.0Less: Income tax (1.6) 0.1Add: Cash taxes (0.7) (0.7)Less: Interest on debt (1.0) (1.2)Less: Total pension / OPEB income / (Cost) (2.7) 0.7Add: Pension / OPEB service costs (1.1) (1.2)
Net operating profit after tax 7.3$ 6.5$
Invested CapitalEquity 31.2$ 36.4$ Redeemable non-controlling interest 0.1 0.1Automotive and other debt 16.8 16.4Net pension and OPEB liability 14.3 12.4
Invested capital (end of period) 62.4$ 65.4$
Four quarter average invested capital 59.7$ 64.3$
Annual ROIC* 12.3% 10.1%
Return On Invested Capital Calculation (Bils)
A2
* Calculated as the sum of Net Operating Profit After Tax from the last four quarters, divided by the average Invested Capital over the last four quartersNote: Results may not sum due to rounding

42
Company Special Items (Mils)
* Includes related tax effect on special items and tax special items
A3
Memo:2017 2018 FY 2017
Pension and OPEB gain / (loss)Year end net pension and OPEB remeasurement loss -$ -$ (162)$ Other pension remeasurement gain - 26 - Pension curtailment gain - 15 354
Separation-related actions (22) (9) (297)
Other ItemsSan Luis Potosi plant cancellation 46 - 41 Next-generation Focus footprint change - (9) (225)
Total pre-tax special items 24$ 23$ (289)$
Tax special items (15)$ (4)$ 897$
Memo:Special items impact on earnings per share* -$ -$ 0.15$
1Q

43
U.S. Transaction Prices, Incentives and Days Supply
* Source: J.D. Power PIN ISR data – cash / APR / lease (blended) transaction; industry data includes Ford
A4
Ford Industry
YoY Average Transaction Price* 1,646$ 879$
YoY Incentive Change as Pct. Of Vehicle Price* (0.2) -
U.S. Gross Days Supply 84 68
First Quarter

44
Revised Reporting – 2015 And 2016 (Mils)
A5
2015 2016Full Year 1Q 2Q 3Q 4Q Full Year
North America 9,500$ 3,178$ 2,813$ 1,383$ 2,008$ 9,382$ South America (800) (249) (257) (287) (284) (1,077) Europe 350 461 495 168 194 1,318 Middle East & Africa 45 (10) (61) (148) (66) (285) Asia Pacific 827 241 14 152 305 712
Automotive 9,922$ 3,621$ 3,004$ 1,268$ 2,157$ 10,050$ Mobility - (12) (20) (42) (43) (117) Ford Credit 2,086 514 400 567 398 1,879 Corporate Other (452) (61) (148) (117) (172) (498)
Adjusted EBIT 11,556$ 4,062$ 3,236$ 1,676$ 2,340$ 11,314$ Interest on Debt (829) (214) (226) (252) (259) (951) Special Items Pre-Tax (548) (186) (118) (26) (3,249) (3,579) Taxes (2,854) (1,200) (909) (430) 355 (2,184) Less: Non-Controlling Interests (2) 3 2 4 2 11
Net Income Attributable to Ford 7,327$ 2,459$ 1,981$ 964$ (815)$ 4,589$
Company Operating Cash Flow (Bils) 7.5$ 2.7$ 4.1$ (2.0)$ 1.5$ 6.3$
Automotive EBIT Margin (Pct) 7.1% 10.3% 8.1% 3.8% 6.0% 7.1%Company Adjusted EBIT Margin (Pct) 7.7 10.8 8.2 4.7 6.1 7.5
Adjusted EPS - Diluted 1.92$ 0.68$ 0.53$ 0.26$ 0.30$ 1.76$ EPS (GAAP) - Diluted 1.83 0.62 0.50 0.24 (0.21) 1.15
45
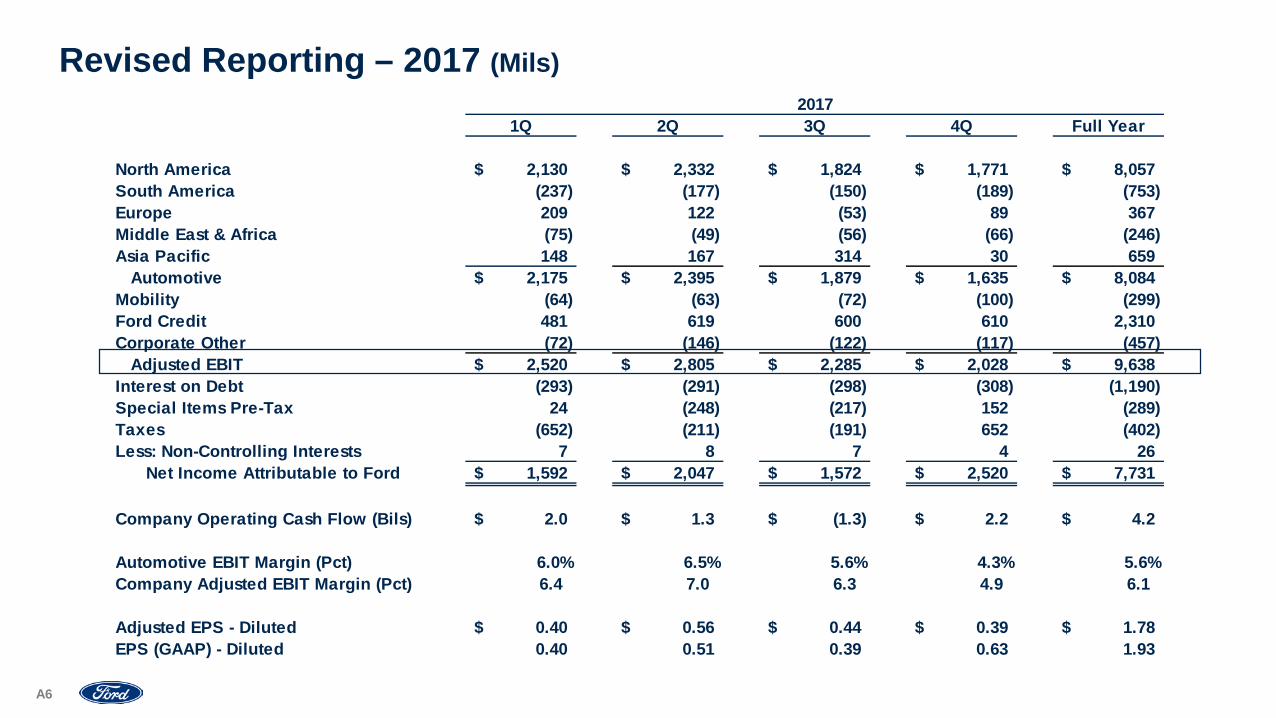
Revised Reporting – 2017 (Mils)
A6
20171Q 2Q 3Q 4Q Full Year
North America 2,130$ 2,332$ 1,824$ 1,771$ 8,057$ South America (237) (177) (150) (189) (753) Europe 209 122 (53) 89 367 Middle East & Africa (75) (49) (56) (66) (246) Asia Pacific 148 167 314 30 659
Automotive 2,175$ 2,395$ 1,879$ 1,635$ 8,084$ Mobility (64) (63) (72) (100) (299) Ford Credit 481 619 600 610 2,310 Corporate Other (72) (146) (122) (117) (457)
Adjusted EBIT 2,520$ 2,805$ 2,285$ 2,028$ 9,638$ Interest on Debt (293) (291) (298) (308) (1,190) Special Items Pre-Tax 24 (248) (217) 152 (289) Taxes (652) (211) (191) 652 (402) Less: Non-Controlling Interests 7 8 7 4 26
Net Income Attributable to Ford 1,592$ 2,047$ 1,572$ 2,520$ 7,731$
Company Operating Cash Flow (Bils) 2.0$ 1.3$ (1.3)$ 2.2$ 4.2$
Automotive EBIT Margin (Pct) 6.0% 6.5% 5.6% 4.3% 5.6%Company Adjusted EBIT Margin (Pct) 6.4 7.0 6.3 4.9 6.1
Adjusted EPS - Diluted 0.40$ 0.56$ 0.44$ 0.39$ 1.78$ EPS (GAAP) - Diluted 0.40 0.51 0.39 0.63 1.93
46
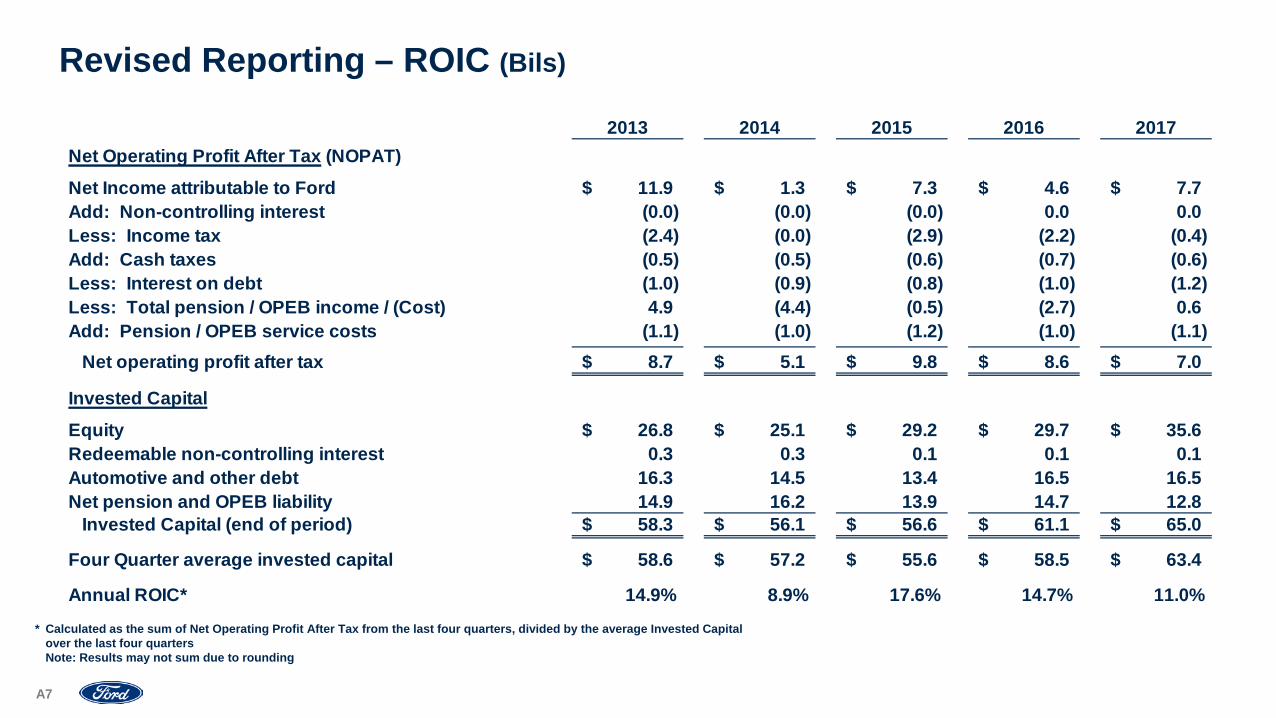
Revised Reporting – ROIC (Bils)
A7
2013 2014 2015 2016 2017Net Operating Profit After Tax (NOPAT)Net Income attributable to Ford 11.9$ 1.3$ 7.3$ 4.6$ 7.7$ Add: Non-controlling interest (0.0) (0.0) (0.0) 0.0 0.0Less: Income tax (2.4) (0.0) (2.9) (2.2) (0.4)Add: Cash taxes (0.5) (0.5) (0.6) (0.7) (0.6)Less: Interest on debt (1.0) (0.9) (0.8) (1.0) (1.2)Less: Total pension / OPEB income / (Cost) 4.9 (4.4) (0.5) (2.7) 0.6Add: Pension / OPEB service costs (1.1) (1.0) (1.2) (1.0) (1.1)
Net operating profit after tax 8.7$ 5.1$ 9.8$ 8.6$ 7.0$
Invested CapitalEquity 26.8$ 25.1$ 29.2$ 29.7$ 35.6$ Redeemable non-controlling interest 0.3 0.3 0.1 0.1 0.1Automotive and other debt 16.3 14.5 13.4 16.5 16.5Net pension and OPEB liability 14.9 16.2 13.9 14.7 12.8
Invested Capital (end of period) 58.3$ 56.1$ 56.6$ 61.1$ 65.0$ Four Quarter average invested capital 58.6$ 57.2$ 55.6$ 58.5$ 63.4$
Annual ROIC* 14.9% 8.9% 17.6% 14.7% 11.0%* Calculated as the sum of Net Operating Profit After Tax from the last four quarters, divided by the average Invested Capital
over the last four quartersNote: Results may not sum due to rounding
47
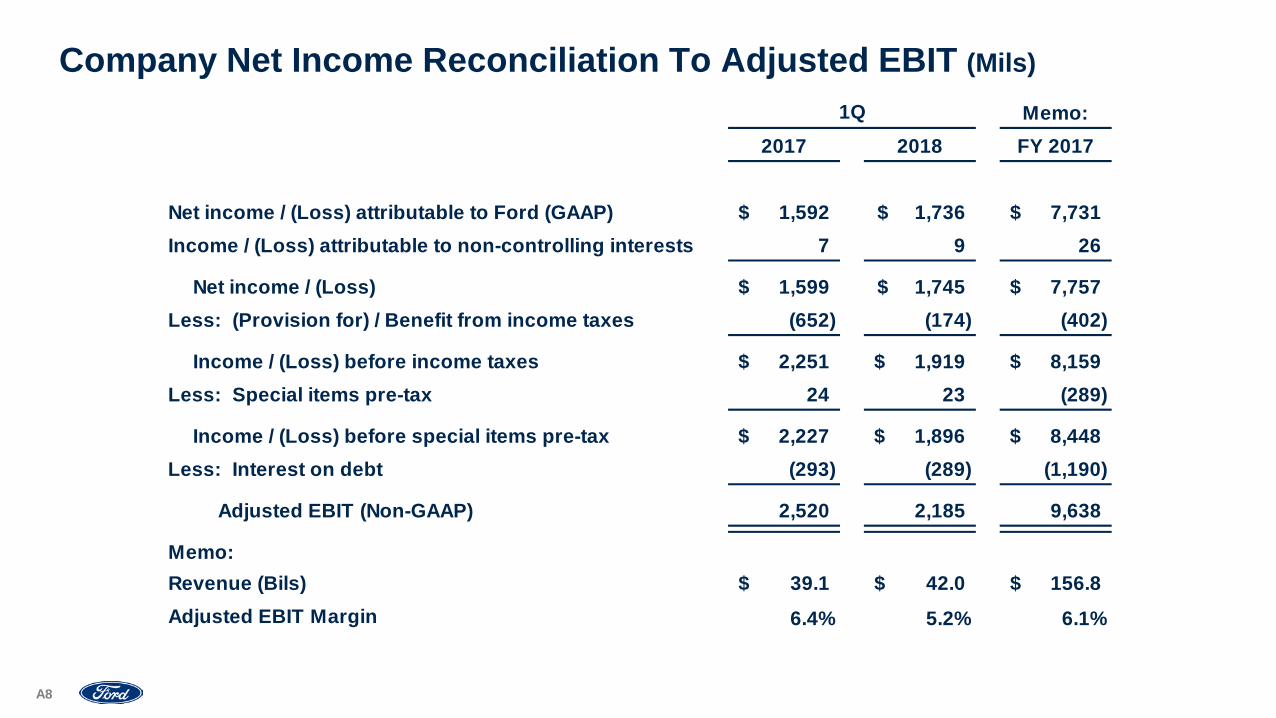
Company Net Income Reconciliation To Adjusted EBIT (Mils)
A8
Memo:2017 2018 FY 2017
Net income / (Loss) attributable to Ford (GAAP) 1,592$ 1,736$ 7,731$ Income / (Loss) attributable to non-controlling interests 7 9 26
Net income / (Loss) 1,599$ 1,745$ 7,757$ Less: (Provision for) / Benefit from income taxes (652) (174) (402)
Income / (Loss) before income taxes 2,251$ 1,919$ 8,159$ Less: Special items pre-tax 24 23 (289)
Income / (Loss) before special items pre-tax 2,227$ 1,896$ 8,448$ Less: Interest on debt (293) (289) (1,190)
Adjusted EBIT (Non-GAAP) 2,520 2,185 9,638
Memo:Revenue (Bils) 39.1$ 42.0$ 156.8$ Adjusted EBIT Margin 6.4% 5.2% 6.1%
1Q
48
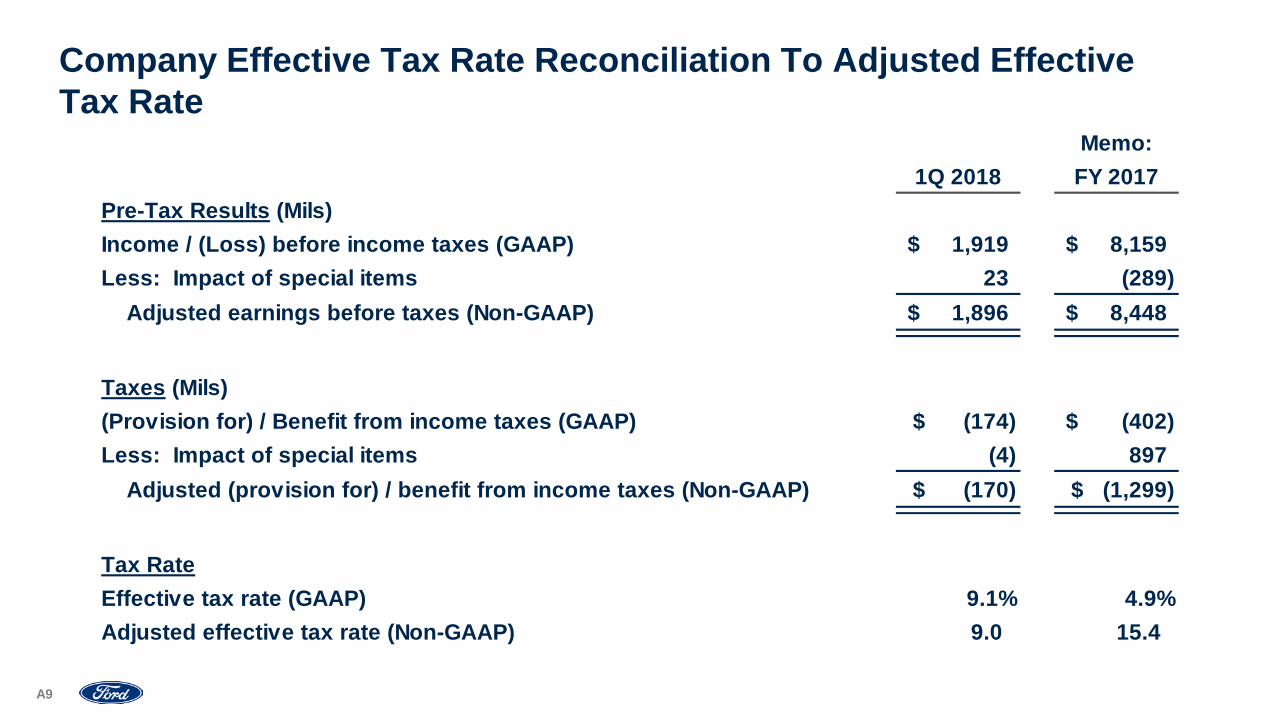
Company Effective Tax Rate Reconciliation To Adjusted Effective Tax Rate
A9
Memo:1Q 2018 FY 2017
Pre-Tax Results (Mils)Income / (Loss) before income taxes (GAAP) 1,919$ 8,159$ Less: Impact of special items 23 (289)
Adjusted earnings before taxes (Non-GAAP) 1,896$ 8,448$
Taxes (Mils)(Provision for) / Benefit from income taxes (GAAP) (174)$ (402)$ Less: Impact of special items (4) 897
Adjusted (provision for) / benefit from income taxes (Non-GAAP) (170)$ (1,299)$
Tax RateEffective tax rate (GAAP) 9.1% 4.9%Adjusted effective tax rate (Non-GAAP) 9.0 15.4
49
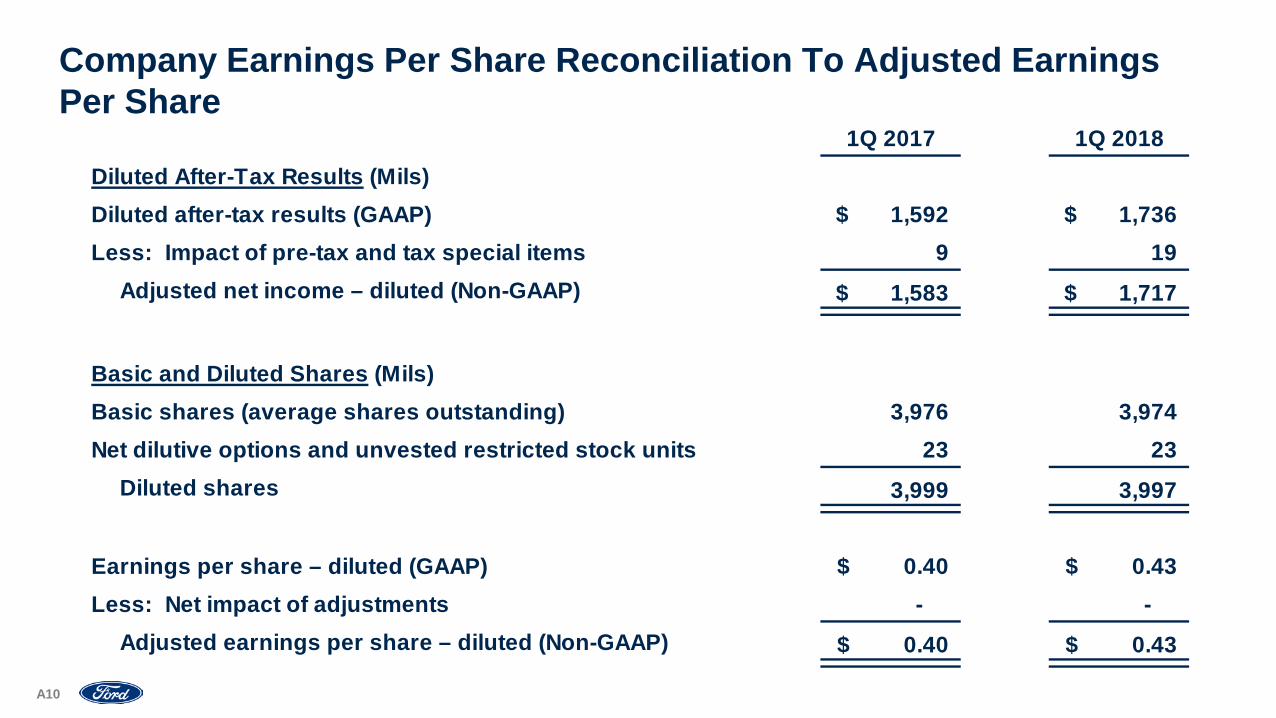
Company Earnings Per Share Reconciliation To Adjusted Earnings Per Share
A10
1Q 2017 1Q 2018Diluted After-Tax Results (Mils)Diluted after-tax results (GAAP) 1,592$ 1,736$ Less: Impact of pre-tax and tax special items 9 19
Adjusted net income – diluted (Non-GAAP) 1,583$ 1,717$
Basic and Diluted Shares (Mils)Basic shares (average shares outstanding) 3,976 3,974 Net dilutive options and unvested restricted stock units 23 23
Diluted shares 3,999 3,997
Earnings per share – diluted (GAAP) 0.40$ 0.43$ Less: Net impact of adjustments - -
Adjusted earnings per share – diluted (Non-GAAP) 0.40$ 0.43$
50
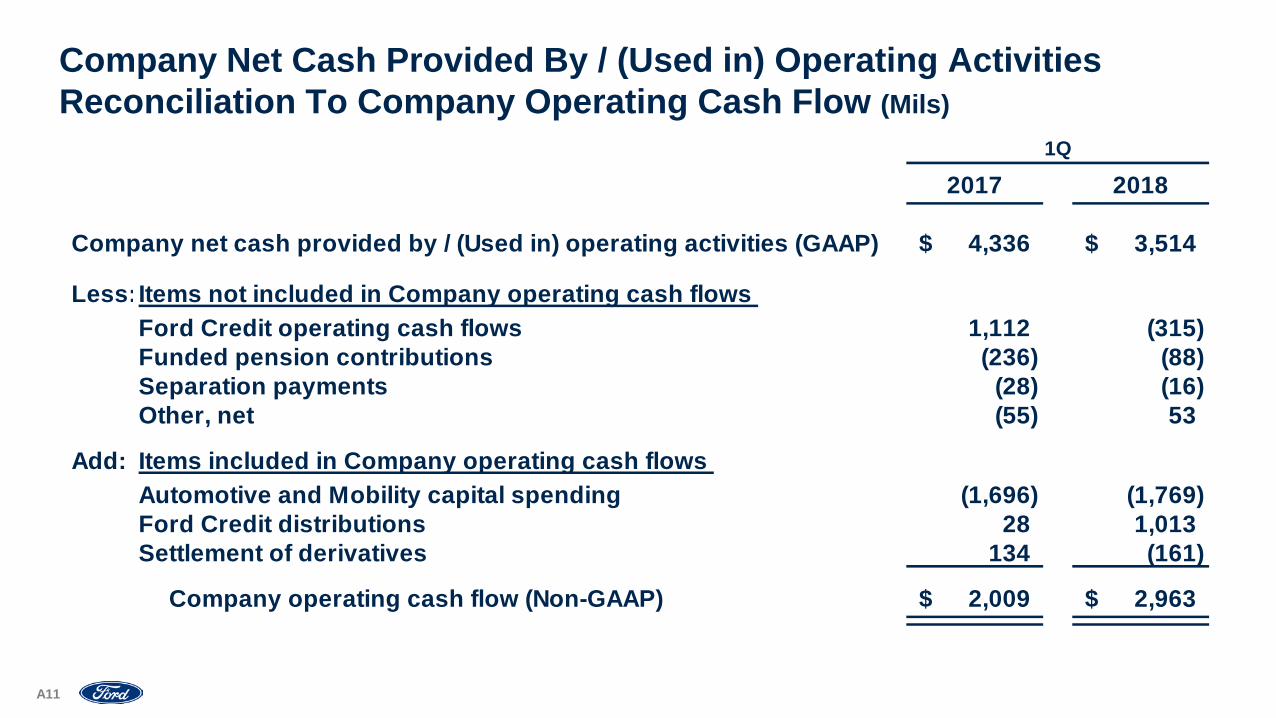
Company Net Cash Provided By / (Used in) Operating Activities Reconciliation To Company Operating Cash Flow (Mils)
2017 2018
Company net cash provided by / (Used in) operating activities (GAAP) 4,336$ 3,514$
Less:Items not included in Company operating cash flows Ford Credit operating cash flows 1,112 (315) Funded pension contributions (236) (88) Separation payments (28) (16) Other, net (55) 53
Add: Items included in Company operating cash flows Automotive and Mobility capital spending (1,696) (1,769) Ford Credit distributions 28 1,013 Settlement of derivatives 134 (161)
Company operating cash flow (Non-GAAP) 2,009$ 2,963$
1Q
A11

51
* Includes finance receivables (retail and wholesale) sold for legal purposes and net investment in operating leases included in securitization transactions that do not satisfy the requirements for accounting sale treatment. These receivables and operating leases are reported on Ford Credit’s balance sheet and are available only for payment of the debt issued by, and other obligations of, the securitization entities that are parties to those securitization transactions; they are not available to pay the other obligations of Ford Credit or the claims of Ford Credit’s other creditors
** Primarily includes Automotive segment receivables purchased by Ford Credit which are classified to Trade and other receivables on our consolidated Balance Sheet. Also includes eliminations of intersegment transactions
Ford Credit Total Net Receivables Reconciliation To Managed Receivables (Bils)
2017 2017 2018Mar 31 Dec 31 Mar 31
Ford Credit finance receivables, net (GAAP)* 99.3$ 108.4$ 111.8$ Net investment in operating leases (GAAP)* 26.4 26.7 26.7 Consolidating adjustments** 7.3 7.6 9.2
Total net receivables 133.0$ 142.7$ 147.7$
Ford Credit unearned interest supplements and residual support 5.5 6.1 6.2 Allowance for credit losses 0.6 0.7 0.7 Other, primarily accumulated supplemental depreciation 0.9 1.0 1.1
Total managed receivables (Non-GAAP) 140.0$ 150.5$ 155.7$
A12
52
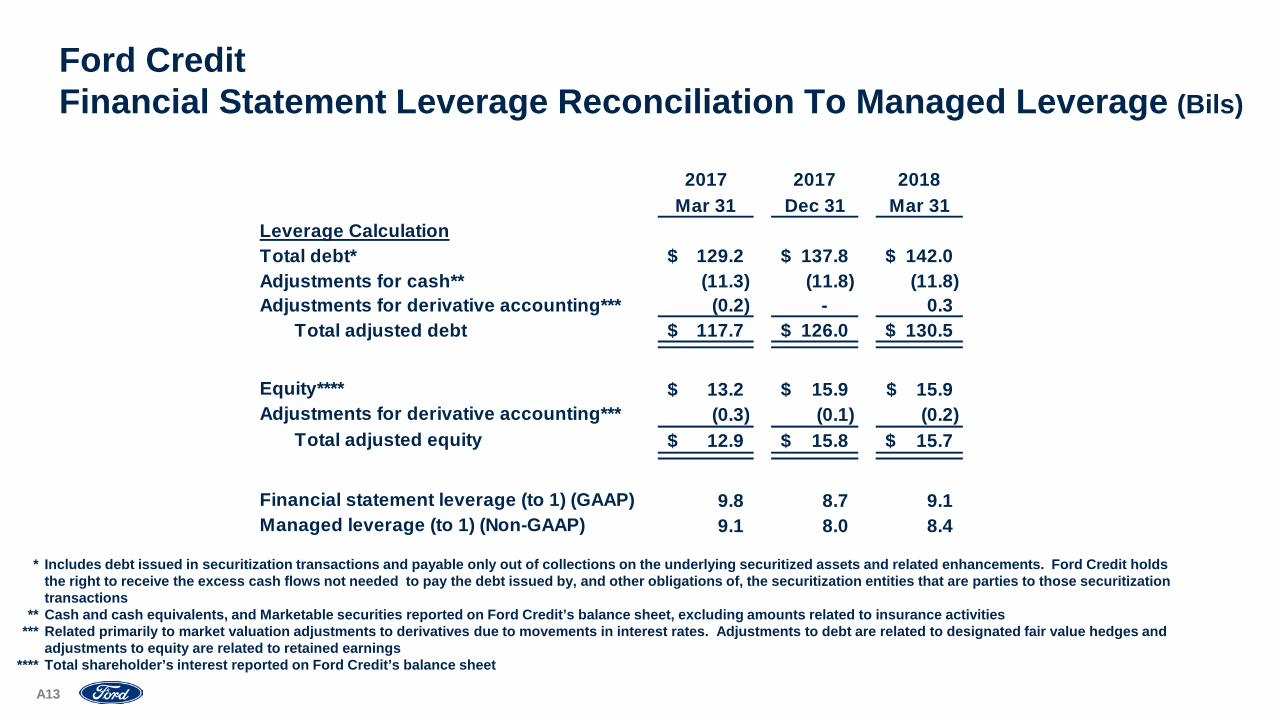
Ford Credit Financial Statement Leverage Reconciliation To Managed Leverage (Bils)
2017 2017 2018Mar 31 Dec 31 Mar 31
Leverage CalculationTotal debt* 129.2$ 137.8$ 142.0$ Adjustments for cash** (11.3) (11.8) (11.8) Adjustments for derivative accounting*** (0.2) - 0.3
Total adjusted debt 117.7$ 126.0$ 130.5$
Equity**** 13.2$ 15.9$ 15.9$ Adjustments for derivative accounting*** (0.3) (0.1) (0.2)
Total adjusted equity 12.9$ 15.8$ 15.7$
Financial statement leverage (to 1) (GAAP) 9.8 8.7 9.1 Managed leverage (to 1) (Non-GAAP) 9.1 8.0 8.4
* Includes debt issued in securitization transactions and payable only out of collections on the underlying securitized assets and related enhancements. Ford Credit holds the right to receive the excess cash flows not needed to pay the debt issued by, and other obligations of, the securitization entities that are parties to those securitization transactions
** Cash and cash equivalents, and Marketable securities reported on Ford Credit’s balance sheet, excluding amounts related to insurance activities*** Related primarily to market valuation adjustments to derivatives due to movements in interest rates. Adjustments to debt are related to designated fair value hedges and
adjustments to equity are related to retained earnings**** Total shareholder’s interest reported on Ford Credit’s balance sheet
A13
53
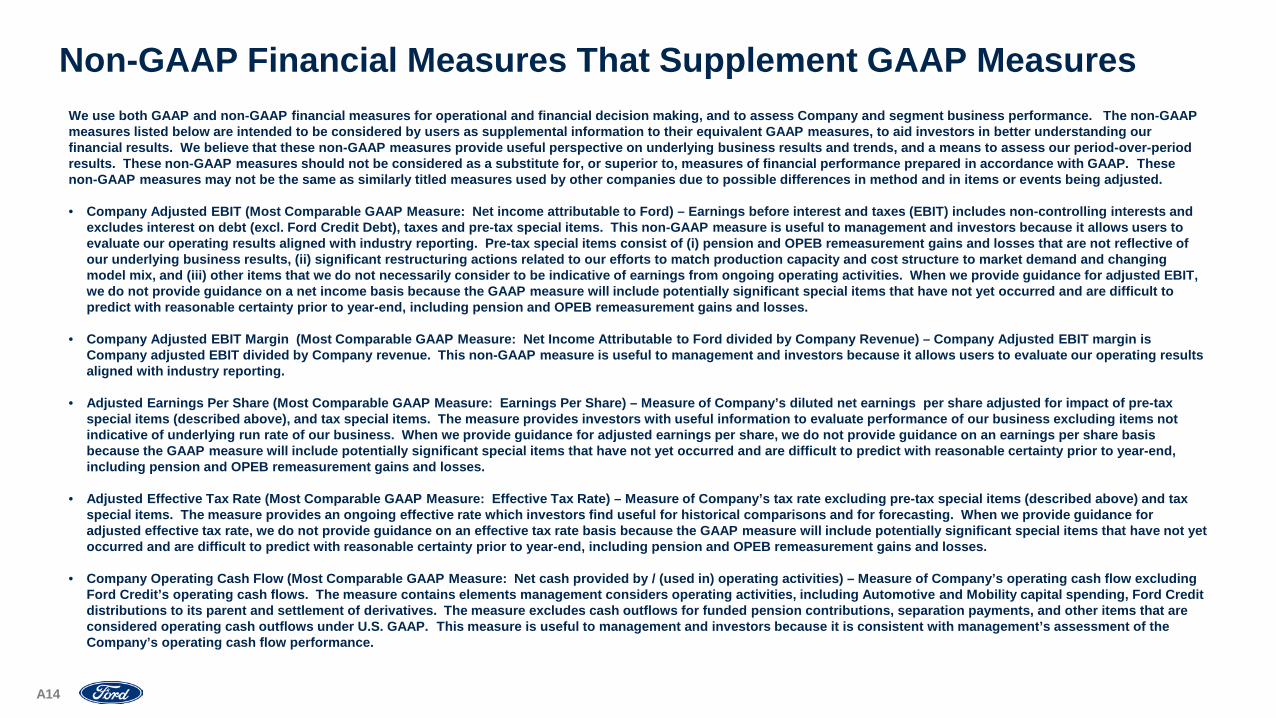
Non-GAAP Financial Measures That Supplement GAAP MeasuresWe use both GAAP and non-GAAP financial measures for operational and financial decision making, and to assess Company and segment business performance. The non-GAAP measures listed below are intended to be considered by users as supplemental information to their equivalent GAAP measures, to aid investors in better understanding our financial results. We believe that these non-GAAP measures provide useful perspective on underlying business results and trends, and a means to assess our period-over-period results. These non-GAAP measures should not be considered as a substitute for, or superior to, measures of financial performance prepared in accordance with GAAP. These non-GAAP measures may not be the same as similarly titled measures used by other companies due to possible differences in method and in items or events being adjusted.
• Company Adjusted EBIT (Most Comparable GAAP Measure: Net income attributable to Ford) – Earnings before interest and taxes (EBIT) includes non-controlling interests and excludes interest on debt (excl. Ford Credit Debt), taxes and pre-tax special items. This non-GAAP measure is useful to management and investors because it allows users to evaluate our operating results aligned with industry reporting. Pre-tax special items consist of (i) pension and OPEB remeasurement gains and losses that are not reflective of our underlying business results, (ii) significant restructuring actions related to our efforts to match production capacity and cost structure to market demand and changing model mix, and (iii) other items that we do not necessarily consider to be indicative of earnings from ongoing operating activities. When we provide guidance for adjusted EBIT, we do not provide guidance on a net income basis because the GAAP measure will include potentially significant special items that have not yet occurred and are difficult to predict with reasonable certainty prior to year-end, including pension and OPEB remeasurement gains and losses.
• Company Adjusted EBIT Margin (Most Comparable GAAP Measure: Net Income Attributable to Ford divided by Company Revenue) – Company Adjusted EBIT margin is Company adjusted EBIT divided by Company revenue. This non-GAAP measure is useful to management and investors because it allows users to evaluate our operating results aligned with industry reporting.
• Adjusted Earnings Per Share (Most Comparable GAAP Measure: Earnings Per Share) – Measure of Company’s diluted net earnings per share adjusted for impact of pre-tax special items (described above), and tax special items. The measure provides investors with useful information to evaluate performance of our business excluding items not indicative of underlying run rate of our business. When we provide guidance for adjusted earnings per share, we do not provide guidance on an earnings per share basis because the GAAP measure will include potentially significant special items that have not yet occurred and are difficult to predict with reasonable certainty prior to year-end, including pension and OPEB remeasurement gains and losses.
• Adjusted Effective Tax Rate (Most Comparable GAAP Measure: Effective Tax Rate) – Measure of Company’s tax rate excluding pre-tax special items (described above) and tax special items. The measure provides an ongoing effective rate which investors find useful for historical comparisons and for forecasting. When we provide guidance for adjusted effective tax rate, we do not provide guidance on an effective tax rate basis because the GAAP measure will include potentially significant special items that have not yet occurred and are difficult to predict with reasonable certainty prior to year-end, including pension and OPEB remeasurement gains and losses.
• Company Operating Cash Flow (Most Comparable GAAP Measure: Net cash provided by / (used in) operating activities) – Measure of Company’s operating cash flow excluding Ford Credit’s operating cash flows. The measure contains elements management considers operating activities, including Automotive and Mobility capital spending, Ford Credit distributions to its parent and settlement of derivatives. The measure excludes cash outflows for funded pension contributions, separation payments, and other items that are considered operating cash outflows under U.S. GAAP. This measure is useful to management and investors because it is consistent with management’s assessment of the Company’s operating cash flow performance.
A14

54
• Ford Credit Managed Receivables – (Most Comparable GAAP Measure: Net Finance Receivables plus Net Investment in Operating Leases) – Measure of Ford Credit’s Total net receivables, excluding unearned interest supplements and residual support, allowance for credit losses, and other (primarily accumulated supplemental depreciation). The measure is useful to management and investors as it closely approximates the customer’s outstanding balance on the receivables, which is the basis for earning revenue.
• Ford Credit Managed Leverage (Most Comparable GAAP Measure: Financial Statement Leverage) – Ford Credit’s debt-to-equity ratio adjusted (i) to exclude cash, cash equivalents, and marketable securities (other than amounts related to insurance activities), and (ii) for derivative accounting. The measure is useful to investors because it reflects the way Ford Credit manages its business. Cash, cash equivalents, and marketable securities are deducted because they generally correspond to excess debt beyond the amount required to support operations and on-balance sheet securitization transactions. Derivative accounting adjustments are made to asset, debt, and equity positions to reflect the impact of interest rate instruments used with Ford Credit’s term-debt issuances and securitization transactions. Ford Credit generally repays its debt obligations as they mature, so the interim effects of changes in market interest rates are excluded in the calculation of managed leverage.
Non-GAAP Financial Measures That Supplement GAAP Measures
A15
55
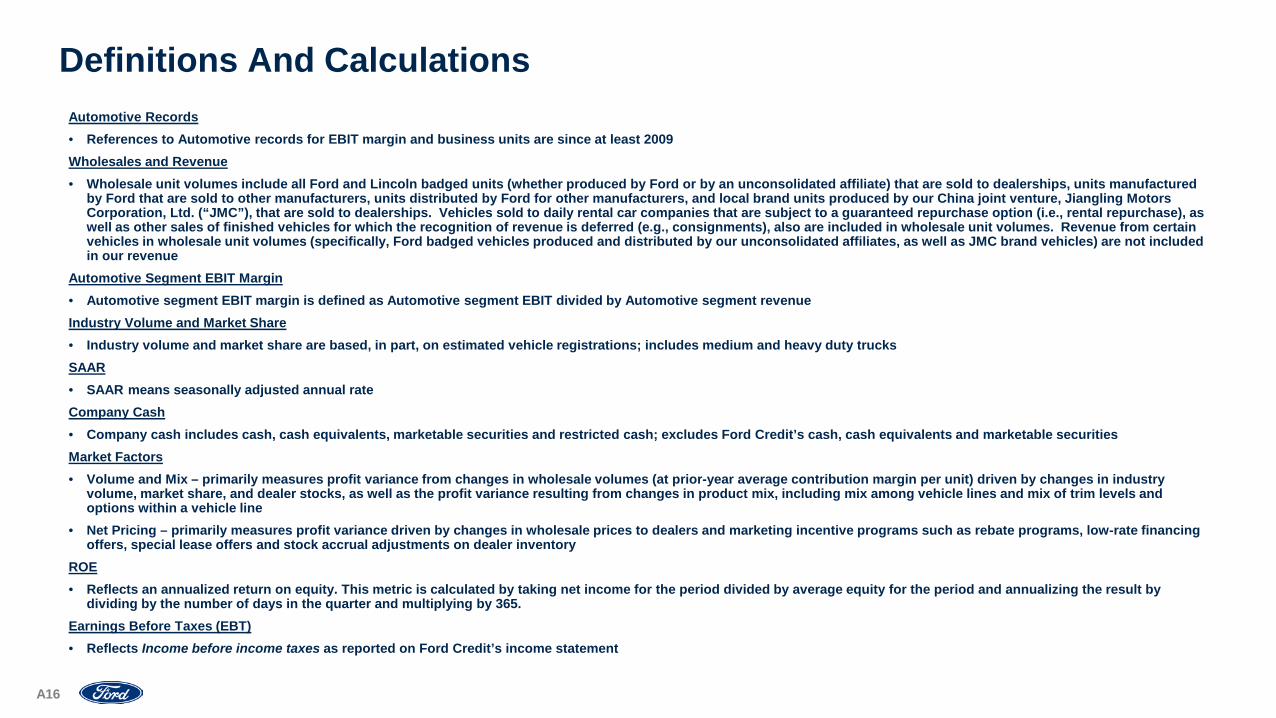
Definitions And CalculationsAutomotive Records• References to Automotive records for EBIT margin and business units are since at least 2009Wholesales and Revenue• Wholesale unit volumes include all Ford and Lincoln badged units (whether produced by Ford or by an unconsolidated affiliate) that are sold to dealerships, units manufactured
by Ford that are sold to other manufacturers, units distributed by Ford for other manufacturers, and local brand units produced by our China joint venture, Jiangling Motors Corporation, Ltd. (“JMC”), that are sold to dealerships. Vehicles sold to daily rental car companies that are subject to a guaranteed repurchase option (i.e., rental repurchase), as well as other sales of finished vehicles for which the recognition of revenue is deferred (e.g., consignments), also are included in wholesale unit volumes. Revenue from certain vehicles in wholesale unit volumes (specifically, Ford badged vehicles produced and distributed by our unconsolidated affiliates, as well as JMC brand vehicles) are not included in our revenue
Automotive Segment EBIT Margin• Automotive segment EBIT margin is defined as Automotive segment EBIT divided by Automotive segment revenueIndustry Volume and Market Share• Industry volume and market share are based, in part, on estimated vehicle registrations; includes medium and heavy duty trucks SAAR• SAAR means seasonally adjusted annual rateCompany Cash• Company cash includes cash, cash equivalents, marketable securities and restricted cash; excludes Ford Credit’s cash, cash equivalents and marketable securitiesMarket Factors• Volume and Mix – primarily measures profit variance from changes in wholesale volumes (at prior-year average contribution margin per unit) driven by changes in industry
volume, market share, and dealer stocks, as well as the profit variance resulting from changes in product mix, including mix among vehicle lines and mix of trim levels and options within a vehicle line
• Net Pricing – primarily measures profit variance driven by changes in wholesale prices to dealers and marketing incentive programs such as rebate programs, low-rate financing offers, special lease offers and stock accrual adjustments on dealer inventory
ROE• Reflects an annualized return on equity. This metric is calculated by taking net income for the period divided by average equity for the period and annualizing the result by
dividing by the number of days in the quarter and multiplying by 365.Earnings Before Taxes (EBT)• Reflects Income before income taxes as reported on Ford Credit’s income statement
A16