1oil spill mv rak final-april-2013 - maharashtra...
TRANSCRIPT

i
Final Report
Environmental Assessment of Mumbai Oil Spill from MV RAK Carrier
Maharashtra Pollution Control Board (MPCB)
National Environmental Engineering Research Institute (NEERI)
April , 2013
MPCBMPCBMPCBMPCB
ii
Final Report
Environmental Assessment of Mumbai Oil Spill from MV RAK Carrier __________________________________________________
Maharashtra Pollution Control Board (MPCB)
National Environmental Engineering Research Institute (NEERI)
April , 2013
MPCBMPCBMPCBMPCB

iii
C R E D I T S
Project Advisor
Dr. S.R. Wate
Project Coordinator
Dr. Rakesh Kumar
Research Team
Mr. Niranjan Kolekar
Ms. Prachi Nimkar
Mr. Ganesh Kadam
Ms. Geetanjali Pawar
Secretarial Assistant
Mrs. J.K.Siddhu
Mr. V.P.Chaudhari
Mr. S.S.Sawant
Mrs. Roda Irani

iv
CONTENTS ___________________________________________________________________________________________________________ 1. Background 1 2. Methodology of Assessment 3 2.1 General Methods for Assessment and Monitoring 3 2.1.1 Photo Documentation 4 2.2 Shoreline Sediment Monitoring and Assessment Methodology 4 2.2.1 Monitoring Methods for Shoreline Oil 5 2.2.2 Sediment Assessment 6 2.2.3 Beach Fauna Assessment 8 2.2.4 Coastal Flora Assessment 8 3. Status of Impact on Sediments 9 3.1 Short Term Impacts on Sediments 9 4. Remote Sensing Analysis 10 5. Impact Mapping of Affected Areas 14 6. Short Term Assessment 18 6.1 Juhu Beach 18 6.2 Madh Island Beaches 20 6.3 Aksa Beach 22 6.4 Gorai Beach 24 6.5 Marve Beach 25 6.6 Alibaug Beach 26 7. Second Phase Assessment 27 8. Summary of Mapping 28 8.1 Water and Sediment Quality 30 9. Damage Cost Evaluation 32 9.1 Review of Cost Estimation Methodologies 32 9.2 Modified Approach 33 9.2.1 Other Cases 34 9.3 Approach and Methodology of Mumbai Case 35 9.4 Damage Cost Evaluation 36 9.5 Summary 37 10 Recommendations 38 ___________________________________________________________________________________________________________

1
ENVIRONMENTAL ASSESSMENT OF MUMBAI OIL SPILL FROM MV RAK CARRIER
1. Background A Panama-flagged cargo ship named MV RAK Carrier sank nearly 20 nautical miles off the Mumbai coast on 4th August, 2011, due to water ingress (Plate 1). The ship was on its voyage from Lubuk Tutung, Indonesia to Dahej, Gujarat carrying 60,054 metric tonnes of coal and 290 tonnes of fuel oil and 50 tonnes of diesel oil. After ingress of water was reported from the ship a joint team of Indian Coast Guard and Indian Navy personnel launched a rescue effort. The geographical position of the sunken ship is 18046’29”N, 72029’19”E. Considering high risk of a massive spill Coast Guard (CG) and Emergency towing vehicle (ETV) were ready to deal with any spillage with oil pollution response vessel Samudra Prahari. The spillage of fuel oil was reported on 6th August, 2011 from sunken vessel, by various media sources. The continuous trail of the oil leak from the vessel was observed up to 12 nautical miles, very thick oil upto 1 nautical mile, thick layer of oil up to 2 nautical miles and there after only oil sheen was seen till 12 nautical miles, during initial period of accident. The coast guard vessel Sanklap, pollution response vessels Samudra Prahari supported by Doeniers and Amrit kaur were present to abate oil pollution using oil spill dispersant (OSD) along with churning technique to offset the impact. Though prearrangement were made to combat oil spill, considerable amount reached shoreline of Bandra, Gorai, 5-6 km stretch of Alibaug coast, along Juhu beach where large oil patches were observed. The spilled fuel oil also traveled to different other coast line of the Mumbai Metropolitan region (MMR) and nearby areas like Madh, Aksa beach etc.
Plate 1 : Sinking MV RAK

2
On 7th August, 2011 as well, continuous trail of spilled oil was observed up to 12 nautical miles, very thick layer up to 1 nautical mile and thick layer up to 2 nautical miles and thin layer or oil sheen thereafter along 12 nautical miles. The local P & I (Protection and Indemnity club) was also scheming to mobilize suitable resources to either seal the oil leakage from ship or debunker the oil from sunken vessel. On 8th August 2011, Coast Guard conducted air sorties reported that oil from sunken ship was continuing to escape but at much reduced rate of 8 to 10 tonnes per day as compared to 35 to 40 tonnes per day earlier. Oil trail was observed up to 5 to 8 nautical miles as compared 12 nautical miles earlier. The tar balls were observed at the mouth of the estuary near Alibaug as at Dadar and Bandra bandstand silvery patches of oil sheen were seen. During this period no fresh oil was reported at Juhu and Versova beaches. Oil leakage continued next day with same rate of 8 to 10 tonnes per day with fresh oil and tar balls were reported at Gorai and Juhu beach. Signs of spilled oil were also seen at INS Kunjali, Colaba, and about five nautical miles from Mahalaxmi temple. After receiving information from Marine Rescue Coordination Center (MRCC) Coast Guard, West region immediately started their rescue operation and saved the 30 crews which were on board. As per Coast Guard officials 340 tonnes of FFO (Furnace Fuel Oil) and Low Sulfur High Flash High Speed Diesel (LSHFHSD) were on the vessel. After spillage of oil from ships the coastguard ready to control spilled oil and used the OSD (Oil Spill Dispersant). They sprayed around 7390 liters of OSD by the different oil spill rescue and other vessels and 1500 liters of Type-III OSD by the Dornier aircraft. Rescue and oil spill control operation continued till 23 August which started on 8th August. Coast Guard has launched operation “Paryavaran Suraksha 02/2011” to augment ongoing pollution response operation and to prevent damage to fragile marine environment along the coast of Maharashtra. Maharashtra Pollution Control Board had taken immediate steps to initiate visit and also taking samples. It also requested NEERI to initiate the study to understand the impact and prepare a report for the same. NEERI team started the visit from the very first day, when the incident came to light as it had earlier also carried out the assessment of collision of two ships MSC Chitra and Khalijja in previous year. The report presented here delineates the impact immediately after the oil spill impact was seen on coasts as also interpretation of the movement of the oil spill. At the end it also recommends the possible preparation and institutional arrangement for addressing such cases more efficiently and in a robust manner.

3
2. Methodology of Assessment The methodologies used for the assessment of different attributes of environment affected by the oil spill have been summarized here. Methodologies were reviewed and after visiting and assessing the actual site conditions; suitable modifications in the methodologies have been made. 2.1 General Methods for Assessment and Monitoring The basic aim of a sampling design is to ensure field samples are representative of the area, habitat or community being investigated, and are collected efficiently and cost effectively. There are three basic approaches relevant to selecting sample locations: Selective Sampling : This sampling is deliberately biased to specific areas, e.g. visibly oil-free and oil-impacted sites. It is ideal for Type I monitoring as it allows a smaller number of samples to be collected from the areas of most interest. However, it has a relatively high potential for error if variability is unknown. Random Sampling : This is a more scientifically valid method but usually requires a large number of sample locations. Systematic Sampling : This sampling area uses a grid or consistent pattern across the defined area. This approach is most suitable when looking for non-obvious contaminated locations, for most known areas of the present case, this method has been added. Use of Quadrats and Transects : If the parameter being measured is based on area (e.g. animals per m2), small sampling perimeters or “quadrats” can be used. Quadrat size will depend on what is being sampled and the numbers to be counted. With large quadrats, numbers can become unwieldy, if they are too small, sampling variability problems may arise. Generally, for shoreline work, an area of 0.2- 0.3 m2 is sufficient (e.g. a 0.25m2 area would be a 50 cm x 50cm square quadrat or a circular qaudrat with a diameter of about 56.4cm) for mangroves and large area, assessment quadrate size is much larger. Transects are surveyed lines, usually passing from high to low tide, along which samples are taken. Like quadrats, transects can be positioned selectively, randomly or at regular intervals. Sampling points or quadrats can be distributed along transect continuously, selectively, randomly, or at regular intervals. In the last case this would effectively be the same as a grid pattern. In the present study, this method has been extensively used.

4
2.1.1 Photo Documentation Photographic documentation can range from video or photo-surveys of coastlines or slicks at sea to detailed photographs of quadrants, transects, or individual impacted plant and wildlife. Photo documentation has the advantages that skilled interpretation of data can be done later, remotely and be consistently interpreted. This overcomes problems of shortage of skilled staff and the need to calibrate estimates by different field staff. More accurate calculations of percentage cover and numbers may also be possible. 2.2 Shoreline Sediment Monitoring and Assessment Methodology This component includes three major categories. Collection and arrangement of shoreline maps for background information Determination and marking of the affected areas to fix the survey area Determination of substrate type
The Coastline substrate can be divided into following types Bedrock or Rock: Porous/non-porous, Broken/not broken Boulder: Porous/non-porous, Broken/not broken Pebble: Or “shingle” if flattened Granules/ Gravel: Rounded/flat. • Compacted/loose Sand: Fine to coarse Mud/Silt/ Clay: Consolidated/loose Earth/ Soil: applicable to cliffs and seawalls Shell grit: Wet/dry. Usually with sand Coral: Rubble/Boulder/Cobble Concrete: Rubble Wood: Debris/logs; pilings. Debris can overlay other substrates Metal: Pilings, sheeting. Usually artificial structures
Shoreline Form – The form of shoreline is linked with Gradient, Width and Height etc. These can be interlinked with the level of energy used or destroyed depending upon the locations specifically gradient and substrate. The energy form that is common in coastal regions leads to different type of substrates and forms but also linked with slopes of shore. It is seen that within a short distance also, the energy levels can transform the substrate based on forms and gradients as shown below.

5
Shoreline Energy 2.2.1 Monitoring Methods for Shoreline Oil Ground Surveys : Ground surveys are the most important step for identification and demarcating of oil impact area. In particularly to measure or estimate the thickness of oily bands, and describe the character of the oil these surveys play a vital role. Ground surveys are also required to determine whether subsurface oil is present, usually from percolation of oil into interstitial spaces, or by burial by mobile sediments. Subsurface oil adds significantly to the cleanup efforts required and may also have significant implications for waste management. Assessment of Oiled Shorelines: Surface Oil The method employed uses following steps: Shoreline is divided into sectors and segments for the easy detailed study. The documentation is made for Length, Width, Substrate, Form etc. For each Segment, sketch is drawn showing the approximate location of the oil. Length, width and the percent cover (visually) are recorded. Oil thickness is assessed by dividing into Pooled oil, Cover, Coat, Stain or Film
Assessment of Oiled Shorelines: Sub-Surface Oil Shoreline is divided into Sectors and Segments for the documentation The documentation is also made for Length, Width, Substrate, Form etc. similar to surface
oil. Trenches or pits are dug to detect subsurface oil. Narrow trenches are more suitable for sandy
substrates. Pits are more suitable for small boulder substrates. The depth required depends on substrate type and, for sand – pebbles, on sediment mobility (wave energy), if applicable.
For each location, where pit is made along a transect trench, following details are recorded: o Minimum depth of oil, distance from the beach surface to the top of the buried layer. o Substrate type at various depths or in the oily bands as required. o Description of the oil in the oily layer.
Low HighEnergy
Substrate
Forms
Gradient /Slope
Mud Sand Grits Pebble Cobble Boulder Bedrock
Swamps Flats Beach Reefs Cliffs
Gentle slope Steep slope Vertical
Low HighEnergy
Substrate
Forms
Gradient /Slope
Mud Sand Grits Pebble Cobble Boulder Bedrock
Swamps Flats Beach Reefs Cliffs
Gentle slope Steep slope Vertical

6
2.2.2 Sediment Assessment The movement of oil to the shoreline area is due to the natural tidal movement leading to deposition on the shoreline sediment. The impact of the oil spill on the shoreline depends on the shoreline energy, which depends on the type of substrate, from of the substrate and the gradient. The substrate types along the studied impact area mainly include bedrock, boulders, pebbles and the sandy type. Whereas forms can be given as beach, swamps and flats. Most of the impacted sites have natural seaward gentle slope. The impact and its persistence also depend on the texture of the sediment type as the rough surfaces; creviced surfaces hold more oil than that of smooth and fine textured surfaces. In this particular study, degree of impact on the shore line area varies greatly in the various areas. Oil is rarely incorporated into seabed sediments as a result of the weathering of surface slicks. However, oil can be incorporated into marine sediments as a result of the natural redistribution of oiled pebbles, sands, and silts due to wave or following remobilization by shoreline cleanup activities, particularly washing methods. If this accumulates to a significant extent then alternative cleanup strategies may be required. Monitoring of both natural and cleanup induced sand redistribution may be necessary to better determine the net environmental benefits of natural cleaning or intervention. This monitoring method is usually suitable for shallow waters. Grab Samplers or Drop Corers are used. The sediment sampling methods are dependent on the basis of oil layer thickness and the type of the sediment affected. Push Core Sampling A : This method of sampling involves pushing a clean plastic tube down into the substrate and extracting a column, or “core” of sediment. It is suitable for most sediment conditions, but particularly when: Oil is present on the surface as a thin layer (coat, stain, film). Oil penetrated to a fairly shallow depth (e.g. < 10 cm). Accurate measures of the amount of oil at various depths are not needed
Methodology Push plastic tube into sediment. Generally the depth of sampling should not be more than two thirds of the length of the tube. Seal the top of the tube and extract.

7
If the sediment is wet or loose, or does not stick to the inside of the tube when extracted, it is necessary to dig down beside the tube and block the bottom opening before removing.
The core of sediment should be transferred immediately to a clean glass container. Some of the methods used are shown in Plate 2.
Push Core Sampling B : This method is essentially the same as Method 1, but is used when it is necessary to differentiate between surface oil and subsurface oil. This method is needed in following situation: The amount of oil that could be removed by tidal action (i.e. surface oil) in low energy shores
and oil likely to persist (i.e. subsurface oil). In this case the presence of relatively large amounts of surface oil could mask any
observation of changes in subsurface oil (or vice versa).
Methodology Scrape surface oil from a given area prior to pushing in the sampling tube. Transfer this “surface sample” to a clean storage jar and record the area cleaned (square
centimeters) and approximate depth of sediment removed. Rest is same as method ‘Push Core Sampling A’.
Assessment and Sampling of Seabed Sediments: Oil can become incorporated into offshore sediments through natural processes or due to shoreline cleanup methods. If this accumulates to a significant extent then alternative cleanup strategies may be required. This monitoring method is
Plate 2 : Sediment Sampling Methods

8
usually used in shallow waters. Grab Samplers or Drop Corers are used. The former is suitable for the wider set of sediments and sea conditions. Sample volume is kept consistent between sites and surveys to allow cross comparison.
Prerequisites
Sampling vessel is selected based on suitable weather, water depth and sea states. Equipped with communication tools, GPS and life preservation equipment with adequate
place for movement. Sampling kits: sampling jars, sealing tape, gloves etc. Sampling equipment (grab or corer): for biological samples, the grab is of at least 10 cm
depth and have a minimum surface area of at least 125 square centimeters. 2.2.3 Beach Fauna Assessment
Monitoring Damage to Invertebrate Beach Fauna Species or communities are observed or collected from both affected (oiled) and unaffected (unoiled) control areas. A number of affected and unaffected areas are monitored. Species to be monitored or sampled are determined on the basis of prior knowledge. Methodology The parameters like number and position of the organism in transact or quadrate, oil cover impact, shell damage, mortality etc. forms part of the study. The photo documentation includes this information. The mortality assessment is considered seasonal and natural die-off and the control (unaffected area) mortality are normally compared if baseline information is available. 2.2.4 Coastal Flora Assessment It is known that the damage to coastal flora can occur as a result of oil spill or activities related to for clean up. Damage due to oil spill and cleanup activities may need to be compared to the effects of oil alone to determine whether cleanup is having a net benefit or adverse effect. However, short-term effects are evaluated against possible longer-term benefits. The persistence of the oil and likelihood of longer-term effect is also need to be evaluated. Methodology Monitoring locations are determined for all affected and unaffected areas for monitoring
purposes. Species to be monitored or sampled are listed and determined.

9
The attributes such as number and distribution of plants, oil cover, mortality and other possible effect are considered.
The monitoring and assessment are carried out with transect or quadrate method through ground survey.
3. Status of Impact on Sediments Few studies have been conducted to determine the fate of dispersed oil in sediments and the factors controlling the interactions of dispersed oil with marine sediments and the potential effects on benthic biota. Existing data from earlier studies pointed to different sorbent properties as keys to sorption in given situations (Pionke and Chester, 1973; Bailey and White , 1970). 3.1 Short Term Impacts on Sediments The study by Mackay et al., 1984 proposed factors influencing effectiveness of dispersion include oil viscosity, dispersant drop size, water temperature, and oil/water partitioning characteristics of the dispersant. The difference of oil retention in top sediment between the pre- and post- spill application scenario increases with increase in fuel oil temperature (J. Hua et. al., 2004). Short term effects on intertidal benthic communities include characteristic loss of sensitive species, the dominance of tolerant species and the early biological recovery of opportunistic species, depending upon environmental stress, oil toxicity and severity of oil coating and substrate contamination. The weathered oil incorporated into the sediment, can have long term impact where it may inhibit growth of seedlings and larger plants. The impact could be felt on both infauna and epifauna. Even when some areas recover, others can continue a cycle of deterioration leading to complete loss of habitat. Spilled oil can take months to penetrate sediments around roots, causing delayed plant toxicity. Seedlings may fail to recolonize or grow in oiled sediments. Long term impacts need very elaborate and time consuming process to assess. Each spill site differed mainly in the magnitude of the stress response. Observations of the spills showed that differences in the physical environment, such as the degree of exposure to waves and currents and geomorphic features like the terrain, greatly influence the distribution and persistence of oil. The coastal geomorphology of Mumbai and the region around is variable with a number of creeks and bays cutting across the landmass. It was observe that affected shoreline mainly consist sandy type of sediment. The movement of sand due to tidal action resulted into mixing of oil at deeper level at impacted areas, which also increase the persistence of spilled oil and also increase the risk of Environmental and biological hazards.

10
4. Remote Sensing Analysis Visual interpretation of remote sensing images for extracting desired information could be achieved in an efficient and effective manner by using several basic interpretation keys (or) elements. The basic interpretation keys are i) Tone ii) texture iii) pattern iv) shape v) size and vi) location or association. All these interpretations are qualitative attributes and they are subjective and further, depend on the experience and personal bias of the interpreter as well. Remote Sensing Centre, NRSC at Hyderabad was approached to obtain the remotely sensed data of the incident and resultant pattern. Monitoring and detecting oil spill as they occur in real-time accelerates response time. Thus substantially reducing cleanup/remediation coast, and limiting damage to the environment. The Oil spill detection sensors play a major role. Active microwave sensor like Synthetic Aperture Radar (SAR) captures two-dimensional Image. SAR has wide area coverage and Day and Night all-weather capabilities. Today RADARSAT-1 and ENVISAT are the two satellites which provide satellite SAR images for oil spill monitoring. The detectability of oil spill in SAR images are dependent upon conditions, sensor characteristics and ambiguities caused by other phenomena than oil spill. Airborne sensor Technology is being also used for the oil spill observation. Microwaves are commonly used for ocean pollution monitoring by remote Sensing due to its all-weather and all-day capabilities, Example of SAR-equipped satellites are given below. Mainly spaceborne instrument are covered here :
Satellite (sensor) Operative Owner Characteristics SEASAT ALMAZ-I ERS-1 ERS-2 RADARSAT-1 ENVISAT (ASAR)
1978-off same year 1991-1992 1991-1996 1995-operating 1995-operating 2002-operating
NASA Russian Space Agency ESA ESA CSA ESA
L-band, HH-pol S-band, HH-pol C-band, VV-pol C-band, VV-pol C-band, HH-pol C-band,HH and VV,alt.pol, and crosspol. modes
Airborne Side-Looking Airborne Radar (SLAR) is another system which can also be used. SLAR is an older but less expensive resolution. Airborne surveillance is limited by high costs and is less efficient for wide area surveillance due to its limited coverage. While space borne SAR can be used for first warning, aircrafts are more suitable to be brought onto action to identify the polluter, the extent, and the type of spill. An example is the German aerial

11
surveillance, which locates oil discharges by SLAR. IR/UV scanning is used to quantify the extent of film, a microwave radiometer (MWR) is used to quantify the thickness and laser-fluoro-sensor (LFS) is used for oil type classification. There are other spaceborne remote sensing devices that have some potential for oil spill monitoring. The Sea-viewing Wide Field-of-view Sensor (SeaWiFS, visible sensor) measures high levels of chlorophyll for areas with algal bloom, while SAR images have low back-scatter level in these regions. A drawback of SeaWiFS sensor is their coarse spatial resolutions of ~1 km. NASA has demonstrated the possibility of oil spill monitoring by Moderat-Resolution Imaging Spectroradiometer (MODIS) instrument with moderate resolution band of 250 m and 500 m and a wide spectral range. This allows MODIS instrument to provide images of daylight-reflected solar radiation and day/night time thermal emissions. On the other hand the multiple wavelengths can give additional information to distinguish slicks produced by algal blooms from oil spills. Hyperspectral Sensor provides the visual analysis of the satellite image to discriminate between various events. Therefore, this can be used for oil spill monitoring, where in it can provide detailed identification of material and better estimation of their abundance. It has more than 200 wavelengths, which help to distinguish between different oil types (crude and light oil). This can also eliminate the false alarm rate of ocean features that have the same color and appearance as oil. Salem and Kafatos (2001) found that a signature matching method based on airborne hyperspectral imaging (looking at chemical composition) is more accurate than the conventional techniques. There is currently no commercial spaceborne hyperspectral sensor in the orbit. The NASA EO-1 Hyperion hyperspectral sensor is a spaceborne technology demonstrator that was launched in 2000. However, its major drawback is its small width of only 7.5 x 100 km. Oil absorbs solar radiation and re-emits a portion of this energy as thermal energy. IR sensor observes thick oil slicks as hot, intermediate thickness of oil is cool, while thin oil is not possible to detect. At night, a thick spill can appear cooler than the water since it releases heat quicker than its surrounding water. Scientist examined the use and capability of the visible and IR sensor of NOAA Advanced Very High Resolution Radiometer (AVHRR) for early detection and monitoring of oil spills. Oil spill could be detected in the visible images only under highly favorable light and sea conditions. UV technology can be used as the spill displays high reflectivity of UV radiation even at thin layers. The UV instrument is not usable at night, and in some conditions can cause false alarms in the UV data. These interferences are often different

12
from those for IR, therefore, a combination of IR and UV can provide more reliable indication of oil and can be used for estimating oil thickness. In future, SAR missions will be crucial for better operational oil spill detection service. There are many commercial SAR mission planned. Japanese Advanced Land-Observing satellite (ALOS) and European Terra SAR-L are satellites with L-band SAR, which means an increased wavelength (24 cm) compared to, e.g. ERS and ENVISAT. TerraSAR-X and COSMO/SkyMed (duel use) are German and Italian X-band satellite. TerraSAR-X will have a best resolution of 1 m, but will also provide a ScanSAR mode with 16 m resolution and 100 km swath width. Concerning oil spill detection, the most promising is RADARSAT-2 with its C-band SAR. It provides improved resolution and flexibility in selection of polarization option. A future spaceborne C-band SAR to replace ENVISAT ASAR would be needed to sustain the quality of oil spill detection programmes. Automatic oil spill detection algorithms are normally divided into three steps, dark spot classification, dark spot feature extraction and dark spot classification. Large-scale classification studies with acceptable classification performance are reported based on statistical classification. An extensive comparison of the classification used by different approaches, based on the same data set feature, would be desirable. There are many types of sensors which are used to provide information for varied use: Optical sensor Microwave sensor Thermal sensor
Optical sensors have cloud limitation, so use of this sensor in cloudy weather has its own limitation with respect to image quality. Use of Microwave sensors can gives advantage over this limitation of Optical sensors as there is not effect of clouds expected output. During the any incidence of oil spill, depletion in oxygen and temperature variation can be monitored with help of Thermal sensors, which could be useful in interpreting effect of oil spill in marine flora and fauna.

13
Figure 1 : Multi-Date View of August’11 Mumbai Oil Spill
A B C

14
The Radarsat images in Figure 1A indicate coverage of oil slick two days after MV RAK carrier sank in offshore water of Mumbai i.e. on 10th of August 2011 and clearly reveal spilled oil were drifting towards the shoreline of Juhu, Dadar, Bandra and Colaba. The movement of oil slick was not clear due to choppy weather condition on 13th august 2011 (Figure 1B). Figure 1C shows broken segment of oil slicks along the offshore areas of Mumbai on 16th August 2011, which was the result of speedy wind and tidal movement along with response measures from various agencies. The tidal movement and wind direction carried the oil further southward areas of Mumbai and Raigad region such as beaches of Alibag. Apparently, it has been reported that amount of oil spill reduced later compared to initial days between 10th -16th August 2011. As can be seen from these figures that oil slick origin was from MV RAK ship location marked in the figure. The oil levels found on the beaches and seafronts on the west coast of Mumbai also corroborated the source during that period. 5. Impact Mapping of Affected Areas This impact mapping shows a clear line of sites impacted due to the oil spill. The map should prove invaluable in documenting the impacts of the spill over time and place. Its contents also provide greater transparency about the disaster. The composite view shows how surface oil has spread over the whole region from the point of accident. The mapping process depends primarily on available information immediately after the incident as also during clean up. Physical survey and sampling combined with photo documentation assist in the mapping process. The impact of oil spill on different regions varied depending upon the locations in close vicinity of oil spill as well as extent of spread. The areas can be classified into major categories such as mangroves, beaches, sediments and rocky outcrops. Assessment of these areas were carried out by visiting and assessing the spread of oil spill in the entire region. Methods of assessment have been described earlier, wherein all the impacted areas were divided into transects and physically visited. The mapping of different levels of impact has been primarily based on observation and information available from various sources in the initial period. It is important to note that mapping has primarily carried out only during first phase within 30 days of the incident, Juhu, Gorai, Aksa and Madh were distinctly imapcted while Marve and Alibaug beaches shows low impact comparatively.

15
The impact of oil spill on different regions varied depending upon the locations in close vicinity of oil spill as well as extent of spread. The areas can be classified into major categories such as mangroves, beaches, sediments and rocky outcrops. Assessment of these areas was carried out by visiting and assessing the spread of oil spill in the entire region. Methods of assessment have been described earlier, wherein all the impacted areas were divided into transects and physically visited. The areas in different regions have been classified into four categories of impact of oil spill such as : Low (L): 0-25% (Blue) Medium (M): 26-50% (Yellow) High (H): 51-75% (Pink) Severe (S): 76-100% (Red) Figure 2 shows overlay multi-date visualization image of oil slick drift against impacted areas mapped on Google earth image along the shoreline of Mumbai and Raigad district. The multi-date visualization of oil spread areas procured from National Remote Sensing Centre (NRSC) Hyderabad helps to understand local dynamics and spatial distribution of spilled oil along the nearest coastline. On 9th August 2011, continuous band (Green) of oil has been seen distributed through 18043’21”N, 72016’04”E to 19004’11”N, 72035’28”E, drifting toward entire shoreline of Mumbai. On the day of 10th August continuous slick (Red) has been seen drifting towards Juhu and other southern coastlines of Mumbai (18042’39”N, 72014’45”E to 19008’57”N, 72034’15”E). On the same day some broken patches (Red) were seen heading towards Gorai, Madh and Aksa beaches (19010’23”N, 72034’32”E to 19017’41”N, 72039’59”E). Two patches of slick (Blue) were drifted from the sunken ship on 11th August 2011. One directed towards southern coastline i.e towards beaches of Alibaug (18044’03”N, 72019’59”E to 18039’54”N, 72029’30”E) and another drifted towards (18055’23”N, 72032’47”E to 19006’53”N, 72042’36”E) coastline of Juhu, Dadar areas. On the day of 13th August 2011, more oil slicks (Sky blue) were drifted towards shoreline into broken patches directed towards Alibaug coastline (18040’26”N, 72015’18”E to 18039’58”N, 72024’05”E) and some comparatively smaller patches (19006’16”N, 72041’49”E to 19005’25”N, 72043’09”E) headed in the direction of Juhu beaches, added more fresh oil as reported by various studying agencies and media sources. Three patches (Maroon) were seen on the 16th August 2011, out of which two were headed towards Juhu (18040’48”N, 72014’18”E to 18045’42”N, 72022’39”E) and other southern part of

16
Mumbai (18051’39”N, 72029’32”E to 18057’28”N, 72032’56”E) and one was showing movement towards Alibuag region (1905’36”N, 72037’38”E to 19008’10”N, 72038’59”E). Oil slick movement indicate that though it was closer to south Mumbai locations such as Colaba, Navy Nagar etc, the impact seen was not significantly higher. The movement witnessed was due to tidal currents combined with wind speed and direction. The Oil slick impact distribution is shown Table 1. Table 1 : Oil Slick Distribution of MV Rak Carrier
Date Colour Distance from Coastline
(Approx. Km)
Probable impact
09th August, 2011 Green 19.70 Shoreline of Mumbai (Juhu, Dadar and southern shoreline including Navy nagar area
10th August, 2011 Red 18.40 Juhu and other southern coastlines of Mumbai and Gorai, Madh and Aksa beaches
11th August, 2011 Blue 16.50 Juhu, Dadar and Alibaug beaches
13th August, 2011 Sky Blue
8.90 Alibaug coastline and Juhu
16th August, 2011 Maroon 14.30 Juhu and other southern coastlines of Mumbai and Alibaug beaches

17
Figure 2 : Satellite Observations Showing Drift of Spilled Oil

18
6. First Phase Assessment 6.1 Juhu Beach The open beaches of Juhu attracts the well-heeled among Mumbai's population. It is situated on the shores of Arabian Sea in Juhu suburb. There are three main entrances to the beach. The sandy beaches of Juhu were severely impacted from the oil spill. Thick patches were seen along the shoreline, with high density of tar balls in various area of beach. Oil soaked debris was also seen accumulated in patches along the stretch of Juhu beache. The stretch of 5.80 km. was severally affected due to spilled oil along the Juhu beach (Figure 3). During initial days of spill floating oil can be seen on sea water, reaching to areas of the beaches with tidal movement (Plate 1 A-F). Marine fauna was also affetced due to spilled oil (Plate 1 G). After a month of incident, during the second assessment, Shiny oil spots along the coastline of Juhu beach are prominently visible along with oil soaked debris (Plate 2 A-C).
Figure 3 : Impacted Areas Around Juhu Beach

19
Second Assessment: Plate 2: A) Push core sampling of sandy sediment B) Oil soaked plastic bag and sandy sediment C) Shiny oil spots along the coastline of Juhu beach
A B C
First Assessment: Plate 1 : A- F) Oil impacted sandy beach of Juhu G) Oil affected Jelly fish

20
6.2 Madh Island Beaches Madh island is a group of several quaint fishing villages and farmlands in northern Mumbai. Madh Island barely escapes being called a peninsula since only a small creek, bounded by mangroves, cuts it off from the mainland near Aksa. Madh Sandy beaches of about 2.60 km (Figure 4) shows patches of oil along the shoreline with tar balls (Plate 3 A-E, I). Mortality of Sepia has been seen in quadrat study carried out at Madh island during initial period of oil spill (Plate 3 F). Crab holes in sandy beach were affected due to deposition of oil (Plate 3 G-H). During initial impact assessment period, manual cleaning operation was being carried out by local Municipal Corporation and other agencies. During second assessment, tar ball aggregates were seen along the beach, while no visible oil was seen near inter tidal zone and on bed rock of the Madh island. (Plate 4 A-C).
Figure 4: Impacted Areas around Madh Island

21
Second Assessment Plate 4: A) Tar balls aggregates on sandy beach of Madh B-C) No visible sign of oil in intertidal zone and on bedrock
A B C
First Assessment Plate 3: A-D) Oil patches on sandy beaches of Madh E) 1 X 1 m Transect: Showing mortality of Sepia F-G) Oil impacted crab holes H) Shoreline of Madh showing tar balls I) Manual Cleaning operation

22
6.3 Aksa Beach Aksa beach is a popular beach and a vacation spot in Aksa village at Malad, Mumbai. This beach is one of the most silent and least visited beaches. Shoreline of Aksa beach showed distinct sign of oil spilled from MV Rak Carrier. About 2.0 Km stretch of sandy beach of Aksa showed high level impact during assessment (Figure 5).
Oil sheen on accumulated water along with high density of tar balls were seen along the entire shoreline (Plate 5 A-G). There was no visible impact on edible Oyster grown along the boulders at beach (Plate 5 H). During initial impact assessment, manual cleaning operation (Plate 5 I) was seen to be carried out by local Municipal Corporation and other agencies. Tar ball aggregates and large oil clumps were visible along the coast of Aksa, during post month assessment (Plate 6 A-C).
Figure 5 : Impacted Areas around Aksa Beach

23
Second Assessment Aksa Plate 6: A-C) Tar balls along the entire shoreline of Aksa
First Assessment Aksa Plate 5: A) Oil impacted water pouch B-G) Tar ball along the entire shoreline of Aksa in high density H) No visual sigh of oil on bedrock habituated by oyster I) Manual cleaning of Aksa beach
A B C

24
6.4 Gorai Beach Gorai Beach is situated in Gorai Creek it is basically a beach with beautiful sunrise and sunset scenario. Gorai beach and the palm groves make it picnic and tourist spot for people around Mumbai. The entire stretch of 1.90 km has high level impact with Tar ball clumps and melted tar balls (Figure 6).
During assessment of impacted Gorai beach Tar balls were clearly visible along the sandy
coastline of Gorai. The barrier wall of the rocks shows high density of melted tar balls as well as
clumps in between the rocks (Plate 7 A-G). The clumps of oil are likely to get exposed during
the high day temperature resulting into melting and spreading oil along the sandy region
(Plate 7 H). During second assessment of the sandy beach near barrier wall, some patches of
melted oil mixed with the sand were seen.
Figure 6 : Impacted Areas around Gorai Beach

25
6.5 Marve Beach The beach is located in the Western Suburb of Malad and connects the Essel World (Amusement Park) and Madh Island to the city through the Ferry Service. Movement on this beach is restricted due to very narrow width and presence of Indian Naval base INS Hamla.
Figure 7 : Impacted Areas around Marve Beach
First Assessment Plate 7 : A-G) Melted Tar balls on the barrier wall at Gorai beach H) Affected sandy area near barrier wall
26
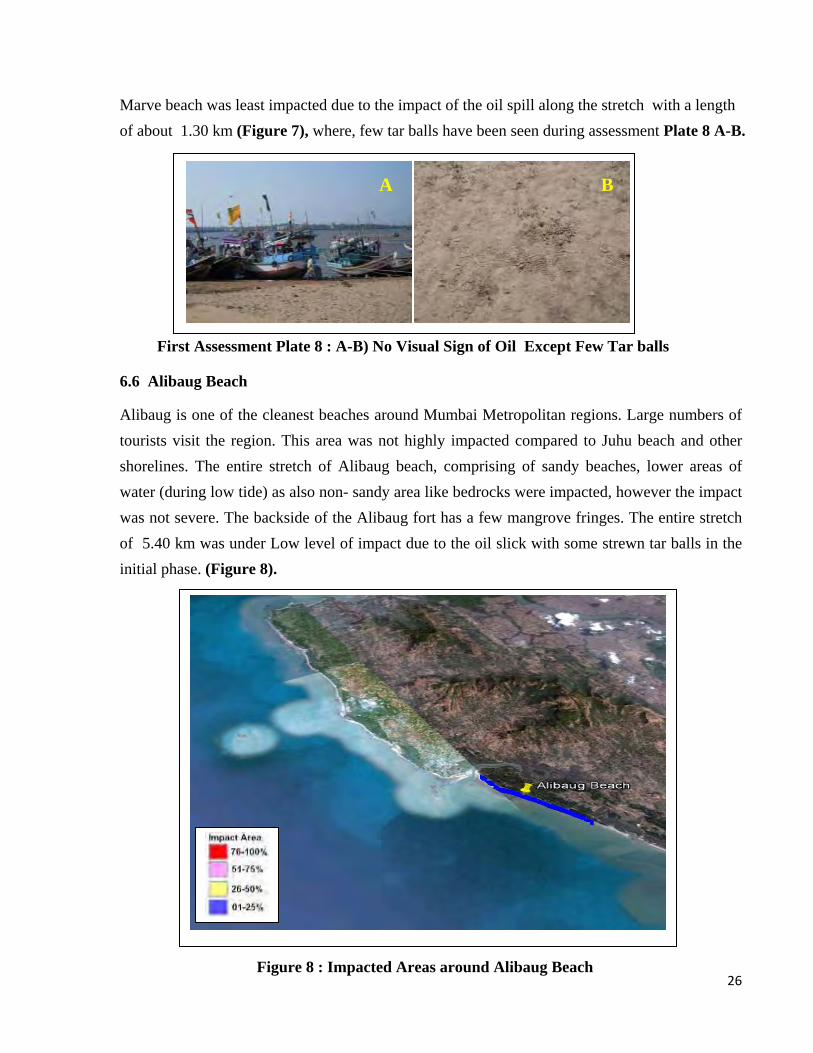
Marve beach was least impacted due to the impact of the oil spill along the stretch with a length of about 1.30 km (Figure 7), where, few tar balls have been seen during assessment Plate 8 A-B.
6.6 Alibaug Beach Alibaug is one of the cleanest beaches around Mumbai Metropolitan regions. Large numbers of tourists visit the region. This area was not highly impacted compared to Juhu beach and other shorelines. The entire stretch of Alibaug beach, comprising of sandy beaches, lower areas of water (during low tide) as also non- sandy area like bedrocks were impacted, however the impact was not severe. The backside of the Alibaug fort has a few mangrove fringes. The entire stretch of 5.40 km was under Low level of impact due to the oil slick with some strewn tar balls in the initial phase. (Figure 8).
Figure 8 : Impacted Areas around Alibaug Beach
First Assessment Plate 8 : A-B) No Visual Sign of Oil Except Few Tar balls
A B

27
Sandy sediment of Alibaug beach shows very low density of Tar balls during the assessment of shoreline and the area behind Alibaug fort (Plate 9 A-B) . The high density of crab was seen along the stretches of shoreline (Plate 9 C) with no sign of oil on the barrier wall along the coastline (Plate 9 D).
7. Second Phase Assessment The second phase assessement was carried out within next 30 days of the first assessment. The second assessment period generally had much lower impact seen. The impact was mainlyi in tems of some tar balls and thin oil sheen such as along Juhu beach sediment and patched of the melted tar balls along the boulder barrier at Gorai beach area. During first assessment the oil were forund in the form of Tar balls, Oil pools, thin layer, oil patches and melted tar balls. The assessment showed that 80 % of the impacted area are beaches with sandy sediment and rest 20 percent are rocky and boulder type. The continuous movement of the sandy sediment due to tidal and wind action oil may reach in the deep below in the sediment however on normal open sandy beaches, the shoreline gets repeatedly washed off.
First Assessment Plate 9 : A-B) Sandy sediment showing some tar balls along the coast C) High Crab hole density along the shoreline D) No visible sign of oil along the barrier wall

28
The weathered oil incorporated into the sediment, can have long term impact where it may inhibit growth of seedlings and larger plants. The impact could be felt on both infauna and epifauna. Even when some areas recover, others can continue a cycle of deterioration leading to complete loss of habitat. Spilled oil can take months to penetrate sediments around roots, causing delayed plant toxicity. Seedlings may fail to recolonize or grow in oiled sediments. These kind of impacts are likely to be more prevalent in mangrove areas. Long term impacts need very elaborate and time consuming process to assess. Though impacted sites mainly comprises beaches and not mangrove areas, if the large fraction of oil was carried by the tidal movement to these areas, it can have tree mortality; leaf defoliation, deformation, and stunting; seedling deformation and mortality; lenticel expansion; adventitious growth of pneumatophores; and changes in the density and distribution of plants and animals. Each spill site differed mainly in the magnitude of the stress response. Observations of the spills showed that differences in the physical environment, such as the degree of exposure to waves and currents and geomorphic features like the terrain, greatly influence the distribution and persistence of oil within different mangrove types. 8. Summary of Mapping The exercise of mapping was to assess the first level of information about the length of the affected region, typology and the extent of oil spill impacts. The spilt oil had affected differently in many regions with respect to weather, topography and other things. For example, the rocky barrier wall at Gorai beach was coated with melted tar balls which would take much more time to clean due to less frequency to expose to tidal action. Locals and volunteers had made an attempt to soak free oil using jute bags and clothes especially at Juhu beach. On the other hand, the beaches were naturally cleaned with progressive tidal action. The summary of the impacted areas is given in Table 2 and Figure 9.

29
Table 2 : Total Length of Impacted Coastline
Site Geographical Position Impacted Area
(In Km)
Sediment Type
Oil Spill form Impact
Juhu Beach
19007’37”N, 72048’55”E 19004’54”N, 72049’23”E
5.80 Sandy Oil Pool, Tar balls, Oil Patches
Severe
Aksa Beach
19011’22”N, 72047’44”E 19010’20”N, 72047’37”E
2.00 Sandy & Rocky
Tar Balls High
Madh Beach
19009’23”N, 72047’02”E 19008’07”N, 72047’11”E 2.60 Sandy &
Rocky Tar balls, Melted
Tar balls High
Marve Beach
19011’56”N, 72047’55”E 19011’22”N, 72047’44”E 1.30 Sandy Small Tar balls
(Very few nos.) Low
Gorai Beach
19015’05”N, 72046’57”E 19014’06”N, 72046’46”E 1.90 Sandy,
Boulders Tar balls, Melted
Tar balls High
Alibaug Beach
18038’01”N, 72052’59”E 18035’24”N, 72054’12”E 5.40 Sandy Small Tar balls
(Very few nos.) Low
Low‐0‐25%; Medium‐ 26‐50%; High‐51‐75%, Severe‐ 76‐100%
The first and second phase assessment of the impacted areas reveal that the 80 percent of the shoreline affected by the oil spill was sandy in nature as affected areas mainly consist of beaches which are popular tourist destination (Figure 9). The rest of the impacted areas are of rocky and boulder in nature and shares 10 percent each. The visible impact on these areas persists for long period of time in the form of dry patches, melted tar balls.
Figure 9: Distribution of Affected Sediment
Figure 10: Distribution of Impact Severity

30
8.1 Water and Sediment Quality Water and Sediment quality assessment was conducted for impacted areas with respect to PHc concentration. During spillage of the oil (Fuel oil) in seawater, its soluble elements dissolve in water and low soluble or insoluble elements disperse while the major quantity remains on surface until it reached to the shoreline. The oil remains mainly constituted of non-hydrocarbon and low molecular weight/low boiling aromatic hydrocarbons. Oil on the water surface eventually get adsorbed or absorbed by the particulate matter and get settled to the bottom. After loss of low boiling element residual oil become heavier and settle down and movement by tidal current redistributes the withered oil to the low line areas. Such residues can be seen in the form of tar lumps and tar balls. In areas of limited water exchange, it keeps persistent for long period.
Table 3: Water Quality Analysis for PHc (In µg/l) Site First Phase Second Phase Juhu Beach 32.7- 5483.8 20.4 - 44.9 Aksa Beach 23.6 - 988.4 12.5 - 28.3 Madh Beach 12.4 - 45.6 5.7 - 12.9 Marve Beach 2.4 - 9.6 - Gorai Beach 18.5 - 180.8 9.4 - 12.5 Alibaug Beach 2.5 - 9.8 2.3 - 8.7
The PHc levels in the assessment are in the range of 2.4 to 5483.8 µg/l in the first phase and in the second phase in the range of 2.3 to 44.9 µg/l. With highest level has been found at Juhu beach and lowest at Marve beach area (Table 3).
Table 4: Sediment Analysis for PHc (In µg/g wet wt.) Site First Phase Second Phase Juhu Beach 6.7-21.8 2.4-8.9 Aksa Beach 2.6-13.4 0.5-3.3 Madh Beach 0.4-3.6 BDL-1.9 Marve Beach 0.4-1.6 BDL-0.3 Gorai Beach 2.5-9.8 1.3-2.5 Alibaug Beach 0.5-1.8 -
The PHc levels in sediment were in the range of 0.5 to 21.8 µg/g wet wt in the first phase and in the second phase in the range of 0.3 to 8.9 µg/g wet wt. With highest levels were found at Juhu beach and lowest at Marve beach area (Table 4).

31
The severity of oil spill in the impacted areas varies greatly with respect to distance, wind direction and movement, sediment type, shoreline energy etc. The shoreline of 19 km is affected, 30 percent area is affected severely as 35 percent each in the high and low category (Figure 11).
Figure 11: Oil Spill Impacted Areas
32
The biological Open waters of the oceans and the associated pelagic and seabed communities have rarely shown any impact from spills. The high dilution potential that this habitat provides is a major mitigating factor. Even though laboratory research has shown that planktonic organisms which live in surface waters can be variously affected by oil, no long-term effects have been demonstrated due to their huge regenerative potential, as well as immigration from outside the affected area. This regenerative potential is fundamental to the important role the plankton plays in the food chain of world's seas and oceans. 9.0 Damage Cost Evaluation The costs of a particular oil spill are related to a large number of factors notably: spill amount, oil type characteristics, response methodology and effectiveness, impacted medium or substrate type, location-specific socioeconomic and cultural value, location- specific freshwater vulnerability, location- specific habitat and wildlife sensitivity, year of spill (both in terms of inflation adjustments and probable response effectiveness for past and future cost projections), and the region or urban area impacted. 9.1 Review of Cost Estimation Methodologies Many assessment and studies were reviewed to understand response cost estimation methodologies as applied to hypothetical and real spill scenarios across the globe before customizing, adopting and selecting a methodology for the Indian coastal scenario. The methodologies compared were on the basis of (1) a model derived from historical data on various spill factors that drive overall cleanup costs; (2) a method using U.S. Area Contingency Plan (ACP) spill scenario plans to estimate costs for mechanical containment and recovery costs to be extrapolated to other hypothetical spill scenarios; and (3) a method that estimates the labor and equipment required for mechanical containment and recovery operations and the resulting costs. In the cleanup cost factor model, based on historical spill data, the relationships between a number of factors to determine a more precise per-unit cleanup cost for a particular oil spill scenario has been examined. The algorithm and modifiers were derived from analyses of over 200 oil spill case studies, which revealed that:

33
a) Per-unit costs were higher for spills involving more persistent oils. b) Per-unit costs were highest for responses relying on mechanical and manual methods. c) Per-unit costs were higher for smaller spills. d) Per-unit costs were higher for near shore and port spills than for offshore spills. e) Per-unit costs were higher for spills involving extensive shoreline oiling. f) Per-unit costs varied by region and were highest for Asia, followed by the United States.
Relative degree shoreline oiling is one of the modifying factors. In case of Mumbai, except ‘a’, rest of the factors are applicable to a larger extent. Based on the various factors related to oil spill impact and cleanup, it can be reasonable to assume that cleanup cost in India would be higher than many developed countries. In the present case as well, for effective cleanup, the experts and machineries were largely sought from outside India for whatever little cleanup was attempted. While there are limitations in the approach of the Area Contingency Plan spill scenario, mechanical response operation cost extrapolations include the fact that they are very specific in terms of location and oil type. It also involves relatively small spill sizes, making it difficult to relate them to hypothetical situations. In addition, ACPs rarely stipulate the estimated time to complete mechanical operations. 9.2 Modified Approach A modified approach involves the study of cost estimations based on labor/equipment requirements based on some site specific changes. Since the ACP extrapolation model is based solely on spill amount regardless of oil type and site-specific factors, it does not factor in the evaporation and dispersion rates of a No. 2 fuel (type of oil) as opposed to a crude oil so that there will be different equipment requirements, nor does it factor in that labor and equipment costs differ at different places. The second methodology, which estimates labor and equipment requirements, takes these factors into account and adds in additional costs for authorities, and spill management costs, which is likely to be more precise. The estimates based on the historical model are considerably higher than those of the other methods, particularly for the larger spill sizes. This is due to the fact that the estimation includes the entire response operation, including shoreline cleaning. These shoreline cost estimation methods could be linked to mechanical and dispersant operation costs for a more complete picture of oil spill cleanup costs.

34
The scenario pertaining to the Mumbai Oil Spill, the Oil Spill Response Cost-Effectiveness Analytical Tool (OSRCEAT) was found more suitable with some minor modifications. It offers a method for quickly estimating costs for various types of spills based on a number of factors. The comparison to estimates based on hypothetical mechanical recovery-based response plans shows reasonable reliability of the historical database model. Further development and refinement of both the historical cost model and the mechanical recovery model, as well for dispersant operation and shoreline cleanup cost models, will provide even better tools for estimating and predicting oil spill cleanup costs, in future. Some of the factors applicable for India have been suitably adopted. 9.2.1 Other Cases During the LOUISIANA OIL SPILL, the Oil Pollution Act of 1990 and the Louisiana Oil Spill Prevention and Response Act provided for federal and state natural resource damages and loss of ecological services from the responsible party (RP) through the use of the Natural Resource Damage Assessment (NRDA). They addressed the wide-ranging problems associated with prevention, response, and compensation for oil pollution from vessels and facilities in nation’s navigable waters, adjoining shorelines, and exclusive economic zone. It substantially broadened the scope of damages, including natural resource damages, for which polluters are liable. It also provided for the use of a $1 billion Oil Spill Liability Trust Fund (OSLTF or the Fund) to pay for expeditious oil removal and uncompensated damages. While the Swedish Environmental Research Inst., Stockholm used the REMEDE Project. It was a useful framework for assessing non-market damages from oil spills. The Toolkit provided a useful framework for assessing non-market costs associated with oil spill damages by defining the types of ecological losses suffered by the public and providing interdisciplinary methods for scaling resource-based compensation projects whose cost should be incurred by the responsible polluter(s). Gulf of Mexico spill case valuing natural resources was a key factor in connection with governmental activities in the Gulf. Analyses included evaluation of water replacement models, hedonic regression analysis, and lost state tax revenue claims. Hence during this case, a range of methods were used including Habitat Equivalency Analysis (HEA), Resource Equivalency Analysis (REA), lost biomass from mortality and production foregone, and service-to-service and value-to-cost for lost use services, depending on the injured resources and services. Once the

35
appropriate damage assessment method was selected, injury quantification and restoration scaling can be undertaken. The resulting damage estimate may be expressed as a range with associated estimates of probability and was given in terms of ‘discounted service acre years’ (DSAYs) or other non-monetary units. The USEPA Basic Oil Spill Cost Estimation Model (BOSCEM) was developed to provide the US Environmental Protection Agency (EPA) Oil Program with a methodology for estimating oil spill costs, including response costs and environmental and socioeconomic damages, for actual or hypothetical spills. The model can quantify relative damage and cost for different spill types for regulatory impact evaluation, contingency planning, and assessing the value of spill prevention and reduction measures. EPA BOSCEM incorporates spill-specific factors that influence costs – spill amount; oil type; response methodology and effectiveness; impacted medium; location-specific socioeconomic value, freshwater vulnerability, habitat/wildlife sensitivity and location types. Including these spill-specific factors to develop cost estimates provides greater accuracy in estimating oil spill costs than universal per-gallon figures used elsewhere. Use of a universal dollar-per-gallon (or dollar-per-barrel) cost for oil spill response, socioeconomic and environmental damage has been also applied in many cases. 9.3 Approach and Methodology of Mumbai Case With reference to the Mumbai Oil Spill 2011 specific issues and topics were needed to be addressed while handling the Indian scenario. In collision and grounding accidents, the possibility of oil outflow is significant. In addition, the accident being in harbor area led to significant impact within the inner region where mangroves, tourist and beach regions are common and were affected quickly. It did not allow anytime for possible preventive steps or control system mobilization. Depending on the ship type, the spilled oil may be bunker or cargo oil. In addition the spilled oil may be crude oil or heavy or light distillates. The size of the oil spill depends on the ship size and structure and damage mechanics. The scatter in the reported damage costs obtained from ship accidents having oil spill is huge. Especially the evaluation of the costs of the environmental damages comprehends the fact that the following technical factors have had an essential influence on the cost of oil spill:

36
− Type of oil,
− Physical, biological and economical characteristics of the Mumbai coast line
− Weather and sea conditions,
− Amount spilled and rate of spillage, and
− Time of the year, and effectiveness of clean-up. OSRCEAT allows the assessor to consider the following questions: • How much oil remains after on-water oil removal?
• How much oil will hit the shoreline?
• What are natural and socioeconomic resources impacted and to what degree, taking into account on water oil removal?
• How is the shoreline oil distributed?
• What types and amounts of shoreline are impacted?
• What shoreline natural and clean up resources are impacted and to what degree?
• What impact does the shoreline response have on shoreline natural resources?
• To what extent does the shoreline clean up mitigate damages of the oil?
• What is the total cost of cleanup (on-water and shoreline)?
• What is the total cost of damages to natural resources (on-water and shoreline)?
• What is the total cost of damages to socioeconomic resources (on-water and shoreline)?
• What is the cost-benefit ratio of the response? This method allows the assessor to better customize the calculation for a particular spill situation. 9.4 Damage Cost Evaluation Many of these methodologies need to be integrated for Indian situation and a method needs to be developed. The direct costs could be fairly easier to compute however indirect and intangible costs need to be estimated based on local conditions and norms. Though these methods can be used, their applications need comprehensive base information to be available. There is a need to undertake development of such a methodologies which are India specific. In a very conservative approach, the cost of the damage can be considered equivalent to the clean-up costs, if it was undertaken. Other costs such as fisheries loss can be computed only if the data of fishing during that period and for the area of impact is available. In the present case, the information on absence of fishing in the affected areas and before the oil spill was not
37
available. The damage due to oil spill on fish spawning areas also need to be correlated with areas assessment before the oil spill. 9.5. Summary As discussed earlier, the costs of oil spill, damage assessment and recovery are common in many countries. However, in India, this process has not been initiated. Though one can use international rates and norms, it would be desirable to develop and use method based on local conditions, cost of cleanup etc. Currently for advance response, the costs in India are likely to be higher than Singapore, USA etc as India has to source expertise as well as equipment. The assessment results are always conservative in nature as in many places; the noticed impacts are limited due to the assessment time lag after the oil spill. There are many other areas of costs which are part of intangibles and need to be computed using multiple methods.
Biodiversity damages in sediment Effect on birds and other flora and fauna in the initial period of oil spill Suffering and other morbidity Impact on fish breeding areas Others intangibles
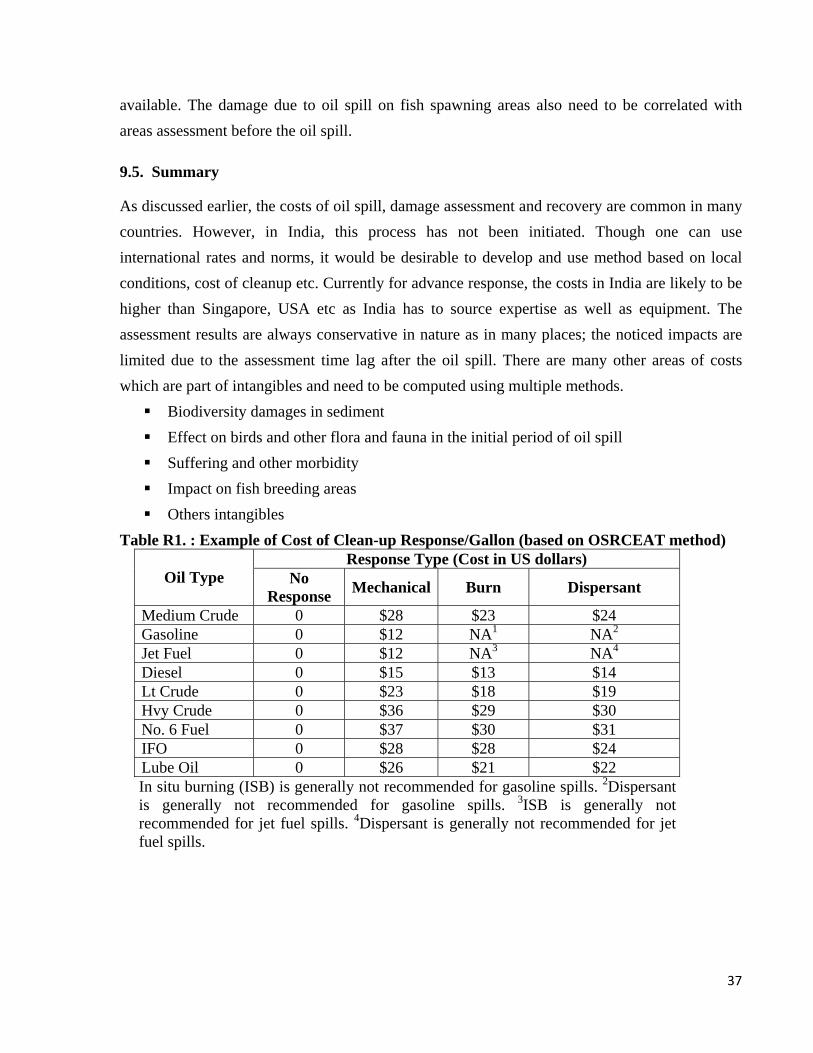
Table R1. : Example of Cost of Clean-up Response/Gallon (based on OSRCEAT method) Response Type (Cost in US dollars)
Oil Type No Response Mechanical Burn Dispersant
Medium Crude 0 $28 $23 $24 Gasoline 0 $12 NA1 NA2
Jet Fuel 0 $12 NA3 NA4
Diesel 0 $15 $13 $14 Lt Crude 0 $23 $18 $19 Hvy Crude 0 $36 $29 $30 No. 6 Fuel 0 $37 $30 $31 IFO 0 $28 $28 $24 Lube Oil 0 $26 $21 $22 In situ burning (ISB) is generally not recommended for gasoline spills. 2Dispersant is generally not recommended for gasoline spills. 3ISB is generally not recommended for jet fuel spills. 4Dispersant is generally not recommended for jet fuel spills.

38
10. Recommendations The recommendations are based on examination of various immediate functionality of avoidance of such an event, first level of response in case of unavoidable accidents, leakages and other events. However, an overall improvement in the infrastructure, manpower and response capabilities need to be brought about through a nationwide effort. The problem, pertaining to oil spill response can be categorized into following five broad areas:
Forecasting It has been seen in the present case as also in many other events within India and that in the absence of clear information about the movement of the oil spill, the response could be highly inadequate and delayed. Normally when any oil spill takes place due to accidents, the movement of oil can take few hours and in many cases few days to reach shore. The crucial gap in time can provide an ample time window which can be used to coordinate required agencies, manpower and movement of infrastructure for oil spill (or any spill) control and later planning of remedial measures. Forecasting capability is non-existent at present. Following recommendations are made to improve this capability: The real time forecasting system should be created at any of the government institution,
preferably in Mumbai with yearly update on bathymetry, wind speed and direction, on coast features
The system should be able to forecast at least 75 kms off the coast of Maharashtra along the entire length.
The system should have strong linkages with NRSA (National Remote Sensing Agency), which can be utilized for validating forecasting model. The output and analysis should be shared with all concerned agencies such as Coast Guards, Port Authorities, DG shipping, MPCB, DoE, GoM and Corporations located on the coast. In the second tier of sharing, it can be shared with DoD, MoEF and any other agency, the state feels necessary.
First Response
The most prominent and crucial period of response are based on “READY TO USE” arrangement. The first response period could be for multiple objectives such as:
• To prevent spread of the impact
• To know where the impact is going to be

39
• To built immediate response team
• To operationalize team, infrastructure and coordination It is recommended to undertake following actions for “IMMEDIATE RESPONSE”: − The coordinator with its core members, formed as per recommendation must communicate
with each other within an hour of any event
− The team should get the base information and consult the forecasting team / institution to know the co-ordinates and possible event to the location, movement and spread.
− Even if this process gets delayed for any reasons, the team should have enough response capabilities to do rough prediction about the movement based on wind and water speed along with directions.
− Operational team should be deployed to assess and make an effort to contain the spill at the site or in immediate vicinity.
− The level of response and its extent should always be rated one level higher than expected so that in case unwarranted situation arises, the response level can be upgraded.
− Resources in terms of manpower, infrastructures (tools equipment, chemicals etc.) and response navigation systems (boats, helicopter etc.) should be designed for a spill of about 5000 tonnes.
− Adequate funds provision should be made to procure tools, appliances, and equipments consumables etc for meeting any eventuality.
− A regular audit of the preparedness and operational readiness should be carried out by an accredited agency or agency nominated by the “state”
− An emergency fund of about Rs. 50 crores should be created which can be used for “IMMEDIATE RESPONSE”
Structure of Response
The responses in the case of any adverse eventuality of oil spill or any other material need to be adequate. The structure of such responses should be such that it gives the confidence of “FAIL SAFE” system. The recommendation of a structure given below states the need of working of the structure not only when accidents occur but also when such occurrences are not taking place.
40
− The structure of response team will have members as per the need and formed through consultative mechanism. Secretary, DoE can be the convener of the team to form the team, delineate roles and responsibilities and notify the same as overall system.
− Each individual agency can then draw their plans based on roles assigned and responsibilities delineation. These details will again be shared with the convener so that a comprehensive system is in place.
− During the period, when oil spill or any other accidents are not reported, the team preparedness can be maintained through following system:
• The alternate team members should be brought in for training with regards to response process as also roles and responsibilities.
• In each agency, at least 5 active members should be getting though the process of understanding the roles and responsibilities. The aim should be to have at least 10 persons in each organization.
• Those who have at least 5 years to superannuate should be brought in to avoid sudden decline in informed individuals/ officials. After every 5 years, the person can be replaced by a new person to avoid any inadequacy to creep in due to non-action in absence of any untoward incident.
• The team can be free to advise other states or nation in the event of any accidents elsewhere so that preparedness levels are always kept high.
• The team can keep working towards tracking of ships which have been found to discharge effluents, oil and washings etc. which are harming coastal areas on a regular basis.
• People deployed in such team should be allowed to undergo national and international training and on the job experience, once in two years.
• The team members should also be given special allowances during the period of this assignment with the team.
Remedial Measures
Remedial measures are primarily aimed at reducing the impacts with a view to minimize short and long term deleterious impact on ecosystem. Remedial measures could be categorized into three major categories: a) No action: Natural attenuation b) Physical or Mechanical measures c) Other measures such as chemical and biological cleanup methods

41
Remedial measures are based on multiple criteria such as “ease of implementation”, “speed of remediation”, “minimization of any secondary impacts due to implementation of remedial measures”, “success rates based on previous experience elsewhere and finally cost of implementation”. Identify all areas which require “NO ACTION” in each of the cases. The option of “NO ACTION” should be exercised in the cases, where natural attenuation will be more suitable like deep sea regions; inner parts of mangroves, beaches in inter tidal zones.
• Use physical methods such as cleaning rocks and other surfaces by using hot water guns and soaking need to recover the dislodged oil carefully which may go back in the marine environment.
• The preparedness of physical methods should be kept 24 X 7 at multiple places so that it can be operationlized quickly.
• Biological processes should be used only in those areas where contained regions are available and chemical methods should be avoided in all regions where sediment, aquatic organisms are likely to be impacted.
• Any new remedial measures should be evaluated for its effectiveness, applicability and economics by an institution with adequate capabilities.
Assessment: Ecological Social and Economics
The damage assessment is a very complex exercise especially when one has to consider direct and indirect costs. The process of assessment can again be divided into three major categories: • Ecological: This includes the physical damaged area, volume, members etc. However, the
indirect damages will include loss of biodiversity, poor productivity, impact on normal and rare flora and fauna.
• Social: Under this category the assessment would include direct damage cost to stakeholders engaged in shipping activities such as ports, ships, fishermen, traders and fish sellers in addition with the indirect assessment categories are all stakeholders associated with tourism industries along with social assessment.
• Economics: All the damages, mentioned partially above, cannot be equated into “rupee term” due to the fact there are many indirect damages are ‘intangibles’. However, there are some methods which can possibly evaluate many intangibles. There is a need to develop a uniform methodology applicable in India keeping in view the rules regulations, preparedness,

42
sensitivity, socioeconomic profile etc. This will help authorities to quickly estimate damages and communicate for remedial measures as also for claim of damages.
• Contingency Fund: The two such cases of fairly small and medium as also manageable oil spill near the coasts of Mumbai indicates that response was not adequate. Specifically, the inadequacies were in terms of response time for oil spill spread control, forecasting, safeguarding the likely to be impacted areas and finally clean up. There is, therefore, need to set up a separate fund for emergency response, forecasting, damage assessment, clean up etc.
Acknowledgement: NEERI would like to thankfully acknowledge the support of MPCB in terms finances as also useful technical and legal discussion. Assistance of NRSA in terms of their data and interpretation is also gratefully acknowledged. NEERI would also like to thank many individuals and organizations who have been of help in many different ways. References • Bailey, R.C., White, D.W., 1970. Methods of analysis for petroleum hydrocarbons In: Malins, D.C.
(Ed.), Effects of Petroleum on Arctic and Sub-Arctic Marine Environments and Organism, 1, pp. 31–62.
• Connell, D.W., 1995. Occurrence and effects of petroleum hydrocarbons on Australians marine environment. In: Sutton, L.P.Z.a.D.C. (Ed.), The State of the Marine Environment Report for Australia: Technical Annex 2. Pollution. Department of the Environment, Sport and Territories (Ocean Rescue 2000), Canberra. pp. 47–52.
• Hua J., Ocean Engineering 31 (2004) Fate of dispersed marine fuel oil in sediment under pre-spill application strategy 943–956.
• IPCC, 2001. Climate Change 2001: Impact, Adaptation and Vulnerability. Cambridge University Press, London.
• International Oil Spill Conf.: pp. 1,243 – 1,253, 2003f. • Klekowski, E.J. and J .E . Corredor. 1995. Is genetic degradation of mangroves a consequence of
petroleum? pp . 99-105 . In: C.E. Proffitt and P.F . Roscigno (eds .) . Proceedings – Gulf of Mexico and Caribbean Oil Spills in Coastal Ecosystems : Assessing Effects, Natural Recovery, and Progress in Remediation Research . OCS Study/MMS 95-0063. U.S . Dept. of the Interior, Minerals Management Service, Gulf of Mexico OCS Region, New Orleans, LA.
• Mackay, D.A., Chau, K.H., Bobra, M., 1984. Measurement and prediction of the effectiveness of oil spill chemical dispersant. In: Allen, T.E. (Ed.), Oil Spill Chemical Dispersants: Research, Experience and Recommendations. ASTM, Philadelphia, pp. 38–54.
• Pionke, G.B., Chester, D.J., 1973. The distribution of intertidal organisms along the coasts of the English Channel. Journal of the Marine Biological Association of the United Kingdom 37 (1), 157–208.
• Etkin and Welch (2005) Oil Spill Response Cost-Effectiveness Analytical Tool (OSRCEAT). • Etkin, D.S. “Comparative Methodologies For Estimating On-Water Response Costs. • Etkin, D.S. “Development of the Oil Spill Response Cost-Effectiveness Analytical Tool”
Environmental Research Consulting Cortlandt Manor, New York, USA.