1h19 for personal use only results presentation2019/04/11 · > owner occupied p&i loans...
TRANSCRIPT

1H19RESULTSPRESENTATION11 APRIL 2019
Half year ended 28 February 2019
For
per
sona
l use
onl
y

2
Anthony Rose Interim CEO
Matt Baxby Chief Financial Officer
Anthony Rose Interim CEO
For
per
sona
l use
onl
y

3
Niche growth, asset quality and capital remain strong
Industry developments & Retail Bank performance impacting returns
Initiatives underway for long term value creation
For
per
sona
l use
onl
y

4
Impact of disposal of vendor finance entity Impact of disposal of vendor finance entity
Impact of disposal of vendor finance entity Special dividend
For
per
sona
l use
onl
y

5
Impact of disposal of vendor finance entity Collective Provision increase
For
per
sona
l use
onl
y

6
> Total loan growth of $756m or 8% annualised> Growth in BOQ Specialist & BOQ Finance
demonstrates niche strategy is working> Focus on quality and return for risk
For
per
sona
l use
onl
y

7
> Successful diversification of distribution channels> Virgin Money continues to achieve strong levels of
customer acquisition> Core Retail business continues to underperform due
to three key constraints
BOQ Branch Housing Loans
BOQ Broker Housing Loans
Virgin Money Housing Loans
> Lending processes made complex by application of responsible lending
> Digital customer platforms lagging peers> Regulatory uncertainty impacted Owner Manager
renewal
(1) Excludes Digital & Direct
For
per
sona
l use
onl
y
8
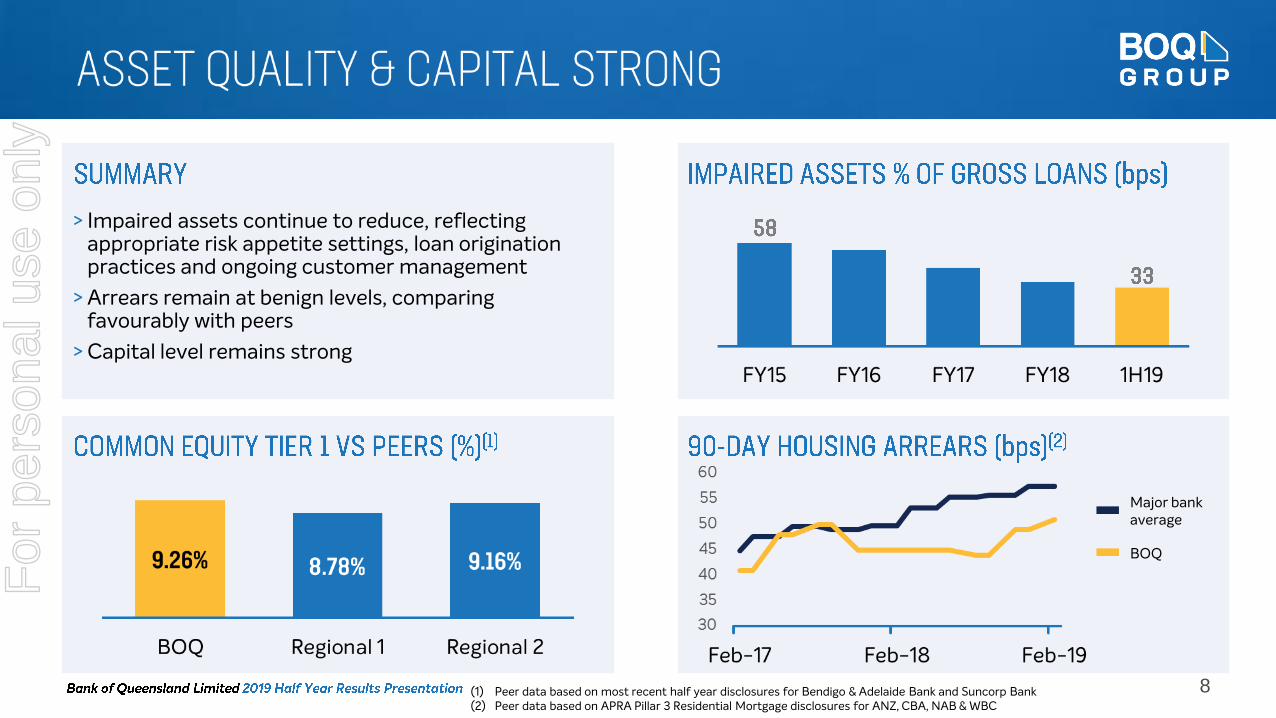
> Impaired assets continue to reduce, reflecting appropriate risk appetite settings, loan origination practices and ongoing customer management
> Arrears remain at benign levels, comparing favourably with peers
> Capital level remains strong
(1) Peer data based on most recent half year disclosures for Bendigo & Adelaide Bank and Suncorp Bank(2) Peer data based on APRA Pillar 3 Residential Mortgage disclosures for ANZ, CBA, NAB & WBC
Major bank average
BOQ
For
per
sona
l use
onl
y

9
> Returns declining across the sector > Credit growth slowing, price competition
intensifying, economic outlook more uncertain> Royal Commission completed with industry impact
to be long lasting> Regulatory expectations and costs rising
(1) Source: APRA Quarterly ADI Performance Statistics.
> Clear focus on improving customer outcomes> Incentive arrangements need to better align with
customer interests> Work for the industry to do to restore trust
> APRA self-assessments show ADIs have more work to do to manage non-financial risks
> BEAR driving shift to a positive attestation control framework
> All regulators more activeFor
per
sona
l use
onl
y

FINANCIALDETAILCHIEF FINANCIAL OFFICER
For
per
sona
l use
onl
y

11
1H19 1H19 v 1H18 1H19 v 2H18Net interest income $476m - (3%)Non-interest income $65m (13%) (7%)Total income $541m (2%) (3%)Operating expenses ($268m) 2% 1%Underlying profit $273m (5%) (7%)Loan impairment expense ($30m) 36% 58%Cash profit before tax $243m (9%) (12%)Income tax expense ($76m) (10%) (12%)Cash earnings after tax $167m (8%) (12%)Statutory net profit after tax(1) $156m (10%) (4%)
Cash basic earnings per share 41.8c (10%) (13%)Return on average tangible equity 11.4% (150bps) (160bps)
(1) Refer to page 19 for a reconciliation of cash earnings to statutory profit
For
per
sona
l use
onl
y

12
1H19 1H19 v 1H18 1H19 1H19 v 1H18Net interest income $215m (5%) $261m 4%Non-interest income $32m (3%) $26m (13%)Total income $247m (5%) $287m 2%Operating expenses ($141m) - ($118m) 5%Underlying profit $106m (11%) $169m -Loan impairment expense ($10m) - ($20m) 67%Cash profit before tax $96m (12%) $149m (5%)Income tax expense ($30m) (12%) ($47m) (6%)Cash earnings after tax $66m (12%) $102m (5%)F
or p
erso
nal u
se o
nly

13
> Gross loan growth of 2% in a slowing market> BOQ Finance growth of 13% & Commercial growth
of 3% > Housing growth through Virgin Money and BOQ
Specialist, offset by contraction in branch network> Maintained discipline on credit standards
BOQ Finance
Commercial
Housing & Consumer
BOQ Finance
Commercial
Housing & Consumer
(1) Growth rates are on an annualised basis
For
per
sona
l use
onl
y

14
> Continued strong growth through Virgin Money > Branches focused on deposit gathering and MFI
customer growth> Risk discipline maintained
Virgin Money
BOQ Housing
BOQ Specialist Housing
> All business lines achieved growth> BOQ Specialist mortgage growth remains strong> Niche segment growth of $94m> BOQ Finance delivered very strong growth through
equipment, dealer and structured finance programs
BOQ Finance
BOQ Specialist Commercial
BOQ Commercial
For
per
sona
l use
onl
y

15
> Customer deposits contracted, driven by a reduction in higher cost Term deposits
> Deposit to loan ratio of 68%> Took advantage of more favourable conditions for
long term wholesale issuance
Long term wholesale
Short term wholesale
Customer deposits
Senior unsecured
Securitisation / Covered bond
Sub-debt / Additional Tier 1
> Fast Track Starter and Fast Track Saver Accounts launched in late 2018
> Attractive rates for savings accounts linked to transaction account
> Strong customer acquisition evident since launch> Particularly good growth in younger customer
segments
For
per
sona
l use
onl
y

16
> Hedging cost headwind mitigated by improvements driven through funding mix and asset pricing
> Front book vs back book impact ongoing> Third party costs impacted by weighted average life
normalisation and higher mix of third party originations
Element 1H18 2H18 1H19
Asset pricing benefits +4bps +2bps +4bps
Front book pricing & mix (5bps) (5bps) (4bps)
Funding costs & mix +2bps +4bps +2bps
Hedging costs +2bps (2bps) (3bps)
Capital & LCDs (1bp) - (1bp)
Third party costs
Net interest margin
(1) Other moving parts in 1H19 include a -3bps impact related to Third party costs and +1bp impact related to other factors.
For
per
sona
l use
onl
y
17
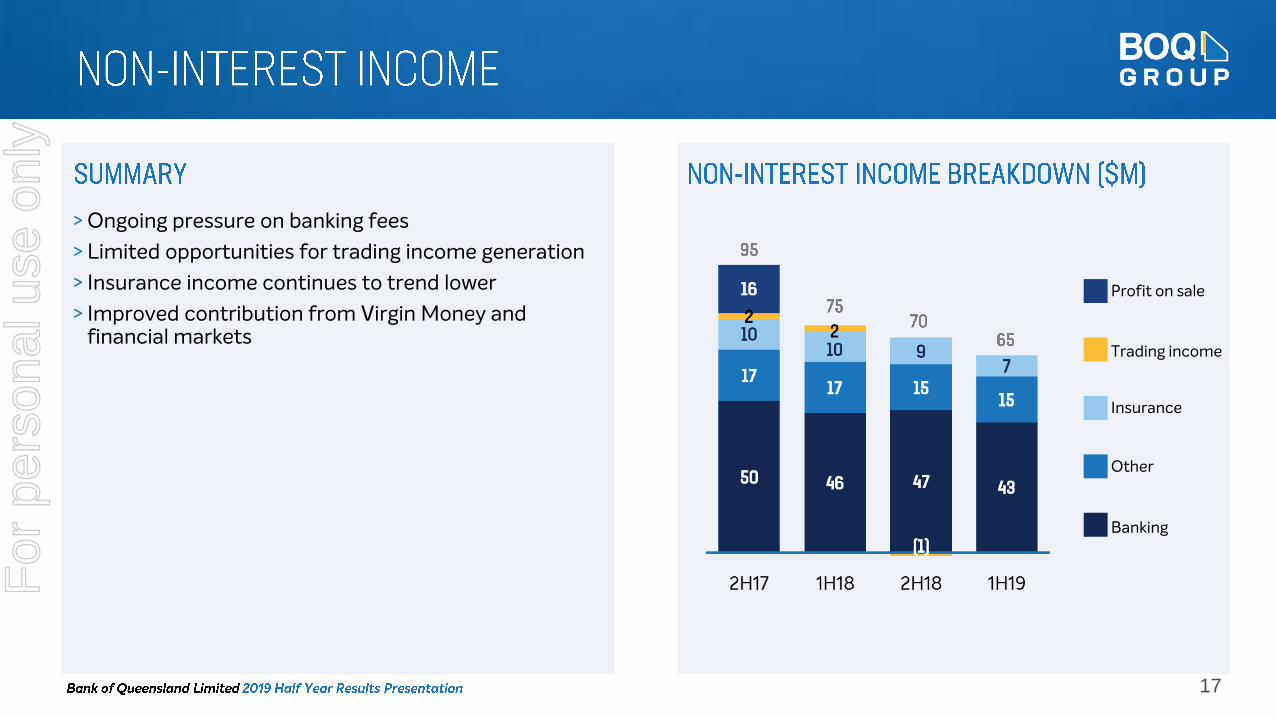
> Ongoing pressure on banking fees> Limited opportunities for trading income generation> Insurance income continues to trend lower> Improved contribution from Virgin Money and
financial markets
Insurance
Other
Banking
Trading income
Profit on sale
For
per
sona
l use
onl
y

18
> Expense growth contained to 2%; CTI 49.5%> Amortisation expected to increase with ongoing
investment > Rising regulatory & compliance costs expected going
forward
IT
Occupancy
Employee
General
Other
Assets under construction
Software intangible asset balance
(1)
(1) Uplift in regulatory costs before mitigating actions.
For
per
sona
l use
onl
y

19
1H19 2H18 1H18Cash earnings after tax $167m $190m $182mAmortisation of acquisition fair value adjustments ($4m) ($2m) ($5m)Hedge ineffectiveness ($3m) ($2m) ($1m)Integration / transaction costs - ($1m) -Extraordinary regulatory /compliance ($3m) ($8m) ($1m)Software changes - ($11m) -Legacy items ($1m) ($4m) ($1m)Statutory net profit after tax $156m $162m $174m
For
per
sona
l use
onl
y

20
> Portfolio metrics remain strong> Further reduction in impaired assets> Low volume of new impairments> Application of new Collective Provisioning model
has driven higher impairment expense
BOQ Finance
Retail
Commercial
BOQ Finance
Group Total
Retail
Commercial
Exposure <$5m
Exposure >$5m to $10m
Exposure >$10m
For
per
sona
l use
onl
y

21
> Arrears level remain low and steady across all portfolios
> Seasonal uptick on BOQ Finance> No areas of concern emerging
30 DPD
90 DPD
30 DPD
90 DPD
30 DPD
90 DPD
(1)
(1) Seasonal uptick which also includes $7m (14 bps), which has subsequently cleared in March 2019.
For
per
sona
l use
onl
y

22
> Specific Provision reduced by 10%> Coverage levels remain strong> Collective Provision increases driven by application
of new model under AASB 9
GRCL
Collective Provision
(1) Collective Provision and GRCL as a proportion of Risk-weighted assets.
For
per
sona
l use
onl
y
23
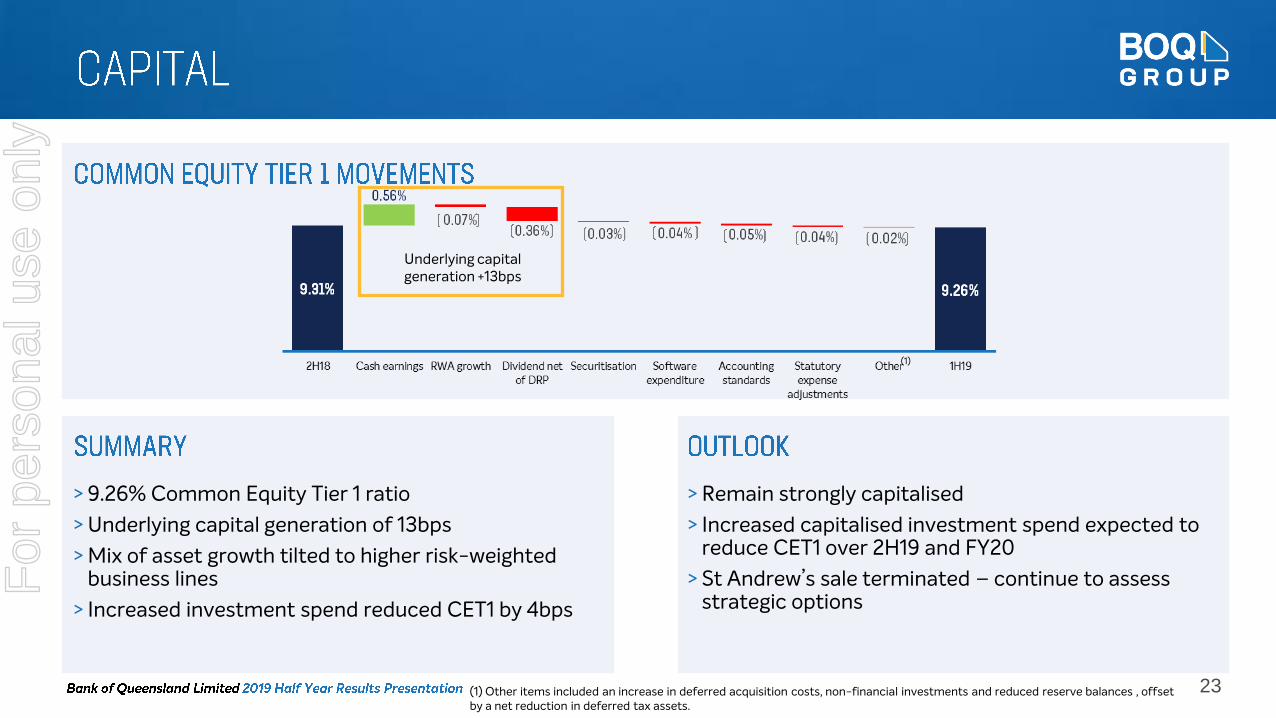
> 9.26% Common Equity Tier 1 ratio> Underlying capital generation of 13bps> Mix of asset growth tilted to higher risk-weighted
business lines> Increased investment spend reduced CET1 by 4bps
> Remain strongly capitalised> Increased capitalised investment spend expected to
reduce CET1 over 2H19 and FY20> St Andrew’s sale terminated – continue to assess
strategic options
Underlying capital generation +13bps
(1)
(1) Other items included an increase in deferred acquisition costs, non-financial investments and reduced reserve balances , offset by a net reduction in deferred tax assets.
For
per
sona
l use
onl
y

24
> Dividend of 34 cents, a reduction of 4 cents per share
> Prudent approach taken enables adequate capital generation to support RWA growth and investment
> DRP supports higher payout ratio and distribution of franking credits
For
per
sona
l use
onl
y

SUMMARY &OUTLOOKINTERIM CEO
For
per
sona
l use
onl
y

26
Navigating rising regulatory requirements
Delivery of foundational ‘must do’ investments
Continue strong niche segment momentum
Reinvigorate Retail Bank & leverage Virgin Money success
Systematic approach to restoring earnings growth and returns
For
per
sona
l use
onl
y
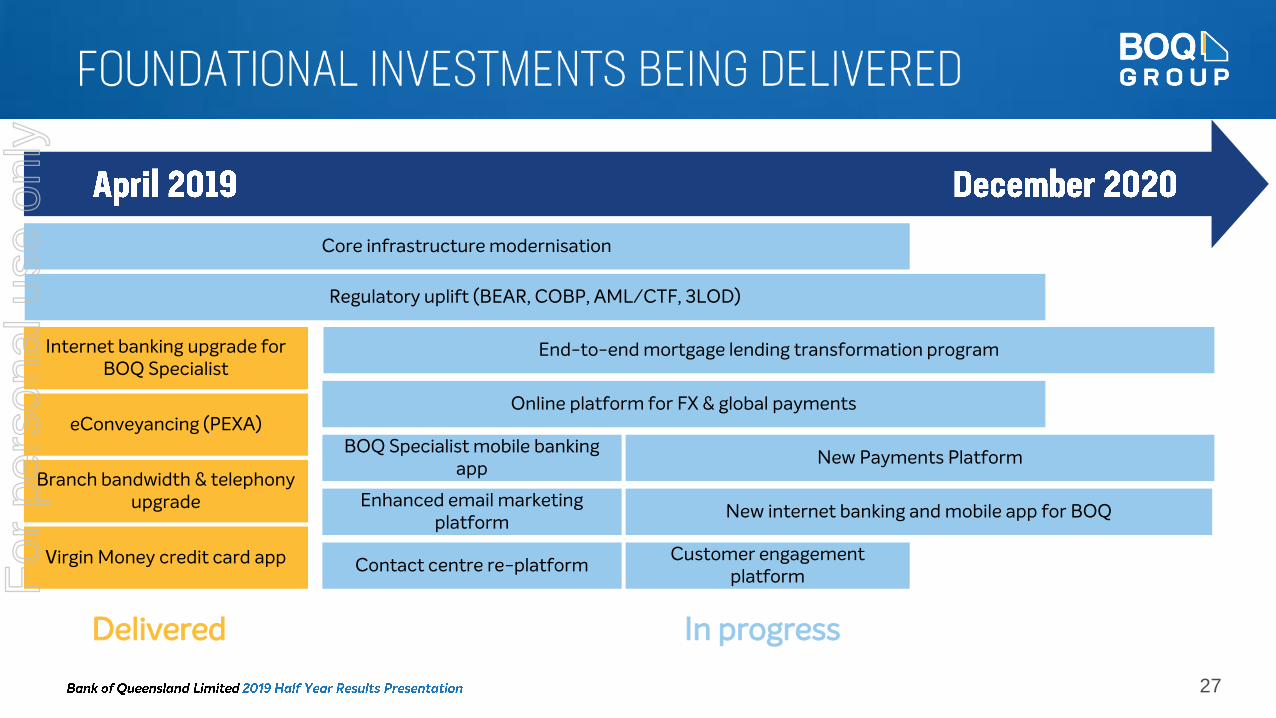
27
Delivered In progress
Internet banking upgrade for BOQ Specialist
eConveyancing (PEXA)
Branch bandwidth & telephony upgrade
Virgin Money credit card app
Core infrastructure modernisation
Online platform for FX & global payments
BOQ Specialist mobile banking app
Enhanced email marketing platform
Contact centre re-platform
End-to-end mortgage lending transformation program
New Payments Platform
New internet banking and mobile app for BOQ
Customer engagement platform
Regulatory uplift (BEAR, COBP, AML/CTF, 3LOD)
For
per
sona
l use
onl
y

28
Segment by segment review of return on tangible equity
Retail Banking strategy redevelopment
Business simplification
Capital/resource allocation
Execution roadmap
For
per
sona
l use
onl
y

29
> Continues to exceed expectations - strong home loan growth since launch, coupled with continued momentum across other product lines
> Attracts a younger, more affluent and geographically diverse customer base
> Compelling opportunity to accelerate the Virgin Money offering to create next generation digital bank
> Well progressed with stage 1> Working with partner to establish a new cloud-
based digital banking offering > On track with key milestonesF
or p
erso
nal u
se o
nly

30
> Standardised banks hold on average 50%+ more capital than IRB banks on housing loans
> This leads to IRB banks generating Return on Equity which is 50%+ higher than Standardised Banks for the same loan
> Collective of second tier banks aligned on pathway to a fairer playing field:
“85% credit risk-weight floor for IRB relative to standardised at an individual loan level”
IRB housing loan ROE (indexed at 100)
Relative Standardised housing loan ROE (indicative)
> Scenario A assumes standardised risk weights decrease > Scenario B assumes IRB risk weights increase
(1) Assumes the same profit per loan with current IRB credit risk weighting of 25% and Standardised credit risk weighting of 39%
+56%+18%
+18%
Relative IRB ROE advantage
(1)
For
per
sona
l use
onl
y

31
Building on niche strategy success
Delivering foundational ‘must do’ investments
Established a path to improve long term value creation
For
per
sona
l use
onl
y

APPENDICES
For
per
sona
l use
onl
y

33
> Broker settlements at 30% including VMA> Interest only settlements remain low> Owner occupied P&I loans represent 51% of portfolio
Metrics (%) 1H18 2H18 1H19Owner occupied 59 59 59Investment 41 41 41Interest only 32 29 25Broker originated(1) 13 15 17Weighted avg LVR 67 67 66Line of Credit 7 6 6Avg loan balance $275k $280k $274kVariable rate 71 74 77Fixed rate 29 26 23
Metrics (%) 1H18 2H18 1H19Owner occupied 61 61 61Investment 39 39 39Interest only 16 14 16Broker originated(1) 30 30 30Weighted avg LVR 68 69 68Line of Credit 1 1 1Avg loan balance $394k $408k $408kVariable rate 72 80 84Fixed rate 28 20 16
61-80%
81-90%
Greater than 90%
40-60%
Less than 40%
(1) Includes Virgin Money
For
per
sona
l use
onl
y

34
For
per
sona
l use
onl
y

35
For
per
sona
l use
onl
y

36
> $167m current exposure to residential construction> 11 developments across 3 states, completing 2019
through 2020> Well diversified intra-state within NSW and VIC
86
373 Completion 2019 Limit - $84mExposure -
$50m# Apts - 121
Limit - $144mExposure -
$111m# Apts - 263
Limit - $26mExposure -
$6m# Apts - 75
75
198
100 21
65
Completion 2020
> No material regional housing exposures> No systemic issues emerging> Direct mining exposure <$110m
For
per
sona
l use
onl
y

37
1H: First half of financial year2H: Second half of financial year3LOD: Three lines of defence30DPD: 30 days past due90DPD: 90 days past dueAASB: Australian Accounting Standards BoardADI: Authorised Deposit-taking InstitutionAML/CTF: Anti-Money Laundering/Counter-Terrorism FinancingAPRA: Australian Prudential Regulation Authority APS: ADI Prudential StandardsApts: ApartmentsASIC: Australian Securities & Investments CommissionAT1: Additional Tier OneAUSTRAC: Australia’s financial intelligence agencyAvg: AverageBDD: Bad & Doubtful Debt ExpenseBEAR: Banking Executive Accountability Regimebps: basis pointsCAGR: Compound annual growth rateCET1: Common Equity Tier 1COBP: Code of Banking Practicecps: Cents per shareCTI: Cost-to-income ratio
DPD: Days past dueDRP: Dividend Reinvestment PlanDTA: Deferred tax assetEPS: Earnings per shareFY: Financial yearGLA: Gross Loans & AdvancesGRCL: General Reserve for Credit LossesIRB: Internal Ratings-Based approach to credit riskLCD: Low cost depositLOC: Line of CreditLVR: Loan to valuation ratioMFI: Main Financial InstitutionNIM: Net Interest MarginOMB: Owner Managed BranchP&I: Principal & interestPCP: Prior corresponding periodROE: Return on equityROTE: Return on tangible equityRWA: Risk-weighted assetsSME: Small and Medium EnterprisesTD: Term depositVMA: Virgin Money Australia
For
per
sona
l use
onl
y

38
This is a presentation of general background information about Bank of Queensland Limited’s (BOQ’s) activities at the date of thisdocument. It is in summary form and does not purport to be complete. It should be read in conjunction with BOQ’s other periodicand continuous disclosure announcements. All figures are presented on a cash earnings basis unless otherwise stated.
The information contained in this presentation may include information derived from publicly available sources that has not beenindependently verified. BOQ does not warrant the accuracy, completeness or reliability of the information contained in thispresentation or any assumptions on which it is based.
This presentation is not financial product advice and should not be relied upon for investment purposes. This presentation does nottake into account the investment objectives, financial situation or particular needs of any individual investors. These should beconsidered, with or without professional advice, before deciding if an investment in BOQ is appropriate.
This presentation may contain forward-looking statements about BOQ’s business and operations, market conditions, results ofoperations and financial condition, capital adequacy and risk management practices which reflect BOQ’s views held and currentexpectations as at the date of this document.
Forward-looking statements are not guarantees of future performance and involve known and unknown risks, uncertainties andother factors, many of which are beyond the control of BOQ and which may cause actual results to differ materially from thoseexpressed or implied in such statements. Readers are cautioned not to place undue reliance on any forward-looking statements.Actual results or performance may vary from those expressed in, or implied by, any forward-looking statements. BOQ does notundertake to update any forward-looking statements contained in this document, subject to disclosure requirements applicable to it.
For
per
sona
l use
onl
y