1999- customer integrated systematic design€¦ · customer integrated systematic design ......
TRANSCRIPT
Transactions of the SDPS 3 (4), 61-74
1
CUSTOMER INTEGRATED SYSTEMATIC DESIGN
Kevin N. Otto Kristin L. Wood Engineering Design Research Laboratory Department of Mechanical Engineering
Massachusetts Institute of Technology The University of Texas 77 Massachusetts Avenue, Room 3-449 ETC 5.160
Cambridge, Massachusetts 02139 Austin, TX 78712-1063
I. INTRODUCTION Systematic design can improve the product development process. We present an integrated set of structured methods developed in conjunction with industrial partners. In our approach, We interrogate the customer population for a product, and represent the demands of this group. Based on, a functional architecture is established, defining what the new product must do and how it must functionally interconnect. We then explore competitive products in the marketplace, and present methods for tearing down these products with the intent of establishing function -- how these products perform as they do. Competitive benchmarking of this type, in conjunction with customer needs and the functional architecture, is then used to create a customer-driven specification for the product through quality function deployment. From this specification, different technologies and components that meet this specification and functional model can be systematically explored and selected. With a preliminary concept selected, the functional model can be refined into a physically based parametric model that can be optimized to establish geometric and physical targets. This model is then detailed, and instantiated as the first alpha prototype of a new product. This systematic product development process has proven effective in both teaching and practice.
II. Task Clarification The design of products begins and ends with the customer, emphasizing quality processes and artifacts throughout. Intertwined with a customer and quality focus are a number of technical and business concerns. We thus initiate the conceptual design process with task clarification: understanding the design task and mission, questioning the design
efforts and organization, and investigating the business and technological market. Task clarification sets the foundation for solving a design task, where the foundation is continually revisited to find weak points and to seek structural integrity of a design team approach. In this sense, it is a pervasive activity that does not occur simply at the beginning of the process, but is employed throughout.
Mission Statement A mission statement and technical clarification of the task are important first steps in the conceptual design process. They are intended to focus design efforts, define goals, provide a schedule, provide guidelines for the design process and to prevent conflicts within the design team and concurrent engineering organization.
A product’s target market can be clarified through the development of a business case analysis. A number of financial assessment techniques exist at varying levels of detail. Two notable and generic techniques are the “Economics of Product Development Projects” in (Ulrich and Eppinger, 1995) and the Harvard business case method (Ronstadt, 1988; McNair, 1954). Application of the Harvard business case method is briefly described below, with context provided by a simple mechanical product: a finger nail clipper.
Finger nail clipper devices are widely used consumer products, with markets of the everyday consumer (primary), professional salons, and domestic pet manicurists. The mission is to design a finger nail clipper for comfortable use by either the left or right hand. A device solution, i.e., a new, generic, and hypothetical clipper design, is the objective, emphasizing the possibilities of reduced cost and higher reliability through compactness and fewer components.

Transactions of the SDPS 3 (4), 61-74
2
These possible benefits call for a “break-even” financial analysis for the clipper problem. This analysis answers the question: “is a hypothetical clipper concept with less materials (compactness) and fewer components feasible as a business venture?”, and begins with a summary of the current costs for finger nail clipper development (as projected for from the current product). Because these costs continually change with new technology and market forces, actual-absolute cost values are not shown, but have been multiplied by a factor. The important issue is the relative cost of the current clipper operations versus a proposed, hypothesized solution. Table 1 lists the expected costs.
A comparison between the current and proposed generic clipper costs is carried out to determine the payback period and cost savings. Table 1 shows the results of the break-even analysis. The payback period is 6 months, with a potential savings of $129,000 for 750,000 products. Significant cycle time and cost savings may be achieved, the project should be carried to the next stage of conceptual design and prototype build.
III. Understanding and Satisfying the Customer Now, having clarified what might make a technical and business opportunity, a firm should determine what features are in actual demand, before expending large resources to develop a new or revised product. Many new technology development initiatives are undertaken with no basis for market acceptance, other than management belief. If the developer thinks the technology is amazing and valuable, then everyone else should also. This is the technologist's problem, and is unfortunately very common in the engineering community. Akia Morita, founder of Sony Corporation, boasts “Our plan is to lead the public to new products rather than ask them what they want. The public does not know what is possible, we do.” (Barabba and Zaltman, 1991). The result is products such as the Betamax. The fallacy inherent to such thinking is a prime market rejection of otherwise innovative products. They fail to satisfy the customer. While the fortunate technology-push approach can and does work, it is also clear that
Table 1. Cost scenario — generic, reduced part-count clipper. Category Projected Cost
($) Cost per Product
($/clipper)
Labor Costs Small Clipper:
Assembly Handling
Large Clipper Assembly Handling
Total
30,000 30,000
9,000 7,500
76,500
0.05 0.05
0.06 0.05
Fabrication Costs Small Clipper:
Materials Piece-Parts Tooling
Large Clipper Materials Piece-Parts Tooling
Total
66,000 24,000 24,000
21,000 9,000
10,500 154,500
0.11 0.04 0.04
0.14 0.06 0.07
Engineering Costs: Avg. 10 weeks per product
187,000
0.25
Total Cost 418,000 Issue Analysis Result
Estimated Payback Period for Development Costs Projected Savings for First 100,000 Products Projected Cost Savings for Next 650,000 Products Expected Average Cycle Time Savings for each 100,000 lot
6 months $17,200 $111,800 38% of current work days
Transactions of the SDPS 3 (4), 61-74
3
considering the customer’s desires will pull product development into better directions and amplify success.
It is important to recognize that “the customer” is a statistical concept, there are numerous potential product buyers. Therefore, there are several tasks that must be completed to develop a statistically valid customer needs list. A short discussion is given below on different methods espoused to do each task, in addition to a detailed discussion of some preferred methods.
Methods to Gather the Voice of the Customer Different techniques developed and applied to construct a customer needs list include: directly using the product, circulating questionnaires, holding focus group discussions, and conducting interviews. Urban and Hauser (1993) provide an excellent management science reference on customer requirements. Shiba (1995) also provides a TQM perspective.
The first method available to understand the customer is “to be the customer” and to use the product directly. Another customer need identification method is to circulate questionnaires. Another method is to hold discussions with multiple customers as a focus group. A final method often applied is to interview the customers. Both the interview and focus group approach can provide customer need information when the design team has limited intimate product knowledge as a customer. Griffin and Hauser (1993) found that conducting interviews is more effective in uncovering information per amount of effort. They also report that for consumer product sized design projects, properly interviewing 9 customers for one hour each provides over 90% of the customer needs, which experience also bears out. Interviews beyond the tenth subject tend to uncover very few new customer needs.
These propositions, however, assume the design team has placed a proper design scope over the customer interview activities. Typically the interviewer allows the interviewed subjects to begin and end where they feel is important. This scope may not be sufficient for the design teams’ informational needs. To address this needs, a method is reviewed below for establishing customer use patterns, beginning with methods for uncovering customer needs.
Conducting Interviews There are different approaches to interviewing. Using an interview sheet with canned questions does not work well for eliciting customer needs. It is
much better to bring nothing other than the following single request:
“Walk me through a typical session using the product.”
Then the customer should articulate what they are doing with every action. Typically the interview starts with the customer making their approach to the product in storage, before even using it. Where is it stored? How is it unpacked new from the box and assembled? Ideally, when the customer does any motion or thought processing, they should state what they are doing. This should be continued through the product use, followed by cleanup and re-storage. Some prompts that are useful to periodically pose during silent moments and general hints for customer interaction are given by Ulrich and Eppinger (1995).
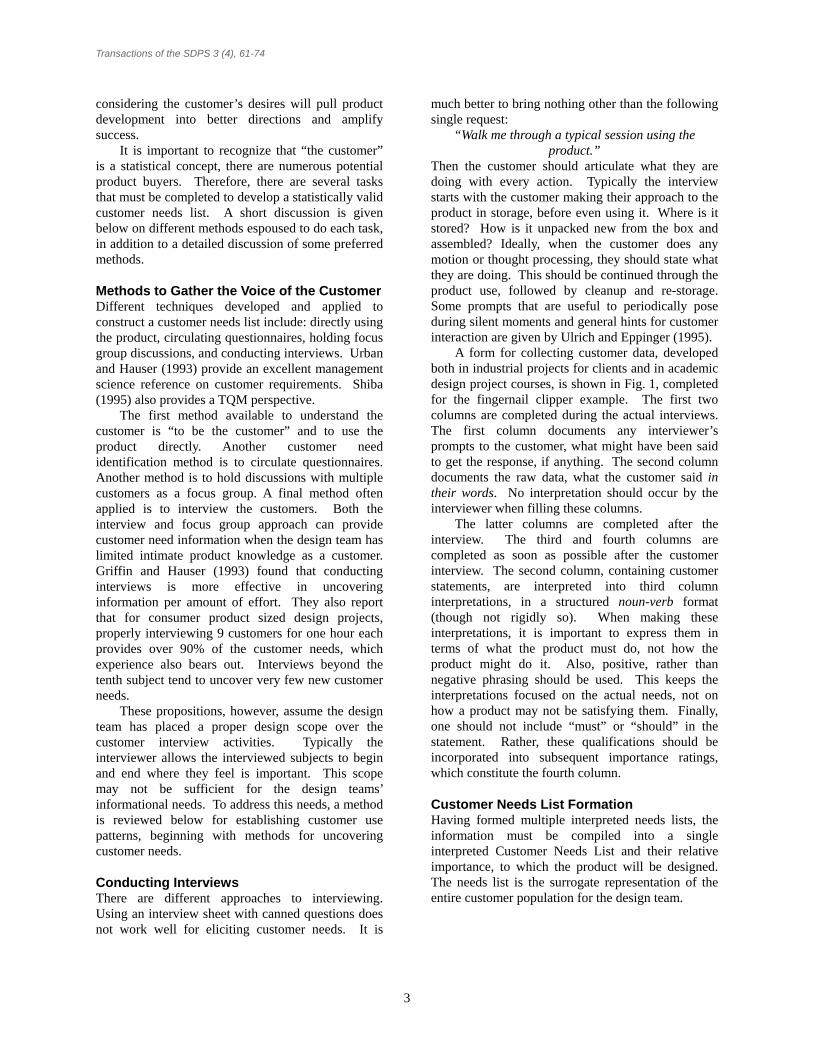
A form for collecting customer data, developed both in industrial projects for clients and in academic design project courses, is shown in Fig. 1, completed for the fingernail clipper example. The first two columns are completed during the actual interviews. The first column documents any interviewer’s prompts to the customer, what might have been said to get the response, if anything. The second column documents the raw data, what the customer said in their words. No interpretation should occur by the interviewer when filling these columns.
The latter columns are completed after the interview. The third and fourth columns are completed as soon as possible after the customer interview. The second column, containing customer statements, are interpreted into third column interpretations, in a structured noun-verb format (though not rigidly so). When making these interpretations, it is important to express them in terms of what the product must do, not how the product might do it. Also, positive, rather than negative phrasing should be used. This keeps the interpretations focused on the actual needs, not on how a product may not be satisfying them. Finally, one should not include “must” or “should” in the statement. Rather, these qualifications should be incorporated into subsequent importance ratings, which constitute the fourth column.
Customer Needs List Formation Having formed multiple interpreted needs lists, the information must be compiled into a single interpreted Customer Needs List and their relative importance, to which the product will be designed. The needs list is the surrogate representation of the entire customer population for the design team.
Transactions of the SDPS 3 (4), 61-74
4
To carry out this compilation, the design team should copy each interpreted need onto an index card. Then, examining the index cards, the team places the first card on a large white board. Next, the second card is compared with the one on the board, and if it is different, it is put in a new column on the board. If however the second card statement concerns the same need as on the first card, the second card is placed under the first into a column. This process is repeated for all the hundreds of cards. This affinity diagram approach results in sorted customer need statements, one customer need per column, as shown in Fig. 2.
Rather than have the design team conduct the sorting, an alternative approach is to have a few customers conduct the sort. This prevents the customer data from being biased by the development team. Urban and Hauser (1993) provide details, but basically one has customers sort and parse the need
statements, and this approach is believed a more complete, though more costly.
Customer Need Importance Having represented the actual customer needs, numerical importance rankings must be established. A good approach to forming an importance ranking for a population is to send a questionnaire to a random customer sample, using the uncovered customer needs list and asking for importance on each need. This approach can provide a sound statistical sample (generally at least 100 randomly sampled customers) for ascertaining importance. Relative importance ratings need to be placed on the needs. Once this is established, the importance assigned to each customer need can be calculated by the average
CRi
CRi , j
j
#subjects
(Eq 1)
Clipper Project Customer Data
Customer: Interviewer: KNO Customer ID: KNO5 Date: 9/3/95Willing to Follow Up? No Location: Cambridge, MAType of User: Middle class, white, male, traveing
Question/Prompt Customer Statement Interpreted Need Weight Activity
When usually use? In the evening in hotel
Keep in my shaving bag Reasonably Compact Must StoreHow big is that? About 3" x 2" x 6", and I have alot of
things in it, it is always fullSize of things is important? Very important. I look for the
smallest size of everything.
So I dig it out of my bag, and carry Striking appearance Nice Prepare for filing it to the bed, where I usually clip Lightweight Nice my nails.
Spin handle and rotate simultaneously Easy to open file Should
Do you file? Yes, I file at an angle, with a vertical File at an angle Must Files nails and a angular motion
With file between thumb and index finger, and clipper body in fist
Easy to close file Should Unprepare for filingRotate file back in place
Easy to open clipper Should Prepare for clippingRotate handle into position Easy to hold clipper ShouldGrab in hand using thumb and index finger, with tail up against middle finger edge
Position nail to be cut on bottom Easy to align clipper Nice Clipping blade Low clipping squeeze force NiceSqeeze finger and thumb to cut Blade shape curved NiceReposition blades and make a 2nd cut Clips nails Must
Reposition blades for final cut Nail falls predictably NiceCatch cut nail
Toss in garbage Dispose of nails
Rotate handle back Easy to close clipper Should Return from clippingSpin handle to closed position
Put back in bag Fig. 1: Customer Need Collection Form, completed for the fingernail clipper example.

Transactions of the SDPS 3 (4), 61-74
5
where CRi , j is the numerical importance rating for
the ith need assigned by the jth customer. The result of (Eq 1) can be linearly scaled to any other numerical range desired and the information contained will remain unchanged. The variance of (Eq 1) across the subject pool can also profitably serve as an uncertainty indicator to establish significant figures. As a working example, consider the redesign of a finger nail clipper. When redesigning this product, customer need importances were gathered as shown in Fig. 3. Other methods for determining importance are detailed by Urban and Hauser (1993).
In addition to customer needs, there are also other requirements that a product must satisfy, typically legislative or manufacturing. These can be represented as additional requirements in the customer needs list. Other non-customer requirements can be incorporated in the customer needs list as deemed appropriate. Alternatively, a specification sheet may be added for non-customer requirements, organizing the requirements according to topic. (Pahl and Beitz, 1991) and (Cross, 1994) provide detailed examples of how to create a specification sheet.
Customer Use Pattern Formation Any non-trivial product has distinct activities that a user steps through when using the product. A product is purchased, transported, assembled out of packaging, stored away, removed for use, initialized, used in different ways in different environments, perhaps modified by the user, periodically cleaned or maintained, and disposed. For communication to the design team, these different customer use patterns should be captured and represented, as all can give rise to different product forms. Further, capturing the customer use patterns helps to ensure that each different activity has had customer needs gathered.
To form the possible use patterns, it is important to first capture the serial activity sequence for each customer. To do this, the last column of the customer data sheets, Fig. 1, is completed. Typically, a sequence of customer statements will have one associated activity. Activities differs from customer needs in that activities label what the customer is doing (not the product) when a group of needs are expressed about the product. Upon completing column 4 of the customer data sheets, the activity sequences are combined into a network Activity Diagram, as shown in Fig. 4. How typical any sequence is can be recorded by line width. The initial and final activity are also highlighted, scoping the customer requirement gathering activity. This can help system-engineer the environment within
Put on Cards
Group
Fig. 2: Converting the set of interpreted needs into a customer needs list.
Clipper ProjectCustomer Requirements
Interviewer(s): KNODate: 9-7-95
5 Number of Customers0 5 Weighting Scale75% Must Confidence
Average Customer:Male/Females, age 20-60, Middle ClassNot in the hair or nail industry
Customer Requirement WT
• Purchase - Cost 4
• Transport in package
• Unpackage
• Chain Keys
- Act as keychain 0
• Store - Compact storage 4
- Non-snag storage 1
- Lightweight 2
- Striking appearance 3
• Prepare to File/Pick - Easy to open file 2
• Filing/Picking - Files nails 2
- Picks nails must
- File rough 1
- File holds filed dust 0
- File has a picking tip must
• Return from Filing/Picking - Easy to close file 2
• Prepare for clipping - Easy to open clipper 4
• Clip nails - Easy to align clipper 2
- Easy to hold clipper 3
- Body contoured to hold 3
- Curved blade shape 3
- Wide handle 2
- Low squeeze force 1
- Blade can act as pusher 1
- Blade can act as a file 1
- clips nails must
- clips toe nails 1
- clips hang nails 1
- sharp blade 1
- Nails fall predictably 1
- Stores cut nails 1
- Easy to clean 0
• Return from clipping - Easy to close clipper 4
• Throw away
Fig. 3: Partial Customer Needs List.
Transactions of the SDPS 3 (4), 61-74
6
which the product is used, if that is a topic for a larger scope team.
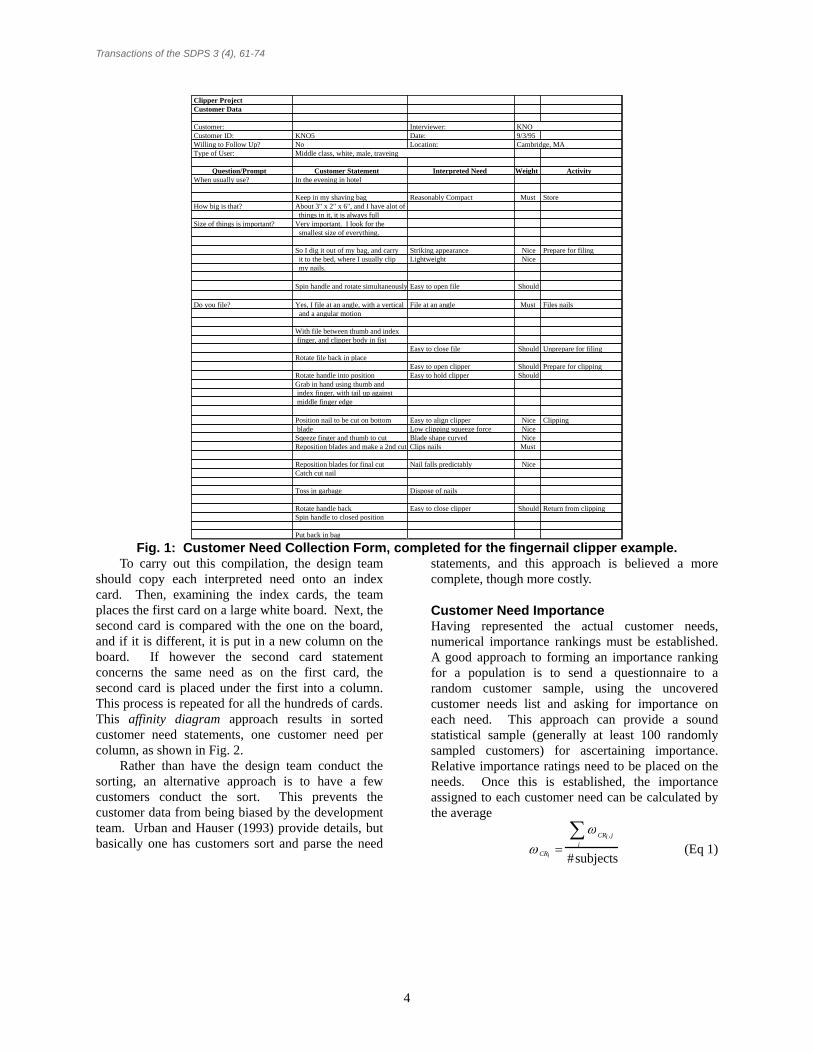
The Activity Diagram can communicate to any new and different design team members what the customer does with the product. It helps ensure that a design team is aware of all customer lifecycle product needs. Note that the Activity Diagram can also be expanded upstream to capture sales, distribution and manufacturing activities. Similarly, downstream activities such as disposal can be represented.
IV. Functional Modeling Having a representation of what the customer wants from the product, a model of how the product functions to satisfy the customer is needed. Functionally, all products do something. Products, therefore, accept “inputs” and operate to produce “outputs,” i.e., the desired performance. We can model any product, assembly, subassembly, or component as a system, with inputs and outputs that traverse a system boundary. The essence of such a model is the need-function-form definition of engineering design. In the sections below, we construct the necessary machinery for understanding and representing design function, according to a system perspective. This machinery will aid us in synthesizing form solutions, with greater breadth, less bias, and greater technical understanding than ad hoc approaches.
Phase 1 — Develop Process Descriptions as Activity Diagrams
Functional modeling includes developing a process description, here as represented with the Activity Diagram, and eventually forming a function structure. To start the function modeling process, an important tool is to specify the process by which the product being designed will be functionally implemented.
To see this, consider Fig. 4, which illustrates the Activity Diagram for the finger nail clipper design. To focus on product usage, the system boundary chosen includes all of the customer activities. Fig. 4 does not include manufacturing related activities such as packaging and transport, sales functions such as unpackaging, nor the disposal. Depending on the scope of the design task, it could have. This modeling boundary defines the product system, receiving inputs from and producing outputs to the user and environment.
Phase 2 — Formulate Subfunctions Through Task Listing and Black Box Modeling
Using the customer process description (Activity Diagram) and customer needs, a function structure for the product is next formulated, where a function structure is defined as an input-output model that maps energy, material, and signal flows to a transformed and desired state. Function structure modeling (Pahl and Beitz, 1984; Miles, 1972; Ullman, 1992; Shimomura, et al. 1995; Ulrich and Eppinger, 1995; Cross, 1994) has historically been used to create a form-independent product expression. We extend common function structure modeling to include a mapping of customer needs to subfunction sequences (called task listing), a method for aggregating subfunctions, and a comparison of a functional decomposition with customer needs.
The first step is to identify primary flows associated with the customer needs of the product activities. A flow is a physical phenomenon, i.e., material, energy, or signal (information), intrinsic to a product operation or subfunction. In the context of input-output modeling, a flow enters an operation or subfunction, is manipulated by the subfunction, and exits in a new state. For example, an operation may be to pressurize a fluid. Two critical flows for this operation are an energy to execute pressure change and the fluid material being operated upon.
Considering the finger nail clipper example, a subset of the customer needs are cost, compactness, files well, cuts well, is easy to open/close, easy hold, comfortable, and sharp cutting surface.
We now translate the customer needs to energy, material, or signal flows of the product when effects
Purchase Transport in Package
Unpackage
Chain Keys
Store
Throw Away
Pick NailsClip Nails File Nails
Prepare to Clip
Prepare to
File/Pick
Return from
File/Pick
Return from
Clipping
Fig. 4: Completed activity diagram for the
finger nail clipper.

Transactions of the SDPS 3 (4), 61-74
7
are exhibited or are expected to be exhibited during product use. Cost is not something that deals with what the product does. So we do not model “not inexpensive” functionally. Primary flows associated with “not compact” are the user’s hands, the finger nail dimensions, and storage compartments, e.g., pants pockets, wallets, or purses. These flows are material in nature and capture capacity in terms of “volume.” Primary flows for the remaining customer needs include: “Does not file well” — hand motion (energy),
finger nail (material), finger nail roughness (signal).
“Does not cut well” — generated cutting force (energy), finger force (energy), and finger nail (material).
“Not easy open/close” — hand movements (energy) and hand (material).
“Not easy to hold” — finger force (energy) and hand (material).
“Not comfortable” — finger force (energy) and hand (material).
“Not a sharp cutting surface” — generated cutting force (energy) and finger nail (material). For each of the flows, the next step is to identify
a sequence of subfunctions and specific user operations that when linked represent the product when interfacing with the customer during the customer activities. A subfunction, in this case, is an
active verb paired with a noun that represents the causal reason behind a product behavior.
A useful approach for generating subfunctions is to trace the flow as it is transformed from it initial creation state to its final expected state when it leaves the product’s system boundary. This approach may be executed by play acting the flow (becoming the flow) or brainstorming a hierarchy of functions that must process the flow.
For example, a customer need, expressed in the customers’ voice, may exist for “Cuts nail well.” A suitable flow for addressing this need is a force flow that ultimately acts on the nail material flow. Fig. 5 illustrates the task listing results for a subset of the customer needs and corresponding flows. Each function chain in the figure (a-c) represents a functional decomposition of the functions needed to “cut nail well.” Customer needs directly lead to each of these function chains, a tactical advantage of the method.
Phase 3 — Aggregate Subfunctions into a Refined Function Structure
Each sequence of subfunctions for the full set of customer needs are aggregated (combined) to represent the functions of the entire product. This step is accomplished by appropriately connecting flows between each sequence and adding subfunctions that interact or provide control states.
Aggregation and refinement of the function structure ends based on two criteria: (1) are the subfunctions “atomic,” i.e., can they be fulfilled by a single, basic solution principle that satisfies the function, and (2) is the level of detail sufficient to address the customer needs? The first criterion provides a basis for choosing the depth of functional analysis. For the finger nail clipper design effort, an aggregated function structure is shown in Fig. 6. Notice that subfunctions and flows are combined for overlapping or redundant functionality from Fig. 5. User functions are also listed outside of the system boundary for clarity.
Phase 4 — Validate the Functional Decomposition
Once the design team completes the subfunction aggregation, functional modeling and analysis comes to a closure through two verification steps. First, all major flows between the subfunctions are labeled and checked according to their state of transformation. By labeling the flows, validity and continuity is ensured, perhaps leading to the addition of further functional representations. Second, the customer needs list is reviewed, and the subfunction or sequence of subfunctions are identified that satisfy
Open System
Finger Force
Execute Cutting
Finger nail
Nail uncut
Clipped nail
Close Systemclipper
openfinger clipped
Cover Cutting Surface
HandHand
Store Nail
Finger Nail
Clipped Nail Clean finger
Stop motion
Release Force
Release Motion
motion
high force force
Kinetic Energyin nail, sound
Apply Finger Force
Finger Force
Convert to large force
force Guide to cut nail
large force
down motion
Move to Cut Nail
Cut Nail
Hands
HandsHands
Kinetic Energy
(a) CN: Cut Well, Easy to Hold, Comfortable; Flows: Finger Force, Nail, Hands
(b) CN: File Well ; Flows: Nail, Hand Motion, Roughness Signal
(c) CN: Open/close easily; Flows: Nail, Hand
Reaction Force
Form Filing
Surface
Hand Motion (Finger Force)
Slide Over Finger Nail
file in place
Rough Nail
Rough
roughness
Rough
Clean nail, Nail filings, Hands
Determine roughness
Hands, Nail
Hand
Moving Hand
HandReset Filing
SurfaceForm
Grasping Surface
Orient Filing
Surface
Hand
Reaction Force
Reaction Force
Fig. 5. Finger Nail Clipper Task Listing for
Each Customer Need.
Transactions of the SDPS 3 (4), 61-74
8
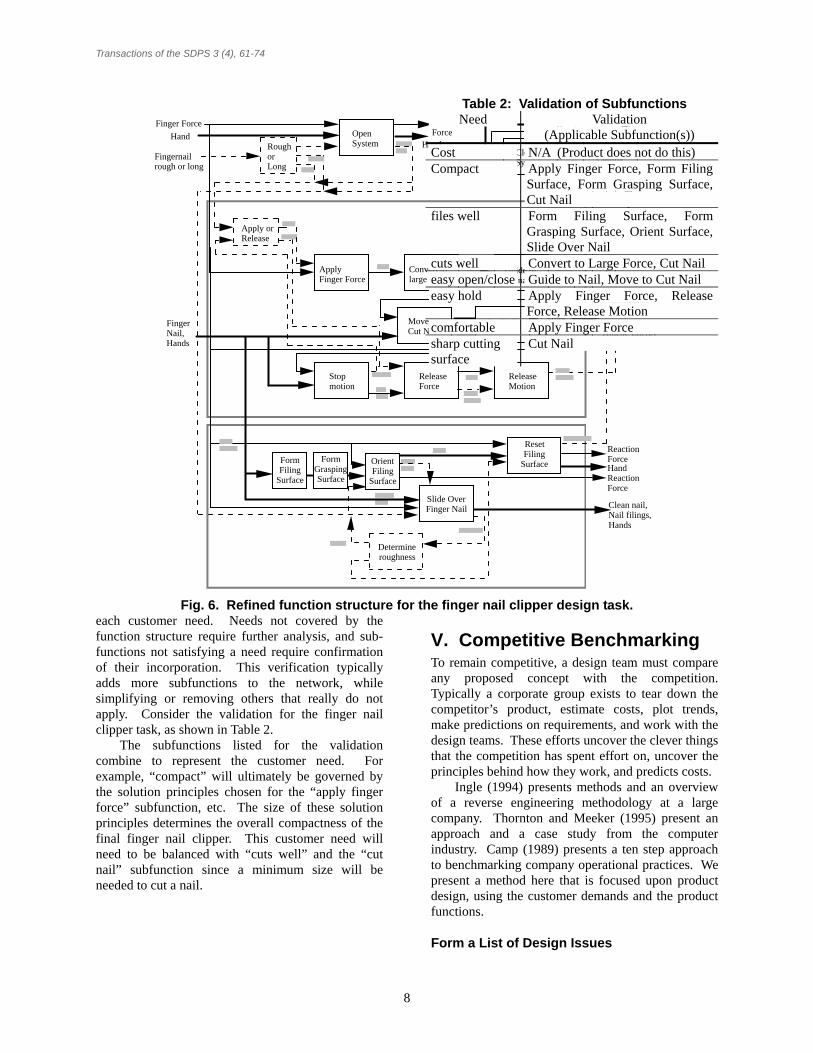
each customer need. Needs not covered by the function structure require further analysis, and sub-functions not satisfying a need require confirmation of their incorporation. This verification typically adds more subfunctions to the network, while simplifying or removing others that really do not apply. Consider the validation for the finger nail clipper task, as shown in Table 2.
The subfunctions listed for the validation combine to represent the customer need. For example, “compact” will ultimately be governed by the solution principles chosen for the “apply finger force” subfunction, etc. The size of these solution principles determines the overall compactness of the final finger nail clipper. This customer need will need to be balanced with “cuts well” and the “cut nail” subfunction since a minimum size will be needed to cut a nail.
V. Competitive Benchmarking To remain competitive, a design team must compare any proposed concept with the competition. Typically a corporate group exists to tear down the competitor’s product, estimate costs, plot trends, make predictions on requirements, and work with the design teams. These efforts uncover the clever things that the competition has spent effort on, uncover the principles behind how they work, and predicts costs.
Ingle (1994) presents methods and an overview of a reverse engineering methodology at a large company. Thornton and Meeker (1995) present an approach and a case study from the computer industry. Camp (1989) presents a ten step approach to benchmarking company operational practices. We present a method here that is focused upon product design, using the customer demands and the product functions.
Form a List of Design Issues
Move to Cut Nail
Finger Nail, Hands
Stop motion
Release Force
Release Motion
Apply Finger Force
Convert to large force
Guide to cut nail
Open System
Finger Force
Close System
Fingernail rough or long
Rough or Long
Apply or Release
Cover Cutting Surface
Clipped Nail Clean finger, HandsKinetic Energy in nail, sound
Hand
Hand
Cut Nail
Reaction Force
Reaction Force
Hand
Hand
Store Nail
Form Filing
Surface
Slide Over Finger Nail Clean nail,
Nail filings, Hands
Determine roughness
Hand
Reset Filing
SurfaceForm
Grasping Surface
Orient Filing
Surface
Reaction Force
Reaction Force
Fig. 6. Refined function structure for the finger nail clipper design task.
Table 2: Validation of Subfunctions Need Validation
(Applicable Subfunction(s)) Cost N/A (Product does not do this) Compact Apply Finger Force, Form Filing
Surface, Form Grasping Surface, Cut Nail
files well Form Filing Surface, Form Grasping Surface, Orient Surface, Slide Over Nail
cuts well Convert to Large Force, Cut Nail easy open/close Guide to Nail, Move to Cut Nail easy hold Apply Finger Force, Release
Force, Release Motion comfortable Apply Finger Force sharp cutting surface
Cut Nail

Transactions of the SDPS 3 (4), 61-74
9
First it must be clear what problems the design team is facing on the current project. If this is a new project, the technical form issues may be unknown, and so information about the customer market, competitors, and competitive products are worth investigating. If this is a redesign project, an investigation can ask of the previous design team: What was difficult for them? What design problem did they solve which they
are proud of? What related technologies are they interested in?
The deliverable from this step is a list of keywords with explanations on topics to gather information.
Form a List of Related Products Knowing the product function, one must examine the sales outlets for products which address these functions. For consumer products, sales outlets are typically retail stores. For the product, one must list all competitors and their different product models, and all related products in their portfolio. If the competitors have a family of products under a common product architecture (they use identical components for some aspects of each product, but different components for niche demands), one should detail this information, as it can indicate the competitor’s preferred market segments.
This step should only be an identification of the competitors, as company names and product names. With a complete set of different products, vendors, and suppliers to examine, the list should be screened by highlighting the particular ones that appear most crucial for the design team to fully understand. This approach work feeds the next step, conducting a information search.
Conduct an Information Search The importance of this step cannot be overstated. The wealth of information available about all business operations across the globe is amazing. Before starting any design activity, a team must understand the market demand for product features, and what the competition is doing to meet it. A
design team should gather information on the products and related products, the functions they perform, and the targeted market segments. All keywords associated with these three categories should be used in informational searches.
Prepare for Product Tear Downs From the previous efforts, a list of products that are worth spending time tearing apart and analyzing should be formed. This list should contain products that can provide technical solutions to design needs. Typically, this list includes the least expensive model on the market, the most expensive model, the most popular model, and models which have particular technical features.
Next, one must clarify the criteria on which data are required. Typically, these criteria include quantity of parts per product unit, dimensional measurement, maximum, minimum, and average material thickness, weight, material, etc.
Examine the Distribution Important factors in the product development decision making process that must not be overlooked are the means used to acquire parts, contain them, ship, distribute, and market the product. These must also be examined as a part of the benchmarking process. The distribution packaging of the product should be examined and reported to the design team, often it can be quite expensive. Consumer installation instructions and procedures should be examined for costs and effectiveness.
Disassemble and Measure by Assemblies, and Form a Bill of Materials
Disassembly is the obvious step commonly pictured when thinking of reverse engineering. However, to be effective, this must be coordinated with measurements. One should take pictures and measurements on the whole assembly before disassembly, and similarly on each sub-assembly, down to individual components.

Transactions of the SDPS 3 (4), 61-74
10
Complete a written form which details the product. A good format is shown in Fig. 7, where each column consists of the data analysis criteria. Also, the sequence of photos and an exploded view CAD drawing should be completed.
Plot Industry Trends Having uncovered a wealth of information from such sources, the next problem is to arrange and transform it for clear understanding of implications for the design or redesign task.
The benchmarking of technical solutions is possible with a time history of product measurements. All technological innovations manifest themselves into the market along an “s-curve” timeline behavior, as shown in Fig. 8. For all of the different products in a market, one can plot each product’s performance as a function of the time when each product was introduced. The metric values will naturally fall as an “s-curve” in time. First, the values are low and widely spaced: not much innovation is occurring in the market. Next, a rapid profusion of innovation occurs, and many products are launched in time. The lower leg of the “s” is forming. The new technology, however, eventually tops out, physical laws of the process dominate, and engineers cannot extract more performance. The slope of the “s” tops out again, and the curve becomes flatter.
These trends are critical for a competitive company to understand for their industry. If the
market is becoming more competitive, the company must understand that to invest in product and process quality, or lose. One can tell this immediately as the point at which the lower leg of the “s” starts to form. If the market technology is topping out (the top of the “s”), the company should again know this to begin to investing in a new technology, to “jump” to the next s-curve, higher on the scale of the metric. Plotting trends provides all of this information. Clearly trending of competitive data is a necessary and culminating business consideration as a part of product benchmarking.
VI. Forming Quantitative Specifications Having established the function structure and understood competitive product performance, each sub-function must now be associated to at least one line item in a product functional Specification Sheet. These are functional specifications of what the product must do, not necessarily form specifications for purchasing components. The specification list should include both the specifications and also an importance rank of each specification.
Approaches taken to forming specifications most often include Quality Function Deployment (Akao, 1990, Clausing, 1994). For the most part, these methods provide a means to verify and agree upon a proposed list of specifications, and a means to set target values on the variables. What these and other
Part # Part Name Quantity Finish Function Physical Parameters
A1 Arm Assembly001 Actuator arm 1 Chrome Transmit finger force 2", shaped
Input from finger .25" pivot002 Pin 1 Chrome pivot .13" round
A2 Cutter Assembly003 Blade arms 2 Chrome Cut nails 2.00 x .44 x .13
Spring action .13" blade gapA3 File Assembly
004 File 1 Chrome File nail Scored1.50 x .25 x .06
005 Pivot rivet 1 Chrome Attach file .19 rivet Fig. 7. Reverse Engineering Bill-of-Material.
metric
timeFirst Technology
New Technology
An individual product
Fig. 8. Technological innovations plot as S-curves.

Transactions of the SDPS 3 (4), 61-74
11
tools do not provide is a means to identify what variables should be used as specifications. How does one identify the measurable variables that are to be ensured?
Identifying Specification Metrics To establish an initial set of engineering specifications, a design team should begin by listing each sub-function. Then to each sub-function, a relevant product subsystem is examined. From these sources, a means to “instrument” the product subsystem to measure the functional flows in and out of the sub-function should be considered. Depending on the product, this instrumentation can rely on engineering data acquisition, or can be as simple as touch, feel, or look. This depends on the comprehensive nature of the metric. A partial list for the finger nail clipper is shown in Fig. 9, with the process assumption of a mechanical cutting surface (a blade).
This approach generally produces better results than other approaches, in that the sub-functions are more quantified than customer needs. The approach still clearly relies on the creativity of the design team. On the other hand, the creativity is decomposed into two stages, conceiving of the function structure itself and conceiving of how the flows of each sub-function can be “instrumented” for measurement on the product sub-system. It is less a conceptual leap to generate measurable metrics for an independently generated set of sub-functions, each associated with a subsystem, than to generate measurable metrics for each customer need directly.
Next, the metrics generated must have target values assigned to each. This assignment is completed by examining the relevant customer needs associated to each metric. In general, establishing a target may require some calibration of the metric. For example, once it is understood that handle temperature is a good metric to represent comfort of the customer, it may be required to test different handle temperatures with the customers to determine the highest acceptable temperature value.
After these steps, a relevant hierarchical set of functional specifications is completed. It can be collected into a House of Quality matrix, for example, to verify and communicate how the customer needs are being met. The House of Quality can be used to document the product design targets of the different team members working in concert.
Forming Specification Importance Ranks Finally, the importance of each specification can be calculated through the House of Quality. This calculation is carried out in the usual manner by inserting relationship values in the House of Quality matrix to relate customer needs with engineering specifications. Then a suitable algebra is used to combine these relationship ratings with the customer
Sub-Function SpecificationOpen System
Opening forceOpening gapOpening grip areaOpening surface friction
Rough or Long -
Apply or Release -
Apply Finger ForceFingerpoint surface frictionFingerpoint cupness
Convert to Large ForceForce gainMotion reduction
Guide to Cut NailBlade visibilityBlade curvature
Move to Cut NailOpen blade opening width
Cut NailSharpnessHardnessFlatness
Store NailStorage volume
Stop MotionClick soundStop compliance
Release ForceExpansion force
Release Motion -
Form Filing SurfaceOpening friction torqueFinger opening surface areaFinger opening frictionFinger pushing areaOpen alignment force
Form Grasping SurfaceGrip areaGrip surface friction
Orient Filing SurfaceFiled nail visibility
Slide Over Finger NailFiling surface areaFile roughness, Left to RightFile roughness, Right to Left
Reset Filing SurfaceClosed alignment force
Determine Roughness -
Cover Cutting SurfaceClosed blade opening width
Close SystemClosed arm force
Fig. 9. Generating metrics for sub-functions, finger nail clipper example.

Transactions of the SDPS 3 (4), 61-74
12
need importance ratings to establish importance ratings on the individual specifications.
The results for the finger nail clipper are shown and summarized in Fig. 10, the House of Quality matrix for the clipper. The numerically rated specifications become objectives that can be traded off in design decision making, with importance as indicated.
VII. Generating Design Configurations Fig. 10 illustrates a crisp, quantitative specification for product design. Its roots are grounded in customer needs, and its structure is interwoven by the established product functionality. This specification, however, does not complete the conceptual design process. Form solutions must be generated for the decomposed subfunctions, combined into a finite set of concept variants, and then selected using the quantified specifications exemplified by Fig. 10.
Various methods for concept generation are documented in the literature (Pahl and Beitz, 1991; Ulrich and Eppinger, 1995; Ullman, 1992; Cross, 1992; Greenwood, 1982; French, 1985; Hubka, 1984; Pugh, 1991; Dixon and Poli, 1995; Altshuller, 1984). For the purpose of the finger nail clipper design, we seek to develop concepts according to a four step process: (1) generate as many solution principles to
each of the subfunctions (Fig. 6) as possible, (2) qualitatively prune the number of solution principles using the criteria of Fig. 10, (3) combine the remaining solution principles into a number of feasible concept variants that satisfy the entire set of product functions, and (4) identify avenues for function sharing in each concept variant to reduce part count and complexity.
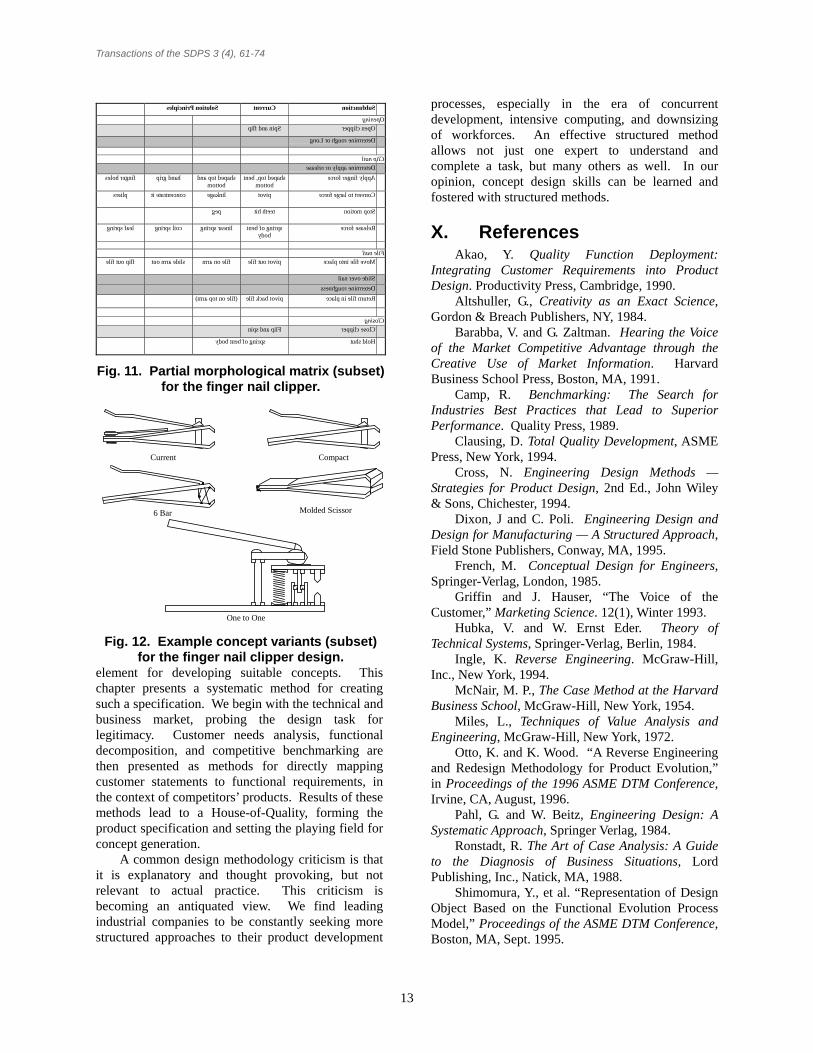
Figs. 11 and 12 illustrate a subset of the results from this three-step process. The morphological matrix contained in Fig. 11 shows a breadth of form solutions to the decomposed functions. In turn, Fig. 12 shows some possible combinations into concept variants. Because the concepts are generated directly from the functional specification, the likelihood of satisfying the customer needs is high, something that is not afforded by ad hoc approaches. Fig. 13 confirms this statement. A number of current finger nail clippers are shown in the figure. The concept generation, summarized in part by Figs. 11 and 12, covers these product ideas at a fundamental functional level. In fact, the “molded scissor” concept does not currently exist on the market, a potential product evolution.
VIII. Conclusions Product concepts begin and end with the customer. A concise and quantified specification is an essential
Ope
n S
yste
m
-
Ope
ning
for
ce
-
Ope
ning
gap
-
Ope
ning
grip
are
a
-
Ope
ning
sur
face
fric
tion
Rou
gh o
r Lo
ng
-
App
ly o
r R
elea
se
-
App
ly F
inge
r F
orce
-
Fin
gerp
oint
sur
face
fric
tion
-
Fin
gerp
oint
cup
ness
Con
vert
to
Larg
e F
orce
-
For
ce g
ain
-
Mot
ion
redu
ctio
n
Gui
de t
o C
ut N
ail
-
Bla
de v
isib
ility
-
Bla
de c
urva
ture
Mov
e to
Cut
Nai
l
-
Ope
n bl
ade
open
ing
wid
th
Cut
Nai
l
-
Sha
rpne
ss
-
Har
dnes
s
-
Fin
ger
sque
eze
area
-
Fla
tnes
s
Sto
re N
ail
-
Sto
rage
vol
ume
Sto
p M
otio
n
-
Clic
k so
und
-
Sto
p co
mpl
ianc
e
Rel
ease
For
ce
-
Exp
ansi
on f
orce
Rel
ease
Mot
ion
-
For
m F
iling
Sur
face
-
Ope
ning
fric
tion
torq
ue
-
Fin
ger
open
ing
surf
ace
area
-
Fin
ger
open
ing
fric
tion
-
Fin
ger
push
ing
area
-
Ope
n al
ignm
ent
forc
e
For
m G
rasp
ing
Sur
face
-
Grip
are
a
-
Grip
sur
face
fric
tion
Orie
nt F
iling
Sur
face
-
File
d na
il vi
sibi
lity
Slid
e O
ver
Fin
ger
Nai
l
-
Fili
ng s
urfa
ce a
rea
-
File
rou
ghne
ss,
Left
to
Rig
ht
-
File
rou
ghne
ss,
Rig
ht t
o Le
ft
Res
et F
iling
Sur
face
-
Clo
sed
alig
nmen
t fo
rce
Det
erm
ine
Rou
ghne
ss
-
Cov
er C
uttin
g S
urfa
ce
-
Clo
sed
blad
e op
enin
g w
idth
Clo
se S
yste
m
-
Clo
sed
arm
for
ce
Mat
eria
l FIn
ish
Key
chai
n
Wei
ght
Mat
eria
l Cos
t
Purchase - Cost 4 ² O ²
Transport in package
Unpackage
Chain Keys - Act as keychain 0 §
Store - Compact storage 4 ² ² § ² ² ² ² ² - Non-snag storage 1 O § § - Lightweight 2 ² ² ² § - Striking appearance 3 ² ² §
Prepare to File/Pick - Easy to open file 2 § O O O O O
Filing - Files nails 2 O § O - File rough 1 § O
Return from Filing/Picking - Easy to close file 2 § O O O O O
Prepare for clipping - Easy to open clipper 4 § O O O
Clip nails - Easy to align clipper 2 O O O - Easy to hold clipper 3 O - Body contoured to hold 3 § - Curved blade shape 3 - Wide handle 2 § - Low squeeze force 1 § - Blade can act as pusher 1 § - Blade can act as a file 1 O O § O - clips nails must O § O - clips toe nails 1 O § O - clips hang nails 1 - sharp blade 1 § - Nails fall predictably 1 § - Stores cut nails 1 § - Easy to clean 0 O §
Return from clipping - Easy to close clipper 4 § O O O ²
Throw away Fig. 10. House of Quality for the finger nail clipper.
Transactions of the SDPS 3 (4), 61-74
13
element for developing suitable concepts. This chapter presents a systematic method for creating such a specification. We begin with the technical and business market, probing the design task for legitimacy. Customer needs analysis, functional decomposition, and competitive benchmarking are then presented as methods for directly mapping customer statements to functional requirements, in the context of competitors’ products. Results of these methods lead to a House-of-Quality, forming the product specification and setting the playing field for concept generation.
A common design methodology criticism is that it is explanatory and thought provoking, but not relevant to actual practice. This criticism is becoming an antiquated view. We find leading industrial companies to be constantly seeking more structured approaches to their product development
processes, especially in the era of concurrent development, intensive computing, and downsizing of workforces. An effective structured method allows not just one expert to understand and complete a task, but many others as well. In our opinion, concept design skills can be learned and fostered with structured methods.
X. References Akao, Y. Quality Function Deployment:
Integrating Customer Requirements into Product Design. Productivity Press, Cambridge, 1990.
Altshuller, G., Creativity as an Exact Science, Gordon & Breach Publishers, NY, 1984.
Barabba, V. and G. Zaltman. Hearing the Voice of the Market Competitive Advantage through the Creative Use of Market Information. Harvard Business School Press, Boston, MA, 1991.
Camp, R. Benchmarking: The Search for Industries Best Practices that Lead to Superior Performance. Quality Press, 1989.
Clausing, D. Total Quality Development, ASME Press, New York, 1994.
Cross, N. Engineering Design Methods — Strategies for Product Design, 2nd Ed., John Wiley & Sons, Chichester, 1994.
Dixon, J and C. Poli. Engineering Design and Design for Manufacturing — A Structured Approach, Field Stone Publishers, Conway, MA, 1995.
French, M. Conceptual Design for Engineers, Springer-Verlag, London, 1985.
Griffin and J. Hauser, “The Voice of the Customer,” Marketing Science. 12(1), Winter 1993.
Hubka, V. and W. Ernst Eder. Theory of Technical Systems, Springer-Verlag, Berlin, 1984.
Ingle, K. Reverse Engineering. McGraw-Hill, Inc., New York, 1994.
McNair, M. P., The Case Method at the Harvard Business School, McGraw-Hill, New York, 1954.
Miles, L., Techniques of Value Analysis and Engineering, McGraw-Hill, New York, 1972.
Otto, K. and K. Wood. “A Reverse Engineering and Redesign Methodology for Product Evolution,” in Proceedings of the 1996 ASME DTM Conference, Irvine, CA, August, 1996.
Pahl, G. and W. Beitz, Engineering Design: A Systematic Approach, Springer Verlag, 1984.
Ronstadt, R. The Art of Case Analysis: A Guide to the Diagnosis of Business Situations, Lord Publishing, Inc., Natick, MA, 1988.
Shimomura, Y., et al. “Representation of Design Object Based on the Functional Evolution Process Model,” Proceedings of the ASME DTM Conference, Boston, MA, Sept. 1995.
SubfunctionCurrentSolution Principles
Opening
Open clipperSpin and flip
Determine rough or Long
Clip nailDetermine apply or release
Apply finger forceshaped top, bentbottom
shaped top andbottom
hand gripfinger holes
Convert to large forcepivotlinkageconcentrate itpliers
Stop motionteeth hitpeg
Release forcespring of bentbody
linear springcoil springleaf spring
File nailMove file into placepivot out filefile on armslide arm outflip out file
Slide over nail
Determine roughness
Return file in placepivot back file(file on top arm)
ClosingClose clipperFlip and spin
Hold shutspring of bent body
Fig. 11. Partial morphological matrix (subset)
for the finger nail clipper.
Compact
6 Bar
Current
Molded Scissor
One to One Fig. 12. Example concept variants (subset)
for the finger nail clipper design.

Transactions of the SDPS 3 (4), 61-74
14
Thornton, A. and D. Meeker. Benchmarking within the Product Development Process. Proceedings of the 1995 Design Technical Conferences, DE-Vol. 83, pp. 639-648, 1995.
Ullman, D., The Mechanical Design Process, McGraw-Hill, NY, 1992.
Ulrich, K. and S. Eppinger. Product Design and Development. McGraw-Hill, 1995.
Urban, G. and J. Hauser. Design and Marketing of New Products, 2nd ed. Prentice-Hall, Englewood Cliffs, NJ, 1993.

Transactions of the SDPS 3 (4), 61-74
1
Fig. 19. Current finger nail clipper products on the market.

Transactions of the SDPS 3 (4), 61-74
2
Remove Excess Length on Finger Nails
Finger Force, Kinetic (hand motion)
Finger nail Hands, DebrisLong nail, Hang Nail, Rough Nail
sound kinetic energy in nail
Cut nail, Hands, DebrisGood appearing nail
Energy Material Signal (information)
Fig. 9. Black box model of the finger nail clipper design task.