1998 high rd - systems of innovation, the swedish paradox
TRANSCRIPT
rournal of the Royal
um die Technologie Ifo-Institut filr
JVation', Econonzic
rcture: A Putty-Clay
survey', Journal of
1ngen, Effizienz und tatistik, vol. 208(4),
'fficiency for Siniilar !uropean University
iw of Econoniics and
t indicators?', in A. Measure111ent, Ne\v
for Microeco110111ics,
inefficiency', Rand
Verflechtung von 1tionalOko11011de und
11 Econo111ic Review,
ctivity advantages as 'Jf Urban Eco1101nics,
f Eco110111ic Change, l University Press. )ozialwissenschaften,
mbridge: Cambridge
conon1y and a theory',
it\es: possibilities and
=:ambridge University
ilogy, Industries, and
I
ri
6. High R&D intensity without high techproducts: a Swedish paradox?
Charles Edquist and Maureen McKelvey
INTRODUCTION
This chapter argues that a paradox is visible in the Swedish economy. The paradox
has to do with the fact that while, on the one hand, a high proportion of the Gross Domestic Product (GDP) is spent on formal research and development (R&D),
on the other hand, the Swedish economy produces only a below average
percentage ofR&D-intensive products relative to total manufacturing, compared
to the average for the OECD countries. There thus seem to be problems in translating R&D results into R&D-intensive products, having to do, we argue,
with specific Swedish factors at the firm and national levels.
Formal R&D is considered an indicator of input into knowledge creation and
technical development and is therefore seen to be an indicator of innovativeness. There are therefore important reasons why such a paradox is a problem for
Sweden and for other countries facing a similar situation. One reason is that both
the old growth account literature and the modern economics of innovation
identify knowledge and innovation as the main sources of productivity growth.
The relative level of knowledge and technology embodied in industrial products therefore matters for a country's economic gro\vth.
Although R&D can be used for many different types of low, medium and high
tech products as \vell as for more basic research, S,veden is an interesting case
because many have perceived it as a medium to high tech country. At least up
until the early 1990s, Sweden was generally perceived as a successful economy,
finding a successful, middle road of welfare capitalism. Moreover, Sweden has often been heralded as 'high tech' due to, for example, innovative ways of organizing 1nanufacturing, extensive use of advanced production machinery, and
a high percentage of GDP spent on R&D. In fact, research has shown that
Swedish industry does use advanced production technologies extensively, for example in the engineering industry, which accounts for about half of manufacturing (Edquist and Jacobsson 1988).
131
'!
,. I
Ii:
i ,.1
I
i' j
.. S'.' @5i'8it:.~·-:--,~°"·r:5!!s,,-§jg-"""'"""'""""""'"""'"""'"'·"',....,........, _ _ '"-'Jc i⁢g:;JIT ----

132 Innovation and technological develop,nent
Products are another matter. The specialized industrial structure of Sweden has been heavily based on 'refined' natural resources like paper and pulp, mining and engineering (Edquist and Lundvall, 1993). These are not high tech products, but Sweden has nevertheless had an aura of a medium to high tech country.
Sweden as a whole and particularly Swedish firms devote considerable resources to R&D. As a whole in the late 1980s, Sweden spent approximately 2.8 per cent of GDP on R&D, which is on par with the leaders such as Japan and the USA; many other small countries tend to invest a lower percentage (SINO, l 990a). Firms spend the majority (68 per cent) of this total R&D, Swedish industriaJR&D is clearly dominated by a few large, multinational firms.
In this chapter, we analyse the performance of the Swedish economy in relation to the OECD average for R&D-intensive production relative to manufacturing as a whole. The figures are presented in the Appendix along with those for the performance of Germany, Japan, the Netherlands and the United States. The cross-country comparisons for each R&D-intensive sector show the proportion ofR&D-intensive products in manufacturing compared to the OECD average. Our comments are, however, mainly restricted to explaining the apparent paradox in the Swedish economy.
This analysis is novel in two ways. Firstly, we specifically distinguish between use of high tech in production processes and its incorporation as R&D-intensive products. As argued below, the OECD definition of high tech products is used in order to enable international comparisons. Secondly, most comparative analyses of countries' competitive perfonnance, such as Michael Porter's (1990) work, analyse exports. We analyse production within the country rather than exports. This approach is based on theoretical work in the economics of technical change which argues that it is production and development of technologies which lead to significant long-term positive externalities such as cumulative development of knowledge. Export data only imperfectly reflect this.
THEORETICAL CONSIDERATIONS
The fact that countries specialize in production and then trade different goods and services comes as no surprise to economists. In fact, classical and neoclassical international trade theorists have long stressed that differences between countries in terms of relative prices, availability of resources (land, labour) and market structures explain countries' specialization. Countries produce different goods, whereupon they trade internationally those where they have an advantage. Ho\vever, in these theoretical constructions, particularly neoclassical theory, technology is an exogenous variable. 1 According to this logic, it makes no
I
1pn1e11t
;trial structure of Sweden ces like paper and pulp, ). These are not high tech >fa medium to high tech
ms devote considerableden spent approximatelyhe leaders such as Japanvest a lo\ver percentageent) of this total R&D.arge, mu1tinational finns.,e Swedish economy inproduction relative to
the Appendix along withherlands and the Unitedntensive sector show the: compared to the OECDicted to explaining the
pecifically distinguishrtd its incorporation asdefinition of high tech
trisons. Secondly, mostnance, such as Michaelproduction within thetheoretical work in theit is production andint long-term positiveedge. Export data only
I trade different goods tssical and neoclassical 1ces bet\veen countries d, labour) and market ,duce different goods, t have an advantage.
t neoclassical theory, is logic, it makes no
High R&D intensity without high tech products 133
difference whether a country is specialized in low, medium or high tech goods, as long as they participate in international trade. Everyone benefits anyway.
In contrast, contemporary research on the economics of technical change starts from different assumptions and comes to different conclusions. Based on evolutionary economic theory, firms are assumed to differ in their knowledge about, and use of, various resources including knowledge and technology.2 Firms are seen to have varying capabilities to develop, monitor and use technology and knowledge. They do not know which techniques are most efficient. Instead, they must invest in search, R&D or innovation processes to discover \Vhich
technical alternatives are (potentially) possible in order to develop and choose among alternatives.
In the economics of technical change tradition, technology is endogenously generated within the economy rather than an external factor. Firms are the ones \Vho often develop technologies of relevance for economic activities, sometimes
in interactions \vith other organizations such as universities. The development
and diffusion of technology is often local, tacit and cumulative within individuals, firms and countries (Dosi, 1988).
These assumptions about technology and knowledge in the economics of technical change have significant implications for analysing patterns of national production specialization and for linking high tech to economic growth and to productivity growth. Firms, and hence countries, have differing abilities to find and translate technology and knowledge into economic innovations, in the sense of ne\v or improved products and production processes. In particular, Dosi,
Pavitt and Soete (1990) conclude that whether ornot firms in a specific country \Vil1 be able to innovate, and in \Vhich industrial sectors, depends on initial
conditions in firms, the organization of markets, and technological capabilities as wen as on institutions affecting actors' capabilities and decisions about
these conditions. Related research on 'national systems of innovation' has
similarly indicated significant differences among countries in tenns of ability to innovate and in tenns of institutions and organizations. 3
Because the economics of technical change perspective emphasizes a dynantic vie\v of the economy, technical change is assumed to modify the economic
playing rules by creating more efficient processes and 1nore attractive products. Innovation, rather than price differences, is central. Therefore, if a country is
specialized in technologies/sectors ,vith higher opportunities to innovate, its
longer-tern1 economic prospects are better than those of countries specialized
in less innovative sectors. It 1natters ,vhether a country produces bulk goods
competing on price or specialized products competing on quality, uniqueness
or other qualities which enable temporary monopoly rents. In the latter case, countries have a better probability of achieving productivity growth and hence economic gro\vth.

134 Innovation and technological deveWpHtellt
Although the specialization of production is only one of many factors influencing labour productivity, we argue that the relative percentage ofR&Dintensive goods in industrial production can be linked to productivity gro\vth. 'The reason is that labour productivity is an indicator, ,vhich measure.'> efficiency of the manufacturiug process in price terms. Productivity and productivity growth indicate a ratio between value added (or sales) and employees (or number of hours \Vorked}. Thus, productivity can increase because the production process has become technically more efficient (and re<juires less labour) and/or because an hnproved/ne\V final product can be sold at a higher price.
There are two theoretical reasons us to why these propositions about a relationship between productivity and R&D-intensive goods are important when analysing Sweden's (or other countries') production specialization.
The first is that if technological competence and capability do build cumulatively in .an econo1ny in interactions between firms and organizations1
then a country which is relatively low tech will tend to slay so, and vice versa. Countries will tend to develop along specific 'trnjectories' or paths of industrial specialization and Lechnological competencie.s.
Secondly, if production of high tech products tends to create more positive externalities in an economy cornpared to Jo,v tech products} then countries speciali,w in high tech will tend to be in a beuer posilion to capture future returns arising from the dynamic creation of resources and rents (Tyson, 1992). In contrast, countries which lose a high tech specialization of production should be. ,vorried about the future economic heulth of their economy. Our analysis of the apparent S,vedish paradox is based on these theoretical argu1nents..
CONCEPTUAL SPECIFICATIONS
Analysis of the !eve! of R&D-intensive goods in Sweden and other countries requires international comparisons. A first question, ihen, is ,vhat constitutes an R&D-intensive good and industrial sector? It has already been argued that industrial R&D indicates the amount of resources devoted to technological innovation. R&D expenditures are resources spent on formal search activities. Other types of learning such as interactive learning \Vithin and bet\veen firms and development of tacit knowledge are usually not included in such figures. R&D expenditures have therefore been criticized as an inadequate measure of innovation, They are, however, still a useful measure partly because R&D expenditures do indicate intent to innovate and partly because international, comparative statistics are availab1e.
Our study discusses the R&D intensity of industrial sectors. In turn, R&D intensity is often taken as an indicator of 'high, medium and low technology'. In a Iirst classification, the OECD defined high tech industries as those which

High R&D inter.siry without ltfgh tech producJs 135
on average spend 4 per cent or more of sales value on R&D. Those industries which spend between I per eent and 4 per cent are medium tech and those spending less than 1 per cent are low tech.4 This classification is used here.
The OECD criteria can then be used lo identify industrial seclors as use.I in statistical databases. ThdSIC (International Standard Industrial Classification) system uses three-digit numbers to denote broad industrial sectors. These throodigit categories in torn consist of several four-digit industrial product groups. According IO the OECD's criteria, the following sectors/product groups were high tech in the ISIC, revision 2:
ISIC 3522 ISIC 3825 ISIC 383 ISIC3845 ISIC385
Drugs and Medicine Office Machinery and Computers Electrical Machinery and Components5
Aerospace Technofogical Goods (Scientific Instruments)
These !SIC categories constitute the industries defi11ed as R&D·intensive (high te,eh) in this chapter.
The OECD definition categorizes industries which can be seen to be. on average, high, medium or low tech across the elcv"n largest OECD economies. The purpose of taking an international average is that the categories can then be used to inake comparisons among countries. Here ,ve use these international categories to compare individual countries, especially Sweden, to the OECD average. Ho,vever, because the categories are internationally determined, the percentage spent on R&D in each sector may or may not hold for each im:lividuul country. Thus. inlernational comparisons can be made using the OECD c]nssification, but individual deviations ~ in this case for Svreden - should he pointed out. 6
These five i11dustrial sectors thus consist of groups of products. As mentioned, \Ye have made a conceptual distinction between technology used as process technology and the products which the industrial sector manufactures. Product teetmologics means wh<d is produced and sold. Process technologies are used !u make goods and services. It is a question of how things are manufocmred, Only product technologies are analysed here.?
The importnnee of producing improved or new product., goes beyond the price" competition of equilibrium analysis. In a situation of dynamic Schumpeterian compedtion, the inno-vntlng firm ca.n capture temporary 1nonopoly rents for ne\V and improved product~. This gives firn1s incentives to Innovate. In a dynamic sector- and hence in a dynamk economy- new !lnd improved products are 1nore important as a n1enns of competition than price reductions (resulting1 for el<llmple, from improved process technologies).

136 Innovation and technological develop1ne11t
However, used alone, R&D expenditures say nothing about the efficacy ofthe innovation process nor about the level of technology used in production. Forexample, Pavitt has shown that in some capital-intensive, large-scale industriessuch as paper and pulp, where the process technology is advanced, the processtechnology is developed by upstream machine producers because they arebetter able to capture the economic benefits than the paper mills (Pavitt, 1984).Assuming that the paper and pulp industry does not invest much in R&D todevelop their final products, the products sold by the machine producers wouldbe more R&D-intensive than the products sold by the paper and pulp industry.In this example, the machinery is defined as a product technology whendesigned and sold by machinery makers, but it is a process technology whenused by paper and pulp manufacturers.Finally, we would like to point out that our analysis of the relative level oftechnology in products is preliminary. We have taken R&D intensity as aproxy for innovative effort, even though technology is also developed in otherways. We have taken R&D-intensive industries as a proxy for high techproducts, even though there are discrepancies bet\veen products and industrialsectors; there are high tech products in lo\v tech sectors and vice versa.Nevertheless, \Ve have presented arguments as to \Vhy these are reasonableindicators.
THE SWEDISH CASE IN AN INTERNATIONAL
COMPARISON
Trends in the R&D-intensive industrial sectors in Sweden during the past twenty years are here compared with the OECD average and with four other countries, namely Germany, Japan, the Netherlands and the United States. These comparisons can be found in the Appendix, which includes six figures. Figure 6.1 compares the Swedish share of R&D-intensive goods in production and in exports relative to the OECD average. Figures 6.2 to 6.6 illustrate developments in the five countries for each R&D-intensive sector Hsted above.
The Appendix to this chapter also contains a description of the STAN database - which is the source of the figures - and the equation used. Our
comments will be restricted to Sweden but the reader should particularly note developments in Japan which has increased its specialization in the high tech product groups.
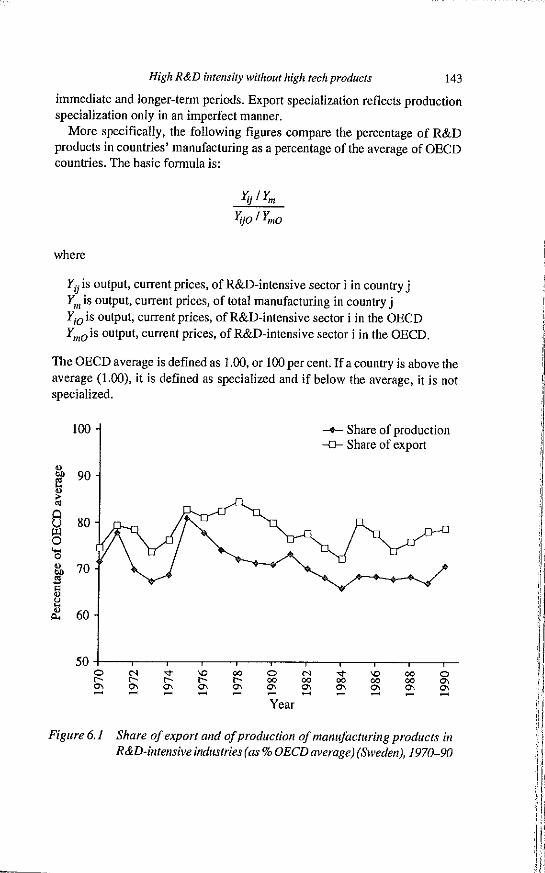
Figure 6.1 shows the Swedish share of exports and production of R&Dintensive products in manufacturing as a percentage of the OECD average from 1970 to 1990. The percentage ofR&D-intensive goods in Swedish exports
rose from the early 1970s to 1978, thereafter decreased, and then rose again at
th
Sf e, in in at s,
in b,
a, tn 0 0 s,
m T, di w
m th (I
Sf er fu in
Sf in th st, di
ec ac re pr
pr m

High R&D intensity \Vithout high tech products 137
the end of the 1980s. Figure 6.1 also gives information about the relative specialization of S,veden in production of R&D-intensive sectors. Whereas exports showed an increase for several years at the end of the 1980s, the increase in relative production was minor. At the aggregate level of all R&Dintensive goods as a percentage of manufacturing, the Swedish percentage was al 71 per cent in 1990 (see Figure 6.1). In that this is well below 100 per cent, S,veden is not specialized in production of high tech products, relative to other industrialized countries. In fact, the general trend is that Swedish industry has become decreasingly specialized since 1975.
Figures 6.2 to 6.6 show each country's production as a percentage of the OECD average in the various R&D-intensive sectors. From the mid 1970s, the Swedish trend has been negative for three of the five R&D industrial sectors, namely, Office Machinery and Computers (ISIC 3825), Electrical Machinery and Components (ISIC 383), and Aerospace (ISIC 3845).8 For these three sectors, Sweden was above,just at or just below the OECD average during the early to mid 1970s but subsequently became less specialized. Sweden's share of Technological Goods (ISIC 385) has been around 50 to 70 per cent of the average during the period but ended in a positive direction. By the early 1990s, Sweden was thus not specialized in any of these four high tech sectors.
There is, however, one exception to this generally negative Swedish trend, namely Drugs and Medicine (ISIC 3522). Sweden has gone from well below the OECD average in 1970 (44 per cent) up to and above the OECD average (I 04 per cent) in 1990 and has thus become specialized. This new area of specialization differs significantly froin S,veden's previous specialization in the engineering and paper and pulp industries. A very interesting question demanding further research is therefore ,vhy and how S,veden has 1nanaged to specialize in Drugs and Medicine during this period.
In the other R&D-intensive industries ,vhich lie nearer Sweden's traditional specialization, Sweden has increasingly been left behind, relative to other industrialized countries. The en1pirical material presented in the Appendix thus indicates that despite large investments in R&D, the Swedish industrial structure has not been successfully (re)oriented towards R&D-intensive sectors during the past twenty years.
In order to argue that S,veden's relatively Io,v and decreasing proportion of R&D-intensive goods in production, compared to the OECD average, affects economic gro,vth and productivity gro,vth, it is necessary to present some additional data. This data should preliminarily indicate whether or not a relationship between growth and productivity on one hand and R&D-intensive products on the other can be identified.9
One indicator of dynamic competition is ,vhether the markets for high tech products have been gro,ving equally as fast, faster or slower than for 1nanufacturing as a ,vhole. If the markets are gro,ving faster, then this indicates

138 Innovation and technological developn1ent
that firms which successfully compete in these markets can expand production, thereby potentially stimulating growth and employment. For the period 1974-88 both in Sweden and in the OECD as a whole, market growth for each of the five R&D-intensive products was greater than for manufacturing as a whole.10 In fact, the market which grew the fastest, Office Machinery and Computers (ISIC 3825), was the industrial sector in which Sweden most dramatically lost its position (see Figure 6.3). Japan dramatically increased its specialization in this sector from the early 1980s. A growing market indicates new market opportunities, which seem to be related to technical opportunities.
A study done by the Swedish Industrial Board (SIND, 1990b) about the dynamism of high tech firms corresponds to expectations that dynamic competition and growing markets rely on firms performing R&D.1 1 SIND classified Swedish firms as high, medium and low tech based on R&D intensity. Although there are some exceptions, the SIND study generally indicates that large investments in R&D by firms led to a (much larger) growth in volume of production, as measured by increase in value added. This relationship bet\veen R&D and growth in value added is explainable if one assumes that R&D leads to new or modified products, for which market growth is rapid and which command a higher price in a situation of dynamic competition. Similar relationships held for the relationship between R&D and (absolute) productivity in the SIND study.
The relationship between R&D and productivity growth which showed up at the individual firm level in Sweden is generally supported at the industrial sector level for 1974-88. In a previous paper, we showed that in general in S,veden, productivity gro,vth in R&D-intensive sectors ,vas higher than for manufacturing as a whole (Edquist and McKelvey 1992, Chapter 4). 12 This was the general trend, although there ,vere some exceptions.
S,veden seems to get, however, a decent return from its R&D investments, as indicated by so1ne output measures. For example, Pavitt and Patel indicate that the number of patents per capita that Sweden takes in the USA is on par with those large countries which are innovation leaders (Pavitt and Patel, 1988; Edquist and McKelvey, 1992). 13 Sweden also has a positive technology trade balance, a figure \Vhich includes expenditures for patents, licenses, royalties, and know-how. In 1987, Sweden had a net positive balance of 562 million SEK and in 1989, a net positive balance of 821 million SEK (SCB, 1991). These sketchy output measures thus indicate that R&D investments in Sweden do lead to novelties valuable in that they can be protected as patents and/or sold as knowledge, know-how, etc. Of the R&D which is performed in Sweden, Swedish firms do seem to reap benefits, as indicated by innovation indicators. They do not, however, seem to have translated that knowledge into R&Dintensive products.
High R&D fntensity wlthout high tech prod11cts 139
The question remains, to what extent is the Swedish phenomenon a paradox? Should we have expected that a high intensity of R&D results leads to the production of R&D-intensive products? It is a paradox ifR&D is token straight off the bat as an indication of innovativeness. The paradox may, however, be mostly apparent. In particular, R&D is an input measure of intent to innovate; an atlempt to create something new. It says nothing about how efficiently those resources are used in the R&D process nor about whether the knowledge and technologies being developed are likely to be attractive on a market. We may be dealing with an apparent paradox, caused by an over-reliance on R&D indicators in the economics of technical change Lradition.
There are two sides of the paradox, the high R&D intensity and the low specialization in R&D-intensivc products. Specialization has already been discussed at length and we will return to it in our concluding remarks. Let us therefore focus on some characteristics of the former side. Part of the paradox may be explained by the orientation and efficiency of lhe R&D performed within Sweden. Firstly, one might imagine that the high percentage of GDP spent on R&D reflects government spending on basic research. However, this hypothesis does not hold, as finns perform 68 per cent of the gross expenditures on R&D (OECD, 1993). Of the total industrial R&D, the majority goes to product innovations.
Another reason may be the relatively high R&D intensity of Swedish industrial sectors which are internationally considered medium tech industries. Two sectors in _particular seem to pass the criterion. The medium tech sector Engineering (!SIC 382) minus the high tech sector Office Machinery and ('-<imputcrs (!SIC 3825) spent 5.8 per cent of sales on R&D in 1987 and 4.1 per cent in 1991. Transport Equipment (!SIC 384) also spent significant amounts on R&D. This category includes both aerospace (high tech) and automobiles (mwium tech). Swwish industrial statistics do not provide separate R&D statistics for the aerospace and automobile industries, but the broader Transport Equipment (ISIC 384) spent 6 per cent of sales on R&D in 1987.14 Because of the finns' mix of products, it is thus not clew: whether the Swedish automobile industry alone without aerospace - would be high or medium tech, although another analysis of Sweden (NUTEK, 1995, p. 28) has placed automobiles as high tech. Even very low tech sectors like Paper and Pulp Products may spend relatively more io Sweden on R&D as a percentage of sales than the OECD average.
A third reason for the high R&D intensity has to do with the Swedish structure of production. Both production and R&D expenditures are heavily dominated by large, multinational firms. Between ten and fifteen linns account for over 50 per cent of industrial R&D, and finn, with more limn 1000 employees account for almost 80 per cent of the total industrial R&D.
140 Innovation and teclu1ologlcal developntent
Swedish firms have tended to keep a large percentage of their total R&D -up to 70,80 per cent - within Sweden while placing productirm abroad. In other words, if their R&D investments were spread out over the world production activities of these Swedish multinational limis, then their R&D intensity would oo lower. The level ofR&D in Sweden may thus reflect the Swedish economy's reliance on forge engineering firms placing production abroad - rather than on Sweden's unusually high innovative oppormnities in medium tech sectors. Firms huve thus. in some sense, made Sweden a knowledge producer without domestically translating that knowledge into economic value. However, these large lions have recently increasingly moved R&D abroad, thereby opening the possibility of a dianging situation in U,e future (Cantwell, 1994; Hakanson and Nobel, 1993). This is reflected in the fuel tha, 1987 was a peak for investment in industrialR&D as n vercenlllge of sales in Sweden, after which it has dropped.
Although these various factors explain part of the apparent Swedish paradox of high R&D intensity without high tech products, it is still troubling that Sweden has mostly either remained de-specialized or lost specialization in the high tech products during the past twenty years. Thero seem to be particular Svredish circun1,1stunces ,vhich1 by contributing to the problem, create a po1iticai/econon1ic situation in \'\'hich this paradox could arise.
CONCLUDING REMARKS
The apparent paradox of high R&D intensity without specialization in R&Dintensivo products in Sweden is a phenomenon requiring additional explanation and discussion. The reasons why Sweden has bocome incteasingly dc-sp,xiali,ed in production of R&D·intensi ve pro<iucts, with the notable exception of Drugs and Medicine, include both firm-specific •nd national contextunl focto1s, such as political nnd iustltuttonnl foctors.
As rnentionod, both Sweden's production structure and Sweden's industtial R&D infrnstrucrnre nre heavily dominated by large lirnls. These firms account for the majority of industrial R&D, and their dedsions to invest, or not invest, in new products and sr.ctors strongly affeet the Swedish industrial structure. Small Swedish firms have not been able to exploit R&D-lntensive products and grow mp idly into !urger !inns to an extent similar to that Ju the USA. Nor have large firms diversified as in Japnn. 15 Although there are some notnble exceptions, it seems Iha, these existing, large Swedish firms stick dose to existing products when innovating and producing.
According to David Teece (1988), this is rational behaviour because a finn's 'core business' is mutually dependent on its kno,vledge base. Deco.use of tho cumulative knowledge base and firms' existing complementary assets, such as marketing, those new products which firms choose to take to market will tend
High R&D intensity lvithout high tech products 141
to be close to their previously successful products. If, due to national contextual factors, Swedish finns continue to be profitable by producing old prodncts, then this results in a lack of structural change, which is in turn a partial explanation of why Sweden is below the OECD average in high tech products.
According to these ideas about firm behaviour, we should expect that Sweden as a whole should remain specialized in its traditional pattern of industrial production. As that speciali1.ation has tended to be fairly medium to low tech -paper and pulp, steel, mechanical engineering, etc. -it is not so surprising that Sweden is not currently specialized in high tech products. There are, however, reasons to be concerned about developments in Sweden, particularly since relative high tech specialization has decreased.
To understand why Swedish firms particularly lack incentives to change, national contextual factors which support and/or hinder innovation in Sweden must be included in our onalysis. A full analysis of the various factors constituting the Swedish system of innovation cannot he presented here, but it is clear that the Swedish state has played a key - if unfortunate role in reducing finns' incentives lo innovute during the 20,year period studied here,
In particular, the Swedish state gave substontial economic support to ailing mature industries during the 1970s and early 1980s and devalued the Swedish crown several times from !976 to 1982. Devaluations enabled existing finns to make substantial profits from mature pmduclS, In addition, financial speculation became common due to deregulated financial markets in the 1980s. These factors reduced the incentives to innovate. This seemed to keep the Swedish economy rolling for a while, but Sweden currently has very serious industrial structural, unemployment and government budget problems. This indicates that government policies ,vhich ,verc intended to be im1nediatc 1 apparent solutions turned out to help cause 1onger-tenu problems. The missing pressures, in Si.veden to innovate and to rene,v tlie industrial structure are therefore a partial explanation for the Swedish ailment
The lack of incentives to exploit product innovations, which would have led to structural change) has contributed to the current econon1ic crisis 1 ,vhich became apparent by 1991. Sweden shifted rapidly from being a model economy successfully balancing market pressures and supporting" welfare state to just another exumple of a national economy with deep problems. The Swedish crisis has included a rate of official unemployment(B-12 per cent) not seen since the Great Depression;" decrease in industrial output and industrial employment of about 20 per cent from 1989 to 1993; and a yearly government budget deficit at about 13 per cent of GDP.
Another depreciation of the Swedish crown has also occurred. Although the Swedish government and the Central Bank tried very hard in 1992 to defend the currency, the economic crisis and financial speculation forced thetn to abandon the fixed exchange rate. The flouting crown promptly sunk, with a depreciation
!42 lnnovation and tecltnological develop,nent
of about 20-25 per cent against the currencies of the major industrial countries. Depreciation has once again enabled a surge in exports and in profits of those large Swedish firms involved in exports, particularly oflrnditional products like paper and pulp.
This made traditional Swedish goods relatively less expensive abroad, and sales are not due io Jargcr increases in efficiency and productivity relative to competing countries. Thus, the:: apparently positive trends of export growth and sky-rocketing profits in Sweden in 1994-95 are primarily based on the depreciation. Indeed, a major part of the rising capital investments in 1994 and 1995 have been going to traditional sectors like steel and forest-base<l industries. It has simply become more profitable to export the same old products, produced in the same old way. Once again, Sweden seems lo be making another loop in the vicious circle of short-term so]utions and short-term surges \Vhich aggravate the longer-term, structural problems.
Tho Swedish phenomena analysed here ure interesting because, as we have argued) soine technologies/sectors allow more opportunities to innovate than others. Innovations seem to be a vita)t if partia1, cause of productivity growth and economic gro\vth. Therefore, from a perspective of the economics of technical change, a dynamic econo1ny requires continuous reconstitution of products, finns and industries. If 11 country is specialized over time in sectors ,vith high innovative opportunities, then il.'i longer-teml economic prospects are better than those of countries specialized in less innovative sectors. An econon1y ,vhich docs not change faUs behind. This is the basic renson ,vhy it matters in \vhich industrin1 sectors countries arc specialized.
APPENDIX
This chapter makes an international comparison of R&D-intensive manufacturing sectors from the early 1970s to the early 1990s. The comparison is between individual countries- Sweden in particular- and the OECD average. Such an analysis. requires long-tenn 1 internationally compatible statistics. We therefore decided to use the OECD STAN (STructural ANalysis for industrial statistics) database. In ST AN, data from the older OECD COMT AP (Compatible Trade and Production) database and other sources hos been converted and estimated to be comparable across time and countries. We used the 1994 version. t6
Ourcalcu)ations are based on production in countries. In coalrast1 it is most common to use some index of export specialization to analyse countries' production specialization (Dalum, 1992; Porter, 1990). The most common one is the Basalla index. This chapter instead analyses the production structure, using a similar index. Our argument is that production offers the best indicator of potential positive externalities involved in developing con1mercia1ly relevant hxhno1ogies. ActuRl production ensures more ppsitive externalities, both in the
High R&D intensity without high tech products 143
immediate and longer-term periods. Export specialization reflects production specialization only in an imperfect manner.
More specifically, the following figures compare the percentage of R&D products in countries' manufacturing as a percentage of the average ofOECD countries. The basic formula is:
where
Yu I ym
Y;Jo I Y,no
Y iJ is output, current prices, of R&D-intensive sector i in country j Y,n is output, current prices, of total manufacturing in country j Yio is output, current prices, of R&D-intensive sector i in the OECD Y,110 is output, current prices, of R&D-intensive sector i in the OECD.
The OECD average is defined as I .00, or 100 per cent. If a country is above the average (1.00), it is defined as specialized and if below the average, it is not specialized.
JOO --+- Share of production -0- Share of export
'cl " 70
f - 60
50 0 N st "' 00 0 N st "' 00 0
" " " " " 00 00 00 00 00 "' "' ~ "' "' "' ~ "' "' ~ "' ~ - - - - - - -Year
Figure 6.1 Share of e,port and of production of manufacturing products in R&D-illtensive industries (as% OECD average) (Sweden), 1970-90
:i
ii '
:1
:i1·· ,I ::

144
140 Innovation and technological deve!opnzent
& 120
~ 100 "' 0 u [§ 80 ..... 0 <U
?f 60
ll 40 B ~
20
-Sweden --0- Gennany ----0--- Japan ------ Netherlands
0 --+-- United States 0 f:! t--
"' "' - 'D !,; 0
00
"' - 'D 00
"' 00 00
"' g "' Year
Figure 6.2 Share of !SIC 3522 (Drugs and Medicine) of manufacturi11g production i11jive countries (as% OECD average), 1970-90
180
160
60
40
20
0 g "' -
-Sweden --0- Gennany ----0--- Japan ------ Netherlands ---+- United States
f:! " 'D t-- t--"' "' "' - - - 00 0
00 0 N " 'D t-- 00 00 00 00 00 "' "' "' "' "' "' "' "' - -Year
Figure 6.3 Share of /SIC 3825 (Office Machine,y a11d Computers) of manufacturing production in jive coumlies (as% OECD average), 1970-90
Figur1
25(
:',, 20(
i ; 150
.... 0
j 100
~ ~ 50
0
Figure 6

nent
-Sweden ---o-- Gennany --o--- Japan ........ Netherlands -+- United States
<X) <X)
°' ,e) of manufacturing 1verage), 1970-90
-----------------
~ .......
'O <X)
°' <X) <X)
°'
111zputers) of 1nanu-1Javerage), 1970--90
160
140 g, ~ 120 1; 0 100
O&l
80 'ti g, 60 £l " 1 40
20
High R&D intensity lVithout high tech products 145
-Sweden ---0-- Gennany --0- Japan ........ Netherlands -+- United States
o+--,-~.----,-~.----,-~---.------.~---.------.~::--~ ~ ~ ~ ~ ~ ~ :::: ~ - - -
Figure 6.4
250
f 200
; 150
"""' 0
5' 100
j 50
0 0 r--
°' -Figure 6.5
Year
Share of /SIC 383 (Electrical Machine,y and Components) of manufacturing production infivecountries( as% OECDaverage), 1970--90
-Sweden ---o-- Germany --0- Japan
N ... 'O <X) 0 N r-- r-- r-- r-- <X) <X)
°' °' °' ~ °' °' - - - - -Year
... <X)
~
........ Netherlands -+- United States
'O <X) 0 <X) <X) °' °' °' °' - - -
Share of /SIC 3845 (Aerospace) ofmamifacturing production in five countries (as% OECD average}, 1970-90

146
200
180
~ 160
" ~ 140
>1l08 120
100 '$ " ff 80
J 60
40
20
0 0 r--
°' -
Innovation and technological develop,nent
-Sweden ---11---- Netherlands -a-Germany ---+-- United States ---<>---- Japan
-----------------------------------------------------
N "" r-- r--
°' °' - 0 00
°' -
D
Year
"" 00
°' 00 00
°' Figure 6.6 Share of !SIC 385 (Technological Goods) of manufacturing
production in five countries (as% OECD average), 1970-90
NOTES
Frnn~is Texier has given valuable help in updating lhe analysis and figures. \Ve also received valuable comments at the EAEPE conference in Copenhagen in 1994. The data has not been revised since the original book submission in 1995. \Ve would therefore like to point out that Sweden has increased production in teleconununications, which may affect the sector Electrical 11achinery and Computers positively,
I. The new trade theories and the new growth theories also increasiugly take technology into account. They have been criticized, however, for retaining an oversimplified view of technology and for sticking too closely to the general equilibriu,n analysis fron1 which they were mutated (Dosi, Pavitt and Socte, 1990).
2. Nelson and \Vinter (1982) is the sentinal work in this field. 3. Two influential books have recently been published on national systems of innovation,
namely Lundva1l (ed.) 1992 and Nclsou (ed.) 1993. Edquist (1993) outlines various approaches to systems of innovation, including national, sectoral and regional ones. McKelvey ( 199 J, 1994) critically analyses several approaches, whereas 1'.fcKelvcy (1993) analyses Japan in terms of institutions supporting innovative activities.
4. In 1994, the categories were revised nnd changed to four categories - high, mediun1-high, medium-low and low tech sectors (OECD, 1994, p. 231). In this clac;sification, the high tech sectors only include those with more than 10 per cent of R&D expenditures/production.
5. ISIC 383 can be divided into three high tech product groups at the four-digit numbers ISIC 3831 (Electrical Industrial Machinery), ISIC 3832 (Radio, TV and Conununication &}uip1nenl), and JSIC 3839 (Electrical Apparatus) and one lower tech product group ISIC 3833 (Household Appliances).
l'.
1:
J,
1(
R
A
B

1/
·--------------
00 00 ~
J/ n1anufacturing rige), !970-90
: also received valuable 10t been revised since out that Sweden has ~trical Machinery and
take technology into :d view of technology :h they were mutated
terns of innovation, s yarious approaches K'elvey(l99I, 1994) ,es Japan in terms of
~igh, medium-high, :ation, the high tech ires/production. digit numbers ISIC ication F.quipment), C 3833 (Household
High R&D intensity without high tech products 147
6. In Sweden between 1981 and 1991, the first four R&D-intensive industries listed above spent more than 4 per cent of sales value on R&D, as expected from the OECD definition of high let::~· In the fifth sector, Technologial Goods, the main product is Scientific Instruments. During the 1970s and 1980s, the Swedish scientific instrument industry spent more than 4 per cent, but declined to 2.7 per cent in 1989 and further declined to 1.9 per cent in 1991. Thus during the twenty years analysed here, Scientific Instruments has fallen below the 4 per cent cut-off. (Based on SCB, 1983, 1985, 1989, 1991 and 1993.)
7. The n1aking of new or improved products may or may not be closely dependent on process technology. The degree of dependence between product and process technologies can vary runong different products and industrial branches.
8. For Electrical Machinery and Computers one explanation for the decline is that Swe<len was specialized in electro-mechanical products in the 1970s but did not manage to make the transition to electronic products. Note, moreover, that Figure 6,5 indicates that the United States is extensively specialized in Aerospace, relative to the OECD average. This skews the distribution for the other countries.
9. Research on the relations between R&D and productivity includes nu1nerous contributions, of which two notable ones include Bailey and Gordon (1988) and Nelson (1981).
10. See Edquist and McKelvey, 1992, Chapter 4. In that work, Table 17 shows that in both current and constant prices, all .five of the R&D-intensive sectors had faster market growth in Sweden than for manufacturing as a whole. Table 18 shows that the annual growth rate in total OECD imports, current prices, was also higher for R&D-intensive goods than for manufacturing as a whole.
11. See also Edquist and McKelvey, 1992, Figure 3.14 and pp. 67-9. SINO uses the same classification as the rest of this chapter, but they classified.firms as high to low tech whereas this chapter discusses industrial sectors as high to low tech.
12. Based on Swedish industrial statistics, we calculated productivity growth in Sweden for nl8Ilufacturing as a whole and for each of the five R&D-intensive sectors for the periods 1974-80 and 1980---88. \Ve calculated productivity in four ways: as sales value divided by number of employees (Tables 20 and 22) and as value added divided by number of employees (Tables 21 and 22). \Ve calculated them in both current and constant prices. \Ve would like to point out that the category 'manufacturing as a whole' includes the R&D-intensive sectors.
13. American patents can be considered an indicator of various counlries' contribution to the global pool of knowledge.
14. According to the 1987 annual report, the Volvo group as a whole spent 5 per cent of sales on R&D and the Saab group spent 7.3 per cent ofinvoicing on R&D. However, both industry groups include products in the higher and medium tech segnlCnts of the transport industry. The Volvo group included automobiles, trucks, buses, motors for marine and industry, aircraft engines, food products and other. Saab included automobiles, trucks, buses, aerospace, advanced materials, autonmtion and military and control engineering, Neither the firms' annual reports nor official statistics specify how R&D expenditures are dislributed among product groups.
15. Analysis of USA based on Mowery and Rosenberg (1993) and of Japan on Goto and Odagiri (1993).
16. OECD, DSTI (STAN/Jndustrial) 1994. The countries included as the OECD average in STAN are Australia, Belgium, Canada, Denmark, Finland, France, Germany, Italy, Japan, Netherlands, Nonvay, Sweden, the United Kingdom and the United States.
REFERENCES
Archibugi, D. and M. Pianta (1992), The Technological Specialization of Advanced Countries, Kluwer.
Bailey, M. and R. Gordon (1988), 'The productivity s!o,vdown, ,neasurement issues, and the e:<plosion of computing power', The Brooking Papers on Eco110111ic Activity, XIX:2, pp. 347-420.
148 Innovation and technological develop111ent
Cantwell, 1. (1994), 'Introduction: transnational corporations and innovatory activities', in J. Cant\veU (ed.), Transnational Co,porations and Innovatory Activities, Routledge.
Dalum, B. (1992), 'Export specialisation, structural competitiveness and national systems of innovation', in Lundvall, B.-A. (ed.).
Dosi, G. (1988), 'Sources.procedures and microeconomic effects of innovation', Jou111al of Econo1nic Literature, XXVI(3) (September).
Dosi, G., K. PavHt and L. Soete (1990), The Econondcs of Technical Change and International Trade, Harvester Wheatsheaf.
Edquist, C. (1993), 'Systems of innovation - a conceptual discussion and a research agenda', paper presented at \vorkshop 'Globalization versus National or Local Systems of Innovation', organized by theEUNETIC Network at BETA in Strasbourg, March I 1-12.
Edquist, C. and S. Jacobsson (1988), Flexible Autonzation: The Global Diffusion of Nett' Technology in the Engineering ltzdust,y, Basil Blackwell.
Edquist, C. and B.-A. LundvaJI (1993), 'Comparing the Danish and S\',redish systems of innovation', in R. Nelson (ed.), National Systenzs of /1111ovation, Oxford University Press.
E<lquist, C. and M. McKelvey (1992), 'The Diffusion of New Product Technologies and Productivity Growth in Swedish Industry', Consortium on Competitiveness and Cooperation (CCC), CCC Working Paperno. 19-15, Berkeley, Cal.: UC, Center for Research in Management. Originally published in S\vedish in SOU 1991:82.
Goto, A. and Odagiri,H. (1993), 'The Japanese system of innovation: past, present, r1nd future', in R. Nelson (ed.), National Systen1s of Innovation, Oxford University Press.
Hdkanson, L, r1nd R. Nobel (1993), 'Foreign research r1nd development in Swedish multinationals', Research Policy, 22, 373-96.
IngenjOrsvetenskapsru(r1de1nien (JVA) (1989), Forslazing och Utveckling i Utlandet: En Studie av Svensk Multinationella Fb'retag IVA PM 1989:I, Stockholm: IVA.
Lundvall, B.-A. (ed.) (1992), National Syste,ns of Innovation: Tolvards a Theory of Innovation and Interactive Learning, Pinter.
McKelvey, M. (1991), 'Ho,v do national systems of innovation differ? A critical analysis of Porter, Freeman, Lundvall and Nelson', in G. Hodgson, and E. Screpanti (eds), Rethinking Eco1101nics: Markets, Technology and Econoniic Evolution, Edward Elgar.
McKelvey, M. (1993), 'Japanese institutions supporting innovation', in S.-E. SjOstrand (ed.), Institutional Develop,nent and Change: 771eoJ)' and E111pi1ical Findings, Sharpe.
McKelvey, M. (1994), 'National systems of innovation', in M. Tool, \V. Samuels and G. Hodgson (eds), Handbook of Evolutionary and Institutional Econo111ics, E<hvard Elgar.
Mowery, D. and N. Rosenberg (1993), 'The US national system of innovation', in R. Nelson (ed.), National Syste,ns of Innovation, Oxford University Press.
Nelson, R, (1981), 'Research on productivity growth and productivity differences: dead ends and new departures', Joun1al of Econonzic Literature, vol. XIX (Septe1nber), pp. !029--64.
Nelson, R. (ed.) (1993), National Syste111s of Innovation, Oxford University Press. Nelson, R. and S. \Vinter (1982), An Evolutionary Theory of Econo11/lc Change, The
Belknap Press of Harvard University Press. Norgren, L. (1989), KzinskapsOve,joring Jr&n universitet till feretag: En studie av
forskningens betydelse /Or de svenska ltike111edelsflretagens produkt/ansering 1945-/984, PhD thesis, Allmanna Forlaget.
NUTEK (1995), 'Svenskt naringslivs teknologiska specialisering' Bilaga 1 l tiJl Ldngtidsutredningen 1995. Finansdeparten1entet.
ent
od innovatory activities', Jty Activities, Routledge. 1ess and national systems
! of innovation', Jounzal
Technical Change and
cussion and a research sus National or Local at BET A in Strasbourg,
!/obal Diffusion of New
and Sv1edish systems ion, Oxford University
iuct Technologies and Competitiveness and , Cal.: UC, Center for sou 1991:82. ion: past, present, and 'ord University Press. ilopment in Swedish
ck/ing i Utlandet: En okholm: IV A. 'awards a Theory of
r? A critical analysis IE. Screpanti (eds), Jtion, Edward Elgar. ', in S.-E. Sjc:jstrand al Findings, Sharpe. JI, W. Samuels and ?cono111ics, Edward
'innovation', in R. Press. y differences: dead X (September), pp.
i~ersity Press. Jfnic Change, The
'ag: En studie av 1roduktla11sering
g' B ilaga 11 till
High R&D intensity without high tech products 149
OECD (1993), Main Science and Technology Indicators. OECD (1994), Science and Technology Policy: Review and Outlook. Pavitt, K. (1984), 'Sectoral patterns of technical change: towards a taxonomy and a theory',
Research Policy, 13, pp. 343-73. Pavitt, K. and P. Patel (1988), 'The international distribution and determinants of
technological activities', The Oxford Review of Econoniic Policy, 4. Porter, M. (1990), The Co111petitive Advantage of Nations, Macmillan. Statistiska centralbynlll (SCB) (1983), Forshtingsstatistik-Tehzisk och natun,etenskaplig
forskning och utveckling iforetagssektorn 1981 U 27. Statistiska c.entralbyran (SCB) (1985), Forshlingsstatistik ~ Teh1isk och naturvetenskap!ig
forskning och utveckling iforetagssektorn 1983 U 14. Statistiska centralbyffiI1 (SCB) (1989), Forshlingsstatistik ~ Tehiisk och naturvetenskaplig
forskning och utveckling iforetagssektorn 1987 U 14. Statistiska centralbyrdn (SCB) (1991), Forsh1ingsstatistik-Tehzisk oclz naturvetenskaplig
forskning och utveckling iforetagssektorn 1989 U 14 SM 9101. Statistiska centralbyrfill (SCB) (1993 ), F orsh1ingsstatistik - Teh1isk och naturvetenskap!ig
forshzing och utveckling iforetagssektorn 1991 U 14. Statens industriverk (SINO) (1990a), Svensk h6gteh1olgisk industri och dess export SlND
1990:4. Statens industriverk (SIND (1990b), Industrin till Gr 2000 - ett tillvtixtdecenniu,n?
Bilaga 18 till Ldngtidsutredningen 1990. For Finansdepartementet, Norstedts Tryckeri. Teece, D. (1988), 'Technological change and the nature of the firm', in G. Dosi et al.
(eds), Technical Change and Econo,nic Theo1y, Pinter. Tyson, L.A. (1992), lVho's Bashing lVhon1? Trade Conflict in High-Technology
Industries, Institute for International Economics.