1998 annual report of the board of … · letter of transmittal _____ board of trustees of the...
TRANSCRIPT
_________
_________
1998 ANNUAL REPORT OF THE BOARD OF TRUSTEES OF THE FEDERAL HOSPITAL INSURANCE
TRUST FUND
COMMUNICATION
From
THE BOARD OF TRUSTEES, FEDERAL HOSPITAL INSURANCE
TRUST FUND
Transmitting
THE 1998 ANNUAL REPORT OF THE BOARD, PURSUANT TO
SECTION 1817(b) OF THE SOCIAL SECURITY ACT, AS AMENDED


LETTER OF TRANSMITTAL
__________
BOARD OF TRUSTEES OF THE FEDERAL HOSPITAL INSURANCE TRUST FUND
Washington, D.C., April 28, 1998
HONORABLE Newt Gingrich Speaker of the House of Representatives Washington, D.C.
HONORABLE Albert Gore, Jr. President of the Senate Washington, D.C.
GENTLEMEN:
We have the honor of transmitting to you the 1998 Annual Report of the Board of Trustees of the Federal Hospital Insurance Trust Fund (the 33rd such report), in compliance with the provisions of section 1817(b) of the Social Security Act.
Respectfully,
/S/ Robert E. Rubin, Secretary of the
Treasury, and Managing Trustee of the Trust Fund.
/S/ Donna E. Shalala, Secretary of
Health and Human Services, and Trustee.
/S/ Stephen G. Kellison, Trustee.
/S/ Alexis M. Herman, Secretary of Labor,
and Trustee.
/S/ Kenneth S. Apfel, Commissioner
of Social Security, and Trustee.
/S/ Marilyn Moon, Trustee.
/S/ Nancy-Ann Min DeParle, Administrator
of the Health Care Financing Administration, and Secretary, Board of Trustees.

V
CONTENTS
I. OVERVIEW ........................................... 1 A. Introduction ......................................... 1 B. Highlights .......................................... 2 C. 1997 Trust Fund Financial Operations ..................... 5 D. Economic and Demographic Assumptions .................. 8 E. 10-year Actuarial Estimates (1998-2007) .................. 10 F. 75-Year Actuarial Estimates (1998-2072) .................. 13 G. Conclusion ......................................... 16
II. ACTUARIAL ANALYSIS................................ 19 A. Medicare Amendments Since the 1997 Report .............. 19 B. Nature of the Trust Fund .............................. 24 C. Operations of the Trust Fund, Fiscal Year 1997 ............. 28 D. Expected Short-Range Operations and Status of the Trust
Fund ............................................. 33 E. Actuarial Status of the Trust Fund ....................... 45 F. Actuarial Methodology and Principal Assumptions for the
Hospital Insurance Cost Estimates ....................... 54 1. Assumptions ...................................... 54 2. Program Cost Projection Methodology .................. 54 3. Financing Analysis Methodology ...................... 64 4. Projections Under Alternative Assumptions .............. 66
G. Long-Range Sensitivity Analysis ........................ 67 1. Real-Wage Differential .............................. 68 2. Consumer Price Index............................... 69 3. Real-Interest Rate ................................. 70 4. Health Care Cost Factors ............................ 71
III. APPENDICES ....................................... 75 A. Actuarial Balance Under the Modified Average-Cost Method ... 75 B. Long-Range Estimates of Medicare Incurred Disbursements
as a Percentage of Gross Domestic Product ................. 78 C. Medicare Cost Sharing and Premium Amounts ............. 80 D. Glossary ........................................... 83 E. Statement of Actuarial Opinion ......................... 98

VI
TABLES
I.D1.—Ultimate Assumptions ................................ 8 I.E1.—Estimated Operations of the HI Trust Fund Under
Intermediate Assumptions, Calendar Years 1997-2007 ...... 12 II.B1.—Tax Rates and Maximum Tax Bases ................... 25 II.C1.—Statement of Operations of the HI Trust Fund During
Fiscal Year 1997 .................................. 29 II.C2.—Comparison of Actual and Estimated Operations of the
HI Trust Fund, Fiscal Year 1997 ...................... 31 II.C3.—Assets of the HI Trust Fund, by Type, at the End of
Fiscal Years 1996 and 1997 .......................... 32 II.D1.—Operations of the HI Trust Fund During Fiscal Years
1970-2007 ....................................... 36 II.D2.—Operations of the HI Trust Fund During Calendar Years
1970-2007 ....................................... 38 II.D3.—Estimated Operations of the HI Trust Fund During
Calendar Years 1997-2007, Under Alternative Sets of Assumptions ..................................... 40
II.D4.—Ratio of Assets at the Beginning of the Year to Disbursements During the Year for the HI Trust Fund ..... 43
II.E1.—Historical Cost Rates of the HI Program ................. 47 II.E2.—Projected Cost and Income Rates of the HI Program ....... 48 II.E3.—Actuarial Balances of the HI Program, Under Three
Sets of Assumptions................................ 49 II.E4.—Change in the 75-Year Actuarial Balance Since the 1997
Report .......................................... 53 II.F1.—Components of Historical and Projected Increases in HI
Inpatient Hospital Payments ......................... 58 II.F2.—Relationship Between Increases in HI Program
Expenditures and Increases in Taxable Payroll ........... 61 II.F3.—Summary of Alternative Projections for the HI Program ..... 65 II.G1.—Estimated HI Income Rates, Cost Rates, and Actuarial
Balances, Based on Intermediate Estimates With Various Real-Wage Assumptions ............................ 69
II.G2.—Estimated HI Income Rates, Cost Rates, and Actuarial Balances, Based on Intermediate Estimates With Various CPI-Increase Assumptions .......................... 70
II.G3.—Estimated HI Income Rates, Cost Rates, and Actuarial Balances, Based on Intermediate Estimates With Various Real-Interest Assumptions .......................... 71
II.G4.—Estimated HI Income Rates, Cost Rates, and Actuarial Balances, Based on Intermediate Estimates With Various Health Care Cost Growth Rate Assumptions ............. 72
VII
III.A1.—Actuarial Balances of the HI Program, Under Three Sets of Assumptions: Modified Average-Cost Method versus Present-Value Method ........................ 77
III.B1.—Hl and SMI Incurred Disbursements as a Percent of Gross Domestic Product ............................ 78
III.C1.—Medicare Cost Sharing and Premium Amounts........... 81
FIGURES
I.C1.—HI Income in Calendar Year 1997 ....................... 6 I.C2.—HI Expenditures in Calendar Year 1997 .................. 7 I.E1.—HI Expenditures and Income .......................... 10 I.E2.—HI Trust Fund Assets at End of Year .................... 11 I.F1.—Long-Range HI Income and Cost as a Percentage of
Taxable Payroll, Intermediate Assumptions .............. 13 I.F2.—Workers Per HI Beneficiary ........................... 14 II.D1.—HI Trust Fund Balance at Beginning of Year as a
Percentage of Annual Expenditures ................... 44 II.D2.—HI Trust Fund Balance at End-of-Year ................. 44 II.E1.—Estimated HI Cost and Income Rates as Percent of
Taxable Payroll ................................... 52

1
I. OVERVIEW
A. INTRODUCTION
The Hospital Insurance (HI) program, or Medicare Part A, helps pay for hospital, home health, skilled nursing facility, and hospice care for the aged and disabled. The HI program is financed primarily by payroll taxes paid by workers and employers. The taxes paid each year are used mainly to pay benefits for current beneficiaries. Income not currently needed to pay benefits and related expenses is held in the HI trust fund, and invested in U.S. Treasury securities.
The Board of Trustees was established under the Social Security Act to oversee the financial operations of the HI trust fund. The Board is composed of six members. Four members serve by virtue of their positions in the Federal Government: the Secretary of the Treasury who is the Managing Trustee, the Secretary of Labor, the Secretary of Health and Human Services, and the Commissioner of Social Security. The other two members are appointed by the President and confirmed by the Senate to serve as Public Trustees. Stephen G. Kellison and Marilyn Moon began serving on July 20, 1995. The Administrator of the Health Care Financing Administration (HCFA) is designated as Secretary of the Board.
The Social Security Act requires that the Board report to the Congress annually on the financial and actuarial status of the HI trust fund. This 1998 report is the 33rd to be submitted. Due to uncertainty about the future, the financial condition of the HI trust fund is examined under three alternative sets of assumptions: “low cost,” “intermediate,” and “high cost.” These alternatives are intended to illustrate a reasonable range of possible outcomes. The intermediate set of assumptions represents the Trustees’ best estimate of the expected future economic and demographic trends. The report describes both the near term financial outlook and the longer term outlook throughout a 75-year valuation period.

Overview
2
B. HIGHLIGHTS
The major findings of this report are summarized below. Unless otherwise noted, all estimates are based on the intermediate assumptions.
• The Balanced Budget Act of 1997 contained numerous provisions affecting the Medicare program. These provisions were designed in part to postpone the imminent depletion of the HI trust fund, which had been projected for 2001. Under this legislation, fund exhaustion is postponed until 2008 based on the intermediate assumptions used in this report. Although intended primarily as a means to address the immediate short-range financial shortfalls, the legislation also has an important long-range impact, lowering the projected 75-year deficit by about one-half.
• In 1997, the HI program provided protection against the costs of hospital and other medical care to about 38 million people. Approximately 22 percent of these individuals received medical services covered by HI during the year and total HI benefits on their behalf amounted to $137.8 billion.
• HI program expenditures exceeded annual income by $9.3 billion in calendar year 1997. By drawing down on trust fund assets, the program could continue to pay benefits for several more years. Under intermediate assumptions, the HI trust fund is estimated to be depleted in 2008.
• There are expected to be 3.6 workers per HI beneficiary when the baby boom generation begins to reach age 65 in 2010. Then the worker/beneficiary ratio is expected to rapidly decline to 2.3 in 2030 as the last of the baby boomers reaches age 65. The ratio is expected to continue declining thereafter (but more gradually) as life expectancy continues to lengthen.
• HI expenditures are projected to grow rapidly as a fraction of workers’ earnings, from 3.4 percent in 1997 to 7.8 percent in 2070. As a fraction of the Gross Domestic Product (GDP), expenditures would grow somewhat more slowly, from 1.7 percent in 1997 to 3.4 percent in 2070.
• Projected HI tax income would meet only a declining share of expenditures under present law. Tax income is expected to equal 89 percent of expenditures in 1998 and 86 percent in 2008 (when the
Highlights
3
fund is estimated to be depleted), and would cover less than one-half of costs 75 years from now.
• The time gained by postponing the depletion of the HI trust fund must be used productively to determine effective solutions to the remaining long-range problems. In this regard the work of the National Bipartisan Commission on the Future of Medicare will be of critical importance to the Administration, the Congress, and the American public. The development of further reforms should occur as quickly as possible.
• We believe that solutions can and must be found to ensure the financial integrity of the HI program in both the short term and the long term. Prompt, effective, and decisive action is necessary to build upon the strong steps taken by the Balanced Budget Act of 1997.
Key HI Data for Calendar Year 1997
• HI covered 33 million aged and 5 million disabled beneficiaries. The total number of HI beneficiaries increased by 1.4 percent in 1997, and by 22.0 percent over the last 10 years.
• HI benefits amounted to $137.8 billion, a 7 percent increase over the prior year. Average expenditures per HI enrollee increased by 6 percent to $3,600.
• Administrative costs were 1 percent of program expenditures.
• Summary of HI trust fund operations in 1997 (in billions):
Fund Assets (12/31/96) $124.9 Income 130.2 Expenditures 139.5 Fund Assets (12/31/97) 115.6
Net Change in Assets -9.3
• Payroll taxes, paid by 151 million covered workers, accounted for 88 percent of total HI income. Interest represented 7 percent and revenue from the income taxation of Social Security benefits was another 3 percent. The remaining 2 percent was received from miscellaneous sources, primarily premiums paid by uninsured persons to enroll in the HI program.
Overview
4
• Payments for the costs of fee-for-service inpatient hospital care represented 65 percent of HI benefits. Skilled nursing and home health care accounted for another 22 percent of the total. Payments to managed care plans represented another 11 percent and hospice benefits accounted for the final 2 percent.

Trust Fund Financial Operations
5
C. 1997 TRUST FUND FINANCIAL OPERATIONS
Total HI income in calendar year 1997 was $130.2 billion and total expenditures were $139.5 billion. The assets of the fund therefore decreased by a net total of $9.3 billion. As of December 31, 1997 the HI trust fund had $115.6 billion in assets.
1. Income
The $130.2 billion in income received by the HI program last year was derived from the following sources:
• Payroll taxes. The primary source of financing for the HI program is the payroll tax on covered earnings. Employees and their employers each pay 1.45 percent of earnings, while self-employed workers pay 2.9 percent of their net income. HI payroll taxes amounted to $114.7 billion in calendar year 1997 or 88 percent of total HI income.
• Interest. Interest income of $9.3 billion was paid in 1997 on the U.S. Treasury securities held by the trust fund. It accounted for 7 percent of HI revenue. The average rate of interest earned on trust fund assets in 1997 was 8.0 percent.
• Taxation of benefits. A portion of the Federal income taxes that people pay on their Social Security benefits is allocated to the HI trust fund. In 1997, $3.6 billion was deposited in the trust fund from taxation of Social Security benefits, accounting for 3 percent of total HI income.
• Other. An additional $3 billion in miscellaneous revenue, representing 2 percent of total HI income, was also received in 1997. (See section II.B for a discussion of these items.)

Overview
6
Figure I.C1.—HI Income in Calendar Year 1997 [In billions]
2. Expenditures
The HI fund spent $139.5 billion in calendar year 1997. The major expenditures were:
• Benefit payments. Benefit payments represented 99 percent of HI outlays. About 65 percent of such payments were for fee-for-service inpatient hospital services. Hospital payments have been increasing at about a 5 percent annual rate in recent years. Payments to skilled nursing facilities, home health agencies, managed care plans, and hospices, while much smaller than hospital payments, have generally been increasing at double digit rates. Expenditures for home health and hospice care were a notable exception in 1997, increasing by only 0.2 percent and 5.5 percent, respectively.
• Administrative expenses. Administrative expenses represented 1 percent of HI outlays during 1997. These expenses included not only federal salaries and related expenses but also funds to support the fiscal intermediaries (generally insurance companies) that assist in administering HI. These expenses also included costs of the health care fraud and abuse control program, as provided for by the Health Insurance Portability and Accountability Act of 1996.

Trust Fund Financial Operations
7
Figure I.C2.—HI Expenditures in Calendar Year 1997 [In billions]

Overview
8
D. ECONOMIC AND DEMOGRAPHIC ASSUMPTIONS
Actual future expenditures will depend on a number of factors. These factors include the size and composition of the population eligible for benefits, hospital and skilled nursing facility admission rates, home health agency visit rates, and changes in the price per service. Future income will depend on the size and characteristics of the covered work force and the level of workers’ earnings. These factors will depend in turn upon future birth rates, death rates, labor force participation rates, wage increases, and many other economic and demographic circumstances affecting the HI program.
To illustrate the uncertainty and sensitivity inherent in estimates of future program operations, projections have been prepared under a “low cost” and a “high cost” set of assumptions in addition to the intermediate assumptions. For simplicity of presentation, much of the analysis in this overview centers on the projections under intermediate assumptions. However, it is important to recognize that actual conditions are very likely to differ from that scenario or any other specific set of assumptions.
Some of the key demographic and economic variables that determine HI costs and income are common to the Old-Age, Survivors, and Disability Insurance (OASDI) program and the Supplementary Medical Insurance (SMI) program and are explained in detail in the report of the Board of Trustees of the OASDI program. As shown in table I.D1 below, these include changes in the Consumer Price Index (CPI) and wages, real interest rates, fertility rates, and life expectancy. (“Real” indicates that the effects of inflation have been removed.) The assumptions vary, in most cases, from year to year during the first 5 to 25 years before reaching their so-called “ultimate” values for the remainder of the 75-year projection period. These ultimate values are shown in table I.D1.
Table I.D1.—Ultimate Assumptions Intermediate Low Cost High Cost
Annual percentage change in: Consumer Price Index (CPI) ............ 3.5 2.5 4.5 Average wage in covered employment ..... 4.4 3.9 4.9
Real-wage differential (percent) ............. 0.9 1.4 0.4 Real interest rate (percent) ................. 2.8 3.5 2.0
Fertility rate (children per woman) ............ 1.9 2.2 1.6 Life expectancy at birth in 2075 (combined average
for men and women, in years) ............ 81.7 78.8 85.6
Economic and Demographic Assumptions
9
Other assumptions are specific to the HI program. One critical assumption is the rate of increase in the cost of health care services. Under the intermediate assumptions, the rate of increase in the cost per unit of service during the initial 25-year period is assumed to decline gradually from the current level to the same growth rate that is projected for average hourly earnings and then to continue at the average hourly earnings rate for the following 50 years. For the high cost assumptions, the annual increase in program costs (relative to taxable payroll) during the initial 25-year period is assumed to be two percent greater than under the intermediate assumptions. Under low cost assumptions, the increase during the same period is assumed to be two percent less than under intermediate assumptions. The two percent differentials for the high and low assumptions are assumed to decline gradually until 2047 when the same rate of increase in program costs (relative to taxable payroll) is assumed for all three sets of assumptions.
While it is reasonable to assume that actual trust fund experience will fall within the range defined by the three alternative sets of assumptions, no definite assurance can be given in light of the wide variations in experience that have occurred since the beginning of the program. In general, a greater degree of confidence can be placed in the assumptions and estimates for the earlier years than for the later years. Nonetheless, even for the earlier years, the estimates are only an indication of the expected trend and the general range of future program experience.
Overview
10
E. 10-YEAR ACTUARIAL ESTIMATES (1998-2007)
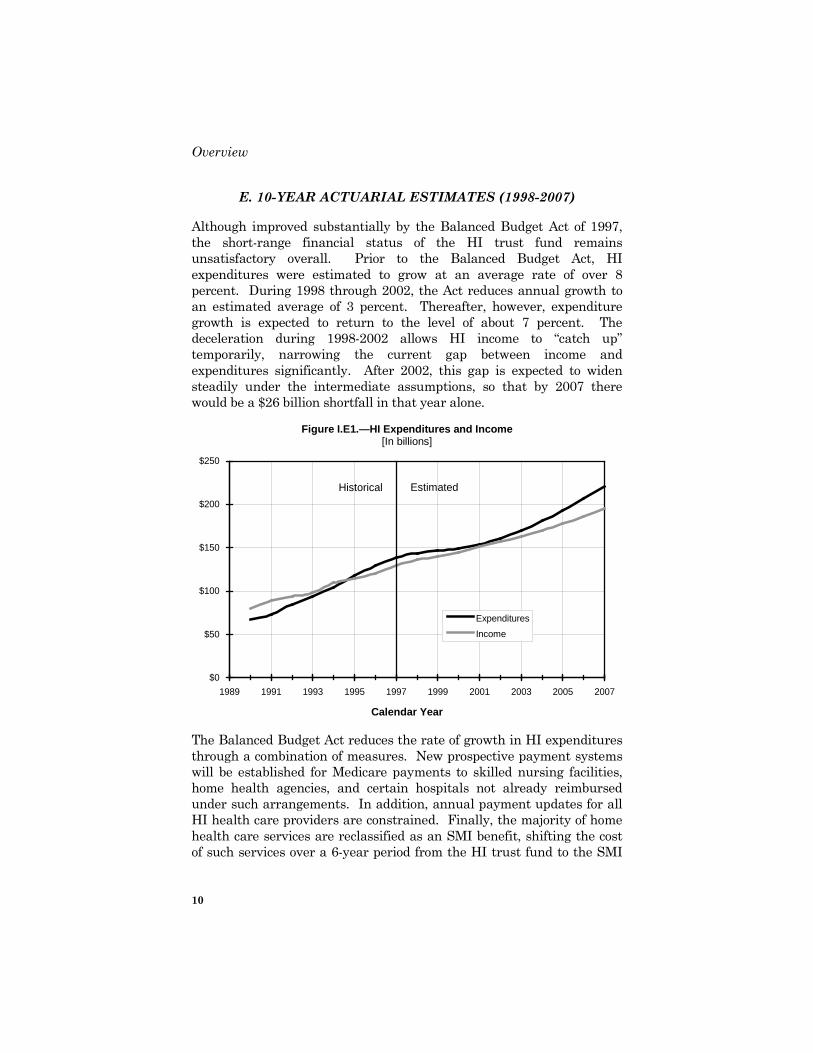
Although improved substantially by the Balanced Budget Act of 1997, the short-range financial status of the HI trust fund remains unsatisfactory overall. Prior to the Balanced Budget Act, HI expenditures were estimated to grow at an average rate of over 8 percent. During 1998 through 2002, the Act reduces annual growth to an estimated average of 3 percent. Thereafter, however, expenditure growth is expected to return to the level of about 7 percent. The deceleration during 1998-2002 allows HI income to “catch up” temporarily, narrowing the current gap between income and expenditures significantly. After 2002, this gap is expected to widen steadily under the intermediate assumptions, so that by 2007 there would be a $26 billion shortfall in that year alone.
Figure I.E1.—HI Expenditures and Income [In billions]
$0
$50
$100
$150
$200
$250
1989 1991 1993 1995 1997 1999 2001 2003 2005 2007
ExpendituresIncome
Historical Estimated
Calendar Year
The Balanced Budget Act reduces the rate of growth in HI expenditures through a combination of measures. New prospective payment systems will be established for Medicare payments to skilled nursing facilities, home health agencies, and certain hospitals not already reimbursed under such arrangements. In addition, annual payment updates for all HI health care providers are constrained. Finally, the majority of home health care services are reclassified as an SMI benefit, shifting the cost of such services over a 6-year period from the HI trust fund to the SMI
10-Year Actuarial Estimates
11
trust fund. Section II.A of this report contains more detailed information on these provisions.
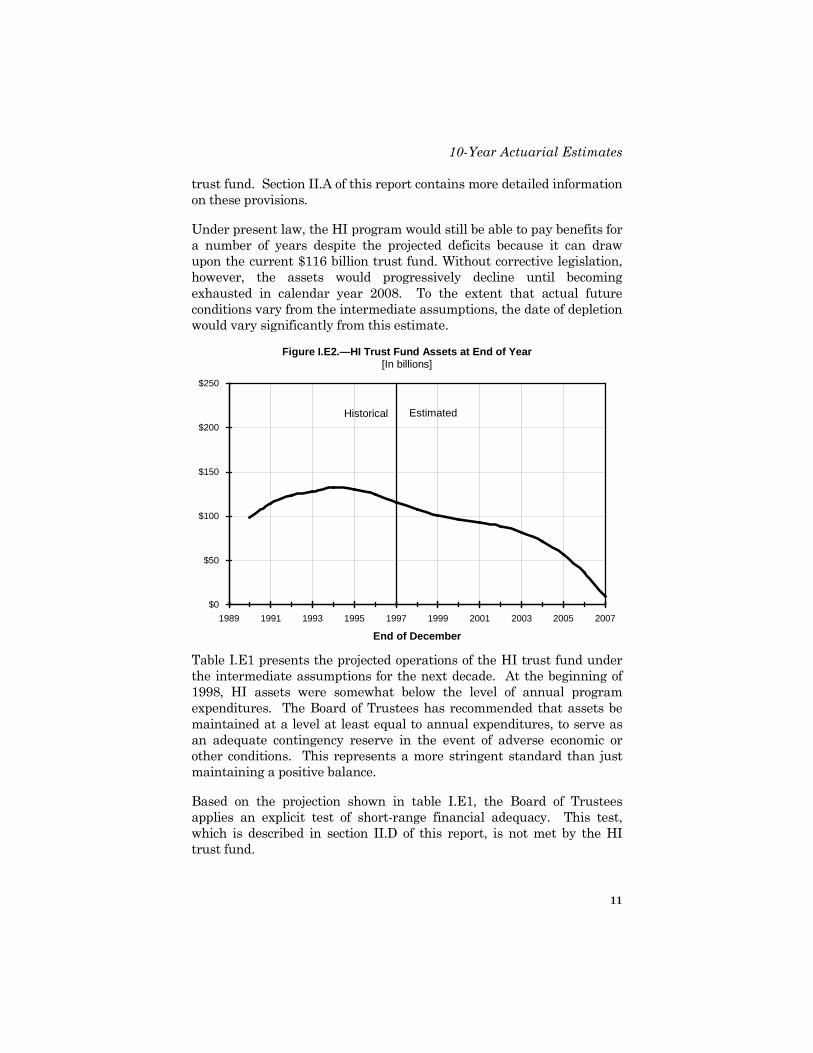
Under present law, the HI program would still be able to pay benefits for a number of years despite the projected deficits because it can draw upon the current $116 billion trust fund. Without corrective legislation, however, the assets would progressively decline until becoming exhausted in calendar year 2008. To the extent that actual future conditions vary from the intermediate assumptions, the date of depletion would vary significantly from this estimate.
Figure I.E2.—HI Trust Fund Assets at End of Year [In billions]
$0
$50
$100
$150
$200
$250
1989 1991 1993 1995 1997 1999 2001 2003 2005 2007
End of December
Historical Estimated
Table I.E1 presents the projected operations of the HI trust fund under the intermediate assumptions for the next decade. At the beginning of 1998, HI assets were somewhat below the level of annual program expenditures. The Board of Trustees has recommended that assets be maintained at a level at least equal to annual expenditures, to serve as an adequate contingency reserve in the event of adverse economic or other conditions. This represents a more stringent standard than just maintaining a positive balance.
Based on the projection shown in table I.E1, the Board of Trustees applies an explicit test of short-range financial adequacy. This test, which is described in section II.D of this report, is not met by the HI trust fund.

Overview
12
Table I.E1.—Estimated Operations of the HI Trust Fund Under Intermediate Assumptions, Calendar Years 1997-2007
[Dollar amounts in billions]
Calendar year Total income Total
expenditures Change in
fund Fund at year end
Ratio of assets to expenditures1
(percent)
1997 2 $130.2 $139.5 -$9.3 $115.6 90 1998 135.9 143.6 -7.7 107.9 81 1999 140.4 147.2 -6.8 101.1 73 2000 145.0 149.5 -4.4 96.7 68 2001 150.6 153.8 -3.2 93.5 63 2002 156.5 160.6 -4.1 89.4 58 2003 163.1 170.1 -7.0 82.4 53 2004 170.2 180.9 -10.6 71.8 46 2005 178.1 193.3 -15.2 56.6 37 2006 186.0 206.7 -20.7 35.9 27 2007 194.8 221.2 -26.3 9.5 16
1Ratio of assets in the fund at the beginning of the year to expenditures during the year. 2Figures for 1997 represent actual experience.
Note: Totals do not necessarily equal the sums of rounded components.
As suggested in table I.E1, the assets of the HI trust fund would be depleted in 2008 under the intermediate assumptions. Under the low cost assumptions, trust fund depletion would occur in 2030. Under the high cost assumptions depletion would occur in 2004. The fact that exhaustion is likely to occur in the relatively near future indicates the importance of addressing the HI trust fund’s remaining financial imbalance through additional legislation that builds on the strong steps taken by the Balanced Budget Act of 1997.

75-year Actuarial Estimates
13
F. 75-YEAR ACTUARIAL ESTIMATES (1998-2072)
Each year, estimates of the financial and actuarial status of the HI program are prepared for the next 75 years. Although financial estimates for periods as long as 75 years are inherently uncertain, the results can provide valuable information for policy makers. In particular, such estimates can indicate whether the program—as seen from today’s vantage point—is considered to be in satisfactory financial condition.
Income and expenditure amounts are shown relative to the earnings in covered employment that are taxable under the HI program—referred to as “taxable payroll”—because of the difficulty in comparing dollar values for different periods without some type of relative scale. The ratio of tax income (including both payroll taxes and income from taxation of Social Security benefits) to taxable payroll is called the “income rate” and the ratio of expenditures to taxable payroll is the “cost rate.”
Figure I.F1.—Long-Range HI Income and Cost as a Percentage of Taxable Payroll, Intermediate Assumptions
0%
2%
4%
6%
8%
10%
12%
1967 1977 1987 1997 2007 2017 2027 2037 2047 2057 2067
Cost Rate
Income Rate
DEFICIT
Historical Estimated
Calendar Year
Although the long-range financial outlook for the HI program was significantly improved by the Balanced Budget Act of 1997, the program remains seriously underfunded over the next 75 years. Income rates are
Overview
14
projected to remain fairly steady while cost rates sharply escalate between 2010 and 2030 and continue to increase throughout the period.
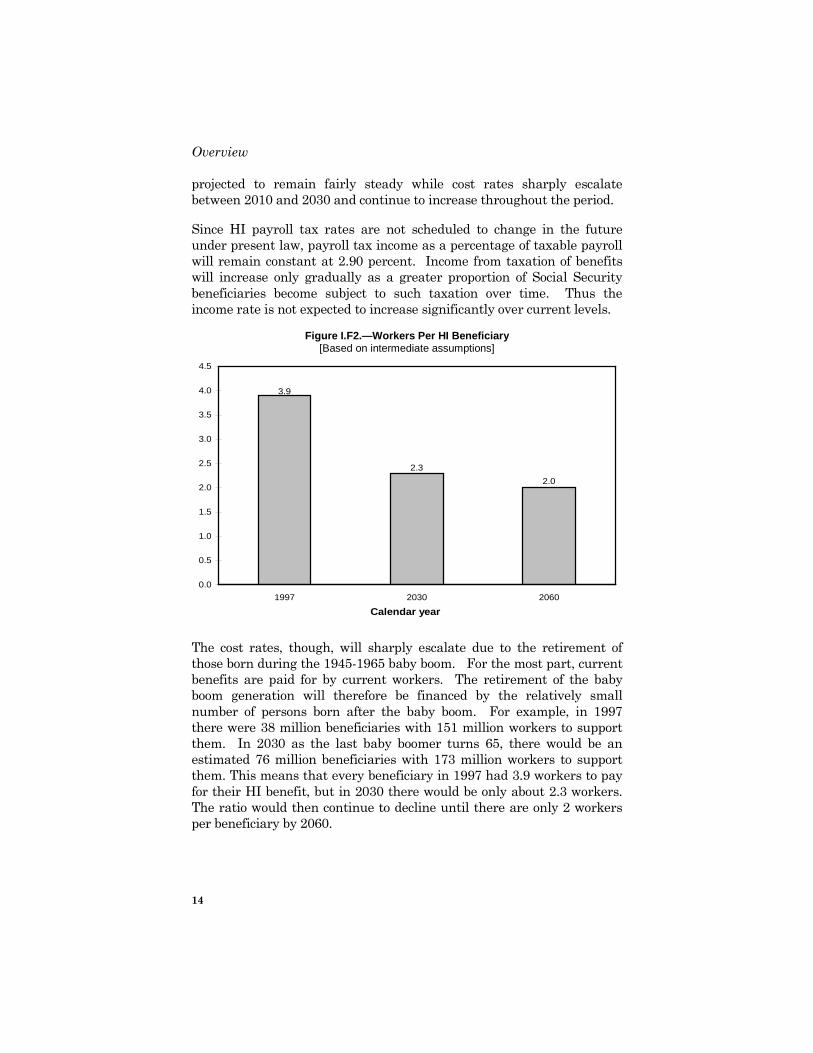
Since HI payroll tax rates are not scheduled to change in the future under present law, payroll tax income as a percentage of taxable payroll will remain constant at 2.90 percent. Income from taxation of benefits will increase only gradually as a greater proportion of Social Security beneficiaries become subject to such taxation over time. Thus the income rate is not expected to increase significantly over current levels.
Figure I.F2.—Workers Per HI Beneficiary [Based on intermediate assumptions]
3.9
2.02.3
0.0
0.5
1.0
1.5
2.0
2.5
3.0
3.5
4.0
4.5
1997 2030 2060
Calendar year
The cost rates, though, will sharply escalate due to the retirement of those born during the 1945-1965 baby boom. For the most part, current benefits are paid for by current workers. The retirement of the baby boom generation will therefore be financed by the relatively small number of persons born after the baby boom. For example, in 1997 there were 38 million beneficiaries with 151 million workers to support them. In 2030 as the last baby boomer turns 65, there would be an estimated 76 million beneficiaries with 173 million workers to support them. This means that every beneficiary in 1997 had 3.9 workers to pay for their HI benefit, but in 2030 there would be only about 2.3 workers. The ratio would then continue to decline until there are only 2 workers per beneficiary by 2060.

75-year Actuarial Estimates
15
The year-by-year cost rates and income rates can be summarized into single values representing, in effect, the average value over a given period. (Section II.E and section III.F describe how these summarized values are calculated.) The difference between the summarized income and cost rates is called the “actuarial balance.” This measure shows a deficit ranging between 0.3 and 5.5 percent of taxable payroll for the 75-year period based on the range of assumptions used in this report. The actuarial balance has traditionally been used as a convenient single measurement to summarize the financial status of the program. It can be interpreted as the amount of change in the tax rate that would be required to bring the program into balance if no other changes were made. (See section II for details and limitations of summary measures.)
Based on the intermediate assumptions, an actuarial balance deficit of 2.10 percent of taxable payroll is projected for the 75-year period, representing the difference between the summarized income rate of 3.26 percent and the corresponding cost rate of 5.37 percent. This deficit is roughly one-half the level estimated prior to the Balanced Budget Act of 1997. To correct the remaining financial imbalance, the 2.90 percent payroll tax (for employees and employers combined) would have to be immediately increased to 5.00 percent or expenditures would have to be reduced by a corresponding amount (or some combination of such changes). The HI program thus fails the Trustees’ long-range test—discussed in section II—which is based on the actuarial balance. The test is even failed under the low cost assumptions. The fact that the trust fund is projected to be in deficit under a broad range of economic and demographic assumptions reinforces the importance of addressing the remaining long-range imbalance through further corrective legislation.

Overview
16
G. CONCLUSION
The financial projections shown for the HI program in this year’s report represent a substantial improvement over those in recent years, as a result of the Medicare reforms in the Balanced Budget Act of 1997. These changes are estimated to postpone the depletion of the HI trust fund from 2001 until 2008 and to reduce the long-range HI deficit by about one-half (from 4.32 percent of taxable payroll to 2.10 percent), based on our intermediate set of assumptions. In addition, the legislation establishes the National Bipartisan Commission on the Future of Medicare to review the long-term financial condition of Medicare and to make recommendations concerning the program’s financing, benefit structure, and related issues. These changes accomplish our most urgent recommendations from the 1997 annual report.
Even with these very substantial and important improvements, however, the HI program remains seriously out of financial balance. We must again report, as we have since 1992, that the HI trust fund does not meet our short-range test of financial adequacy. For the past 3 years, HI expenditures have exceeded income by a total of $17.2 billion. The Balanced Budget Act provisions are estimated to substantially reduce the gap between income and expenditures over the next 5 years, but with a return to steadily increasing deficits in 2003 and later. While these shortfalls can be met by redeeming trust fund assets, future income and assets will be sufficient to support projected program expenditures for only the next 10 years under the intermediate assumptions. Thus, without additional legislation, the fund would be exhausted in the not-distant future—initially producing payment delays, but very quickly leading to a curtailment of health care services to beneficiaries.
Although the long-range deficit has been reduced to about one-half its prior magnitude (a major improvement), the long-range outlook remains very unfavorable. The HI program still fails by a wide margin to meet our long-range test of close actuarial balance. To bring the HI program into actuarial balance, over just the next 25 years under the intermediate assumptions, would require either that outlays be further reduced by 18 percent or that income be increased by 22 percent (or some combination of the two) throughout this 25-year period. That is, the current HI payroll tax of 1.45 percent (for employees and employers, each) would have to be immediately raised to about 1.81 percent, or benefits reduced by a comparable amount. Over the full 75-year projection period, substantially greater changes in income and/or outlays
Conclusion
17
are needed, in large part as a result of the impending retirement of the baby boom generation. Starting in about 2010, the ratio of workers to HI beneficiaries will begin to decline from its current level of about 4 to 1, rapidly reaching a ratio of about 2 to 1.
The Medicare changes in the Balanced Budget Act build upon past measures to reduce growth in expenditures, by introducing new prospective payment systems for providers of HI services that previously received cost-based reimbursements and by limiting payment increases to all HI providers. Such steps can effectively constrain growth in HI expenditures while encouraging increased operating efficiencies by providers. Further improvement in the HI trust fund’s financial position is attributable to the transfer of a substantial portion of home health care services from HI to SMI, although this change increases SMI costs correspondingly. These changes, substantial as they are, are only sufficient to enable payment of HI benefits over the next decade. More far-reaching measures will be needed to prevent trust fund depletion as the baby boom generation reaches age 65 and starts receiving benefits.
Consideration of further reform measures must recognize that the nation’s health care system is changing rapidly. The performance of alternative modes of treatment and service delivery over the next few years, in both quality and cost, should provide new information that will contribute to better legislative decisions regarding the long-range outlook for HI. While we continue to believe in the urgent need to address the HI program’s financial imbalance, we also recognize that solutions determined and implemented today will likely need adjustment over time to match new circumstances and conditions as they evolve in the future.
The time gained by postponing the depletion of the HI trust fund must be used productively to determine effective solutions to the remaining long-range problems. In this regard, the work of the Bipartisan Commission will be of critical importance to the Administration, the Congress, and the American public. Moreover, the development of further reforms should occur as quickly as possible. Income to the HI trust fund remains insufficient to cover costs, with the result that fund assets must be redeemed to make up the shortfall. Solutions will need not only to restore balance between income and expenditures but also to rebuild assets to a level sufficient to serve as a contingency reserve against unforseen fluctuations. In addition, the sooner solutions are enacted, the more flexible and gradual they can be. Finally, the early introduction of further reforms increases the time available for affected

Overview
18
individuals and organizations—including health care providers, beneficiaries, and taxpayers—to adjust their expectations.
The projections shown in this report clearly demonstrate the need for timely and effective action to address the remaining financial imbalance facing the HI trust fund. We believe that solutions can and must be found to ensure the financial integrity of the HI program in both the short term and the long term. Thus, we urge the nation’s policy makers to build upon the strong steps taken by the Balanced Budget Act of 1997 and to take further prompt, effective, and decisive action.
19
II. ACTUARIAL ANALYSIS
A. MEDICARE AMENDMENTS SINCE THE 1997 REPORT
Since the 1997 Annual Report was transmitted to Congress on April 24, 1997, one law affecting the HI program in a significant way has been enacted. The Balanced Budget Act of 1997 (Public Law 105-33, enacted on August 5, 1997) included a number of provisions affecting the HI program. The more important provisions, from an actuarial standpoint, are described in the following paragraphs. Certain provisions with a relatively minor financial impact on the HI program, but which are important from a policy standpoint, are described as well.
• An expanded set of options for the delivery of health care under Medicare, referred to as “Medicare+Choice,” has been established. All Medicare beneficiaries can receive their Medicare benefits through the original fee-for-service program. In addition, most beneficiaries can choose instead to receive their Medicare benefits through one of the following Medicare+Choice plans: (1) coordinated care plans (such as health maintenance organizations, provider-sponsored organizations, and preferred provider organizations); (2) Medical Savings Account (MSA)/High Deductible plans (through a demonstration available to up to 390,000 beneficiaries); or (3) private fee-for-service plans. Except for MSA plans, all Medicare+Choice plans are required to provide the current Medicare benefit package (excluding hospice services) and any additional health services required under the adjusted community rate (ACR) process. MSA plans provide Medicare benefits after a single high deductible is met, and enrollees receive an annual deposit in the Medical Savings Account.
• In general, beginning in 1998, Medicare capitation rates paid to the plans will be the greater of: (1) a blend of the area-specific rate and an input-price adjusted national rate, further adjusted as necessary to meet budget neutrality requirements; (2) a minimum payment amount; or (3) a minimum percentage increase over the prior year’s payment rates. Between 1998 and 2002, medical education payments will be removed from the area-specific rate, on the following schedule: 20 percent in 1998, 40 percent in 1999, 60 percent in 2000, 80 percent in 2001, and 100 percent in 2002 and later. The update factor for the area-specific rate and the minimum payment is the national average per capita Medicare growth rate reduced by 0.8 percentage points for 1998, and by 0.5 percentage points for 1999 through 2002. The capitation rates are to be announced by March 1 of the year before the year to which they apply.
Actuarial Analysis
20
• By May 1, all plans must submit information on enrollment capacity, premium rates, and other information to the Secretary of HHS for approval. Transition rules for the current Medicare HMO program are also provided for by the Balanced Budget Act.
• For payments to most hospitals reimbursed under the prospective payment system (PPS), the update factor is 0 percent (that is, no update is applied) for discharges occurring during fiscal year 1998. For discharges in 1999 through 2002, the update will equal the market basket percentage increase minus 1.9, 1.8, 1.1, and 1.1 percentage points, respectively. For fiscal years 2003 and later, the PPS update factor for all hospitals is the market basket percentage increase.
• Certain non-teaching, non-disproportionate share, non-Medicare-dependent hospitals are allowed higher updates than other PPS hospitals. These hospitals must be located in states where, for non-teaching, non-disproportionate share, non-Medicare-dependent hospitals, aggregate HI payments for their cost reporting periods beginning during fiscal year 1995 are less than the aggregate allowable operating costs of inpatient hospital services for all such hospitals in the state, and the HI payments for discharges in the cost reporting period involved must be less than their allowable operating costs for inpatient hospital services in that period. Hospitals meeting these criteria will receive a PPS update of 0.5 percent for fiscal year 1998 and the market basket percentage increase minus 1.6 percentage points for fiscal year 1999. These special updates do not affect payments to these hospitals for fiscal year 2000 and later.
• For PPS-exempt hospitals, the update factor for fiscal year 1998 is 0 percent. For fiscal years 1999 to 2002, the update factor for each PPS-exempt hospital is determined by formulae based on the difference between the hospital’s “target amount” and its costs. In addition, several other provisions affecting reimbursement to certain types of PPS-exempt hospitals have been enacted.
• For discharges in fiscal year 1999 and later, for ten specific diagnosis related groups (DRGs), the movements of patients from PPS facilities to post-acute care providers (skilled nursing facilities, PPS-exempt hospitals, and home health agencies) are redefined as “transfers,” as opposed to “discharges,” with limits on payments for said transfers. Beginning with FY 2001, the Secretary of HHS is permitted to increase the number of DRGs and post-acute care settings to which this provision will apply.

Medicare Amendments
21
• For PPS hospitals, capital payments are rebased by the budget neutrality factor that was in place as of September 30, 1995, and there is an additional 2.1 percent reduction in capital payments for discharges occurring on or after October 1, 1997 through September 30, 2002. For certain types of PPS-exempt hospitals, capital payments are reduced by 15 percent for fiscal years 1998-2002.
• The teaching adjustment for indirect medical education payments is reduced from 7.7 percent in fiscal year 1997 to 7.0 percent in fiscal year 1998, 6.5 percent in fiscal year 1999, 6.0 percent in fiscal year 2000, and 5.5 percent in fiscal year 2001 and later. Hospital-specific caps on the number of residents and on the ratio of residents to beds are established. Hospitals will receive additional indirect medical education payments for discharges under Medicare+Choice, determined by the same methodology as for fee-for-service beneficiaries, phased in over 5 years.
• For direct medical education payments, hospital-specific caps on the number of residents are established. Hospitals will receive additional direct medical education payments for discharges under Medicare+Choice, determined by the same methodology as for fee-for-service beneficiaries, phased in over 5 years. Certain non- hospital providers may now be paid for their direct costs of medical education.
• Disproportionate share payments will be reduced by 1 percent in fiscal year 1998, 2 percent in fiscal year 1999, 3 percent in fiscal year 2000, 4 percent in fiscal year 2001, and 5 percent in fiscal year 2002. No reductions are scheduled for subsequent years. The Secretary of HHS must develop recommendations for a new formula for determining disproportionate share payments.
• For hospitals that receive indirect medical education and/or disproportionate share payments, the adjustment factors for indirect medical education and disproportionate share apply to the base DRG payment only, not to the sum of the base payment and any cost outlier payment. The thresholds for qualifying for outlier payments are adjusted to include indirect medical education and disproportionate share costs.
• Allowable costs for hospital bad debt are reduced by 25 percent in fiscal year 1998, 40 percent in fiscal year 1999, and 45 percent thereafter.

Actuarial Analysis
22
• A prospective payment system for skilled nursing facility care is established, which will apply to cost reporting periods beginning on or after July 1, 1998. During a 3-year phase-in period, HI payments to skilled nursing facilities will be based on a blend of facility-specific and Federal per diem amounts, as specified in the Balanced Budget Act. Payments will be based fully on the Federal per diem amount starting in the fourth cost reporting period. A consolidated billing provision, requiring payment for all SMI items and services provided in skilled nursing facilities be made to the facilities, is effective July 1, 1998.
• Home health services not associated with a hospital or skilled nursing facility stay for individuals enrolled in both the HI and SMI programs are transferred from the HI program to the SMI program, effective January 1998. The HI program will continue to cover the first 100 visits following a hospital stay of at least 3 consecutive days or a skilled nursing facility stay. The cost to the SMI trust fund of the transferred services will phase in over a 6-year period, while the cost of the home health services will phase into the SMI premium over 7 years.
• Revised home health care cost limits are to be established in such a manner that the savings associated with the temporary freeze on cost limit updates, provided for by the Omnibus Budget Reconciliation Act of 1993, are recaptured. Home health per-visit cost limits are to be reduced from 112 percent of the mean labor-related and non-labor per visit costs for freestanding agencies to 105 percent of the median of such costs. In addition, home health agencies will be paid the lowest of actual costs, the per-visit limits, or a blended agency- specific per-beneficiary annual limit. Home health services will now be paid based on the location where the service is provided rather than where the service is billed. A prospective payment system for home health services must be developed and implemented, effective for cost reporting periods beginning on or after October 1, 1999.
• The current limits on the number of hours and days that home health care can be provided have been clarified. “Part-time” is now defined as skilled nursing and home health aide services (combined) furnished any number of days per week, for less than 8 hours per day and 28 or fewer hours per week. “Intermittent” is now defined as skilled nursing care provided for fewer than 7 days each week, or less than 8 hours each day (combined) for 21 days or less.
Medicare Amendments
23
• Hospice prospective payment rates will be updated by the hospital market basket percentage increase minus 1 percentage point for each of the fiscal years 1998 through 2002. Hospice benefit periods are restructured to include two 90-day periods, followed by an unlimited number of 60-day periods. The specific, statutory time frame for completion of physicians’ certification for admission to a hospice is eliminated; physicians now will be required to certify that a beneficiary is terminally ill at the beginning of the initial 90-day period.
• A number of prevention initiatives have been enacted. Most of these items will be provided in an outpatient setting or in a physician’s office, and thus fall under the auspices of the SMI program. However, the HI program is affected by the following prevention initiatives: (1) annual prostate cancer screening is covered for male beneficiaries over age 50, effective January 1, 2000; and (2) coverage is provided for colorectal screening procedures, including fecal-occult blood tests and flexible sigmoidoscopies for beneficiaries age 50 and over, colonoscopy for beneficiaries at high risk for colorectal cancer, and other procedures (including screening barium enemas) as the Secretary determines appropriate. (The Secretary subsequently published a notice announcing that screening barium enemas will be covered under certain circumstances.)
• The provision making Medicare the secondary payer for disabled beneficiaries in large group health plans, which was previously scheduled to expire after September 30, 1998, has been made permanent. The provision making Medicare secondary payer for the first 12 months of entitlement due to end-stage renal disease (ESRD), which had been extended on a temporary basis (through September 30, 1998) to include the first 18 months of entitlement, has been extended, permanently, to include the first 30 months of entitlement on the basis of ESRD. Recovery of Medicare secondary payer amounts can now be sought within 3 years after the date of service, notwithstanding any other claims filing time limits under an employer group health plan.
• A Medicare Payment Advisory Commission has been established, to review and make recommendations on Medicare payment policies and to report on issues affecting the Medicare program. The Prospective Payment Assessment Commission has been abolished.
• A commission to conduct a study on long-term reform and the financing challenges facing the Medicare program has been

Actuarial Analysis
24
established. This National Bipartisan Commission on the Future of Medicare must report their findings and recommendations to the President and the Congress by March 1, 1999.
Detailed information regarding these changes and other less significant changes can be found in documents prepared by and for the Congress. The actuarial estimates shown in this report reflect the anticipated effects of these changes.
B. NATURE OF THE TRUST FUND
The Federal Hospital Insurance Trust Fund was established on July 30, 1965, as a separate account in the United States Treasury. All the financial operations of the HI program are handled through this fund.
The primary source of income to the trust fund is amounts appropriated to it under permanent authority on the basis of taxes paid by workers, their employers, and individuals with self-employment income, in work covered by the HI program. The coverage of the HI program includes workers covered under the OASDI program, those covered under the Railroad Retirement program, and certain federal, state, and local employees not otherwise covered under the OASDI program.
All employees in employment covered by the program and their employers are required to pay taxes on the wages of individual workers, including cash tips. All covered self-employed persons are required to pay taxes on their net self-employment income.
HI taxes are payable on a covered individual’s total wages and self-employment income, without limit. For calendar years prior to 1994, taxes were computed on one’s annual earnings up to a specified maximum annual amount, called the maximum tax base.
The HI tax rates applicable to taxable earnings in each of the calendar years 1966 and later are shown in table II.B1. For 1999 and later, the tax rates shown are the rates scheduled in the provisions of present law. The tax bases for 1966-1993 are also shown.

Nature of the Trust Fund
25
Table II.B1.—Tax Rates and Maximum Tax Bases
Tax rate
(Percent of taxable earnings)
Calendar years Maximum tax base Employees and employers, each Self-employed
Past experience: 1966 $6,600 0.35 0.35 1967 6,600 0.50 0.50
1968-71 7,800 0.60 0.60 1972 9,000 0.60 0.60 1973 10,800 1.00 1.00 1974 13,200 0.90 0.90 1975 14,100 0.90 0.90 1976 15,300 0.90 0.90 1977 16,500 0.90 0.90 1978 17,700 1.00 1.00 1979 22,900 1.05 1.05 1980 25,900 1.05 1.05 1981 29,700 1.30 1.30 1982 32,400 1.30 1.30 1983 35,700 1.30 1.30 1984 37,800 1.30 2.60 1985 39,600 1.35 2.70 1986 42,000 1.45 2.90 1987 43,800 1.45 2.90 1988 45,000 1.45 2.90 1989 48,000 1.45 2.90 1990 51,300 1.45 2.90 1991 125,000 1.45 2.90 1992 130,200 1.45 2.90 1993 135,000 1.45 2.90
1994-98 no limit 1.45 2.90
Scheduled in present law: 1999 & later no limit 1.45 2.90
All taxes are collected by the Internal Revenue Service and deposited in the general fund of the Treasury as internal revenue collections. The taxes received are automatically appropriated, on an estimated basis, to the trust fund. The exact amount of taxes received is not known initially since HI taxes, OASDI taxes, and individual income taxes are not separately identified in collection reports received by the Treasury Department. Periodic adjustments are subsequently made to the extent that the estimates are found to differ from the amounts of taxes actually payable on the basis of reported earnings.
Up to 85 percent of an individual’s or couple’s OASDI benefits may be subject to federal income taxation if their income exceeds certain thresholds. The income tax revenue attributable to the first 50 percent of OASDI benefits is allocated to the OASI and DI trust funds. The revenue associated with the amount between 50 and 85 percent of benefits is allocated to the HI trust fund.
Actuarial Analysis
26
Another substantial source of trust fund income is interest credited from investments in government securities held by the fund. The investment procedures of the fund are described later in this section.
The income and expenditures of the trust fund are also affected by the provisions of the Railroad Retirement Act which provide for a system of coordination and financial interchange between the Railroad Retirement program and the HI program. This financial interchange states that the Railroad Board and the Secretary of Health and Human Services (HHS) determine a transfer which would place the HI trust fund in the same position in which it would have been if railroad employment had always been covered under the Social Security Act.
The Social Security Act grants certain wage credits to individuals who serve in the military. Section 217(g) of the Act provides for periodic transfers between the general fund of the Treasury and the HI trust fund, if needed to adjust prior payments for the costs arising from wage credits granted for military service prior to 1957. Section 229(b) authorizes annual payments from the general fund of the Treasury equivalent to the combined employee and employer payroll taxes that would be paid on the current year’s wage credits if such credits were covered wages.
Two sections of the statute authorize HI benefits for certain uninsured persons aged 65 and over. Section 103 of the Social Security Amendments of 1965 provided entitlement to HI benefits to almost all persons aged 65 and over, or near that age, when the HI program began operations. Section 278 of the Tax Equity and Fiscal Responsibility Act of 1982 added similar transitional entitlement for those federal employees who would retire before having a chance to earn sufficient quarters of Medicare-qualified federal employment. The costs of such coverage, including administrative expenses, are paid initially from the HI trust fund, with subsequent reimbursement from the general fund of the Treasury.
Section 1818 of the Social Security Act provides that certain persons not eligible for HI protection either on an insured basis or on the uninsured basis described in the previous paragraph may obtain protection by enrolling in the program and paying a monthly premium.
Section 201(I) of the Social Security Act authorizes the Managing Trustee to accept and deposit in the trust fund unconditional money gifts or bequests made for the benefit of the fund or any activity financed through the fund.

Nature of the Trust Fund
27
Expenditures for benefit payments and administrative expenses under the HI program are paid from the trust fund. All expenses incurred by the Department of HHS, the Social Security Administration (SSA), and the Treasury Department in carrying out the provisions of Title XVIII of the Social Security Act pertaining to the HI program and of the Internal Revenue Code relating to the collection of taxes are charged to the trust fund. The Secretary of HHS certifies benefit payments to the Managing Trustee, who makes the payments from the trust fund. Administrative expenses are allocated and charged to each of the four trust funds—OASI, DI, HI, and SMI—on the basis of provisional estimates. Similarly, the expenses of administering other programs of HCFA are also allocated and charged to the general fund of the Treasury on a provisional basis. Periodically, as actual experience develops and is analyzed, the allocations of administrative expenses are adjusted by interfund transfers. This adjustment includes transfers between the HI and SMI trust funds and the program management general fund account, with appropriate interest allowances.
The Social Security Act authorizes the Secretary of HHS to develop and conduct a broad range of experiments and demonstration projects designed to determine various methods of increasing efficiency and economy in providing health care services, while maintaining the quality of such services, under the HI and SMI programs. The costs of such experiments and demonstration projects are paid from the HI and SMI trust funds.
The Health Insurance Portability and Accountability Act of 1996 established a Health Care Fraud and Abuse Control Account within the HI trust fund. Monies derived from the fraud and abuse control program are transferred from the general fund of the Treasury to the HI trust fund. Amounts necessary to carry out certain functions of the fraud and abuse control program, subject to specific limits, are appropriated from the HI trust fund to the Health Care Fraud and Abuse Control Account, from which they are disbursed to fund those functions.
Congress has authorized expenditures from the trust funds for construction, rental and lease, or purchase contracts of office buildings and related facilities for use in connection with the administration of the HI program. Both the capital costs of construction financed directly from the trust fund and the rental and lease or purchase contract costs of acquiring facilities are included in trust fund expenditures. Whatever the manner of acquisition, the net worth of facilities and other fixed capital assets is not carried in the statement of assets of the trust fund
Actuarial Analysis
28
presented in this report. This is because the value of fixed capital assets does not represent funds available for benefit or administrative expenditures and, therefore, is not considered in assessing the actuarial status of the funds.
That portion of the trust fund which, in the judgment of the Managing Trustee, is not required to meet current expenditures for benefits and administration, is invested, on a daily basis, primarily in interest-bearing obligations of the U.S. Government (including special public-debt obligations described below). Investments may also be made in obligations guaranteed as to both principal and interest by the United States, including certain federally sponsored agency obligations that are designated in the laws authorizing their issuance as lawful investments for fiduciary and trust funds under the control and authority of the United States or any officer of the United States. These obligations may be acquired on original issue at the issue price or by purchase of outstanding obligations at their market price.
The Social Security Act authorizes the issuance of special public-debt obligations for purchase exclusively by the trust fund. The law requires that such special public-debt obligations shall bear interest at a rate based on the average market yield (computed on the basis of market quotations as of the end of the calendar month immediately preceding the date of such issue) on all marketable interest-bearing obligations of the United States forming a part of the public debt which are not due or callable until after the expiration of 4 years from the end of such month.
From December 29, 1981 until January 1, 1988, the Social Security Act authorized borrowing among the OASI, DI, and HI trust funds when necessary “to best meet the need for financing the benefit payments” from the three funds. Interfund loans under the borrowing authority were made to the OASI trust fund from the DI and HI trust funds in 1982, and were fully repaid with interest by May 1986. Currently, no further provision for interfund borrowing exists.
C. OPERATIONS OF THE TRUST FUND, FISCAL YEAR 1997
A statement of the revenue and disbursements of the Federal Hospital Insurance Trust Fund in fiscal year 1997, and of the assets of the fund at the beginning and end of the fiscal year, is presented in table II.C1.
The total assets of the trust fund amounted to $125,338 million on September 30, 1996. During fiscal year 1997, total revenue amounted

Operations of the Trust Fund
29
to $128,548 million, and total disbursements were $137,836 million. Total assets thus decreased by $9,287 million during the year to $116,050 million on September 30, 1997.
Table II.C1.—Statement of Operations of the HI Trust Fund During Fiscal Year 1997 [In thousands]
Total assets of the trust fund, beginning of period ............................ $125,337,597 Revenue:
Appropriation of employment taxes ................................... $112,739,156 Refund of employment taxes ....................................... 2,900 Deposits arising from State agreements ............................... -17,273 Income from taxation of OASDI benefits ............................... 3,558,000 Interest on investments ........................................... 9,718,414 Premiums collected from voluntary participants .......................... 1,278,943 Transfer from Railroad Retirement account ............................. 379,700 Reimbursement, transitional uninsured coverage ......................... 481,000 Military service credits of 1997 ...................................... 69,580 Reimbursement, program management general fund ...................... 115,825 Interest on reimbursements, SSA1 ................................... -208 Interest on reimbursements, HCFA1 .................................. -29 Interest on reimbursements, Railroad Retirement ........................ 39,387 Other ........................................................ 320 Gifts ......................................................... 7 Fraud and abuse control receipts:
Criminal fines ................................................. 46,162 Civil monetary penalties ......................................... 733 Civil penalties and damages ...................................... 88,828 Fraud and abuse appropriation for FBI............................... 47,000
Total revenue ....................................................
$128,548,444
Disbursements: Benefit payments .............................................. $136,174,807 Administrative expenses: ........................................
Treasury administrative expenses ................................ 41,667 Salaries and expenses, SSA2 ................................... 530,518 Salaries and expenses, HCFA3 .................................. 619,984 Salaries and expenses, Office of the Secretary, HHS .................. 8,449 Prospective Payment Assessment Commission 2,774
Fraud and abuse control expenses: ................................. Medicare integrity ............................................ 374,514 HHS Office of Inspector General ................................. 33,798 Department of Justice ......................................... 2,177 FBI ...................................................... 47,000
Total disbursements .................................................
$137,835,687
Total assets of the trust fund, end of period $116,050,354 1A positive figure represents a transfer to the HI trust fund from the other trust funds. A negative figure represents a transfer from the HI trust fund to the other funds. 2For facilities, goods, and services provided by SSA. 3Includes administrative expenses of the intermediaries.
Note: Totals do not necessarily equal the sum of rounded components.

Actuarial Analysis
30
Included in total revenue during fiscal year 1997 was $112,739 million representing taxes appropriated to the trust fund. Adjustments to the estimates of refunded taxes for prior years resulted in a payment of $2.9 million to the trust fund. As an offset, $17.3 million was transferred from the trust fund to State and local governments representing overpayments from previous State agreements for coverage of State and local government employees.
Total HI payroll tax income amounted to $112,725 million, representing an increase of 5.4 percent over the amount of $106,934 million for the preceding 12-month period. This growth in tax income resulted primarily from the higher level of earnings in covered employment together with a significant increase in the number of covered workers in the labor force.
Income from the taxation of OASDI benefits, as described in section II.B, amounted to $3,558 million in fiscal year 1997.
Section II.B referred to provisions under which the HI trust fund is to be reimbursed from the general fund of the Treasury for costs of paying benefits on behalf of certain uninsured persons. The reimbursement in fiscal year 1997 amounted to $481 million ($405 million for the non-federal uninsured and $76 million for the federal uninsured), consisting of $478 million for benefit payments and $3 million for administrative expenses.
Section II.B referred to provisions of the Social Security Act under which certain persons not otherwise eligible for HI protection may obtain such protection by enrolling in the program and paying a monthly premium. Premiums collected from such voluntary participants in fiscal year 1997 amounted to about $1,279 million.
In accordance with the provisions of the Railroad Retirement Act, a transfer of about $380 million in principal and $21 million in interest from the Railroad Retirement program’s Social Security Equivalent Benefit Account to the HI trust fund balanced the two systems as of September 30, 1996, as described in section II.B. This amount, together with interest to the date of transfer amounting to about $18 million, was transferred to the trust fund in June 1997.
In accordance with provisions for the appropriation to the trust fund of amounts equivalent to HI taxes on 1997 noncontributory military wage credits as discussed in section II.B, the trust fund was credited on July 1, 1997 with $70 million.

Operations of the Trust Fund
31
Section II.B referred to the health care fraud and abuse control program established by the Health Insurance Portability and Accountability Act of 1996. During fiscal year 1997, the trust fund was credited with $183 million in receipts from this program.
The remaining $9,834 million of revenue consisted almost entirely of interest credited from the investments held by the trust fund.
Of the $137,836 million in total disbursements, $136,175 million represented benefits paid directly from the trust fund for health services covered under Title XVIII of the Social Security Act. Benefit payments increased 9.7 percent in fiscal year 1997 over the corresponding amount of $124,088 million paid during the preceding 12 months.
The remaining $1,661 million of disbursements was for administrative expenses. This amount includes $457 million for the health care fraud and abuse control program, which was discussed in section II.B.
Table II.C2 compares the actual experience in fiscal year 1997 with the estimates presented in the 1996 and 1997 annual reports. A number of factors can contribute to differences between estimates and subsequent actual experience. In particular, actual values for key economic and other variables can differ from assumed levels, and legislative and regulatory changes may be adopted subsequent to a report’s preparation. The comparison in table II.C2 indicates that actual HI tax income was slightly higher than estimated in both the 1996 and 1997 reports. Actual HI benefit payments in fiscal year 1997 were very close to the amounts estimated in both the 1996 and 1997 reports.
Table II.C2.—Comparison of Actual and Estimated Operations of the HI Trust Fund, Fiscal Year 1997
[Dollar amounts in millions]
Comparison of actual experience with estimates for fiscal
year 1997 published in–
1997 report 1996 report
Item Actual
amount Estimated amount1
Actual as percentage of
estimate Estimated amount1
Actual as percentage of
estimate
Payroll tax $112,725 $111,625 101 $109,620 103 Benefit payments 136,175 136,326 100 137,199 99 1Under the intermediate assumptions.
Table II.C3 shows the total assets of the fund and their distribution at the end of fiscal years 1996 and 1997. The assets of the HI trust fund at the end of fiscal year 1996 totaled $125,338 million, consisting of

Actuarial Analysis
32
$125,805 million in the form of obligations of the U.S. Government and an undisbursed balance of -$467 million. The assets of the HI trust fund at the end of fiscal year 1997 totaled $116,050 million, consisting of $116,621 million in the form of U.S. Government obligations and an undisbursed balance of -$570 million.
Table II.C3.—Assets of the HI Trust Fund, by Type, at the End of Fiscal Years 1996 and 19971
September 30, 1996 September 30, 1997
Investments in public-debt obligations sold only to the trust funds (special issues):
Certificates of indebtedness: 7.125-percent, 1997 .................. $2,852,372,000.00 —— 6.625-percent, 1998 .................. —— $1,837,929,000.00
Bonds: 6.250-percent, 1998 .................. 363,197,000.00 —— 6.250-percent, 1999-2008 .............. 11,816,905,000.00 11,816,905,000.00 6.500-percent, 1998 .................. 263,989,000.00 —— 6.500-percent, 1999-2010 .............. 11,941,136,000.00 11,941,136,000.00 6.875-percent,2011 ................... —— 2,166,172,000.00 7.000-percent, 2011 .................. 3,368,466,000.00 3,368,466,000.00 7.250-percent, 1998 .................. 225,130,000.00 —— 7.250-percent, 1999-2009 .............. 11,024,548,000.00 11,024,548,000.00 7.375-percent, 1998 .................. 867,961,000.00 —— 7.375-percent, 1999-2007 .............. 15,128,615,000.00 15,128,615,000.00 8.125-percent, 1998 .................. 901,273,000.00 —— 8.125-percent, 1999-2006 .............. 13,625,883,000.00 13,625,883,000.00 8.375-percent, 1998 .................. 1,231,586,000.00 —— 8.375-percent, 1999-2001 .............. 4,972,324,000.00 4,972,324,000.00 8.625-percent, 1998 .................. 686,251,000.00 —— 8.625-percent, 1999-2002 .............. 5,254,152,000.00 5,254,152,000.00 8.750-percent, 1998 .................. 2,185,752,000.00 —— 8.750-percent, 1999-2005 .............. 23,760,145,000.00 23,760,145,000.00 9.250-percent, 1997-1998 .............. 1,684,162,000.00 —— 9.250-percent, 1999-2003 .............. 8,368,112,000.00 8,368,112,000.00 10.375-percent, 1998 ................. 427,022,000.00 —— 10.375-percent, 1999-2000 ............. 1,704,588,000.00 1,704,588,000.00 10.750 -percent, 1998 ................. 588,410,000.00 539,116,000.00 13.250-percent, 1997 ................. 1,450,129,000.00 —— 13.750-percent, 1998-1999 ............. 1,112,678,000.00 1,112,678,000.00
Total investments .......................
$125,804,786,000.00
116,620,769,000.00 Undisbursed balance2 .................... -467,189,212.53 -570,414,626.73
Total assets ........................... $125,337,596,787.08 116,050,354,373.27 1Certificates of indebtedness and bonds are carried at par value, which is the same as book value. 2Negative figures represent an extension of credit against securities to be redeemed within the following few days.
The effective annual rate of interest earned by the assets of the HI trust fund during the 12 months ending on December 31, 1997, was 8.0 percent. Interest on special issues is paid semiannually on June 30 and December 31. The interest rate on public-debt obligations issued for

Expected Operations
33
purchase by the trust fund in June 1997 was 6.875 percent, payable semiannually.
D. EXPECTED SHORT-RANGE OPERATIONS AND STATUS OF THE TRUST FUND
The Social Security Act requires the Board of Trustees to report annually to the Congress on the operations and status of the HI trust fund during the preceding fiscal year, as was addressed in the preceding section, and on the expected operations and status of the trust fund during the current and next 2 fiscal years. In this section, estimates of the operations and financial status of the trust fund for the next 10 years are presented. The Act also requires that the annual report include a statement of the actuarial status of the trust fund, and that requirement is fulfilled in the next section. In both this and the next section, no changes are assumed to occur in the present statutory provisions and regulations under which the HI program operates.
The estimates shown in this section provide detailed information concerning the short-range financial status of the trust fund. The estimated levels of future income and outgo, annual differences between income and outgo, and annual trust fund balances are explained and examined in this section. Two particularly important short-range solvency measures for the HI trust fund, the estimated year of exhaustion and the test of short-range financial adequacy, are also discussed.
Estimates are shown under three alternative sets of assumptions, to illustrate the sensitivity of future program costs to different economic and demographic trends. The sets of assumptions used are intended to portray a reasonable range of possible future trends. Due to the uncertainty inherent in such projections, however, the actual operations of the HI trust fund in the future could differ significantly from these estimates.
The expected operations of the HI trust fund during fiscal years 1998 to 2007, together with the past experience of the program, are shown in table II.D1. The estimates shown in this table are based on the intermediate set of assumptions. The assumptions underlying the intermediate projections are presented in section II.F of this report.
The increases in estimated income shown in table II.D1 primarily reflect increases in payroll tax income to the trust fund. As noted previously,
Actuarial Analysis
34
the primary source of financing for the HI program is the payroll tax on covered earnings paid by employees, employers, and self-employed workers. While the payroll tax rate is scheduled to remain constant, covered earnings are assumed to increase in every year through the year 2007 under the intermediate assumptions. These increases in taxable earnings are due primarily to projected increases in the number of workers covered by the program and in the average earnings of these workers.
Over the next 10 years, most of the smaller sources of financing for the HI trust fund increase as well. These income sources include income from the taxation of OASDI benefits, transfers from the Railroad Retirement program, and premium income for other noninsured persons who voluntarily enroll in the program. Transfers from general revenue to reimburse the program for the cost of providing HI benefits to certain noninsured persons are decreasing. Transfers made from general revenue to reimburse the HI trust fund for the costs associated with certain military wage credits are projected to remain constant over the short-range period. More detailed descriptions of these sources of income can be found in section II.B.
Interest earnings have been a significant source of income to the trust fund, and have indeed ranked second only to payroll taxes, for many years. It is important to note that as the trust fund continues to decline, with disbursements in excess of income, the assets held by the trust fund will be redeemed to pay its obligations. In the absence of corrective legislation, interest earnings would therefore diminish steadily, and eventually cease to exist as a source of income for the HI program.
Disbursements for benefits are projected to increase in fiscal years 1998 to 2007. For the first few years, benefits increase at a slower rate than income to the program due to the savings provisions of the Balanced Budget Act of 1997. After this time, benefits increase at a faster rate than income for the remainder of the short-range period. The expenditures for benefit payments shown in table II.D1 differ somewhat from those shown in the President’s Fiscal Year 1999 Budget. The estimates shown in this report are based on more recent demographic and economic projections, and they do not reflect the implementation of proposed changes in laws and regulations which were included in the budget. The expenditures for benefit payments shown in this section are based on the assumption that for fiscal years 1999 and later, the prospective payment rates will be increased in accordance with Public Law 105-33, the Balanced Budget Act of 1997; for fiscal year 1998, the
Expected Operations
35
prospective payment rates have already been determined in accordance with the same statute.
The estimated disbursements of the HI trust fund reflect the transfer of certain home health services from the HI program to the SMI program, as specified by the Balanced Budget Act of 1997. Beginning January 1998, for individuals enrolled in both HI and SMI, the HI program will cover the first 100 home health visits following a hospital or skilled nursing facility stay of at least 3 days, and coverage of all other home health services for these individuals will be transferred from the HI program to the SMI program. Therefore, all benefit payments for those services being transferred will be paid out of the SMI trust fund beginning January 1998. However, for the 6-year period 1998 through 2003, sums of money will also be transferred from the HI trust fund to the SMI trust fund to phase in the financial impact of the transfer of these services. The sums of money to be transferred will be determined so that the net additional expenditures of the SMI trust fund will be 1/6 of the cost of the services being transferred in 1998, incremented by an additional 1/6 of the cost each year thereafter. The benefit payments for 1998 through 2003 shown throughout this report represent the sum of the aggregate HI benefit payments and the funds transferred to the SMI trust fund.
The actual operations of the HI program are organized, in general, on a calendar year basis. Earnings subject to taxation and the applicable tax rates are established by calendar year, as are the inpatient hospital deductible and other cost-sharing amounts. The projected operations of the trust fund on a calendar year basis are shown in table II.D2, according to the same assumptions as used in table II.D1. The projected decline of the HI trust fund can be seen in both tables.
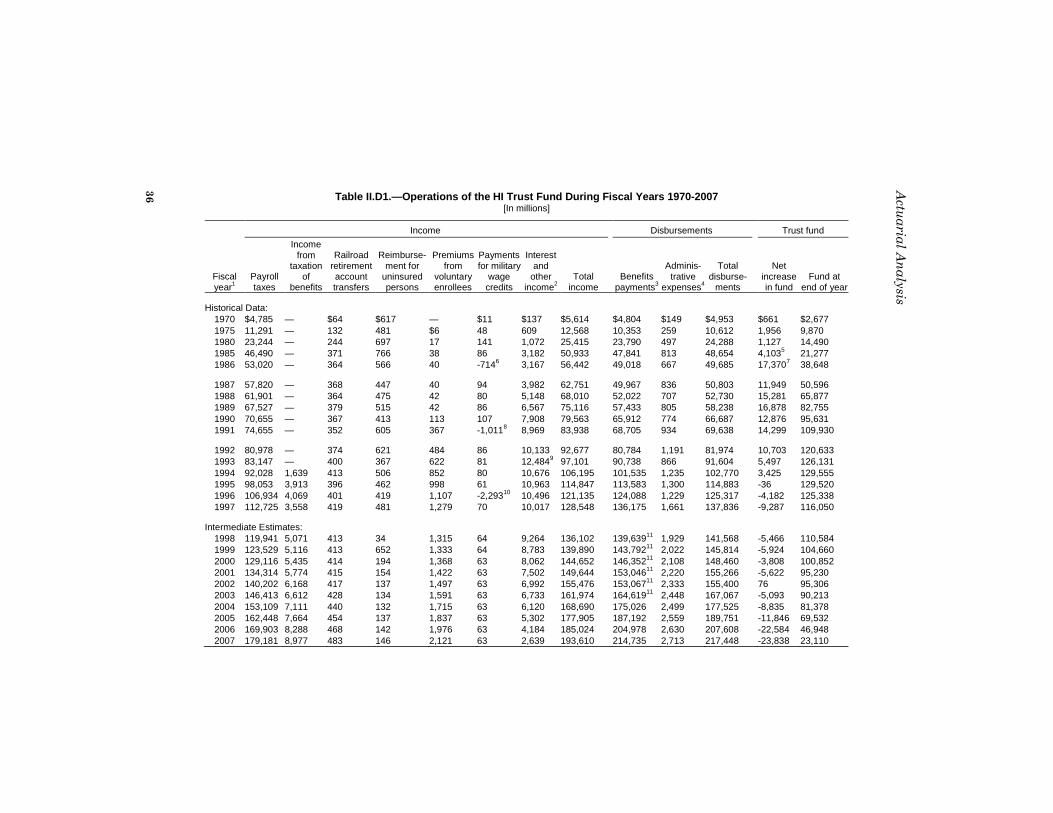
Table II.D1.—Operations of the HI Trust Fund During Fiscal Years 1970-2007 [In millions]
Income Disbursements Trust fund
Fiscal year1
Payroll taxes
Income from
taxation of
benefits
Railroad retirement account transfers
Reimburse-ment for
uninsured persons
Premiums from
voluntary enrollees
Payments for military
wage credits
Interest and
other income2
Total income
Benefits payments3
Adminis-trative
expenses4
Total disburse-
ments
Net increase in fund
Fund at end of year
Historical Data: 1970 $4,785 — $64 $617 — $11 $137 $5,614 $4,804 $149 $4,953 $661 $2,677 1975 11,291 — 132 481 $6 48 609 12,568 10,353 259 10,612 1,956 9,870 1980 23,244 — 244 697 17 141 1,072 25,415 23,790 497 24,288 1,127 14,490 1985 46,490 — 371 766 38 86 3,182 50,933 47,841 813 48,654 4,103 5 21,277 1986 53,020 — 364 566 40 -714 6 3,167 56,442 49,018 667 49,685 17,370 7 38,648
1987 57,820 — 368 447 40 94 3,982 62,751 49,967 836 50,803 11,949 50,596 1988 61,901 — 364 475 42 80 5,148 68,010 52,022 707 52,730 15,281 65,877 1989 67,527 — 379 515 42 86 6,567 75,116 57,433 805 58,238 16,878 82,755 1990 70,655 — 367 413 113 107 7,908 79,563 65,912 774 66,687 12,876 95,631 1991 74,655 — 352 605 367 -1,011 8 8,969 83,938 68,705 934 69,638 14,299 109,930
1992 80,978 — 374 621 484 86 10,133 92,677 80,784 1,191 81,974 10,703 120,633 1993 83,147 — 400 367 622 81 12,484 9 97,101 90,738 866 91,604 5,497 126,131 1994 92,028 1,639 413 506 852 80 10,676 106,195 101,535 1,235 102,770 3,425 129,555 1995 98,053 3,913 396 462 998 61 10,963 114,847 113,583 1,300 114,883 -36 129,520 1996 106,934 4,069 401 419 1,107 -2,293 10 10,496 121,135 124,088 1,229 125,317 -4,182 125,338 1997 112,725 3,558 419 481 1,279 70 10,017 128,548 136,175 1,661 137,836 -9,287 116,050
Intermediate Estimates: 1998 119,941 5,071 413 34 1,315 64 9,264 136,102 139,639 11 1,929 141,568 -5,466 110,584 1999 123,529 5,116 413 652 1,333 64 8,783 139,890 143,792 11 2,022 145,814 -5,924 104,660 2000 129,116 5,435 414 194 1,368 63 8,062 144,652 146,352 11 2,108 148,460 -3,808 100,852 2001 134,314 5,774 415 154 1,422 63 7,502 149,644 153,046 11 2,220 155,266 -5,622 95,230 2002 140,202 6,168 417 137 1,497 63 6,992 155,476 153,067 11 2,333 155,400 76 95,306 2003 146,413 6,612 428 134 1,591 63 6,733 161,974 164,619 11 2,448 167,067 -5,093 90,213 2004 153,109 7,111 440 132 1,715 63 6,120 168,690 175,026 2,499 177,525 -8,835 81,378 2005 162,448 7,664 454 137 1,837 63 5,302 177,905 187,192 2,559 189,751 -11,846 69,532 2006 169,903 8,288 468 142 1,976 63 4,184 185,024 204,978 2,630 207,608 -22,584 46,948 2007 179,181 8,977 483 146 2,121 63 2,639 193,610 214,735 2,713 217,448 -23,838 23,110
36
Actuarial Analysis
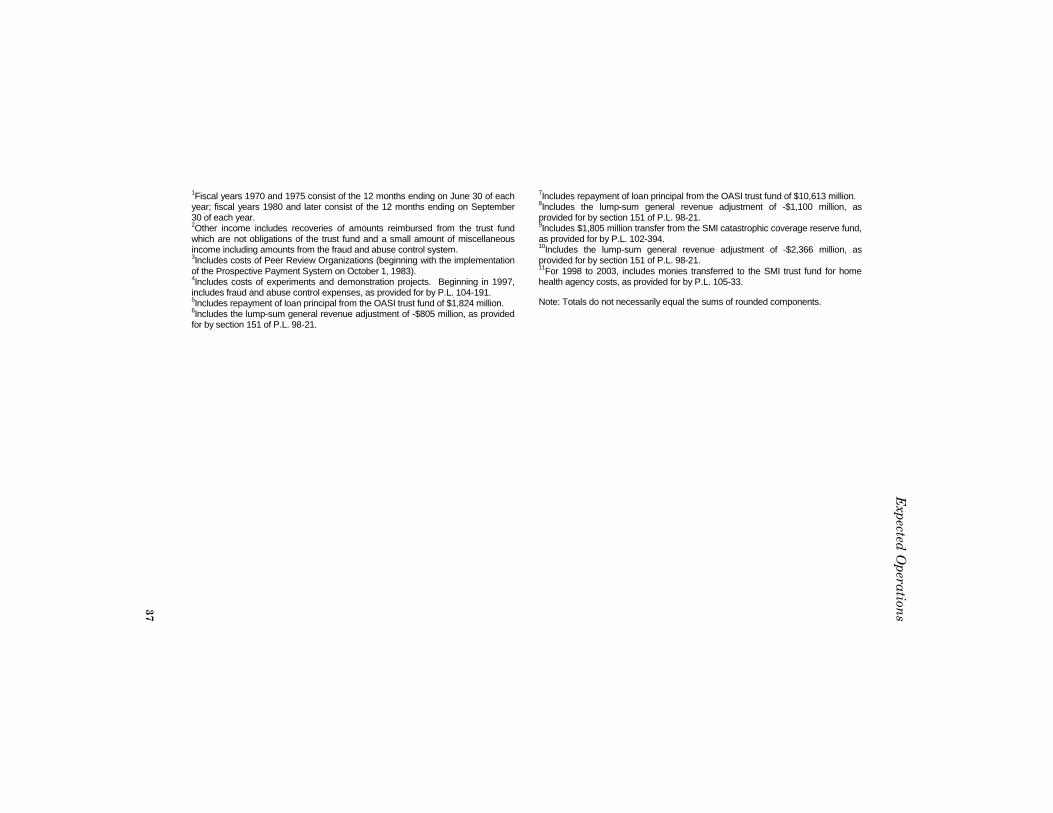
1Fiscal years 1970 and 1975 consist of the 12 months ending on June 30 of each year; fiscal years 1980 and later consist of the 12 months ending on September 30 of each year. 2Other income includes recoveries of amounts reimbursed from the trust fund which are not obligations of the trust fund and a small amount of miscellaneous income including amounts from the fraud and abuse control system. 3Includes costs of Peer Review Organizations (beginning with the implementation of the Prospective Payment System on October 1, 1983). 4Includes costs of experiments and demonstration projects. Beginning in 1997, includes fraud and abuse control expenses, as provided for by P.L. 104-191. 5Includes repayment of loan principal from the OASI trust fund of $1,824 million. 6Includes the lump-sum general revenue adjustment of -$805 million, as provided for by section 151 of P.L. 98-21.
7Includes repayment of loan principal from the OASI trust fund of $10,613 million. 8Includes the lump-sum general revenue adjustment of -$1,100 million, as provided for by section 151 of P.L. 98-21. 9Includes $1,805 million transfer from the SMI catastrophic coverage reserve fund, as provided for by P.L. 102-394. 10Includes the lump-sum general revenue adjustment of -$2,366 million, as provided for by section 151 of P.L. 98-21. 11For 1998 to 2003, includes monies transferred to the SMI trust fund for home health agency costs, as provided for by P.L. 105-33.
Note: Totals do not necessarily equal the sums of rounded components.
37
Expected O
perations
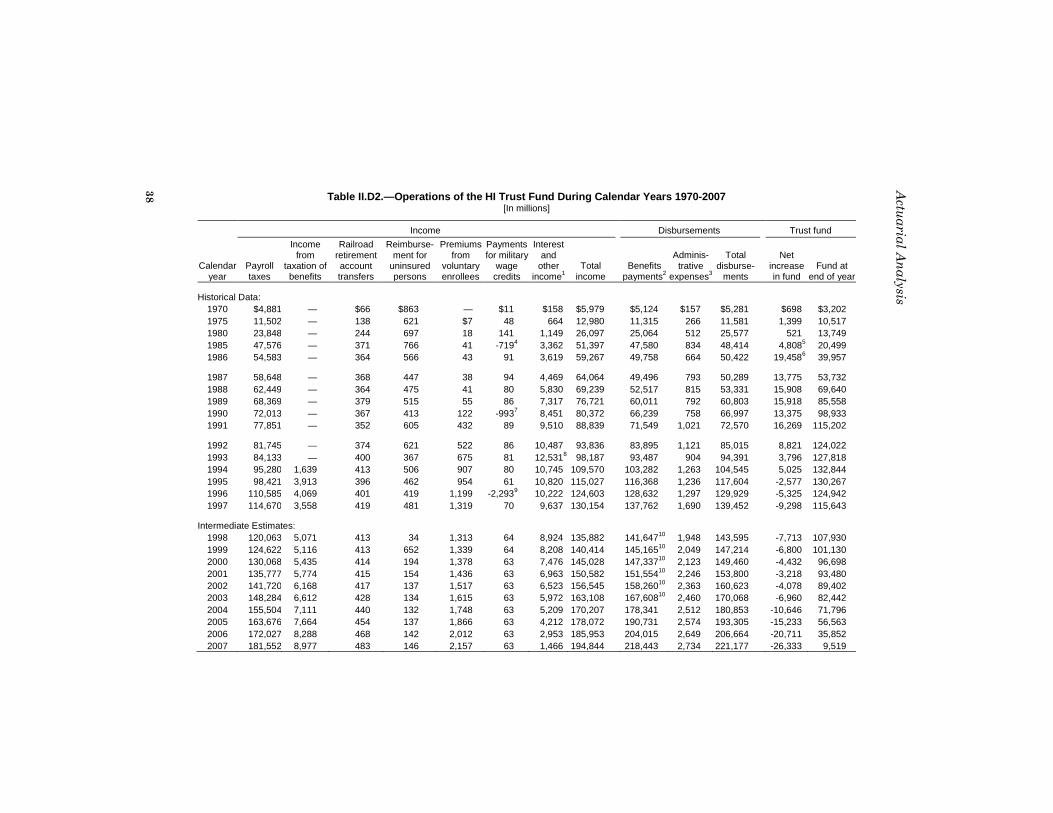
Table II.D2.—Operations of the HI Trust Fund During Calendar Years 1970-2007 [In millions]
Income Disbursements Trust fund
Calendar year
Payroll taxes
Income from
taxation of benefits
Railroad retirement account transfers
Reimburse-ment for
uninsured persons
Premiums from
voluntary enrollees
Payments for military
wage credits
Interest and
other income1
Total income
Benefits payments2
Adminis-trative
expenses3
Total disburse-
ments
Net increase in fund
Fund at end of year
Historical Data: 1970 $4,881 — $66 $863 — $11 $158 $5,979 $5,124 $157 $5,281 $698 $3,202 1975 11,502 — 138 621 $7 48 664 12,980 11,315 266 11,581 1,399 10,517 1980 23,848 — 244 697 18 141 1,149 26,097 25,064 512 25,577 521 13,749 1985 47,576 — 371 766 41 -719 4 3,362 51,397 47,580 834 48,414 4,808 5 20,499 1986 54,583 — 364 566 43 91 3,619 59,267 49,758 664 50,422 19,458 6 39,957
1987 58,648 — 368 447 38 94 4,469 64,064 49,496 793 50,289 13,775 53,732 1988 62,449 — 364 475 41 80 5,830 69,239 52,517 815 53,331 15,908 69,640 1989 68,369 — 379 515 55 86 7,317 76,721 60,011 792 60,803 15,918 85,558 1990 72,013 — 367 413 122 -993 7 8,451 80,372 66,239 758 66,997 13,375 98,933 1991 77,851 — 352 605 432 89 9,510 88,839 71,549 1,021 72,570 16,269 115,202
1992 81,745 — 374 621 522 86 10,487 93,836 83,895 1,121 85,015 8,821 124,022 1993 84,133 — 400 367 675 81 12,531 8 98,187 93,487 904 94,391 3,796 127,818 1994 95,280 1,639 413 506 907 80 10,745 109,570 103,282 1,263 104,545 5,025 132,844 1995 98,421 3,913 396 462 954 61 10,820 115,027 116,368 1,236 117,604 -2,577 130,267 1996 110,585 4,069 401 419 1,199 -2,293 9 10,222 124,603 128,632 1,297 129,929 -5,325 124,942 1997 114,670 3,558 419 481 1,319 70 9,637 130,154 137,762 1,690 139,452 -9,298 115,643
Intermediate Estimates: 1998 120,063 5,071 413 34 1,313 64 8,924 135,882 141,647 10 1,948 143,595 -7,713 107,930 1999 124,622 5,116 413 652 1,339 64 8,208 140,414 145,165 10 2,049 147,214 -6,800 101,130 2000 130,068 5,435 414 194 1,378 63 7,476 145,028 147,337 10 2,123 149,460 -4,432 96,698 2001 135,777 5,774 415 154 1,436 63 6,963 150,582 151,554 10 2,246 153,800 -3,218 93,480 2002 141,720 6,168 417 137 1,517 63 6,523 156,545 158,260 10 2,363 160,623 -4,078 89,402 2003 148,284 6,612 428 134 1,615 63 5,972 163,108 167,608 10 2,460 170,068 -6,960 82,442 2004 155,504 7,111 440 132 1,748 63 5,209 170,207 178,341 2,512 180,853 -10,646 71,796 2005 163,676 7,664 454 137 1,866 63 4,212 178,072 190,731 2,574 193,305 -15,233 56,563 2006 172,027 8,288 468 142 2,012 63 2,953 185,953 204,015 2,649 206,664 -20,711 35,852 2007 181,552 8,977 483 146 2,157 63 1,466 194,844 218,443 2,734 221,177 -26,333 9,519
Actuarial Analysis
38
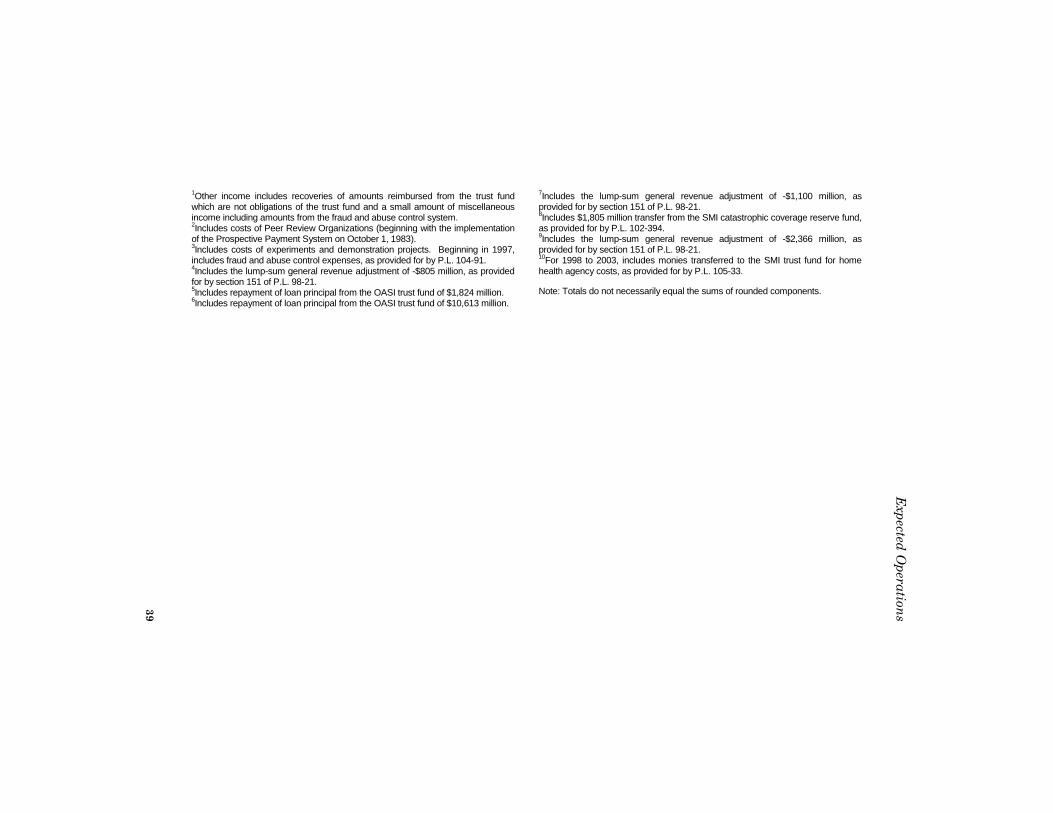
1Other income includes recoveries of amounts reimbursed from the trust fund which are not obligations of the trust fund and a small amount of miscellaneous income including amounts from the fraud and abuse control system. 2Includes costs of Peer Review Organizations (beginning with the implementation of the Prospective Payment System on October 1, 1983). 3Includes costs of experiments and demonstration projects. Beginning in 1997, includes fraud and abuse control expenses, as provided for by P.L. 104-91. 4Includes the lump-sum general revenue adjustment of -$805 million, as provided for by section 151 of P.L. 98-21. 5Includes repayment of loan principal from the OASI trust fund of $1,824 million. 6Includes repayment of loan principal from the OASI trust fund of $10,613 million.
7Includes the lump-sum general revenue adjustment of -$1,100 million, as provided for by section 151 of P.L. 98-21. 8Includes $1,805 million transfer from the SMI catastrophic coverage reserve fund, as provided for by P.L. 102-394. 9Includes the lump-sum general revenue adjustment of -$2,366 million, as provided for by section 151 of P.L. 98-21. 10For 1998 to 2003, includes monies transferred to the SMI trust fund for home health agency costs, as provided for by P.L. 105-33.
Note: Totals do not necessarily equal the sums of rounded components.
39
Expected O
perations
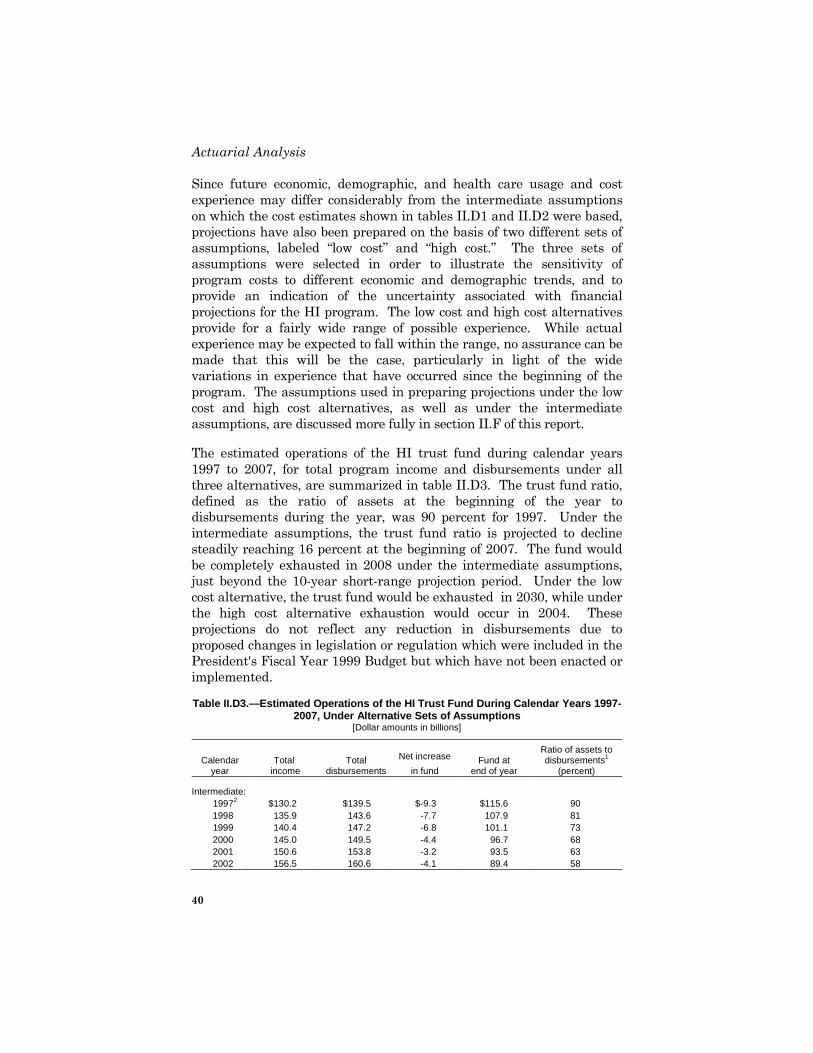
Actuarial Analysis
40
Since future economic, demographic, and health care usage and cost experience may differ considerably from the intermediate assumptions on which the cost estimates shown in tables II.D1 and II.D2 were based, projections have also been prepared on the basis of two different sets of assumptions, labeled “low cost” and “high cost.” The three sets of assumptions were selected in order to illustrate the sensitivity of program costs to different economic and demographic trends, and to provide an indication of the uncertainty associated with financial projections for the HI program. The low cost and high cost alternatives provide for a fairly wide range of possible experience. While actual experience may be expected to fall within the range, no assurance can be made that this will be the case, particularly in light of the wide variations in experience that have occurred since the beginning of the program. The assumptions used in preparing projections under the low cost and high cost alternatives, as well as under the intermediate assumptions, are discussed more fully in section II.F of this report.
The estimated operations of the HI trust fund during calendar years 1997 to 2007, for total program income and disbursements under all three alternatives, are summarized in table II.D3. The trust fund ratio, defined as the ratio of assets at the beginning of the year to disbursements during the year, was 90 percent for 1997. Under the intermediate assumptions, the trust fund ratio is projected to decline steadily reaching 16 percent at the beginning of 2007. The fund would be completely exhausted in 2008 under the intermediate assumptions, just beyond the 10-year short-range projection period. Under the low cost alternative, the trust fund would be exhausted in 2030, while under the high cost alternative exhaustion would occur in 2004. These projections do not reflect any reduction in disbursements due to proposed changes in legislation or regulation which were included in the President's Fiscal Year 1999 Budget but which have not been enacted or implemented.
Table II.D3.—Estimated Operations of the HI Trust Fund During Calendar Years 1997-2007, Under Alternative Sets of Assumptions
[Dollar amounts in billions]
Calendar year
Total income
Total disbursements
Net increase in fund
Fund at end of year
Ratio of assets to disbursements1
(percent)
Intermediate: 1997 2 $130.2 $139.5 $-9.3 $115.6 90 1998 135.9 143.6 -7.7 107.9 81 1999 140.4 147.2 -6.8 101.1 73 2000 145.0 149.5 -4.4 96.7 68 2001 150.6 153.8 -3.2 93.5 63 2002 156.5 160.6 -4.1 89.4 58
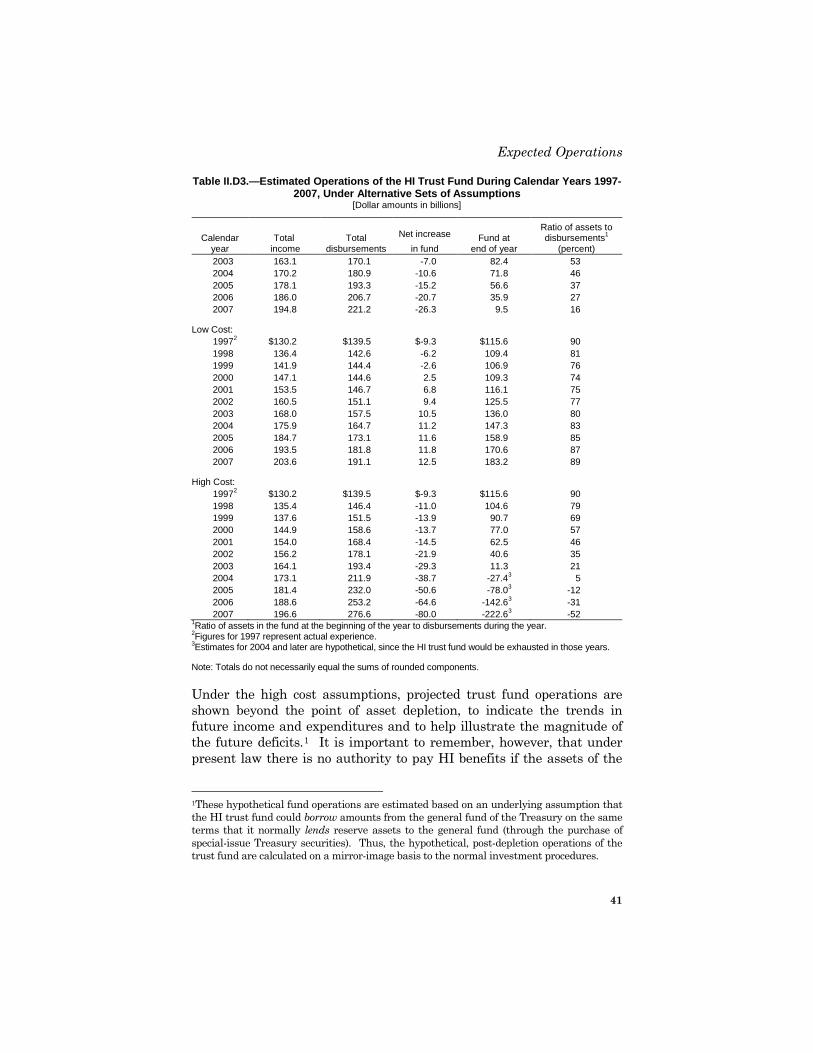
Expected Operations
41
Table II.D3.—Estimated Operations of the HI Trust Fund During Calendar Years 1997-2007, Under Alternative Sets of Assumptions
[Dollar amounts in billions]
Calendar year
Total income
Total disbursements
Net increase in fund
Fund at end of year
Ratio of assets to disbursements1
(percent) 2003 163.1 170.1 -7.0 82.4 53 2004 170.2 180.9 -10.6 71.8 46 2005 178.1 193.3 -15.2 56.6 37 2006 186.0 206.7 -20.7 35.9 27 2007 194.8 221.2 -26.3 9.5 16
Low Cost: 1997 2 $130.2 $139.5 $-9.3 $115.6 90 1998 136.4 142.6 -6.2 109.4 81 1999 141.9 144.4 -2.6 106.9 76 2000 147.1 144.6 2.5 109.3 74 2001 153.5 146.7 6.8 116.1 75 2002 160.5 151.1 9.4 125.5 77 2003 168.0 157.5 10.5 136.0 80 2004 175.9 164.7 11.2 147.3 83 2005 184.7 173.1 11.6 158.9 85 2006 193.5 181.8 11.8 170.6 87 2007 203.6 191.1 12.5 183.2 89
High Cost: 1997 2 $130.2 $139.5 $-9.3 $115.6 90 1998 135.4 146.4 -11.0 104.6 79 1999 137.6 151.5 -13.9 90.7 69 2000 144.9 158.6 -13.7 77.0 57 2001 154.0 168.4 -14.5 62.5 46 2002 156.2 178.1 -21.9 40.6 35 2003 164.1 193.4 -29.3 11.3 21 2004 173.1 211.9 -38.7 -27.4 3 5 2005 181.4 232.0 -50.6 -78.0 3 -12 2006 188.6 253.2 -64.6 -142.6 3 -31 2007 196.6 276.6 -80.0 -222.6 3 -52
1Ratio of assets in the fund at the beginning of the year to disbursements during the year. 2Figures for 1997 represent actual experience. 3Estimates for 2004 and later are hypothetical, since the HI trust fund would be exhausted in those years.
Note: Totals do not necessarily equal the sums of rounded components.
Under the high cost assumptions, projected trust fund operations are shown beyond the point of asset depletion, to indicate the trends in future income and expenditures and to help illustrate the magnitude of the future deficits.1 It is important to remember, however, that under present law there is no authority to pay HI benefits if the assets of the
1These hypothetical fund operations are estimated based on an underlying assumption that the HI trust fund could borrow amounts from the general fund of the Treasury on the same terms that it normally lends reserve assets to the general fund (through the purchase of special-issue Treasury securities). Thus, the hypothetical, post-depletion operations of the trust fund are calculated on a mirror-image basis to the normal investment procedures.
Actuarial Analysis
42
HI trust fund are depleted. In practice, benefits could not be paid until additional trust fund income was subsequently received. Initially, this would cause a delay in reimbursing hospitals and other health care providers for the services delivered to HI beneficiaries. However, the length of the delay would increase very rapidly, quickly reaching a point where providers would be unable to continue providing care to beneficiaries. Thus, the possibility of depletion of the HI trust fund must be treated as a very grave consequence and corrected through legislation at the earliest opportunity.
The projections in table II.D3 indicate that without corrective legislation, the assets of the HI trust fund would be exhausted within the next 6 to 10 years under the high cost and intermediate assumptions. The fact that exhaustion would occur under a fairly broad range of future economic conditions, and is expected to occur in the relatively near future, indicates the importance of addressing the HI trust fund’s financial imbalance.
The Board of Trustees has established an explicit test of short-range financial adequacy. The requirements of this test are as follows: If the HI trust fund ratio is at least 100 percent at the beginning of the projection period, then it must be projected to remain at or above 100 percent throughout the 10-year projection period; alternatively, if the fund ratio is initially less than 100 percent, it must be projected to reach a level of at least 100 percent within 5 years (and the trust fund not be depleted at any time during this period) and then remain at or above 100 percent throughout the remainder of the 10-year period. This test is applied to trust fund projections made under the intermediate assumptions.
Failure of the trust fund to meet this test is an indication that the solvency of the program over the next 10 years is in question and that action is needed to improve the short-range financial adequacy of the program. As can be seen from table II.D3, this short-range test is not met. The trust fund ratio, which was below the 100-percent level at the beginning of 1998, is projected to decline steadily throughout the next 10 years and the trust fund is projected to be exhausted in 2008 under the intermediate assumptions.
The ratios of assets in the HI trust fund at the beginning of each calendar year to total disbursements during that year are shown in table II.D4 for all past years since the beginning of the program. Figure II.D1 shows these historical trust fund ratios and the projected ratios under the three sets of assumptions. Figure II.D2 shows end-of-year trust
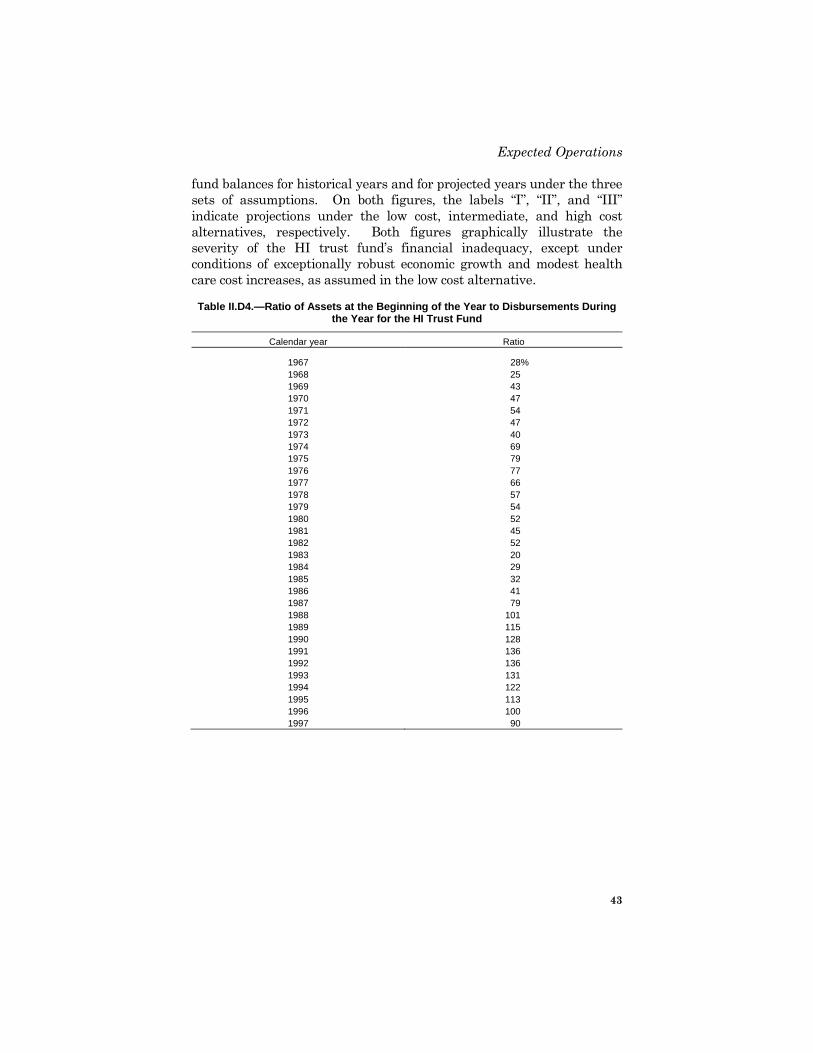
Expected Operations
43
fund balances for historical years and for projected years under the three sets of assumptions. On both figures, the labels “I”, “II”, and “III” indicate projections under the low cost, intermediate, and high cost alternatives, respectively. Both figures graphically illustrate the severity of the HI trust fund’s financial inadequacy, except under conditions of exceptionally robust economic growth and modest health care cost increases, as assumed in the low cost alternative.
Table II.D4.—Ratio of Assets at the Beginning of the Year to Disbursements During the Year for the HI Trust Fund
Calendar year Ratio
1967 28% 1968 25 1969 43 1970 47 1971 54 1972 47 1973 40 1974 69 1975 79 1976 77 1977 66 1978 57 1979 54 1980 52 1981 45 1982 52 1983 20 1984 29 1985 32 1986 41 1987 79 1988 101 1989 115 1990 128 1991 136 1992 136 1993 131 1994 122 1995 113 1996 100 1997 90

Actuarial Analysis
44
Figure II.D1.—HI Trust Fund Balance at Beginning of Year as a Percentage of Annual Expenditures
I
II
0%
20%
40%
60%
80%
100%
120%
140%
160%
1965 1970 1975 1980 1985 1990 1995 2000 2005 2010
III
Estimated Historical
Beginning of January
Figure II.D2.—HI Trust Fund Balance at End-of-Year [In billions]
$0
$50
$100
$150
$200
1965 1970 1975 1980 1985 1990 1995 2000 2005
Historical Estimated
III
I
II
End of December
Expected Operations
45
The Trustees’ test of short-range financial adequacy is stringent. It is designed to provide an early warning that a trust fund may face financial difficulties in the coming years. As indicated by the projections above, a more important concern is the depletion of the HI trust fund. Corrective legislation is needed in the relatively near future to ensure the continued payment of HI benefits when due.
As suggested by the historical asset levels shown in table II.D4 and figures II.D1 and II.D2, the Trustees’ short-range test for HI has seldom been met.2 For many years, the HI trust fund has been projected to become depleted within the next decade or so, as a result of increases in health care costs and utilization that generally exceed increases in the HI payroll taxes that support the program. Over the years, asset exhaustion has been postponed by enactment of legislation to increase trust fund revenue and/or reduce the rate of growth in program expenditures. As a result of the periodic corrective legislation, the program has operated satisfactorily even though it has not met the Trustees’ short-range test.
Nonetheless, the test represents a desirable goal for the financial status of social insurance programs. The Trustees have recommended that fund assets be maintained at a level of at least 100 percent of annual program expenditures. Such a level is estimated to provide a cushion of roughly 5 years in the event that program income falls short of expenditures, thereby allowing time for policy makers to devise and implement legislative corrections. Thus, while the short-range test is stringent, it is intended to ensure that health care benefits continue to be available without interruption to the millions of aged and disabled Americans who rely on such coverage.
2The test was introduced by the Board of Trustees in 1991.
E. ACTUARIAL STATUS OF THE TRUST FUND
In section II.D, the expected operations of the HI program over the next 10 years were presented. In this section, the actuarial status of the trust fund, or the adequacy of the scheduled financing to support program costs well into the future, is examined under the three alternative sets of assumptions. The assumptions used in preparing projections are summarized in section II.F of this report.
Actuarial Analysis
46
The long-range actuarial status of the HI program is measured by comparing on a year-by-year basis the program’s income (from payroll taxes and income from taxation of OASDI benefits) with the corresponding incurred costs of the program, expressed as percentages of taxable payroll.3 These percentages are referred to as “income rates” and “cost rates,” respectively. For this purpose, both income and costs are projected under present law. If these two items were exactly equal in each year of the projection period and all projection assumptions were realized, then revenues would be sufficient to provide for program costs. In practice, however, tax rate schedules, which make up most of the income rate, generally are designed with rate changes occurring only at intervals of several years, rather than with continual yearly increases to match exactly with projected cost increases. To the extent that small differences between the yearly costs of the program and the corresponding income rates occur for short periods of time and are offset by subsequent differences in the reverse direction, the financing objectives can be met by maintaining an appropriate contingency reserve. In projecting costs under the program, only incurred expenditures (benefits and administrative costs) attributable to insured beneficiaries are considered, since expenditures for noninsured persons are expected to be financed through general revenue transfers and premium payments rather than through payroll taxes.
The historical costs of the HI program, expressed as percentages of taxable payroll, are shown in table II.E1. The ratio of expenditures to taxable payroll has increased from 0.94 percent in 1967 to 3.42 percent in 1997, reflecting both the higher rate of increase in medical care costs than in average earnings subject to HI taxes and the more rapid increase in the number of HI beneficiaries than in the number of covered workers.
3Taxable payroll is the total amount of wages, salaries, tips, self-employment income, and other earnings subject to the HI payroll tax.
The projected costs of the program under the intermediate assumptions, expressed as percentages of taxable payroll, and the income rates under current law for selected years over the 75-year period 1998-2072, are shown in table II.E2. Further increases in the ratio of expenditures to taxable payroll under the intermediate assumptions result from the projection that the cost of the HI program will generally continue to increase at a higher rate than taxable earnings, as discussed later in this section. An important exception is expected during 1998-2002, during which time the Balanced Budget Act of 1997 will substantially
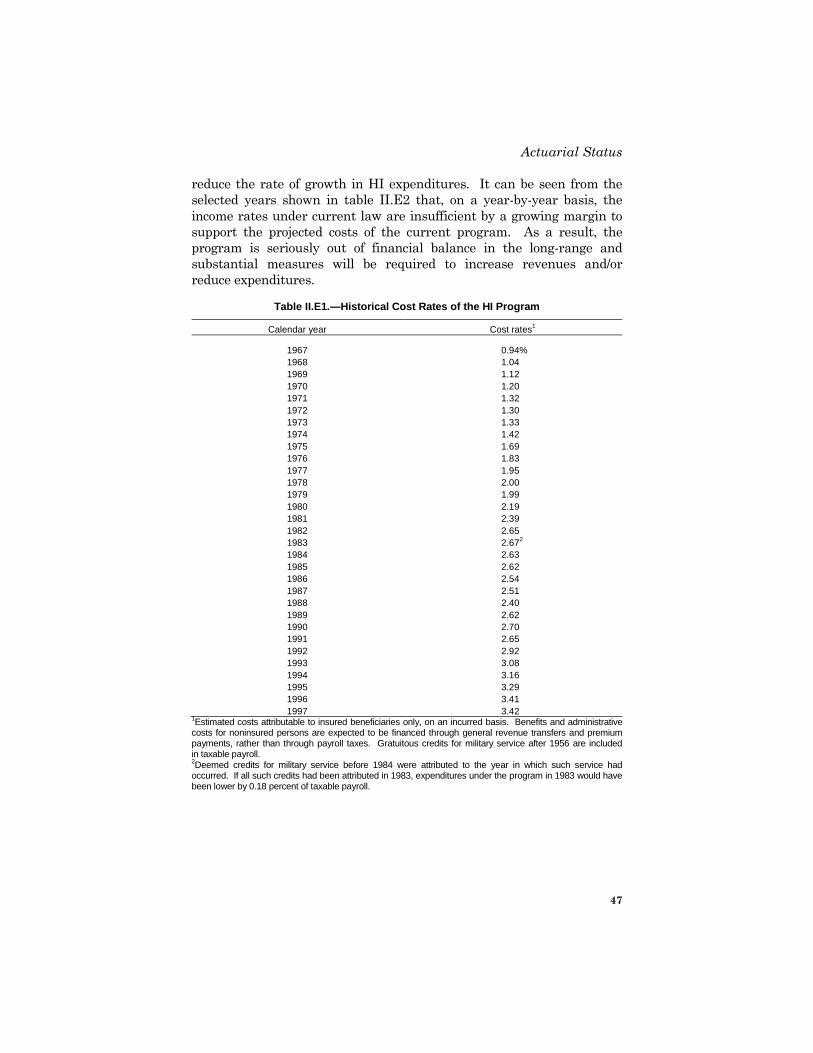
Actuarial Status
47
reduce the rate of growth in HI expenditures. It can be seen from the selected years shown in table II.E2 that, on a year-by-year basis, the income rates under current law are insufficient by a growing margin to support the projected costs of the current program. As a result, the program is seriously out of financial balance in the long-range and substantial measures will be required to increase revenues and/or reduce expenditures.
Table II.E1.—Historical Cost Rates of the HI Program
Calendar year Cost rates1
1967 0.94% 1968 1.04 1969 1.12 1970 1.20 1971 1.32 1972 1.30 1973 1.33 1974 1.42 1975 1.69 1976 1.83 1977 1.95 1978 2.00 1979 1.99 1980 2.19 1981 2.39 1982 2.65 1983 2.67 2 1984 2.63 1985 2.62 1986 2.54 1987 2.51 1988 2.40 1989 2.62 1990 2.70 1991 2.65 1992 2.92 1993 3.08 1994 3.16 1995 3.29 1996 3.41 1997 3.42
1Estimated costs attributable to insured beneficiaries only, on an incurred basis. Benefits and administrative costs for noninsured persons are expected to be financed through general revenue transfers and premium payments, rather than through payroll taxes. Gratuitous credits for military service after 1956 are included in taxable payroll. 2Deemed credits for military service before 1984 were attributed to the year in which such service had occurred. If all such credits had been attributed in 1983, expenditures under the program in 1983 would have been lower by 0.18 percent of taxable payroll.

Actuarial Analysis
48
Table II.E2.—Projected Cost and Income Rates of the HI Program1
Calendar year Cost rates2 Income rates Difference3
1998 3.40% 3.02% -0.38% 2000 3.26 3.03 -0.23 2005 3.38 3.05 -0.33 2010 3.66 3.07 -0.59 2015 4.09 3.10 -0.99 2020 4.62 3.16 -1.46 2025 5.30 3.21 -2.09 2030 5.93 3.25 -2.68 2035 6.41 3.29 -3.12 2040 6.72 3.30 -3.42 2045 6.91 3.32 -3.59 2050 7.02 3.33 -3.69 2055 7.14 3.35 -3.79 2060 7.32 3.37 -3.95 2065 7.54 3.39 -4.15 2070 7.79 3.40 -4.39
1Under the intermediate assumptions. 2See footnote 1 of table II.E1. 3Difference between the income rates and cost rates. Negative values represent deficits.
While the year-by-year comparisons discussed are necessary to measure the adequacy of the financing of the HI program, the financial status of the program is often summarized, over a specific projection period, by a single measure known as the actuarial balance. The actuarial balance of the HI program is defined to be the difference between the summarized income rate for the valuation period and the summarized cost rate for the same period. The summarized income rates, cost rates, and actuarial balance are based upon the present values of future income on an incurred basis, future insured costs on an incurred basis, and future taxable payroll. The present values are calculated by discounting the future annual amounts of income and outgo at the assumed rates of interest credited to the HI trust fund. The present values are calculated as of the beginning of the valuation period. The summarized income and cost rates over the projection period are then obtained by dividing the present value of income and cost, respectively, by the present value of taxable payroll. The difference between the summarized income rate and cost rate over the long-range projection period, after an adjustment to take into account the fund balance at the valuation date and a target trust fund balance at the end of the valuation period, is the actuarial balance. In keeping with a decision by the Board of Trustees that it is advisable to maintain a balance in the trust fund equal to a minimum of one year’s expenditures, the target trust fund balance is equal to the following year’s estimated costs at the end of the 75-year projection period. It should be noted that projecting an end-of-period target trust fund balance does not necessarily insure that the trust fund will maintain such a balance on a year-by-year basis.

Actuarial Status
49
The actuarial balance can be interpreted as the immediate, level, and permanent percentage that must be added to the current law income rates and/or subtracted from the current law cost rates throughout the entire valuation period in order for the financing to support program costs and provide for the targeted trust fund balance at the end of the projection period. The income rate increase according to this method is 2.10 percent of taxable payroll. However, if no changes were made until the year the trust fund would be exhausted, then the required increase would be 2.48 percent of taxable payroll under the intermediate assumptions.
The actuarial balances under all three alternative sets of assumptions, for the next 25, 50, and 75 years, as well as for each 25-year subperiod, are shown in table II.E3. The summarized income rate for the entire 75-year period under the intermediate assumptions is 3.26 percent of taxable payroll. The summarized cost of the program under the intermediate assumptions, for the entire 75-year period, is 5.37 percent. As a result, the HI program fails to meet the Trustees’ long-range test of close actuarial balance. (Section III.F contains a summary of the requirements of this test.)4 As noted later in this section, these projected long-range deficits are reduced significantly compared to prior projections as a result of the Balanced Budget Act of 1997.
Table II.E3.—Actuarial Balances of the HI Program, Under Three Sets of Assumptions
Intermediate assumptions
Alternative Low Cost High Cost
Projection Periods: 1998-2022:
Summarized income rate1 3.21% 3.19% 3.23% Summarized cost rate2 3.93 3.22 4.97 Actuarial balance3 -0.73 -0.03 -1.74
1998-2047: Summarized income rate1 3.23 3.19 3.28 Summarized cost rate2 4.85 3.35 7.51 Actuarial balance3 -1.61 -0.16 -4.23
1998-2072: Summarized income rate1 3.26 3.20 3.33 Summarized cost rate2 5.37 3.47 8.86 Actuarial balance3 -2.10 -0.27 -5.53
4An alternative way of calculating actuarial status, known as the modified average-cost method, is presented in section III.A. The HI trust fund also fails the test of long-range close actuarial balance using this method.

Actuarial Analysis
50
Table II.E3.—Actuarial Balances of the HI Program, Under Three Sets of Assumptions
Intermediate assumptions
Alternative Low Cost High Cost
25-year subperiods: 1998-2022:
Summarized income rate 3.08 3.06 3.09 Summarized cost rate4 3.77 3.11 4.71 Actuarial balance3 -0.69 -0.05 -1.62
2023-2047: Summarized income rate 3.27 3.19 3.35 Summarized cost rate4 6.19 3.59 11.10 Actuarial balance3 -2.92 -0.39 -7.76
2048-2072: Summarized income rate 3.37 3.24 3.54 Summarized cost rate4 7.33 3.92 14.20 Actuarial balance3 -3.97 -0.68 -10.66
1Income rates include beginning trust fund balances. 2Expenditures for benefit payments and administrative costs for insured beneficiaries, on an incurred basis, expressed as a percentage of taxable payroll, computed on the present-value basis, including the cost of attaining a trust fund balance at the end of the period equal to 100% of the following year’s estimated expenditures. 3Difference between the summarized income rate and the summarized cost rate. 4Expenditures for benefit payments and administrative costs for insured beneficiaries, on an incurred basis, expressed as a percentage of taxable payroll, computed on the present-value basis. Includes neither the trust fund balance at the beginning of the period nor the cost of attaining a non-zero trust fund balance at the end of the period.
Note: Totals do not necessarily equal the sums of rounded components.
The divergence in outcomes among the three alternatives is reflected both in the estimated operations of the trust fund on a cash basis (as discussed in section II.D) and in the 75-year summarized costs. The variations in the underlying assumptions, as shown in the next section, can be characterized as (1) moderate in terms of magnitude of the differences on a year-by-year basis and (2) persistent over the duration of the projection period. Under the low cost alternative, the summarized program cost rate for the 75-year projection period is 3.47 percent of taxable payroll and the summarized income rate is 3.20 percent of taxable payroll; hence, HI income rates provided in current law would be inadequate even under the low cost alternative. Under the high cost alternative, the summarized program cost rate for the 75-year projection period is 8.86 percent of taxable payroll, nearly three times the summarized income rate of 3.33 percent of taxable payroll.
Past experience has indicated that economic and demographic conditions as financially adverse as those assumed under the high cost alternative can, in fact, occur. None of the alternative projections should be viewed as unlikely or unrealistic. The wide range of results under the three alternatives is indicative of the uncertainty of the program’s future cost,
Actuarial Status
51
and its sensitivity to future economic and demographic conditions. Accordingly, it is important that an adequate balance be maintained in the HI trust fund as a reserve for contingencies, and that financial imbalances be addressed promptly through corrective legislation.
A valuation period of 75 years is needed to present fully the future contingencies that reasonably may be expected to occur, such as the impact of the large shift in the demographic composition of the population which will occur after the turn of the century. As table II.E2 indicates, estimated expenditures under the program, expressed as percentages of taxable payroll, increase rapidly beginning around 2010. This rapid increase in costs occurs because the relatively large number of persons born during the period between the end of World War II and the mid-1960's (known as the baby boom) will reach retirement age and begin to receive benefits, while the relatively smaller number of persons born during later years will comprise the labor force. During the last 25 years of the projection period, the projected increases in expenditures under the program stabilize somewhat.5
Costs beyond the initial 25-year projection period for the intermediate estimate are based upon the assumption that costs per unit of medical care service will increase at the same rate as that of average hourly earnings. Thus, changes in the next 50 years of the projection period primarily reflect the impact of the changing demographic composition of the population. Beyond the initial 25-year projection period, the low cost and high cost alternatives assume that program cost increases, relative to taxable payroll increases, are initially 2 percent less rapid and 2 percent more rapid, respectively, than the results under the intermediate assumptions. The initial 2-percent differentials are assumed to gradually decrease until the year 2047, when program cost increases (relative to taxable payroll) are assumed to be the same as under the intermediate assumptions.
5HI costs as a percentage of taxable payroll are projected to continue to increase, at a slower rate, due to assumed further improvements in life expectancy.
Figure II.E1 shows the year-by-year costs as a percent of taxable payroll for each of the three sets of assumptions, as well as the projected income rates. The income rates are shown only for the intermediate assumptions in order to simplify the graphical presentation and because the variation in the income rates by alternative is very small (by 2072, the annual income rates under the low cost and high cost alternatives differ by only about 0.4 percent of taxable payroll). Only small

Actuarial Analysis
52
fluctuations are projected in the income rate, as the rate of income from taxation of OASDI benefits varies only slightly for each alternative. Figure II.E1 illustrates the magnitude of the projected financial imbalance in the HI program by displaying the divergence of the program costs and income rates under each set of assumptions. In the figure, the labels “I”, “II”, and “III” indicate projections under the low cost, intermediate, and high cost alternatives, respectively.
Figure II.E1.—Estimated HI Cost and Income Rates as Percent of Taxable Payroll
0%
5%
10%
15%
20%
25%
1960 1970 1980 1990 2000 2010 2020 2030 2040 2050 2060 2070 2080
Income RateCost Rate
Historical Estimated
III
II
I
Calendar Year
The 75-year actuarial balance of the HI program, under the intermediate assumptions, is estimated to be -2.10 percent of taxable payroll, as shown in table II.E3. The actuarial balance under the intermediate assumptions as reported in the 1997 Annual Report was -4.32 percent. The major reasons for the change in the 75-year actuarial balance are summarized in table II.E4. In more detail, these changes are:
(1) Changes in valuation period: Changing the valuation period from 1997-2071 to 1998-2072 adds a very large deficit year to the calculation of the actuarial balance. The effect on the actuarial balance is -0.10 percent of taxable payroll.
(2) Updating the projection base: The cost as a percent of payroll for 1997 was less than estimated in the 1997 report.
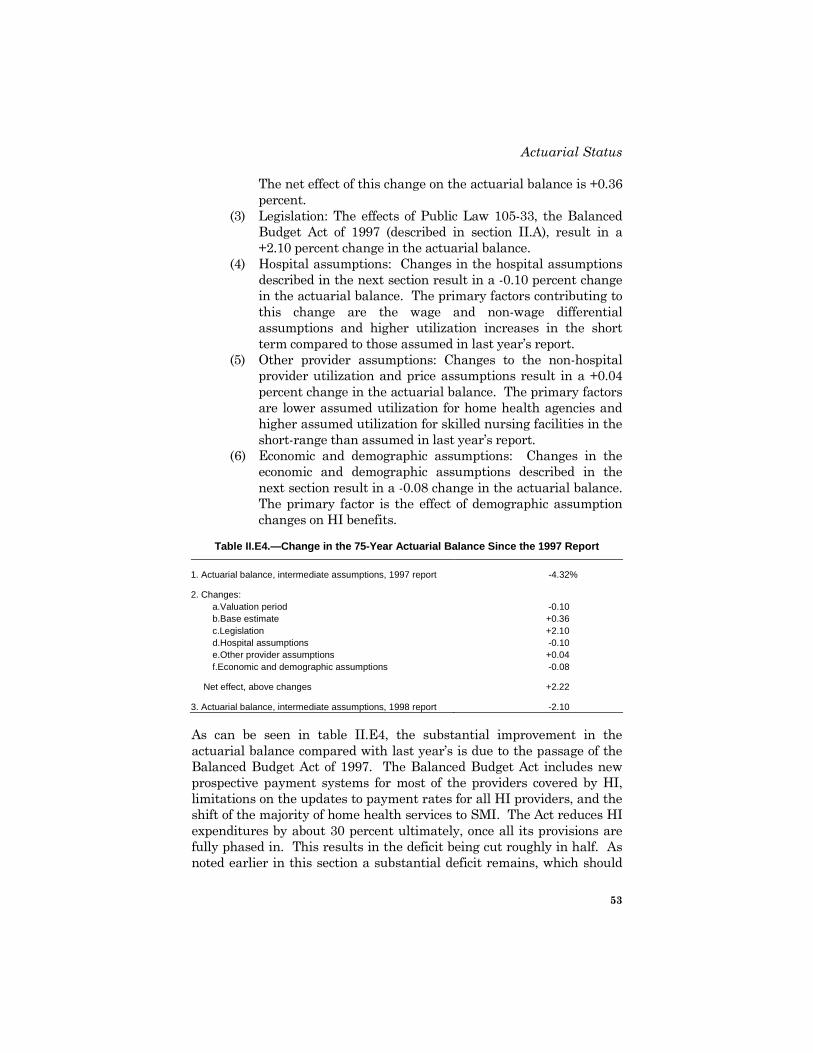
Actuarial Status
53
The net effect of this change on the actuarial balance is +0.36 percent.
(3) Legislation: The effects of Public Law 105-33, the Balanced Budget Act of 1997 (described in section II.A), result in a +2.10 percent change in the actuarial balance.
(4) Hospital assumptions: Changes in the hospital assumptions described in the next section result in a -0.10 percent change in the actuarial balance. The primary factors contributing to this change are the wage and non-wage differential assumptions and higher utilization increases in the short term compared to those assumed in last year’s report.
(5) Other provider assumptions: Changes to the non-hospital provider utilization and price assumptions result in a +0.04 percent change in the actuarial balance. The primary factors are lower assumed utilization for home health agencies and higher assumed utilization for skilled nursing facilities in the short-range than assumed in last year’s report.
(6) Economic and demographic assumptions: Changes in the economic and demographic assumptions described in the next section result in a -0.08 change in the actuarial balance. The primary factor is the effect of demographic assumption changes on HI benefits.
Table II.E4.—Change in the 75-Year Actuarial Balance Since the 1997 Report
1. Actuarial balance, intermediate assumptions, 1997 report -4.32%
2. Changes: a.Valuation period -0.10 b.Base estimate +0.36 c.Legislation +2.10 d.Hospital assumptions -0.10 e.Other provider assumptions +0.04 f.Economic and demographic assumptions -0.08
Net effect, above changes +2.22
3. Actuarial balance, intermediate assumptions, 1998 report -2.10
As can be seen in table II.E4, the substantial improvement in the actuarial balance compared with last year’s is due to the passage of the Balanced Budget Act of 1997. The Balanced Budget Act includes new prospective payment systems for most of the providers covered by HI, limitations on the updates to payment rates for all HI providers, and the shift of the majority of home health services to SMI. The Act reduces HI expenditures by about 30 percent ultimately, once all its provisions are fully phased in. This results in the deficit being cut roughly in half. As noted earlier in this section a substantial deficit remains, which should
Actuarial Analysis
54
be addressed by the National Bipartisan Commission on the Future of Medicare, which was also created by the Balanced Budget Act.
F. ACTUARIAL METHODOLOGY AND PRINCIPAL ASSUMPTIONS FOR THE HOSPITAL INSURANCE COST
ESTIMATES
This section describes the basic methodology and assumptions used in the estimates for the HI program under the intermediate assumptions. In addition, projections of program costs under two alternative sets of assumptions are presented.
1. Assumptions
The economic and demographic assumptions underlying the projections shown in this report are consistent with those in the 1998 Annual Report of the Board of Trustees of the Federal Old-Age and Survivors Insurance and Disability Insurance Trust Funds. These assumptions are described in more detail in that report.
2. Program Cost Projection Methodology
The principal steps involved in projecting the future costs of the HI program are (a) establishing the present cost of services provided to beneficiaries, by type of service, to serve as a projection base; (b) projecting increases in payments for inpatient hospital services under the program; (c) projecting increases in payments for skilled nursing, home health, and hospice services covered under the program; (d) projecting increases in payments to managed care plans; and (e) projecting increases in administrative costs. The major emphasis is directed toward expenditures for fee-for-service inpatient hospital services, which account for approximately 67 percent of total benefits.
a. Projection Base
In order to establish a suitable base from which to project the future costs of the program, the incurred payments for services provided must be reconstructed for the most recent period for which a reliable determination can be made. To do this, payments to providers must be attributed to dates of service, rather than to payment dates. In addition, the nonrecurring effects of any changes in regulations, legislation, or administration of the program and of any items affecting only the timing and flow of payments to providers must be eliminated. As a result, the

Actuarial Methodology
55
rates of increase in the incurred cost of the program differ from the increases in cash disbursements shown in tables II.D1 and II.D2.
For those expenses still reimbursed on a reasonable cost basis, the costs for covered services are determined on the basis of provider cost reports. Payments to a provider initially are made on an interim basis; to adjust interim payments to the level of retroactively determined costs, a series of payments or recoveries is effected through the course of cost settlement with the provider. The net amounts paid to date to providers in the form of cost settlements are known; however, the incomplete data available do not permit a precise determination of the exact amounts incurred during a specific period of time. Due to the time required to obtain cost reports from providers, to verify these reports, and to perform audits (where appropriate), final settlements have lagged behind the original costs by as much as several years for some providers. Hence, the final cost of services reimbursed on a reasonable cost basis has not been completely determined for the most recent years of the program, and some degree of uncertainty remains even for earlier years.
Even for inpatient hospital operating payments paid for on the basis of diagnosis-related groups (DRGs), most payments are initially made on an interim basis, and final payments are determined on the basis of bills containing detailed diagnostic information which are later submitted by the hospital.
Additional problems are posed by changes in legislation or regulation, or in administrative or reimbursement policy, which can have a substantial effect on either the amount or incidence of payment. The extent and timing of the incorporation of such changes into interim payment rates and cost settlement amounts cannot be determined precisely.
The process of allocating the various types of payments made under the program to the proper incurred period—using incomplete data and estimates of the impact of administrative actions—presents difficult problems, the solutions to which can be only approximate. Under the circumstances, the best that can be expected is that the actual incurred cost of the program for a recent period can be estimated within a few percent. This increases the projection error directly, by incorporating any error in estimating the base year into all future years.
Actuarial Analysis
56
b. Fee-for-Service Payments for Inpatient Hospital Costs
Beginning with hospital accounting years starting on or after October 1, 1983, the HI program began paying almost all participating hospitals a prospectively-determined amount for providing covered services to beneficiaries. With the exception of certain expenses reimbursed on a reasonable cost basis, as defined by law, the payment rate for each admission depends upon the DRG to which the admission belongs.
The law contemplates that the annual increase in the payment rate for each admission will be related to a hospital input price index, which measures the increase in prices for goods and services purchased by hospitals for use in providing care to hospital inpatients. In other literature, the hospital input price index is also called the hospital market basket. For fiscal year 1998, the prospective payment rates have already been determined. The projections contained in this report are based on the assumption that for fiscal years 1999-2002, the prospective payment rates will be increased by the increase in the hospital input price index, less the percentages specified by Public Law 105-33, the Balanced Budget Act of 1997. For fiscal years 2003 and later, current statute mandates that the annual increase in the payment rate per admission equal the annual increase in the hospital input price index.
Increases in aggregate payments for inpatient hospital care covered under the HI program can be analyzed in five broad categories:
(1) Labor factors—the increase in the hospital input price index which is attributable to increases in hospital workers’ hourly earnings (including fringe benefits);
(2) Non-labor factors—the increase in the hospital input price index which is attributable to factors other than hospital workers’ hourly earnings, such as the costs of energy, food, and supplies;
(3) Unit input intensity allowance—the amount added to or subtracted from the input price index (generally as a result of legislation) to yield the prospective payment update factor;
(4) Volume of services—the increase in total output of units of service (as measured by hospital admissions covered by the HI program); and

Actuarial Methodology
57
(5) Other sources—a residual category, reflecting all other factors affecting hospital cost increases (such as intensity increases).
Table II.F1 shows the estimated values of the principal components of the increases for historical periods for which data are available and the projected trends used in the estimates. The following discussions apply to projections under the intermediate assumptions, unless otherwise indicated.
Increases in hospital workers’ hourly earnings can be analyzed and projected in terms of (1) the assumed increases in hourly earnings in employment in the general economy and (2) the difference between hourly earnings increases in the general economy and the hospital hourly earnings used in the hospital input price index.6 Since the beginning of the HI program, the differential between the hospital workers’ hourly earnings and hourly earnings in the general economy has fluctuated widely. Since 1984, this differential has averaged about -0.3 percent. During the initial years of the prospective payment system, it appears that hospital hourly earnings were depressed relative to those in the general economy as hospitals adapted to the prospective payment system. This differential is assumed to fluctuate, leveling off to zero for most of the projection period.
Non-labor cost increases can similarly be analyzed in terms of a known, economy-wide price measure (the CPI) and a differential between the CPI and hospital-specific prices. This latter factor is called the hospital price input intensity increase, and reflects price increases for non-labor goods and services that hospitals purchase which do not parallel increases in the CPI. Although the price input intensity level has fluctuated erratically in the past, this differential has averaged about -0.3 percent during 1984-1996. Over the short term, hospital price input intensity is assumed to fluctuate, leveling off to zero for most of the projection period.
The final input price index is calculated as a weighted average of the labor and non-labor factors described above. The weights reflect the relative use of each factor by hospitals (currently about 60 percent labor and 40 percent non-labor).
6In establishing the hospital input price index, a “proxy” measure of hospital hourly earnings is used to estimate actual earnings.
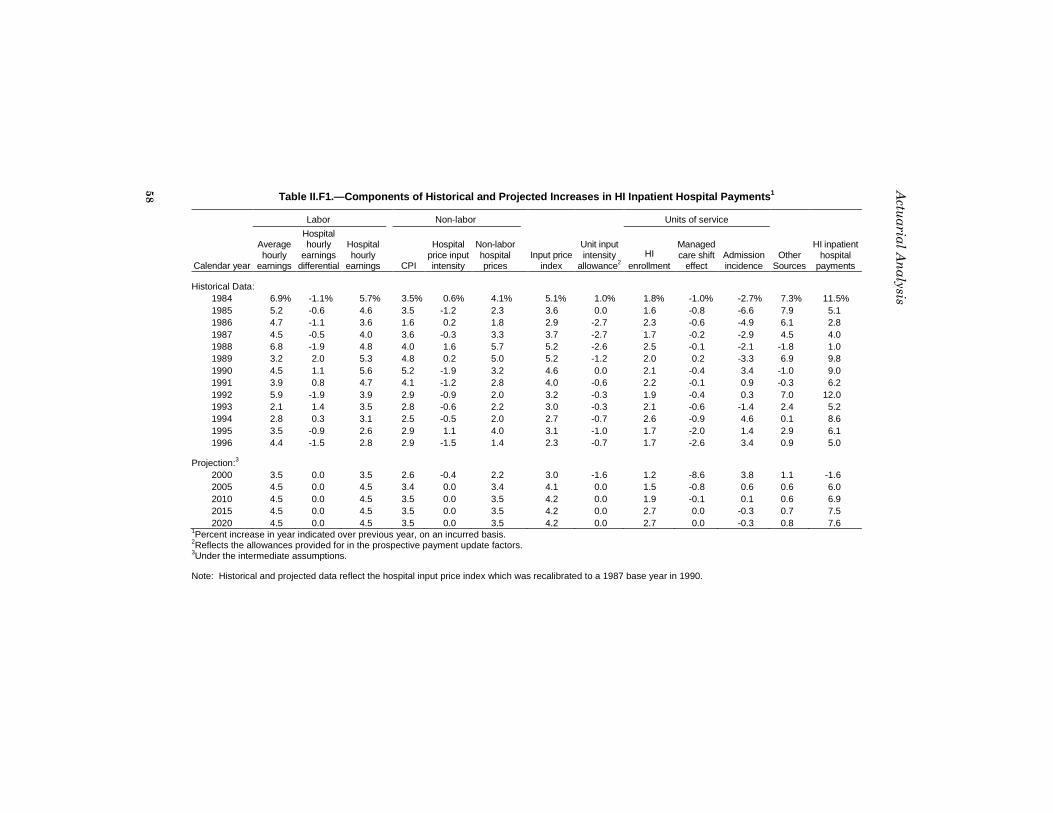
Table II.F1.—Components of Historical and Projected Increases in HI Inpatient Hospital Payments1
Labor Non-labor Units of service
Calendar year
Average hourly
earnings
Hospital hourly
earnings differential
Hospital hourly
earnings CPI
Hospital price input intensity
Non-labor hospital prices
Input price index
Unit input intensity
allowance2 HI
enrollment
Managed care shift
effect Admission incidence
Other Sources
HI inpatient hospital
payments
Historical Data: 1984 6.9% -1.1% 5.7% 3.5% 0.6% 4.1% 5.1% 1.0% 1.8% -1.0% -2.7% 7.3% 11.5% 1985 5.2 -0.6 4.6 3.5 -1.2 2.3 3.6 0.0 1.6 -0.8 -6.6 7.9 5.1 1986 4.7 -1.1 3.6 1.6 0.2 1.8 2.9 -2.7 2.3 -0.6 -4.9 6.1 2.8 1987 4.5 -0.5 4.0 3.6 -0.3 3.3 3.7 -2.7 1.7 -0.2 -2.9 4.5 4.0 1988 6.8 -1.9 4.8 4.0 1.6 5.7 5.2 -2.6 2.5 -0.1 -2.1 -1.8 1.0 1989 3.2 2.0 5.3 4.8 0.2 5.0 5.2 -1.2 2.0 0.2 -3.3 6.9 9.8 1990 4.5 1.1 5.6 5.2 -1.9 3.2 4.6 0.0 2.1 -0.4 3.4 -1.0 9.0 1991 3.9 0.8 4.7 4.1 -1.2 2.8 4.0 -0.6 2.2 -0.1 0.9 -0.3 6.2 1992 5.9 -1.9 3.9 2.9 -0.9 2.0 3.2 -0.3 1.9 -0.4 0.3 7.0 12.0 1993 2.1 1.4 3.5 2.8 -0.6 2.2 3.0 -0.3 2.1 -0.6 -1.4 2.4 5.2 1994 2.8 0.3 3.1 2.5 -0.5 2.0 2.7 -0.7 2.6 -0.9 4.6 0.1 8.6 1995 3.5 -0.9 2.6 2.9 1.1 4.0 3.1 -1.0 1.7 -2.0 1.4 2.9 6.1 1996 4.4 -1.5 2.8 2.9 -1.5 1.4 2.3 -0.7 1.7 -2.6 3.4 0.9 5.0
Projection:3 2000 3.5 0.0 3.5 2.6 -0.4 2.2 3.0 -1.6 1.2 -8.6 3.8 1.1 -1.6 2005 4.5 0.0 4.5 3.4 0.0 3.4 4.1 0.0 1.5 -0.8 0.6 0.6 6.0 2010 4.5 0.0 4.5 3.5 0.0 3.5 4.2 0.0 1.9 -0.1 0.1 0.6 6.9 2015 4.5 0.0 4.5 3.5 0.0 3.5 4.2 0.0 2.7 0.0 -0.3 0.7 7.5 2020 4.5 0.0 4.5 3.5 0.0 3.5 4.2 0.0 2.7 0.0 -0.3 0.8 7.6
1Percent increase in year indicated over previous year, on an incurred basis. 2Reflects the allowances provided for in the prospective payment update factors. 3Under the intermediate assumptions.
Note: Historical and projected data reflect the hospital input price index which was recalibrated to a 1987 base year in 1990.
58
Actuarial Analysis
Actuarial Methodology
59
For years prior to the beginning of the prospective payment system, the unit input intensity allowance has been set at 1 percent for illustrative purposes, with historical increases in excess of 1 percent allocated to other sources. For years after the beginning of the prospective payment system, the unit input intensity allowance is the allowance provided for by law in the prospective payment update factor; that is, the unit input intensity allowance is the amount added onto (or more commonly subtracted from) the input price index to yield the update factor. (It should be noted that the update factors are generally prescribed on a fiscal year basis, while table II.F1 is on a calendar year basis. Calculations have therefore been performed to estimate the unit input intensity allowance on a calendar year basis.)
For fiscal years 1998-2002, the allowances are prescribed in the Balanced Budget Act of 1997. Beginning in fiscal year 2003, the law provides that future increases in payments to participating hospitals for covered admissions will equal the increase in the hospital input price index. Thus, the unit input intensity allowance, as indicated in table II.F1, is assumed to equal zero for the rest of the years in the first 25-year projection period.
Increases in payments for inpatient hospital services also reflect increases in units (volume) of service as measured by increases in inpatient hospital admissions covered under the HI program. Increases in admissions are attributable both to increases in fee-for-service enrollment under the HI program and to increases in admission incidence (admissions per beneficiary), as shown in table II.F1. The historical and projected increases in enrollment reflect the more rapid increase in the population aged 65 and over than in the total population of the United States, and the coverage of certain disabled beneficiaries and persons with end-stage renal disease. Increases in the enrollment are expected to continue, reflecting a continuation of demographic shift into categories of the population which are eligible for HI protection. There is, however, an offsetting effect as more beneficiaries choose managed care plans. This effect is shown in the managed care shift effect column. In addition, increases in the average age of beneficiaries lead to higher levels of admission incidence. Admission incidence levels are also often affected by changes in the laws and regulations that define and guide the HI program’s coverage of inpatient hospital care.
Since the beginning of the prospective payment system, increases in inpatient hospital payments from other sources are primarily due to three factors: (1) the changes in DRG coding as hospitals continue to adjust to the prospective payment system; (2) the trend toward treating
Actuarial Analysis
60
less complicated (and thus, less expensive) cases in outpatient settings, resulting in an increase in the average prospective payment per admission; and (3) legislation affecting the payment rates. The effects of several budget reconciliation acts, sequesters as required by the Gramm-Rudman-Hollings Act, and other legislative effects are reflected in other sources, as appropriate. The assumed increase in this factor for fiscal years 1998 through 2022 is 1.0 percent, attributable to an assumed continuation of the current trend toward treating less complicated cases in outpatient settings and continued changes in DRG coding. Additionally, part of the increase from other sources can be attributed to the increase in payments for certain costs not included in the DRG payment; these costs are generally increasing at a rate faster than the input price index. Other possible sources of both relative increases and decreases in payments include (1) a shift to more or less expensive admissions (DRGs) due to changes in the demographic characteristics of the covered population; (2) changes in medical practice patterns; and (3) adjustments in the relative payment levels for various DRGs or addition/deletion of DRGs in response to changes in technology. As experience under the prospective payment system continues to develop and is further analyzed, it may be possible to establish a more predictable trend for this component.
The increases in the input price index (less any intensity allowance specified in the law), units of service, and other sources are compounded to calculate the overall increase in payments for inpatient hospital services. These overall increases are shown in the last column of table II.F1.
c. Fee-for-Service Payments for Skilled Nursing Facility (SNF), Home Health Agency (HHA), and Hospice Services
Historical experience with the number of days of care covered in SNFs under the HI program has been characterized by wide swings. The number of covered days dropped very sharply in 1970 and continued to decline through 1972. This was the result of strict enforcement of regulations separating skilled nursing care from custodial care, and primarily reflected the determination that Medicare was not liable for payment rather than reduced usage of services. The 1972 amendments extended benefits to persons who require skilled rehabilitative services regardless of their need for skilled nursing services (the former prerequisite for benefits). This change and subsequent related changes in regulations have resulted in significant increases in the number of services covered by the program. Changes made in 1988 to coverage guidelines for SNF services and expansions and changes due to the
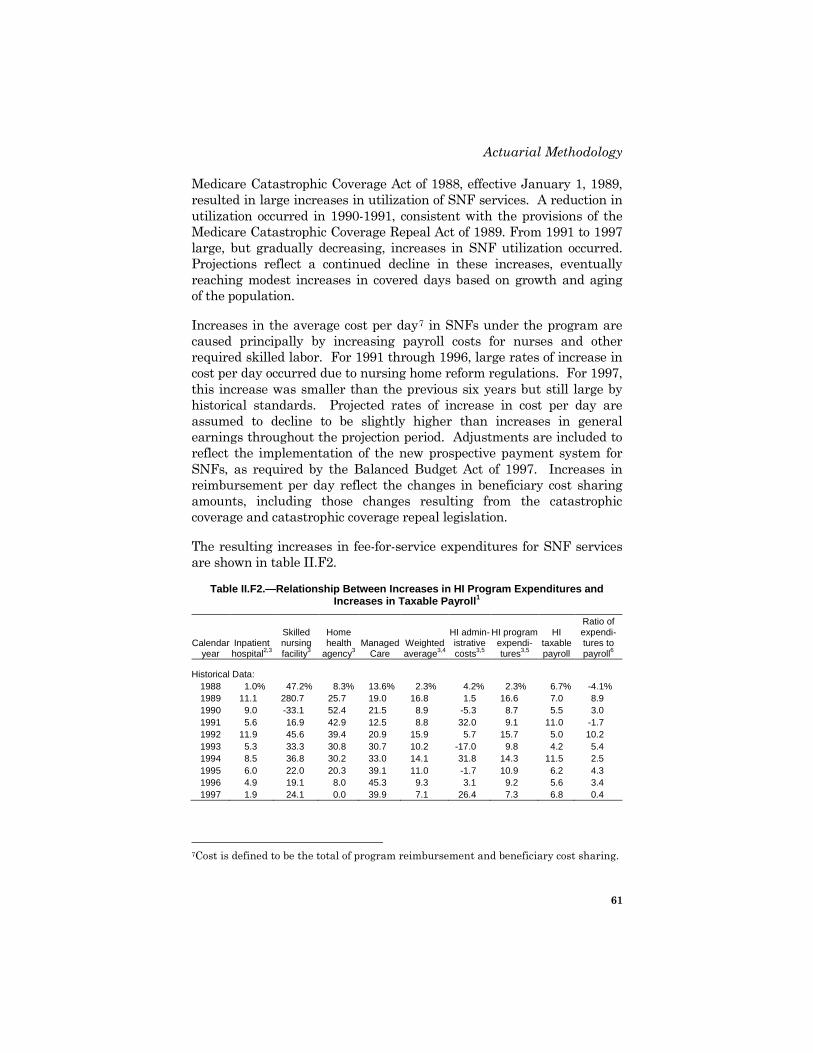
Actuarial Methodology
61
Medicare Catastrophic Coverage Act of 1988, effective January 1, 1989, resulted in large increases in utilization of SNF services. A reduction in utilization occurred in 1990-1991, consistent with the provisions of the Medicare Catastrophic Coverage Repeal Act of 1989. From 1991 to 1997 large, but gradually decreasing, increases in SNF utilization occurred. Projections reflect a continued decline in these increases, eventually reaching modest increases in covered days based on growth and aging of the population.
Increases in the average cost per day7 in SNFs under the program are caused principally by increasing payroll costs for nurses and other required skilled labor. For 1991 through 1996, large rates of increase in cost per day occurred due to nursing home reform regulations. For 1997, this increase was smaller than the previous six years but still large by historical standards. Projected rates of increase in cost per day are assumed to decline to be slightly higher than increases in general earnings throughout the projection period. Adjustments are included to reflect the implementation of the new prospective payment system for SNFs, as required by the Balanced Budget Act of 1997. Increases in reimbursement per day reflect the changes in beneficiary cost sharing amounts, including those changes resulting from the catastrophic coverage and catastrophic coverage repeal legislation.
The resulting increases in fee-for-service expenditures for SNF services are shown in table II.F2.
Table II.F2.—Relationship Between Increases in HI Program Expenditures and Increases in Taxable Payroll1
Calendar year
Inpatient hospital2,3
Skilled nursing facility3
Home health
agency3 Managed
Care Weighted average3,4
HI admin-istrative costs3,5
HI program expendi-tures3,5
HI taxable payroll
Ratio of expendi-tures to payroll6
Historical Data: 1988 1.0% 47.2% 8.3% 13.6% 2.3% 4.2% 2.3% 6.7% -4.1% 1989 11.1 280.7 25.7 19.0 16.8 1.5 16.6 7.0 8.9 1990 9.0 -33.1 52.4 21.5 8.9 -5.3 8.7 5.5 3.0 1991 5.6 16.9 42.9 12.5 8.8 32.0 9.1 11.0 -1.7 1992 11.9 45.6 39.4 20.9 15.9 5.7 15.7 5.0 10.2 1993 5.3 33.3 30.8 30.7 10.2 -17.0 9.8 4.2 5.4 1994 8.5 36.8 30.2 33.0 14.1 31.8 14.3 11.5 2.5 1995 6.0 22.0 20.3 39.1 11.0 -1.7 10.9 6.2 4.3 1996 4.9 19.1 8.0 45.3 9.3 3.1 9.2 5.6 3.4 1997 1.9 24.1 0.0 39.9 7.1 26.4 7.3 6.8 0.4
7Cost is defined to be the total of program reimbursement and beneficiary cost sharing.
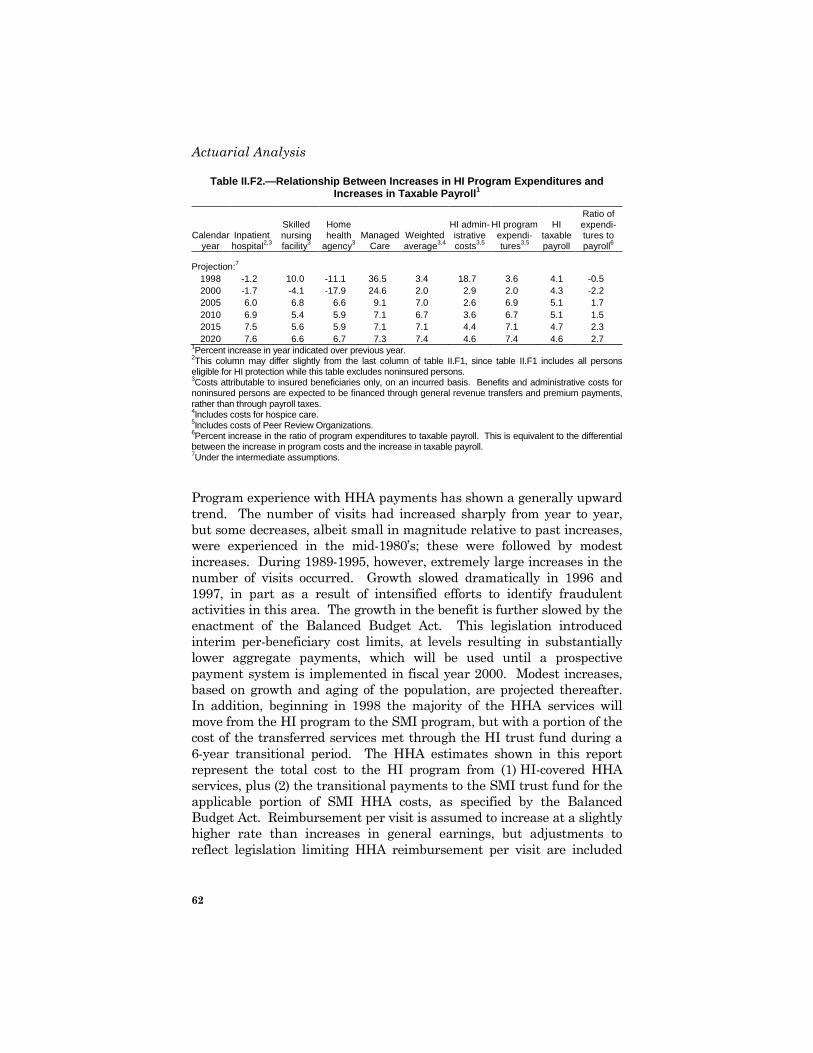
Actuarial Analysis
62
Table II.F2.—Relationship Between Increases in HI Program Expenditures and Increases in Taxable Payroll1
Calendar year
Inpatient hospital2,3
Skilled nursing facility3
Home health
agency3 Managed
Care Weighted average3,4
HI admin-istrative costs3,5
HI program expendi-tures3,5
HI taxable payroll
Ratio of expendi-tures to payroll6
Projection:7 1998 -1.2 10.0 -11.1 36.5 3.4 18.7 3.6 4.1 -0.5 2000 -1.7 -4.1 -17.9 24.6 2.0 2.9 2.0 4.3 -2.2 2005 6.0 6.8 6.6 9.1 7.0 2.6 6.9 5.1 1.7 2010 6.9 5.4 5.9 7.1 6.7 3.6 6.7 5.1 1.5 2015 7.5 5.6 5.9 7.1 7.1 4.4 7.1 4.7 2.3 2020 7.6 6.6 6.7 7.3 7.4 4.6 7.4 4.6 2.7
1Percent increase in year indicated over previous year. 2This column may differ slightly from the last column of table II.F1, since table II.F1 includes all persons eligible for HI protection while this table excludes noninsured persons. 3Costs attributable to insured beneficiaries only, on an incurred basis. Benefits and administrative costs for noninsured persons are expected to be financed through general revenue transfers and premium payments, rather than through payroll taxes. 4Includes costs for hospice care. 5Includes costs of Peer Review Organizations. 6Percent increase in the ratio of program expenditures to taxable payroll. This is equivalent to the differential between the increase in program costs and the increase in taxable payroll. 7Under the intermediate assumptions.
Program experience with HHA payments has shown a generally upward trend. The number of visits had increased sharply from year to year, but some decreases, albeit small in magnitude relative to past increases, were experienced in the mid-1980’s; these were followed by modest increases. During 1989-1995, however, extremely large increases in the number of visits occurred. Growth slowed dramatically in 1996 and 1997, in part as a result of intensified efforts to identify fraudulent activities in this area. The growth in the benefit is further slowed by the enactment of the Balanced Budget Act. This legislation introduced interim per-beneficiary cost limits, at levels resulting in substantially lower aggregate payments, which will be used until a prospective payment system is implemented in fiscal year 2000. Modest increases, based on growth and aging of the population, are projected thereafter. In addition, beginning in 1998 the majority of the HHA services will move from the HI program to the SMI program, but with a portion of the cost of the transferred services met through the HI trust fund during a 6-year transitional period. The HHA estimates shown in this report represent the total cost to the HI program from (1) HI-covered HHA services, plus (2) the transitional payments to the SMI trust fund for the applicable portion of SMI HHA costs, as specified by the Balanced Budget Act. Reimbursement per visit is assumed to increase at a slightly higher rate than increases in general earnings, but adjustments to reflect legislation limiting HHA reimbursement per visit are included
Actuarial Methodology
63
where appropriate. The resulting increases in fee-for-service expenditures for HHA services are shown in table II.F2.
Coverage of certain hospice care for terminally ill beneficiaries resulted from the enactment of the Tax Equity and Fiscal Responsibility Act of 1982; such payments are very small relative to total program benefit payments but have grown rapidly in most years. This growth rate has slowed down dramatically in the most recent years. Although detailed hospice data are scant at this time, estimates for hospice benefit payment increases are based on mandated daily payment rates and annual payment caps, and assume modest growth in the number of covered days. Increases in hospice payments are not shown separately in table II.F2 due to their extremely small contribution to the weighted average increase for all HI types of service, but are included in the average.
d. Managed Care Costs
Program experience with managed care payments has shown an upward trend. Per capita amounts have grown following the same trend as fee-for-service per capita growth, based on the formula in the law to calculate managed care capitation amounts. The projection of future per capita amounts follows the requirements of the Balanced Budget Act of 1997 as related to the Medicare+Choice capitation amounts, which increase at rates based on the per capita growth for all of Medicare, less specified adjustments in 1998 to 2002.
The major reason for the large growth in HI managed care expenditures has been the increase in managed care enrollment. These increases in enrollment were quite large in the early 1980’s but slowed in the late 1980’s. Since then large growth has been occurring. The projection of these enrollment increases assumes very high growth in the next few years as additional Medicare+Choice managed care plans become available and then more modest increases based on growth in Medicare total enrollment after that.
e. Administrative Expenses
The cost of administering the HI program has remained relatively small, in comparison with benefit amounts, throughout the history of the program. The ratio of administrative expenses to benefit payments has generally fallen within the range of 1 to 3 percent. The short-range projection of administrative cost is based on estimates of workloads and approved budgets for intermediaries and HCFA. In the long-range,

Actuarial Analysis
64
administrative cost increases are based on assumed increases in workloads, primarily due to growth and aging of the population, and on assumed unit cost increases of slightly less than the increases in average hourly earnings shown in table II.F1.
3. Financing Analysis Methodology
In order to analyze costs and to evaluate the financing of a program supported by payroll taxes, program costs must be compared on a year-by-year basis with the taxable payroll which provides most of the source of income for these costs. Since the vast majority of total program costs are related to insured beneficiaries and since general revenue appropriations and premium payments are expected to support the uninsured segments, the remainder of this report will focus on the financing for insured beneficiaries only.
a. Taxable Payroll
Taxable payroll increases occur as a result of increases in average covered earnings and increases in the number of covered workers. The taxable payroll projection used in this report is based on economic assumptions consistent with those used in the OASDI report. The projected increases in taxable payroll for this report under the intermediate assumptions are shown in table II.F2.
b. Relationship Between Program Costs and Taxable Payroll
The single most meaningful measure of program cost increases, with reference to the financing of the system, is the relationship between program cost increases and taxable payroll increases. If program costs increase more rapidly than taxable payroll, either increasing income rates or reducing program costs (or some combination thereof) will be required to finance the system in the future. Table II.F2 shows the projected increases in program costs relative to taxable payroll over the first 25-year projection period. These relative increases are initially negative in the short term, due to the home health benefit being shifted out of the HI program and the other savings provisions in the Balanced Budget Act of 1997. Thereafter they increase to the range of 1.5 to 2.0 percent per year until 2010, and then increase to a level of about 2.7 percent per year by 2020 for the intermediate assumption, as the post-World War II baby boom population becomes eligible for benefits.
The result of these relative growth rates is initially a reduction in the cost of the HI program as a percentage of taxable payroll, followed by a
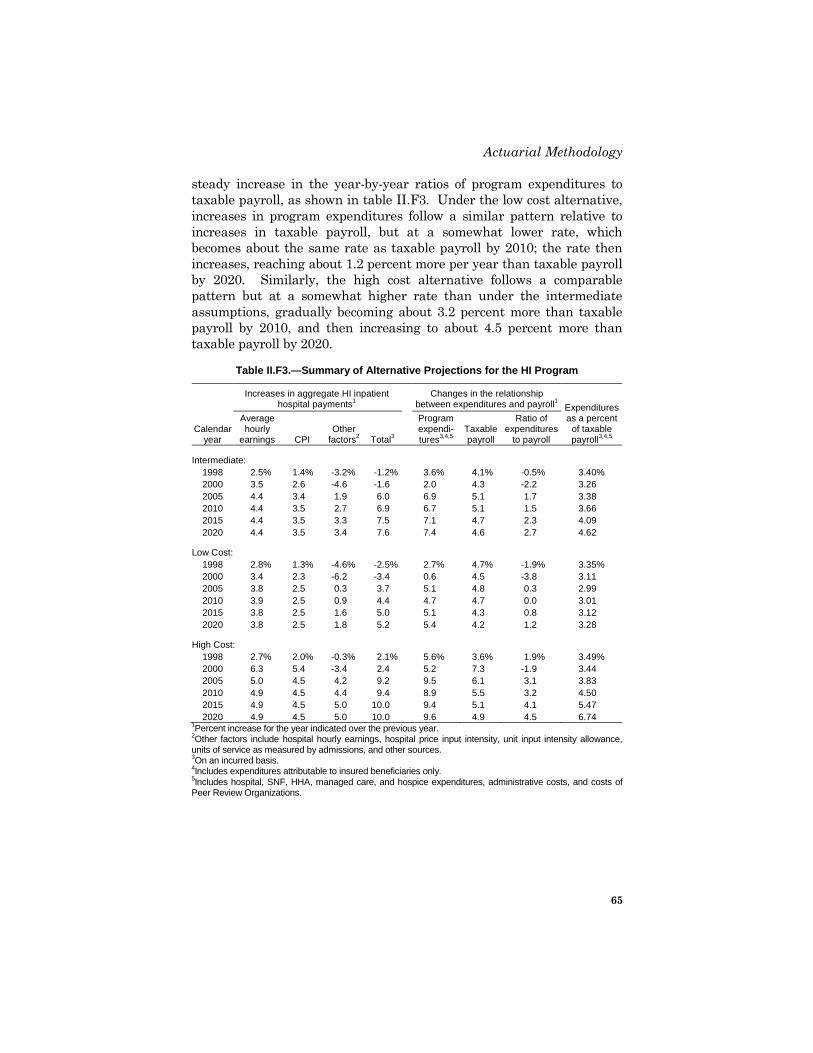
Actuarial Methodology
65
steady increase in the year-by-year ratios of program expenditures to taxable payroll, as shown in table II.F3. Under the low cost alternative, increases in program expenditures follow a similar pattern relative to increases in taxable payroll, but at a somewhat lower rate, which becomes about the same rate as taxable payroll by 2010; the rate then increases, reaching about 1.2 percent more per year than taxable payroll by 2020. Similarly, the high cost alternative follows a comparable pattern but at a somewhat higher rate than under the intermediate assumptions, gradually becoming about 3.2 percent more than taxable payroll by 2010, and then increasing to about 4.5 percent more than taxable payroll by 2020.
Table II.F3.—Summary of Alternative Projections for the HI Program
Increases in aggregate HI inpatient
hospital payments1 Changes in the relationship
between expenditures and payroll1 Expenditures as a percent
of taxable payroll3,4,5
Calendar year
Average hourly
earnings CPI Other
factors2 Total3
Program expendi-tures3,4,5
Taxable payroll
Ratio of expenditures
to payroll
Intermediate: 1998 2.5% 1.4% -3.2% -1.2% 3.6% 4.1% -0.5% 3.40% 2000 3.5 2.6 -4.6 -1.6 2.0 4.3 -2.2 3.26 2005 4.4 3.4 1.9 6.0 6.9 5.1 1.7 3.38 2010 4.4 3.5 2.7 6.9 6.7 5.1 1.5 3.66 2015 4.4 3.5 3.3 7.5 7.1 4.7 2.3 4.09 2020 4.4 3.5 3.4 7.6 7.4 4.6 2.7 4.62
Low Cost: 1998 2.8% 1.3% -4.6% -2.5% 2.7% 4.7% -1.9% 3.35% 2000 3.4 2.3 -6.2 -3.4 0.6 4.5 -3.8 3.11 2005 3.8 2.5 0.3 3.7 5.1 4.8 0.3 2.99 2010 3.9 2.5 0.9 4.4 4.7 4.7 0.0 3.01 2015 3.8 2.5 1.6 5.0 5.1 4.3 0.8 3.12 2020 3.8 2.5 1.8 5.2 5.4 4.2 1.2 3.28
High Cost: 1998 2.7% 2.0% -0.3% 2.1% 5.6% 3.6% 1.9% 3.49% 2000 6.3 5.4 -3.4 2.4 5.2 7.3 -1.9 3.44 2005 5.0 4.5 4.2 9.2 9.5 6.1 3.1 3.83 2010 4.9 4.5 4.4 9.4 8.9 5.5 3.2 4.50 2015 4.9 4.5 5.0 10.0 9.4 5.1 4.1 5.47 2020 4.9 4.5 5.0 10.0 9.6 4.9 4.5 6.74
1Percent increase for the year indicated over the previous year. 2Other factors include hospital hourly earnings, hospital price input intensity, unit input intensity allowance, units of service as measured by admissions, and other sources. 3On an incurred basis. 4Includes expenditures attributable to insured beneficiaries only. 5Includes hospital, SNF, HHA, managed care, and hospice expenditures, administrative costs, and costs of Peer Review Organizations.

Actuarial Analysis
66
4. Projections Under Alternative Assumptions
Since the beginning of the program, aggregate inpatient hospital costs for Medicare beneficiaries have increased substantially faster than increases in average earnings and prices in the general economy. Table II.F1 shows the estimated experience of the HI program for 1984 to 1996. As mentioned earlier, the HI program now makes most payments to hospitals on a prospective basis. The prospective payment system has made the outlays of the HI program potentially less vulnerable to excessive rates of growth in the hospital industry. However, there is still considerable uncertainty in projecting HI expenditures, for inpatient hospital services as well as the other covered types of services, due to the uncertainty of the underlying economic assumptions and utilization increases. In addition, there is uncertainty in projecting HI expenditures due to the possibility of future legislation affecting unit payment levels, particularly for inpatient hospital services. Current law is assumed throughout the estimates shown in this report, but legislation affecting the payment levels to hospitals for the past 12 years and the next 5 years has been enacted, and future legislation is probable.
In view of the uncertainty of future cost trends, projected costs for the HI program have been prepared under three alternative sets of assumptions. A summary of the assumptions and results is shown in table II.F3. The set of assumptions labeled “Intermediate” forms the basis for the detailed discussion of hospital cost trends and resulting program costs presented throughout this report. It represents intermediate cost increase assumptions, compared with the lower cost and higher cost alternatives. Increases in the economic factors (average hourly earnings and CPI) for the three alternatives are consistent with those underlying the OASDI report.
As noted earlier, the single most meaningful measure of HI program cost increases, with reference to the financing of the system, is the relationship between program cost increases and taxable payroll increases. The extent to which program cost increases exceed increases in taxable payroll will determine how steeply income rates must be increased or program costs curtailed to finance the system over time.
By the end of the first 25-year projection period, program costs are projected to increase about 2.7 percent faster per year than increases in taxable payroll for the intermediate assumption, as discussed in section II.F3. Program costs beyond the first 25-year projection period are based on the assumption that costs per unit of service increase at the

Sensitivity Analysis
67
same rate as average hourly earnings. Program expenditures, which were about 3.4 percent of taxable payroll in 1997, increase to almost 5 percent by the year 2022 and to almost 8 percent by the year 2072 under the intermediate assumptions. Hence, if all of the projection assumptions are realized over time, the HI income rates provided in current law (3.26 percent of taxable payroll) will be grossly inadequate to support the cost of the program.
During the first 25-year projection period, the low cost and high cost alternatives contain assumptions which result in program costs increasing, relative to taxable payroll increases, approximately 2 percent less rapidly and 2 percent more rapidly, respectively, than the results under the intermediate assumptions. Costs beyond the first 25-year projection period assume the 2 percent differential gradually decreases until the year 2047 when program cost increases relative to taxable payroll are approximately the same as under the intermediate assumptions. Under the low cost alternative, program expenditures would be about 3.4 percent of taxable payroll in the year 2022, increasing to about 4.2 percent of taxable payroll by 2072. Under the high cost alternative, program expenditures in the year 2022 would increase to about 7.4 percent of taxable payroll, and to about 15.3 percent of taxable payroll in the year 2072. In each instance, these costs are nearly one-third lower than projected in last year’s annual report, as a result of the Medicare provisions in the Balanced Budget Act of 1997.
G. LONG-RANGE SENSITIVITY ANALYSIS
This section presents estimates which illustrate the sensitivity of the long-range cost rate and actuarial balance of the HI program to changes in selected individual assumptions. The estimates based on the three alternative sets of assumptions (i.e., intermediate, low cost, and high cost) illustrate the effects of varying all of the principal assumptions simultaneously in order to portray a generally more optimistic or pessimistic future, in terms of the projected financial status of the HI program. In the sensitivity analysis presented in this section, the intermediate set of assumptions is used as the reference point, and one assumption at a time is varied within that alternative. Similar variations in the selected assumptions within the other alternatives would result in similar variations in the long-range estimates.
Each table that follows shows the effects of changing a particular assumption on the HI summarized income rates, summarized cost rates,
Actuarial Analysis
68
and actuarial balances (as defined earlier in this report) for 25-year, 50-year, and 75-year valuation periods. Because the income rate varies only slightly with changes in assumptions, it is not considered in the discussion of the tables. The change in each of the actuarial balances is approximately equal to the change in the corresponding cost rate, but in the opposite direction. For example, a lower projected cost rate would result in an improvement in the corresponding projected actuarial balance.
1. Real-Wage Differential
Table II.G1 shows the estimated HI income rates, cost rates, and actuarial balances on the basis of the intermediate assumptions with various assumptions about the real-wage differential. These assumptions are that the ultimate real-wage differential will be 0.4-percentage-point (as assumed for the high cost alternative), 0.9-percentage-point (as assumed for the intermediate assumptions), and 1.4-percentage-points (as assumed for the low cost alternative). In each case, the ultimate annual increase in the CPI is assumed to be 3.5 percent (as assumed for the intermediate assumptions), yielding ultimate percentage increases in average annual wages in covered employment of 3.9, 4.4, and 4.9 percent under the three illustrations, respectively.
Past increases in real earnings have exhibited substantial variation. During 1951-1970, real earnings grew by an average of 2.2 percent per year. During the last quarter century, however, the average annual increase in real earnings has amounted to only 0.6 percent. The possibility of continuing poor performance in real wage growth is a matter of some concern to analysts and policy makers. Thus, the sensitivity of HI costs to future real wage growth is important. As shown in table II.G1, projected HI costs are, in fact, fairly sensitive to the assumed growth rates in real wages. For the 75-year period 1998-2072, the summarized cost rate decreases from 5.62 percent (for a real-wage differential of 0.4-percentage-point) to 5.15 percent (for a differential of 1.4-percentage-points). The HI actuarial balance over this period shows a corresponding improvement for faster rates of growth in real wages.

Sensitivity Analysis
69
Table II.G1.—Estimated HI Income Rates, Cost Rates, and Actuarial Balances, Based on Intermediate Estimates With Various Real-Wage Assumptions
[As a percentage of taxable payroll]
Ultimate percentage increase in wages-CPI1 Valuation period 3.9-3.5 4.4-3.5 4.9-3.5
Summarized income rate: 25-year: 1998-2022 3.22 3.21 3.20 50-year: 1998-2047 3.25 3.23 3.21 75-year: 1998-2072 3.28 3.26 3.24
Summarized cost rate: 25-year: 1998-2022 4.04 3.93 3.87 50-year: 1998-2047 5.04 4.85 4.71 75-year: 1998-2072 5.62 5.37 5.15
Actuarial balance: 25-year: 1998-2022 -0.82 -0.73 -0.67 50-year: 1998-2047 -1.79 -1.61 -1.50 75-year: 1998-2072 -2.34 -2.10 -1.91
1The first value in each pair is the assumed ultimate annual percentage increase in average wages in covered employment. The second value is the assumed ultimate annual percentage increase in the CPI. The difference between the two values is the real-wage differential.
The HI cost rate decreases with increasing real-wage differentials, because the higher real-wage levels increase the taxable payroll to a greater extent than they increase HI program benefits. In particular, each 0.5-percentage-point increase in the assumed real-wage differential increases the long-range HI actuarial balance on average by about 0.21 percent of taxable payroll.8
2. Consumer Price Index
Table II.G2 shows the estimated HI income rates, cost rates, and actuarial balances on the basis of the intermediate alternative with various assumptions about the rate of increase for the CPI. These assumptions are that the ultimate annual increase in the CPI will be 2.5 percent (as assumed for the low cost alternative), 3.5 percent (as assumed for the intermediate assumptions), and 4.5 percent (as assumed for the high cost alternative). In each case, the ultimate real-wage differential is assumed to be 0.9 percent (as assumed for the intermediate assumptions), yielding ultimate percentage increases in
8This sensitivity is dampened somewhat because, as noted previously in this report, after the first 25 years medical care unit costs are assumed to increase at the same rate as average hourly earnings. As a result, assumed faster real wage growth causes projected taxable payroll to increase more rapidly than projected costs, but only for the first 25 years. Thereafter, payroll and costs are both projected to increase at about the same rate. The cumulative change between payroll and costs continues but does not increase further.
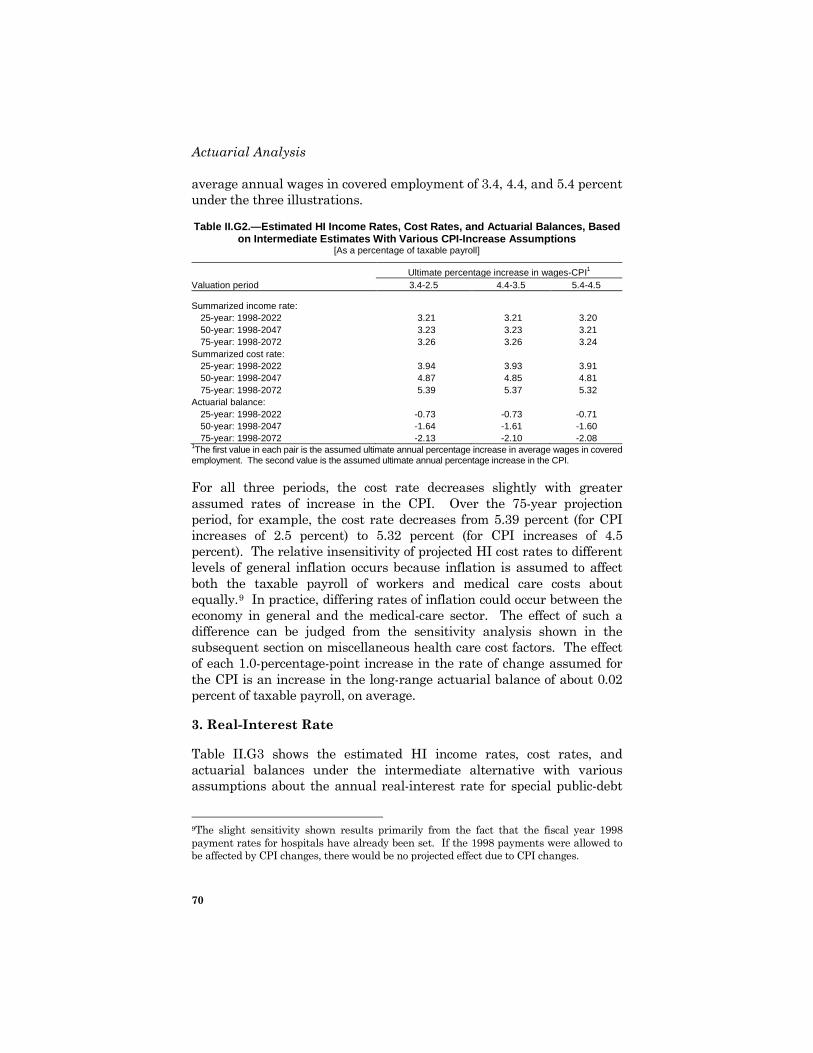
Actuarial Analysis
70
average annual wages in covered employment of 3.4, 4.4, and 5.4 percent under the three illustrations.
Table II.G2.—Estimated HI Income Rates, Cost Rates, and Actuarial Balances, Based on Intermediate Estimates With Various CPI-Increase Assumptions
[As a percentage of taxable payroll]
Ultimate percentage increase in wages-CPI1 Valuation period 3.4-2.5 4.4-3.5 5.4-4.5
Summarized income rate: 25-year: 1998-2022 3.21 3.21 3.20 50-year: 1998-2047 3.23 3.23 3.21 75-year: 1998-2072 3.26 3.26 3.24
Summarized cost rate: 25-year: 1998-2022 3.94 3.93 3.91 50-year: 1998-2047 4.87 4.85 4.81 75-year: 1998-2072 5.39 5.37 5.32
Actuarial balance: 25-year: 1998-2022 -0.73 -0.73 -0.71 50-year: 1998-2047 -1.64 -1.61 -1.60 75-year: 1998-2072 -2.13 -2.10 -2.08
1The first value in each pair is the assumed ultimate annual percentage increase in average wages in covered employment. The second value is the assumed ultimate annual percentage increase in the CPI.
For all three periods, the cost rate decreases slightly with greater assumed rates of increase in the CPI. Over the 75-year projection period, for example, the cost rate decreases from 5.39 percent (for CPI increases of 2.5 percent) to 5.32 percent (for CPI increases of 4.5 percent). The relative insensitivity of projected HI cost rates to different levels of general inflation occurs because inflation is assumed to affect both the taxable payroll of workers and medical care costs about equally.9 In practice, differing rates of inflation could occur between the economy in general and the medical-care sector. The effect of such a difference can be judged from the sensitivity analysis shown in the subsequent section on miscellaneous health care cost factors. The effect of each 1.0-percentage-point increase in the rate of change assumed for the CPI is an increase in the long-range actuarial balance of about 0.02 percent of taxable payroll, on average.
3. Real-Interest Rate
Table II.G3 shows the estimated HI income rates, cost rates, and actuarial balances under the intermediate alternative with various assumptions about the annual real-interest rate for special public-debt
9The slight sensitivity shown results primarily from the fact that the fiscal year 1998 payment rates for hospitals have already been set. If the 1998 payments were allowed to be affected by CPI changes, there would be no projected effect due to CPI changes.

Sensitivity Analysis
71
obligations issuable to the trust fund. These assumptions are that the ultimate annual real-interest rate will be 2.0 percent (as assumed for the high cost alternative), 2.8 percent (as assumed for the intermediate assumptions), and 3.5 percent (as assumed for the low cost alternative). In each case, the ultimate annual increase in the CPI is assumed to be 3.5 percent (as assumed for the intermediate assumptions), resulting in ultimate annual yields of 5.5, 6.3, and 7.0 percent under the three illustrations.
Table II.G3.—Estimated HI Income Rates, Cost Rates, and Actuarial Balances, Based on Intermediate Estimates With Various Real-Interest Assumptions
[As a percentage of taxable payroll]
Ultimate annual real-interest rate Valuation period 2.0 percent 2.8 percent 3.5 percent
Summarized income rate: 25-year: 1998-2022 3.20 3.21 3.22 50-year: 1998-2047 3.23 3.23 3.23 75-year: 1998-2072 3.27 3.26 3.26
Summarized cost rate: 25-year: 1998-2022 3.97 3.93 3.90 50-year: 1998-2047 4.99 4.85 4.71 75-year: 1998-2072 5.61 5.37 5.13
Actuarial balance: 25-year: 1998-2022 -0.77 -0.73 -0.68 50-year: 1998-2047 -1.76 -1.61 -1.48 75-year: 1998-2072 -2.34 -2.10 -1.87
For all periods, the cost rate decreases with increasing real-interest rates. Over 1998-2072 for example, the summarized HI cost rate would decline from 5.61 percent (for an ultimate real-interest rate of 2.0 percent) to 5.13 percent (for an ultimate real-interest rate of 3.5 percent). Thus, each 1.0-percentage-point increase in the assumed real-interest rate increases the long-range actuarial balance on average by about 0.31 percent of taxable payroll. The fact that the actuarial balance of the HI program is sensitive to the interest assumption is not an indication of the actual role that interest plays in the financing of the HI program. In actuality, interest finances very little of the cost of the HI program. The sensitivity of the actuarial balance to the interest assumption is implicit in the present-value method used to calculate the actuarial balance (as described in more detail in section III.A).
4. Health Care Cost Factors
Table II.G4 shows the estimated HI income rates, cost rates, and actuarial balances on the basis of the intermediate set of assumptions with two variations on the relative annual growth rate in the aggregate cost of providing covered health care services to HI beneficiaries. These

Actuarial Analysis
72
assumptions are that the ultimate annual growth rate in such costs, relative to the growth in taxable payroll, will be 1 percent slower than the intermediate assumption, the same as the intermediate assumption, and 1 percent faster than the intermediate assumption. In each case, the taxable payroll will be the same as assumed for the intermediate assumptions.
As noted previously, factors such as wage increases and price increases may simultaneously affect both HI tax income and the costs incurred by hospitals and other providers of medical care to HI beneficiaries. (The sensitivity of the program’s financial status to these factors is evaluated in sections II.G1 and II.G2.) Other factors, such as the utilization of services by beneficiaries or the relative complexity of the services provided, can affect provider costs without affecting HI tax income. The sensitivity analysis shown in table II.G4 illustrates the financial effect of any combination of such factors that results in aggregate provider costs increasing by 1 percentage point faster or slower than the intermediate assumptions, relative to growth in taxable payroll under the intermediate assumptions.
Table II.G4.—Estimated HI Income Rates, Cost Rates, and Actuarial Balances, Based on Intermediate Estimates With Various Health Care Cost Growth Rate Assumptions
[As a percentage of taxable payroll]
Annual cost/payroll relative growth rate Valuation period -1 percentage point 0 percentage point +1 percentage point
Summarized income rate: 25-year: 1998-2022 3.21 3.21 3.21 50-year: 1998-2047 3.23 3.23 3.23 75-year: 1998-2072 3.26 3.26 3.26
Summarized cost rate: 25-year: 1998-2022 3.44 3.93 4.52 50-year: 1998-2047 3.75 4.85 6.37 75-year: 1998-2072 3.78 5.37 7.92
Actuarial balance: 25-year: 1998-2022 -0.23 -0.73 -1.31 50-year: 1998-2047 -0.52 -1.61 -3.14 75-year: 1998-2072 -0.52 -2.10 -4.66
As illustrated in table II.G4, the financial status of the HI program is extremely sensitive to the relative growth rates for health care service costs versus taxable payroll.10 For the 75-year period, the cost rate 10In contrast to the situation described for the real-wage differential (see footnote 8), the sensitivity analysis shown here reflects the continuing effects of relatively faster or slower growth in medical care costs throughout the entire 75-year period. As a result, the sensitivity shown here for miscellaneous health care cost factors is substantially greater than shown for the real-wage differential.
Sensitivity Analysis
73
increases from 3.78 percent (for an annual cost/payroll growth rate of 1 percentage point less than the intermediate assumptions) to 7.92 percent (for an annual cost/payroll growth rate of 1 percentage point more than the intermediate assumptions). Each 1.0-percentage-point increase in the assumed cost/payroll relative growth rate decreases the long-range actuarial balance on average by about 2.07 percent of taxable payroll.

Sensitivity Analysis
75
III. APPENDICES
A. ACTUARIAL BALANCE UNDER THE MODIFIED AVERAGE-COST METHOD
In section II.E, the summarized income rates, cost rates, and actuarial balances are presented based on the actuarial present values of future income, costs, and taxable payrolls. Such methods are widely used in actuarial, economic, and financial analyses. In effect, the present value calculation applies successively less weight to the projected values as the projection interval lengthens. This technique reflects the fact that the value of the dollar changes over time—in particular, a dollar available today can earn interest over time and is therefore more valuable than the same dollar available in some future year.
The actuarial balance computed under the present-value method can be interpreted as the immediate, level, and permanent percentage that, if added to the current law income rates and/or subtracted from the current law cost rates throughout the valuation period, would provide sufficient financing to support program costs throughout the period and would leave the targeted trust fund balance at the end of the projection period. If such a policy were followed, a large fund would accumulate and would earn substantial interest credits, significantly exceeding those that would be earned under current law financing.
The measurement of the actuarial balance by the present-value method is significantly affected by the level of assumed future interest rates (as illustrated in section II.G). The higher the assumed rate of interest, the lower the weight that is applied to the more distant, high-cost years of the projection. (Equivalently, the greater the amount of interest that would be earned if a large fund were accumulated.) In practice, however, unless a large fund is accumulated, interest earnings will play a relatively small role in the financing of the HI program. The sensitivity of the actuarial balance to assumed interest rates is not readily apparent from a casual inspection of the actuarial deficit as measured by the present-value method.
An alternative to the present-value method, called the modified average-cost method, was used prior to 1988 to evaluate the actuarial status of the program. Under this method, the actuarial balance is defined as the difference between the arithmetic means of the annual cost rates (as defined in section II.E) and the annual income rates. Thus, under this method, the cost rates and income rates for each year are given equal weights when summarized into a single measure. The annual cost rates include an amount to maintain the trust fund at a desired target level, if the fund would otherwise drop below that level at

Appendices
76
any point within the projection period. In addition, the actuarial balances calculated under the modified average-cost method reflect the starting trust fund balance and the interest earned on the trust fund before it is exhausted.
The actuarial balance using the modified average-cost method can be characterized as the average of the annual income rate increases needed to maintain the trust fund at the target level over each year of the projection period, taking into account the beginning trust fund balance and the interest earnings of the trust fund. The implied funding pattern under the modified average-cost method is that the current law trust fund ratios would be maintained until the trust fund ratio falls below the target amount (100 percent of the following year’s estimated expenditures). After that, the income rate would be increased each year to cover the cost of the program and to maintain the trust fund at the target level. This measure of the actuarial balance is relatively insensitive to the assumed future interest rates, in keeping with the minor role that interest plays in the financing of a program on a current-cost, or pay-as-you-go, basis.
The 75-year actuarial balance using the modified average-cost method, under the Trustees’ intermediate assumptions, is -2.54 percent of taxable payroll as compared to -2.10 percent based on the present-value method. Based on either measure, the actuarial deficit represents roughly 40 percent of the summarized cost rate. Thus, the HI trust fund fails the Trustees’ test of long-range close actuarial balance by a wide margin using either measure. Table III.A1 compares the summarized HI projections based on the modified average-cost method to those based on the present-value method, as used elsewhere in this report.

Alternative Method
77
Table III.A1.—Actuarial Balances of the HI Program, Under Three Sets of Assumptions: Modified Average-Cost Method versus Present-Value Method
Intermediate assumptions
Alternative Low Cost High Cost
Projection Periods: Modified Average-Cost Method 1998-2022:
Summarized income rate 3.08% 3.06% 3.10% Summarized cost rate1 3.85 3.09 4.95 Actuarial balance2 -0.77 -0.03 -1.85
1998-2047: Summarized income rate 3.18 3.13 3.23 Summarized cost rate1 5.04 3.32 8.15 Actuarial balance2 -1.86 -0.19 -4.92
1998-2072: Summarized income rate 3.24 3.16 3.33 Summarized cost rate1 5.78 3.51 10.11 Actuarial balance2 -2.54 -0.35 -6.78
Projection Periods: Present-Value Method 1998-2022:
Summarized income rate3 3.21 3.19 3.23 Summarized cost rate4 3.93 3.22 4.97 Actuarial balance2 -0.73 -0.03 -1.74
1998-2047: Summarized income rate3 3.23 3.19 3.28 Summarized cost rate4 4.85 3.35 7.51 Actuarial balance2 -1.61 -0.16 -4.23
1998-2072: Summarized income rate3 3.26 3.20 3.33 Summarized cost rate4 5.37 3.47 8.86 Actuarial balance2 -2.10 -0.27 -5.53
1Expenditures for benefit payments and administrative costs for insured beneficiaries, on an incurred basis, expressed as a percentage of taxable payroll, computed on the modified average-cost basis, including the cost of maintaining the trust fund at a level of 100% of the following year’s estimated expenditures, and including an offset to cost due to the beginning trust fund balance. 2Difference between the summarized income rate and the summarized cost rate. 3Income rates include beginning trust fund balances. 4Expenditures for benefit payments and administrative costs for insured beneficiaries, on an incurred basis, expressed as a percentage of taxable payroll, computed on the present-value basis, including the cost of attaining a trust fund balance at the end of the period equal to 100% of the following year’s estimated expenditures.
Note: Totals do not necessarily equal the sums of rounded components.
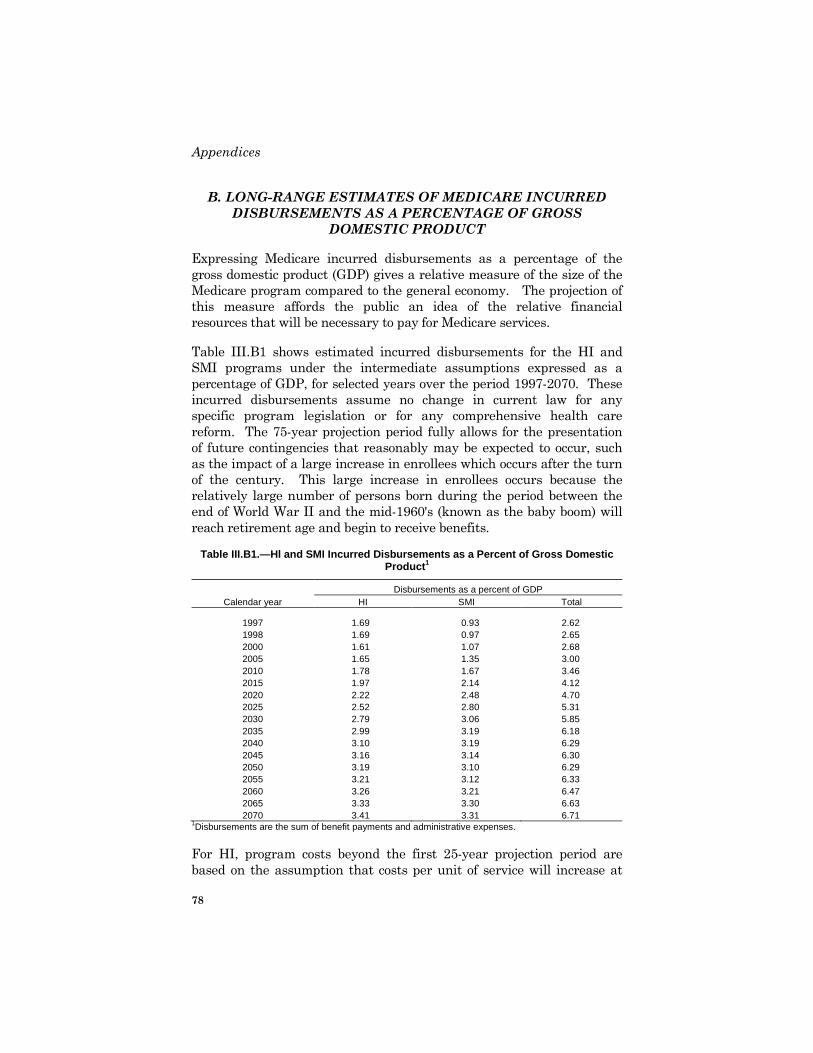
Appendices
78
B. LONG-RANGE ESTIMATES OF MEDICARE INCURRED DISBURSEMENTS AS A PERCENTAGE OF GROSS
DOMESTIC PRODUCT
Expressing Medicare incurred disbursements as a percentage of the gross domestic product (GDP) gives a relative measure of the size of the Medicare program compared to the general economy. The projection of this measure affords the public an idea of the relative financial resources that will be necessary to pay for Medicare services.
Table III.B1 shows estimated incurred disbursements for the HI and SMI programs under the intermediate assumptions expressed as a percentage of GDP, for selected years over the period 1997-2070. These incurred disbursements assume no change in current law for any specific program legislation or for any comprehensive health care reform. The 75-year projection period fully allows for the presentation of future contingencies that reasonably may be expected to occur, such as the impact of a large increase in enrollees which occurs after the turn of the century. This large increase in enrollees occurs because the relatively large number of persons born during the period between the end of World War II and the mid-1960's (known as the baby boom) will reach retirement age and begin to receive benefits.
Table III.B1.—Hl and SMI Incurred Disbursements as a Percent of Gross Domestic Product1
Disbursements as a percent of GDP Calendar year HI SMI Total
1997 1.69 0.93 2.62 1998 1.69 0.97 2.65 2000 1.61 1.07 2.68 2005 1.65 1.35 3.00 2010 1.78 1.67 3.46 2015 1.97 2.14 4.12 2020 2.22 2.48 4.70 2025 2.52 2.80 5.31 2030 2.79 3.06 5.85 2035 2.99 3.19 6.18 2040 3.10 3.19 6.29 2045 3.16 3.14 6.30 2050 3.19 3.10 6.29 2055 3.21 3.12 6.33 2060 3.26 3.21 6.47 2065 3.33 3.30 6.63 2070 3.41 3.31 6.71
1Disbursements are the sum of benefit payments and administrative expenses.
For HI, program costs beyond the first 25-year projection period are based on the assumption that costs per unit of service will increase at

Percentage of GDP
79
the same rate as average hourly earnings. The associated aggregate disbursements are then represented as a percentage of GDP. For SMI, increases in the costs per enrollee during the initial 25-year period are assumed to gradually decline in the last 12 years to the same rate as GDP per capita and then to continue at the same rate as GDP per capita in the last 50 years.
Based on these assumptions, incurred Medicare disbursements as a percent of GDP are projected to increase rapidly from 2.62 percent in 1997 to 6.18 percent in 2035 and then to increase gradually to 6.71 percent by 2070. After 2035, while Medicare disbursements as a percent of GDP increase more slowly, the HI percentage grows steadily while the SMI percentage decreases slightly through 2050 and then increases again through 2070.

Appendices
80
C. MEDICARE COST SHARING AND PREMIUM AMOUNTS
HI beneficiaries who use covered services may be subject to deductible and coinsurance requirements. A beneficiary is responsible for an inpatient hospital deductible amount, which is deducted from the amount payable by the HI program to the hospital, for inpatient hospital services furnished in a spell of illness. When a beneficiary receives such services for more than 60 days during a spell of illness, he or she is responsible for a coinsurance amount equal to one-fourth of the inpatient hospital deductible, for each of days 61-90 in the hospital. After 90 days in a spell of illness each individual has 60 lifetime reserve days of coverage. The coinsurance amount for these days is equal to one-half of the inpatient hospital deductible. A beneficiary is responsible for a coinsurance amount equal to one-eighth of the inpatient hospital deductible for each of days 21-100 of skilled nursing facility services furnished during a spell of illness.
Most persons age 65 and older and many disabled individuals under age 65 are insured for Medicare Hospital Insurance benefits without payment of any premium. The Social Security Act provides that certain aged and disabled persons who are not insured may voluntarily enroll, subject to the payment of a monthly premium. In addition, since 1994, voluntary enrollees may qualify for a reduced premium if they have at least 30 quarters of covered employment.
Under SMI, all enrollees are subject to a monthly premium. Most SMI services are subject to an annual deductible and coinsurance. The annual deductible and the coinsurance percentage (percent of costs that the enrollee must pay) are set by statute. The coinsurance percentage has remained at 20 percent since the inception of the program.
Table III.C1 shows the historical levels of HI and SMI deductibles, HI coinsurance, and HI and SMI premiums, as well as projected values for future years based on the intermediate set of assumptions used in estimating the operations of the trust funds. Certain anomalies in these values resulted from specific program features in particular years (e.g., the effect of the Medicare Catastrophic Coverage Act of 1988 on 1989 values). The amounts of the HI and SMI premiums and the HI deductibles and coinsurance are required to be announced in the Federal Register in September of each year for the upcoming year. The values listed in the table for future years are estimates, and actual amounts are likely to be somewhat different as experience emerges.

Cost Sharing and Premiums
81
Table III.C1.—Medicare Cost Sharing and Premium Amounts
HI SMI
Inpatient
coinsurance1
Year
Inpatient hospital
deductible1 Days 61-
90
Lifetime reserve
days
SNF coinsurance
days1
Monthly premium Monthly
premium2 Annual
deductible1 Standard2 Reduced1
Historical Data: 1967 $40 $10 — $5.00 — — $3.00 $50 1968 40 10 $20 5.00 — — 4.00 50 1969 44 11 22 5.50 — — 4.00 50 1970 52 13 26 6.50 — — 4.00 50 1971 60 15 30 7.50 — — 5.30 50 1972 68 17 34 8.50 — — 5.60 50 1973 72 18 36 9.00 $33 — 5.80 60 1974 84 21 42 10.50 36 — 6.30 60 1975 92 23 46 11.50 40 — 6.70 60 1976 104 26 52 13.00 45 — 6.70 60 1977 124 31 62 15.50 54 — 7.20 60 1978 144 36 72 18.00 63 — 7.70 60 1979 160 40 80 20.00 69 — 8.20 60 1980 180 45 90 22.50 78 — 8.70 60 1981 204 51 102 25.50 89 — 9.60 60 1982 260 65 130 32.50 113 — 11.00 75 1983 304 76 152 38.00 113 — 12.20 75 1984 356 89 178 44.50 155 — 14.60 75 1985 400 100 200 50.00 174 — 15.50 75 1986 492 123 246 61.50 214 — 15.50 75 1987 520 130 260 65.00 226 — 17.90 75 1988 540 135 270 67.50 234 — 24.80 75 1989 3 560 — — 25.50 156 — 31.90 75 1990 592 148 296 74.00 175 — 28.60 75 1991 628 157 314 78.50 177 — 29.90 100 1992 652 163 326 81.50 192 — 31.80 100 1993 676 169 338 84.50 221 — 36.60 100 1994 696 174 348 87.00 245 $184 41.10 100 1995 716 179 358 89.50 261 183 46.10 100 1996 736 184 368 92.00 289 188 42.50 100 1997 760 190 380 95.00 311 187 43.80 100 1998 764 191 382 95.50 309 170 43.80 100
Intermediate Estimates: 1999 776 194 388 97.00 310 171 47.30 100 2000 792 198 396 99.00 312 172 52.20 100 2001 812 203 406 101.50 320 176 57.00 100 2002 836 209 418 104.50 331 182 62.00 100 2003 872 218 436 109.00 346 190 67.80 100 2004 912 228 456 114.00 365 201 74.80 100 2005 956 239 478 119.50 384 211 80.70 100 2006 1,004 251 502 125.50 405 223 88.30 100 2007 1,056 264 528 132.00 425 234 95.60 100 2008 1,108 277 554 138.50 446 245 103.00 100
1Amounts shown are effective for calendar years. 2Amounts shown for 1967-1982 are for the 12-month periods ending June 30; amounts shown for 1983 are for the period July 1, 1982 through December 31, 1983; amounts shown for 1984 and later are for calendar years. 3Anomalies in the 1989 values are due to the Medicare Catastrophic Coverage Act of 1988. Most of the provisions of the Act were repealed the following year.
Appendices
82
In 1998 there will be an estimated 9.1 million deductibles paid at $764 each, about 2.8 million days subject to coinsurance at $191 per day (for hospital days 61 through 90), about 1.3 million lifetime reserve days subject to coinsurance at $382 per day, and about 25.0 million extended care days subject to coinsurance at $95.50 per day. Similarly, in 1997 there were an estimated 8.9 million deductibles paid at $760 each, about 2.7 million days subject to coinsurance at $190 per day (for hospital days 61 through 90), about 1.3 million lifetime reserve days subject to coinsurance at $380 per day, and about 24.6 million extended care days subject to coinsurance at $95.00 per day. Therefore, the estimated total increase in cost to beneficiaries is about $260 million (rounded to the nearest $10 million), due to (1) the increase in the deductible and coinsurance amounts and (2) the change in the number of deductibles and daily coinsurance amounts paid.
Glossary
83
D. GLOSSARY
Actuarial balance. The difference between the summarized income rate and the summarized cost rate over a given valuation period.
Actuarial deficit. A negative actuarial balance.
Administrative expenses. Expenses incurred by the Department of HHS and the Department of the Treasury in administering the HI program and the provisions of the Internal Revenue Code relating to the collection of contributions. Such administrative expenses, which are paid from the HI trust fund, include expenditures for intermediaries to determine costs of and make payments to providers as well as salaries and expenses of the HCFA.
Advisory Council on Social Security. Prior to the enactment of the Social Security Independence and Program Improvements Act of 1994 (Public Law 103-296) on August 15, 1994, the Social Security Act required the appointment of an Advisory Council every 4 years to study and review the financial status of the OASDI and Medicare programs. The most recent Advisory Council was appointed on June 9, 1994; and its report on the financial status of the OASDI program was submitted on January 6, 1997. Under the provisions of Public Law 103-296, this is the last Advisory Council to be appointed.
Aged enrollee. An individual, age 65 or over, who is enrolled in the HI program.
Assets. Treasury notes and bonds guaranteed by the federal government and cash held by the trust funds for investment purposes.
Assumptions. Values relating to future trends in certain key factors which affect the balance in the trust funds. Demographic assumptions include fertility, mortality, net immigration, marriage, divorce, retirement patterns, disability incidence and termination rates, and changes in the labor force. Economic assumptions include unemployment, average earnings, inflation, interest rates, and productivity. Three sets of economic assumptions are presented in the Trustees Report:
(1) The low cost alternative, with relatively rapid economic growth, low inflation, and favorable (from the standpoint of program financing) demographic conditions;

Appendices
84
(2) The intermediate assumptions represent the Trustees’ best estimates of likely future economic and demographic conditions; and
(3) The high cost alternative, with slow economic growth, more rapid inflation, and financially disadvantageous demographic conditions.
See also “Hospital assumptions.”
Average market yield. A computation which is made on all marketable interest-bearing obligations of the United States. It is computed on the basis of market quotations as of the end of the calendar month immediately preceding the date of such issue.
Baby boom. The period from the end of World War II through the mid-1960's marked by unusually high birth rates.
Base estimate. The updated estimate of the most recent historical year.
Beneficiary. A person enrolled in the HI program. See also “Aged enrollee” and “Disabled enrollee.”
Benefit payments. The amounts disbursed for covered services after the deductible and coinsurance amounts have been deducted.
Benefit period. An alternate name for “spell of illness.”
Board of Trustees. A Board established by the Social Security Act to oversee the financial operations of the Federal Hospital Insurance Trust Fund. The Board is composed of six members, four of whom serve automatically by virtue of their positions in the federal government: the Secretary of the Treasury, who is the Managing Trustee, the Secretary of Labor, the Secretary of Health and Human Services, and the Commissioner of Social Security. The other two members are appointed by the President and confirmed by the Senate to serve as public representatives. Stephen G. Kellison and Marilyn Moon began serving 4-year terms on July 20, 1995. The Commissioner of Social Security became a member of the Board effective March 31, 1995, under Public Law 103-296, approved August 15, 1994. The Administrator of the HCFA serves as Secretary of the Board of Trustees.
Bond. A certificate of ownership of a specified portion of a debt due by the federal government to holders, bearing a fixed rate of interest.

Glossary
85
Callable. Subject to redemption upon notice, such as a bond.
Case mix index. The average DRG relative weight for all the Medicare admissions.
Cash basis. The costs of the service at the point payment was made rather than when the service was performed.
Certificate of indebtedness. A short-term certificate of ownership of 12 months or less of a specified portion of a debt due by the federal government to individual holders, bearing a fixed rate of interest.
Coinsurance. See “Hospital coinsurance” and “SNF coinsurance.”
Consumer Price Index (CPI). A measure of the average change in prices over time in a fixed group of goods and services. In this report, all references to the CPI relate to the Consumer Price Index for Urban Wage Earners and Clerical Workers (CPI-W).
Contribution base. See “Maximum tax base.”
Contributions. See “Payroll taxes.”
Cost rate. The ratio of the cost (or outgo, expenditures, or disbursements) of the program on an incurred basis during a given year to the taxable payroll for the year. In this context, the outgo is defined to exclude benefit payments and administrative costs for certain uninsured persons, for whom payments are reimbursed from the general fund of the Treasury, and for voluntary enrollees, who pay a premium in order to be enrolled.
Covered earnings. Earnings in employment covered by the HI program.
Covered employment. All employment and self-employment creditable for Social Security purposes. Almost every kind of employment and self-employment is covered under the program. In a few employment situations, for example, religious orders under a vow of poverty, foreign affiliates of American employers, or State and local governments, coverage must be elected by the employer. However, effective July 1991, coverage is mandatory for State and local employees who are not participating in a public employee retirement system. All new State and local employees have been covered since April 1986. In
Appendices
86
a few situations, for example, ministers or self-employed members of certain religious groups, workers can opt out of coverage. Covered employment for HI includes all federal employees (whereas covered employment for OASDI includes some, but not all, federal employees).
Covered services. Services for which HI pays, as defined and limited by statute. Covered services are provided by hospitals (inpatient care), skilled nursing facilities, home health agencies, and hospices.
Covered worker. A person who has earnings creditable for Social Security purposes on the basis of services for wages in covered employment and/or on the basis of income from covered self-employment. The number of HI covered workers is slightly larger than the number of OASDI covered workers because of different coverage status for federal employment. See “Covered employment.”
Deductible. See “Inpatient hospital deductible.”
Deemed wage credit. See “Non-contributory or deemed wage credits.”
Demographic assumptions. See “Assumptions.”
Diagnosis-related groups (DRGs). A classification system that groups patients according to diagnosis, type of treatment, age, and other relevant criteria. Under the prospective payment system, hospitals are paid a set fee for treating patients in a single DRG category, regardless of the actual cost of care for the individual.
Disability. For Social Security purposes, the inability to engage in substantial gainful activity by reason of any medically determinable physical or mental impairment that can be expected to result in death or to last for a continuous period of not less than 12 months. Special rules apply for workers age 55 or older whose disability is based on blindness. The law generally requires that a person be disabled continuously for 5 months before he or she can qualify for a disabled-worker cash benefit. An additional 24 months is necessary to qualify for benefits under Medicare.
Disability Insurance (DI). See “Old-Age, Survivors, and Disability Insurance (OASDI).”
Disabled enrollee. An individual under age 65 who has been entitled to disability benefits under Title II of the Social Security Act or the

Glossary
87
Railroad Retirement system for at least 2 years and who is enrolled in the HI program.
DRG Coding. The DRG categories used by hospitals on discharge billing. See also “Diagnosis-related groups (DRGs).”
Earnings. Unless otherwise qualified, all wages from employment and net earnings from self-employment, whether or not taxable or covered.
Economic assumptions. See “Assumptions.”
Extended care services. In the context of this report, an alternate name for “skilled nursing facility services.”
Federal Insurance Contributions Act (FICA). Provision authorizing taxes on the wages of employed persons to provide for the OASDI and HI programs. The tax is paid in equal amounts by covered workers and their employers.
Financial interchange. Provisions of the Railroad Retirement Act providing for transfers between the trust funds and the Social Security Equivalent Benefit Account of the Railroad Retirement program in order to place each trust fund in the same position as if railroad employment had always been covered under Social Security.
Fiscal year. The accounting year of the United States Government. Since 1976, each fiscal year has begun October 1 of the prior calendar year and ended the following September 30. For example, fiscal year 1998 began October 1, 1997 and will end September 30, 1998.
Fixed capital assets. The net worth of facilities and other resources.
General fund of the Treasury. Funds held by the Treasury of the United States, other than revenue collected for a specific trust fund (such as HI) and maintained in a separate account for that purpose. The majority of this fund is derived from individual and business income taxes.
General revenue. Income to the HI trust fund from the general fund of the Treasury. Only a very small percentage of total HI trust fund income each year is attributable to general revenue.

Appendices
88
Gramm-Rudman-Hollings Act. The Balanced Budget and Emergency Deficit Control Act of 1985.
Gross Domestic Product (GDP). The total dollar value of all goods and services produced in a year in the United States, regardless of who supplies the labor or property.
High cost alternative. See “Assumptions.”
Home health agency (HHA). A public agency or private organization which is primarily engaged in providing skilled nursing services, other therapeutic services, such as physical, occupational, or speech therapy, and home health aide services, in the home.
Hospice. A provider of care for the terminally ill; delivered services generally include home health care, nursing care, physician services, medical supplies, and short-term inpatient hospital care.
Hospital assumptions. These include differentials between hospital labor and non-labor indices compared to general economy labor and non-labor indices, rates of admission incidence, the trend toward treating less complicated cases in outpatient settings, and continued improvement in DRG coding, etc.
Hospital coinsurance. For the 61st through 90th day of hospitalization in a benefit period, a daily amount for which the beneficiary is responsible, equal to one-fourth of the inpatient hospital deductible; for lifetime reserve days, a daily amount for which the beneficiary is responsible, equal to one-half of the inpatient hospital deductible (see “Lifetime reserve days”).
Hospital input price index. An alternate name for “hospital market basket.”
Hospital Insurance (HI). The Medicare program which covers specified inpatient hospital services, posthospital skilled nursing care, home health services, and hospice care for aged and disabled individuals who meet the eligibility requirements. Also known as Medicare Part A.
Hospital market basket. The cost of the mix of goods and services (including personnel costs but excluding nonoperating costs) comprising routine, ancillary, and special care unit inpatient hospital services.
Glossary
89
Income rate. The ratio of income from tax revenues on an incurred basis (payroll tax contributions and income from the taxation of OASDI benefits) to the HI taxable payroll for the year.
Incurred basis. The costs based on when the service was performed rather than when the payment was made.
Inpatient hospital deductible. An amount of money which is deducted from the amount payable by Medicare Part A for inpatient hospital services furnished to a beneficiary during a spell of illness.
Inpatient hospital services. These services include bed and board, nursing services, diagnostic or therapeutic services, and medical or surgical services.
Interest. A payment for the use of money during a specified period.
Interfund borrowing. The borrowing of assets by a trust fund (OASI, DI, HI or SMI) from another of the trust funds when one of the funds is in danger of exhaustion. Interfund borrowing was authorized only during 1982-1987.
Intermediary. A private or public organization, under contract to the HCFA, to determine costs of and make payments to providers for HI and certain SMI services.
Intermediate assumptions. See “Assumptions.”
Lifetime reserve days. Under HI, there are 60 lifetime reserve days per beneficiary which the beneficiary may opt to use when regular inpatient hospital benefits are exhausted. The beneficiary pays one-half of the inpatient hospital deductible for each lifetime reserve day used.
Long-range. The next 75 years.
Low cost alternative. See “Assumptions.”
Managed care. Includes Health Maintenance Organizations (HMO), Competitive Medical Plans (CMP), and other plans that provide health services on a prepayment basis which is either based on cost or risk depending on the type of contract they have with Medicare. See also “Medicare+Choice”.

Appendices
90
Market basket. See “Hospital market basket.”
Maximum tax base. Annual dollar amount above which earnings in employment covered under the HI program are not taxable. Beginning in 1994, the maximum tax base is eliminated under HI.
Maximum taxable amount of annual earnings. See “Maximum tax base.”
Medicare. A nationwide, federally administered health insurance program authorized in 1965 to cover the cost of hospitalization, medical care, and some related services for most people over age 65. In 1972 coverage was extended to people receiving Social Security Disability Insurance payments for 2 years, and people with ESRD. Medicare consists of two separate but coordinated programs—Part A (Hospital Insurance, HI) and Part B (Supplementary Medical Insurance, SMI). Almost all persons aged 65 and over or disabled entitled to HI are eligible to enroll in the SMI program on a voluntary basis by paying a monthly premium. Health insurance protection is available to Medicare beneficiaries without regard to income.
Medicare+Choice. An expanded set of options for the delivery of health care under Medicare established by the Balanced Budget Act of 1997. Most Medicare beneficiaries can choose to receive benefits through the original fee-for-service program or through one of the following Medicare+Choice plans: (1) coordinated care plans (such as health maintenance organizations, provider sponsored organizations, and preferred provider organizations); (2) Medical Savings Account (MSA)/High Deductible plans (through a demonstration available to up to 390,000 beneficiaries); or (3) private fee-for-service plans.
Military service wage credits. Credits recognizing that military personnel receive other cash payments and wages in kind (such as food and shelter) in addition to their basic pay. Noncontributory wage credits of $160 are provided for each month of active military service from September 16, 1940, through December 31, 1956. For years after 1956, the basic pay of military personnel is covered under the Social Security program on a contributory basis. Noncontributory wage credits of $300 for each calendar quarter in which a person receives pay for military service from January 1957 through December 1977 are granted in addition to contributory credits for basic pay. Deemed wage credits of $100 are granted for each $300 of military wages in years after 1977. (The maximum credits allowed in any calendar year are $1,200.) (See also “Quinquennial military service determinations and adjustments.”)

Glossary
91
Modified average-cost method. Under this system of calculating summary measures, the actuarial balance is defined as the difference between the arithmetic means of the annual cost rates and the annual income rates, with an adjustment included to account for the offsets to cost that are due to (1) the starting trust fund balance and (2) interest earned on the trust fund.
Noncontributory or deemed wage credits. Wages and wages in kind that were not subject to the HI tax but that are deemed as having been. This is done for the purposes of (1) determining HI program eligibility for individuals who might not be eligible for HI coverage without payment of premium were it not for the deemed wage credits and (2) calculating reimbursement due the HI trust fund from the general fund of the Treasury. The first purpose applies in the case of providing coverage to persons during the transitional periods when the HI program began and when it was expanded to cover federal employees; both purposes apply in the cases of military service wage credits (see “Military service wage credits” and “Quinquennial military service determinations and adjustments”) and deemed wage credits granted for the internment of persons of Japanese ancestry during World War II.
Old-Age, Survivors, and Disability Insurance (OASDI). The Social Security programs which pay for (1) monthly cash benefits to retired-worker (old-age) beneficiaries and their spouses and children and to survivors of deceased insured workers (OASI) and (2) monthly cash benefits to disabled-worker beneficiaries and their spouses and children and for providing rehabilitation services to the disabled (DI).
Part A. The Medicare Hospital Insurance program.
Part A premium. A monthly premium paid by or on behalf of individuals who wish for and are entitled to voluntary enrollment in the Medicare HI program. These individuals are those who are age 65 and older who are uninsured for social security or railroad retirement and do not otherwise meet the requirements for entitlement to Part A. In addition, disabled individuals who have exhausted other entitlement are qualified. These individuals are those not now entitled but who have been entitled under section 226(b) of the Act, continue to have the disabling impairment upon which their entitlement was based, and whose entitlement ended solely because the individuals had earnings that exceeded the substantial gainful activity amount (as defined in section 223(d)(4) of the Act).
Part B. The Medicare Supplementary Medical Insurance program.
Appendices
92
Participating hospitals. Those hospitals who participate in the Medicare program.
Pay-as-you-go financing. A financing scheme where taxes are scheduled to produce just as much income as required to pay current benefits, with trust fund assets built up only to the extent needed to prevent exhaustion of the fund by random fluctuations.
Payroll taxes. Taxes levied on the gross wages of workers.
Peer Review Organization (PRO). A group of practicing physicians and other health care professionals, paid by the federal government, to review the care given to Medicare patients.
Present value. The present value of a future stream of payments is the lump-sum amount that, if invested today, together with interest earnings would be just enough to meet each of the payments as they fell due. At the time of the last payment, the invested fund would be exactly zero.
Projection error. Degree of variation between estimated and actual amounts.
Prospective Payment Assessment Commission (ProPAC). A commission established by the Social Security Amendments of 1983 to review and recommend the appropriate percentage changes which should be effected for payments for inpatient hospital discharges each fiscal year beginning with fiscal year 1986. Furthermore, the ProPAC is expected to study and make recommendations regarding existing reimbursement policy for each fiscal year.
Prospective payment system (PPS). A method of reimbursement for hospitals which was implemented effective with hospital cost reporting periods beginning on or after October 1, 1983. Under this system, Medicare payment is made at a predetermined, specific rate for each discharge. All discharges are classified according to a list of diagnosis-related groups (DRGs).
Provider. Any organization, institution, or individual who provides health care services to Medicare beneficiaries. Hospitals (inpatient services), skilled nursing facilities, home health agencies, and hospices are the providers of services covered under Medicare Part A.
Glossary
93
Proxy. An index of known values that likely approximates an index for which values are unavailable. The proxy is used as a “stand-in” for the unavailable index.
Quinquennial military service determination and adjustments. Prior to the Social Security Amendments of 1983, quinquennial determinations (i.e., estimates made once every 5 years) were made of the costs arising from the granting of deemed wage credits for military service prior to 1957; annual reimbursements were made from the general fund of the Treasury to the HI trust fund for these costs. The Social Security Amendments of 1983 provided for (1) a lump-sum transfer in 1983 for (a) the costs arising from the pre-1957 wage credits and (b) amounts equivalent to the HI taxes that would have been paid on the deemed wage credits for military service for 1966 through 1983, inclusive, if such credits had been counted as covered earnings; (2) quinquennial adjustments to the pre-1957 portion of the 1983 lump-sum transfer; (3) general fund transfers equivalent to HI taxes on military deemed wage credits for 1984 and later to be credited to the fund on July 1 of each year; and (4) adjustments as deemed necessary to any previously transferred amounts representing HI taxes on military deemed wage credits.
Railroad Retirement. A federal insurance program similar to Social Security designed for workers in the railroad industry. The provisions of the Railroad Retirement Act provide for a system of coordination and financial interchange between the Railroad Retirement program and the Social Security program.
Real-wage differential. The difference between the percentage increases, before rounding, in (1) the average annual wage in covered employment, and (2) the average annual Consumer Price Index.
Reasonable cost basis. The calculation to determine the reasonable cost incurred by individual providers when furnishing covered services to beneficiaries. The reasonable cost is based on the actual cost of providing such services, including direct and indirect costs of providers, and excluding any costs which are unnecessary in the efficient delivery of services covered by a health insurance program.
Self-employment. Operation of a trade or business by an individual or by a partnership in which an individual is a member.
Appendices
94
Self-Employment Contributions Act (SECA). Provision authorizing taxes on the net income of most self-employed persons to provide for the OASDI and HI programs.
Sequester. The reduction of funds to be used for benefits or administrative costs from a federal account based on the requirements specified in the Gramm-Rudman-Hollings Act.
Short-range. The next 10 years.
Skilled nursing facility (SNF). An institution which is primarily engaged in providing skilled nursing care and related services for residents who require medical or nursing care, or engaged in rehabilitation of injured, disabled, or sick persons.
SNF coinsurance. For the 21st through 100th day of extended care services in a benefit period, a daily amount for which the beneficiary is responsible, equal to 1/8 of the inpatient hospital deductible.
Social Security Act. Public Law 74-271, enacted August 14, 1935, with subsequent amendments. The Social Security Act consists of 20 titles, of which four have been repealed. The HI and SMI programs are authorized by Title XVIII of the Social Security Act.
Special public-debt obligation. Securities of the United States Government issued exclusively to the OASI, DI, HI, and SMI trust funds and other federal trust funds. Section 1817(c) of the Social Security Act provides that the public-debt obligations issued for purchase by the HI trust fund shall have maturities fixed with due regard for the needs of the funds. The usual practice in the past has been to spread the holdings of special issues, as of each June 30, so that the amounts maturing in each of the next 15 years are approximately equal. Special public-debt obligations are redeemable at par at any time.
Spell of illness. A period of consecutive days beginning with the first day on which a beneficiary is furnished inpatient hospital or extended care services and ending with the close of the first period of 60 consecutive days thereafter in which the beneficiary is in neither a hospital or skilled nursing facility.
Summarized cost rate. The ratio of the present value of expenditures to the present value of the taxable payroll for the years in a given period. In this context, the expenditures are on an incurred basis and
Glossary
95
exclude costs for certain uninsured persons, for whom payments are reimbursed from the general fund of the Treasury, and for voluntary enrollees, who pay a premium in order to be enrolled. The summarized cost rate includes the cost of reaching and maintaining a “target” trust fund level, or contingency fund ratio. Because a trust fund level of about one year’s expenditures is considered to be an adequate reserve for unforeseen contingencies, the targeted contingency fund ratio used in determining summarized cost rates is 100 percent of annual expenditures. Accordingly, the summarized cost rate is equal to the ratio of (a) the sum of the present value of the outgo during the period plus the present value of the targeted ending trust fund level plus the beginning trust fund level, to (b) the present value of the taxable payroll during the period.
Summarized income rate. The ratio of (a) the present value of the tax revenues incurred during a given period (from both payroll taxes and taxation of OASDI benefits) to (b) the present value of the taxable payroll for the years in the period.
Supplementary Medical Insurance (SMI). The Medicare program which pays for a portion of the costs of physician’s services, outpatient hospital services, and other related medical and health services for voluntarily enrolled aged and disabled individuals. Also known as Medicare Part B.
Tax rate. The percentage of taxable earnings, up to the maximum tax base, that is paid for the HI tax. Currently, the percentages are 1.45 for employees and employers, each. The self-employed pay 2.9 percent.
Taxable earnings. Taxable wages and/or self-employment income under the prevailing annual maximum taxable limit.
Taxable payroll. A weighted average of taxable wages and taxable self-employment income. When multiplied by the combined employee-employer tax rate, it yields the total amount of taxes incurred by employees, employers, and the self-employed for work during the period.
Taxable self-employment income. Net earnings from self employment, generally above $400 and below the annual maximum taxable amount for a calendar or other taxable year, less any taxable wages in the same taxable year.
Taxable wages. Wages paid for services rendered in covered employment up to the annual maximum taxable amount.

Appendices
96
Taxation of benefits. Beginning in 1994, up to 85 percent of an individual’s or a couple’s OASDI benefits is potentially subject to federal income taxation under certain circumstances. The revenue derived from taxation of benefits in excess of 50 percent, up to 85 percent, is allocated to the HI trust fund.
Taxes. See “Payroll taxes.”
Test of Long-Range Close Actuarial Balance. Summarized income rates and cost rates are calculated for each of 66 valuation periods within the full 75-year long-range projection period under the intermediate assumptions. The first of these periods consists of the next 10 years. Each succeeding period becomes longer by 1 year, culminating with the period consisting of the next 75 years. The long-range test is met if, for each of the 66 time periods, the actuarial balance is not less than zero or is negative by, at most, a specified percentage of the summarized cost rate for the same time period. The percentage allowed for a negative actuarial balance is 5 percent for the full 75-year period and is reduced uniformly for shorter periods, approaching zero as the duration of the time periods approaches the first 10 years. The criterion for meeting the test is less stringent for the longer periods in recognition of the greater uncertainty associated with estimates for more distant years.
Test of Short-Range Financial Adequacy. The conditions required to meet this test are as follows: If the trust fund ratio for a fund exceeds 100 percent at the beginning of the projection period, then it must be projected to remain at or above 100 percent throughout the 10-year projection period; alternatively, if the fund ratio is initially less than 100 percent, it must be projected to reach a level of at least 100 percent within 5 years (and not be depleted at any time during this period) and then remain at or above 100 percent throughout the remainder of the 10-year period. This test is applied to trust fund projections made under the intermediate assumptions.
Trust fund. Separate accounts in the United States Treasury mandated by Congress whose assets may only be used for a specified purpose. For the HI trust fund, monies not withdrawn for current benefit payments and administrative expenses are invested in interest-bearing federal securities, as required by law; the interest earned is also deposited in the trust fund.
Glossary
97
Trust fund ratio. A short-range measure of the adequacy of the trust fund level; defined as the assets at the beginning of the year expressed as a percentage of the outgo during the year.
Unit input intensity allowance. The amount added to or subtracted from the hospital input price index to yield the PPS update factor.
Valuation period. A period of years which is considered as a unit for purposes of calculating the status of a trust fund.
Voluntary enrollee. Certain individuals aged 65 or older or disabled, who are not otherwise entitled to Medicare who opt to obtain coverage under Part A by paying a monthly premium.
Year of exhaustion. The first year in which a trust fund is unable to pay benefits when due because the assets of the fund are exhausted.

Appendices
98
E. STATEMENT OF ACTUARIAL OPINION
It is my opinion that (1) the techniques and methodology used herein to evaluate the financial status of the Federal Hospital Insurance Trust Fund are based upon sound principles of actuarial practice and are generally accepted within the actuarial profession; and (2) the assumptions used and the resulting actuarial estimates are, in the aggregate, reasonable for the purpose of evaluating the financial status of the trust fund, taking into consideration the experience and expectations of the program.
Although the assumptions used are reasonable, much of the available evidence suggests that they may not be optimal. In particular, the likelihood of a future result that is more adverse than the intermediate projection may exceed the likelihood of a more favorable result. Similarly, an outcome more adverse than the high cost projection may be more probable than one that is better than the low cost projection. This concern is exacerbated by the adoption in this year’s annual report of new short-range real wage assumptions that are significantly more optimistic than those used in recent annual reports—and that have rarely been matched by actual economic performance over the last 25 years.
The future cost of the Hospital Insurance program is very uncertain and reasonable people can disagree concerning the most probable economic and demographic trends. For these reasons, projections are shown in this report under three different sets of assumptions intended to illustrate a broad range of possible outcomes. Readers are cautioned not to focus solely on just one set of assumptions but rather to recognize that any result within the range shown can reasonably be expected to occur.
As noted in this report, the Hospital Insurance trust fund is projected to be seriously out of financial balance under all three sets of assumptions. Thus, regardless of the specific assumptions used, the need for prompt attention to the fund’s financial imbalance is apparent.
Richard S. Foster Fellow, Society of Actuaries Member, American Academy of Actuaries Chief Actuary, Health Care Financing Administration