1995 seed production research
TRANSCRIPT
1995SEED PRODUCTION RESEARCH
AT OREGON STATE UNIVERSITYUSDA-ARS COOPERATING
Edited by William C. Young III
Department of Crop and Soil Science Ext/CrS 106, 3/96
Page
Residue Management Options for Willamette Valley Grass Seed CropsIntensive Management of Grass Seed Crop Straw and StubbleWeed Control in Tall Fescue Over Three Growing SeasonsWeed Control in Perennial Ryegrass - Third Year ResultsStand Density Effects on Annual Ryegrass Seed CropsCrop Residue Management and Establishment Systems for Annual Ryegrass Seed ProductionManaging Slugs in Grasses Grown for SeedOccurrence of Blind Seed in the Willamette ValleyEffect of Disease Control on Seed Yields of Creeping Red FescueWeed Seed Survival in Composted Grass Seed StrawWater Stress Impacts on Dieback of Perennial Ryegrass Seed FieldsInfluence of Stubble and Plant Growth Regulators on Creeping Red Fescue Seed CropsLeaf and Tiller Development in Seedling and Established Perennial Grass Seed CropsSelection for Stem Rust Resistance in Tall FescueSeed Yield Responses of Five Tall Fescue Selections Susceptible or Resistant to Stem RustPotential Denitrification Losses in Perennial Ryegrass Seed ProductionEffects of Post-Harvest Residue Management on Kentucky Bluegrass Seed Yield in Central OregonResidue Management and Herbicides in Kentucky Bluegrass Seed ProductionWater Use of Bluegrass Seed and Its Effect on YieldEvaluation of Herbicides for Control of Roughstalk Bluegrass in Kentucky Bluegrass, 1994-1995Development of Control Program for Ergot in Kentucky Bluegrass Seed ProductionErgot Level Effect of Seed Stock on Disease IncidencePotential Alternatives to Field Burning in the Grande Ronde ValleyPreliminary Evaluations of Primisulfuron for Downy Brome Control in Eastern Oregon Kentucky
Bluegrass Seed Production 66
Effect of Field Burning on a Native Red Fescue Ecotype 68
Seed Yield Response of Blue Wildrye to Burning With a Propane Flamer 69
Optimal Forage Removal Time for Red Clover Seed Production 70
Changes in Ryegrass Seedling Root Fluorescence During Three Generations of Seed Increase 73
The Use of RAPDs to Differentiate Annual and Perennial Ryegrass 77
RAPD Analysis of Dry Turfgrass Seed 79
Restriction Amplification Fragment Length Polymorphisms (RAFLP) in Perennial Ryegrass 81
6
9
14
2023
25
2828
30
3234
3639
404445
48
55
5859
61
61

The following authors have contributed to this report. Use of a commercial or proprietaryproduct in research does not constitute an endorsement of the product by the U.S.
Department of Agriculture or Oregon State University.
Central Oregon Agricultural Research CenterD.D. Coats, Former Faculty Research AssistantF.J. Crowe, Superintendent, Associate Professor of Botany and Plant PathologyM.K. Durette, Undergraduate Student WorkerNA. Farris, Faculty Research AssistantA.R. Mitchell, Assistant Professor of Crop and Soil ScienceC.L. Yang, Faculty Research Assistant
Columbia Basin Agricultural Research CenterD.A. Ball, Assistant Professor of Weed ScienceD.L. Walenta, Faculty Research Assistant
Cooperative Extension Service - OSUS. Aldrich-Markham, Extension Agent, Yamhill CountyM.D. Butler, Extension Agent, Jefferson CountyG.H. Cook, Extension Agent, Union CountyG.A. Gingrich, Extension Agent, Marion CountyJ.A. Leffel, Retired Extension Agent, Washington CountyM.E. Mellbye, District Extension Agent, Linn, Benton and Lane Counties
Department of Crop and Soil Science - OSUT.G. Chastain, Associate Professor Seed Crop PhysiologyH.R. Danielson, Senior Instructor and Manager, OSU Seed LaboratoryB.E. Gamroth, Graduate Research AssistantC.J. Garbacik, Senior Faculty Research AssistantP.D. Meints, Graduate Research AssistantB.M. Quebbeman, Former Faculty Research AssistantT.M. Velloza, Graduate Research AssistantW.C. Young III, Associate Professor and Extension Agronomist
Department of Entomology - OSUJ.T. DeFrancesco, Senior Faculty Research AssistantG.C. Fisher, Professor and Extension Entomology SpecialistR.N. Horton, Faculty Research Assistant
Eastern Oregon State CollegeG.L. Kiemnec, Associate Professor of Crop Science
National Forage Seed Production Research Center - USDA-ARSS.C. Alderman, Research Plant PathologistM.D. Azevedo, Biological TechnicianG.M. Banowetz, Research MicrobiologistR.E. Barker, Research GeneticistD.M. Bilsland, Senior Faculty Research AssistantD.B. Churchill, Agricultural EngineerD.S. Culver, Biological TechnicianL.F. Elliott, Research Microbiologist and Research LeaderS.M. Griffith, Research Plant PhysiologistW.R. Horwath, Research Soil MicrobiologistG.W. Mueller-Warrant, Research AgronomistS.C. Rosato, Faculty Research AssistantJ.J. Steiner, Research AgronomistR.E. Welty, Research Plant Pathologist
USDA-Natural Resources Conservation ServiceD.C. Darns, Manager, Plant Materials CenterT.R. Flessner, Conservation Agronomist, Plant Materials CenterM.T. Kruskamp, Bio. Sci. Technician, Plant Materials Center
OtherR.J. Burr, Contract researcher, Ag Research, Inc., Sublimity, ORT.K. Danneberger, Associate Professor, Ohio State University, Columbus, OHD.J. Floyd, Research Agronomist, Pickseed West, Tangent, ORR.C. Golembiewski, Graduate Research Assistant, Ohio State University, Columbus, OHM.B. McDonald, Professor, Seed Physiology, Ohio State University, Columbus, OHP.M. Sweeney, Senior Research Associate, Ohio State University, Columbus, OHP.J. Wigington, Jr., Hydrologist, U.S. Environmental Protection Agency, Corvallis, ORJ. Zhang, Visiting Scholar, Seed Physiology, Ohio State University, Columbus, OH

This report has been published with a grant from the Oregon Seed Council
1995SEED PRODUCTION RESEARCH
AT OREGON STATE UNIVERSITYUSDA-ARS COOPERATING
Edited by William C. Young III
RESIDUE MANAGEMENT OPTIONSFOR WILLAMETTE VALLEY
GRASS SEED CROPS
7'. G. Chastain, W. C. Young III, Cf. Garbacik, B.MQuebbeman, G.A. Gingrich, ME. Mellbye and
S. Aldrich-Markham
IntroductionLegislation implemented by the State of Oregon requiresthe incremental reduction in field burning of grass seedcrop straw and stubble in the Willamette Valley. As theacreage set aside for burning dwindles, seed growers needto adopt effective and economical nonthermal managementalternatives. This article documents the findings of ourthree-year study funded by the State Department of Agri-culture to identif' and compare residue management op-tions for grass seed crops grown in the Willamette Valley.
ProcedureThe research was conducted in commercial seed productionfields of perennial ryegrass, tall fescue, orchardgrass,creeping red fescue, Chewings fescue, and Highlandbentgrass.
Residue management strategies examined at the on-farmsites included: (i) removal of straw by baling (Bale), (ii)baling, followed by flail chopping stubble (Flail), (iii) bal-ing and flailing, followed by residue removal with a nee-dle-nose rake (Rake), (iv) baling, followed by removal ofthe residue by vacuum-sweeper (Vacuum), (v) flail-chop-ping straw and stubble three times with no removal (Flail3X), (vi) baling, followed by incineration of straw andstubble by propane burner (Propane), and (vii) open-fieldburning (Bum). Residue management operations wereconducted in 1992, 1993, and 1994 after the first, second,and third seed harvests in each field, respectively. Strawremaining in the field and the height of stubble afternonthermal treatment was measured.
I
Fall regrowth characteristics were measured on samplestaken in fall 1992, 1993, and 1994. Fertile and springvegetative tiller numbers were also determined at each site.Plots were harvested with the growers' swathers and com-bines. Weigh wagons were used to determine the bulk seedweight harvested from each plot. Clean seed yield wascalculated from percent cleanout values obtained from thebulk seed and from seed laboratory purity results. Seedgermination and purity values were determined by the OSUSeed Laboratory.
Baling removed most of the straw remaining after harvest.Stubble height was reduced by the Flail treatment, but noadditional straw was removed. The Rake treatment re-moved more than half the straw remaining after baling.Vacuum was the most effective treatment for removingstraw and reducing stubble height. Since field burning ofstraw and stubble is known to return nutrients to the soil,some concern has been expressed that clean nonthermalmanagement systems may tend to remove nutrients fromthe field with the straw. To counter this removal, somegrowers have shown interest in nonthermal managementwith no removal (i.e., Flail 3X). We compared soil testsdrawn from Vacuum- and Flail 3X-treated plots and foundthat straw removal caused only minor reductions in pH andpotassium levels in the upper six inches of the soil profile.Nevertheless, it is important to point out that at no timeduring the study were any of the nutrients tested reducedbelow critical levels by straw removal.
Fall Regrowth and Plant DevelopmentNear complete removal of straw and stubble (Vacuum) intall fescue often produced the shortest tiller height in thefollowing fall (Table 1). No residue removal (Flail 3X) orremoval without stubble height reduction (Bale) oftencaused tillers to be taller in fall. Regrowth of orchardgrasswas not affected by residue management method. Fall re-growth of perennial ryegrass was generally not affected byresidue management. One notable exception was the con-sistent increase in tiller height found when Manhattan lIE
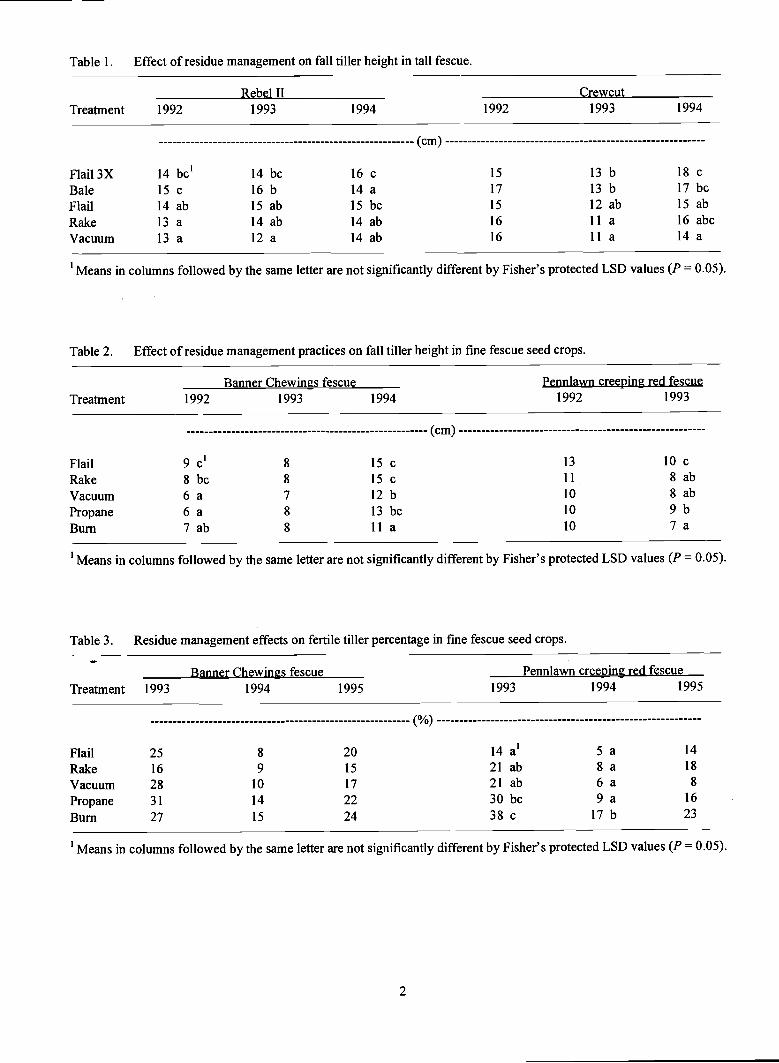
Table 1. Effect of residue management on fall tiller height in tall fescue.
(cm)
Flail3X 14 bc' 14 bc 16 c 15 13 b 18 C
Bale 15 c 16 b 14 a 17 13 b 17 bcFlail 14 ab 15 ab 15 bc 15 12 ab 15 abRake 13 a 14 ab 14 ab 16 11 a 16 abcVacuum 13 a 12 a 14 ab 16 11 a 14 a
'Means in columns followed by the same letter are not significantly different by Fisher's protected LSD values (P = 0.05).
Table 2. Effect of residue management practices on fall tiller height in fme fescue seed crops.
'in columns followed by the same letter are not significantly different by Fisher's protected LSD values (P = 0.05).
Table 3. Residue management effects on fertile tiller percentage in fine fescue seed crops.
Banner Chewings fescue Pennlawn creeping red fescueTreatment 1993 1994 1995 1993 1994 1995
2
(%)
Flail 25 8 20 14 a' 5 a 14
Rake 16 9 15 21 ab 8 a 18
Vacuum 28 10 17 21 ab 6 a 8
Propane 31 14 22 30 bc 9 a 16
Burn 27 15 24 38 c 17 b 23
(cm)
Flail 9 c' 8 15 c 13 10 cRake 8 bc 8 15 c 11 8 abVacuum 6 a 7 12 b 10 8 abPropane 6 a 8 13 bc 10 9 bBum 7ab 8 ha 10 7a
'Means in columns followed by the same letter are not significantly different by Fisher's protected LSD values (P = 0.05).
Treatment 1992 1993 1994 1992 1993 1994
Banner Chewings fescue Pennlawn creeping red fescueTreatment 1992 1993 1994 1992 1993
Rebel II Crewcut
perennial ryegrass was managed by the Propane treatment.We used time domain reflectometry to measure how soilwater content was affected by residue management in tallfescue and perennial ryegrass. No differences in soil watercontent were observed between Flail 3X and Vacuumtreatments in late June of each year (near peak anthesis).Nevertheless, by late September, the Vacuum treatmentaveraged 24% and 10% less soil water than Flail 3X at 3-inch and 9-inch soil depths, respectively. Yet once theplant canopy was removed after harvest, the straw in theFlail 3X treatment acted as a mulch and conserved waterduring the dry summer months. Increased late summer soilwater under the straw mulch did not improve fall regrowthof Flail 3X-treated plants.
There was a marked tendency for fall tiller height to betaller in treatments that did not thoroughly remove strawand stubble in Chewings fescue and creeping red fescue(Table 2). For instance, the Flail treatment produced tallerfall tillers than the Bum treatment in 1992 and 1994 inChewings fescue, and in creeping red fescue in 1993. Atrend toward reduction in tiller population observed in theburn treatment in Chewings fescue was noted in all threeautumns. There were pronounced visual differences be-tween stands in the open bum treatment and the nonthermaltreatments. It was evident that although burning seemed toproduce somewhat fewer tillers, burning also produced thegreatest proportion of large tillers basal diameter tillers in1994. Burn and Propane treatments tended to producemore large basal diameter tillers than nonthermal practicesin creeping red fescue.
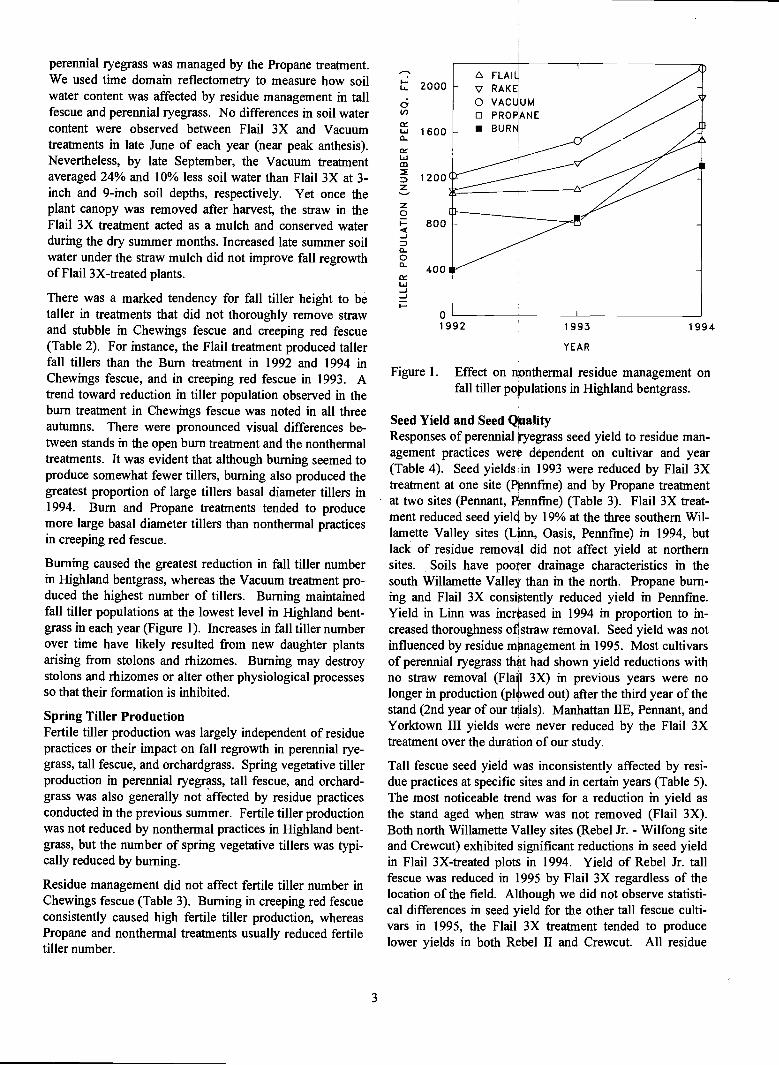
Burning caused the greatest reduction in fall tiller numberin Highland bentgrass, whereas the Vacuum treatment pro-duced the highest number of tillers. Burning maintainedfall tiller populations at the lowest level in Highland bent-grass in each year (Figure 1). Increases in fall tiller numberover time have likely resulted from new daughter plantsarising from stolons and rhizomes. Burning may destroystolons and rhizomes or alter other physiological processesso that their formation is inhibited.
Spring Tiller ProductionFertile tiller production was largely independent of residuepractices or their impact on fall regrowth in perennial rye-grass, tall fescue, and orchardgrass. Spring vegetative tillerproduction in perennial ryegrass, tall fescue, and orchard-grass was also generally not affected by residue practicesconducted in the previous summer. Fertile tiller productionwas not reduced by nonthermal practices in Highland bent-grass, but the number of spring vegetative tillers was typi-cally reduced by burning.
Residue management did not affect fertile tiller number inChewings fescue (Table 3). Burning in creeping red fescueconsistently caused high fertile tiller production, whereasPropane and nonthermal treatments usually reduced fertiletiller number.
3
I-
aC,,
1600
Ui
1200
z0800
400
0
FLAII4
v RAKE
O VACUUMo PROPANE
BURI
1992 1993 1994
YEAR
Figure 1. Effect on nonthermal residue management onfall tiller populations in Highland bentgrass.
Seed Yield and Seed QualityResponses of perennial 'ryegrass seed yield to residue man-agement practices were dependent on cultivar and year(Table 4). Seed yields in 1993 were reduced by Flail 3Xtreatment at one site (Pennfme) and by Propane treatmentat two sites (Pennant, Pennfme) (Table 3). Flail 3X treat-ment reduced seed yield by 19% at the three southern Wil-lamette Valley sites (Ljnn, Oasis, Pennfme) in 1994, butlack of residue removal did not affect yield at northernsites. Soils have poorer drainage characteristics in thesouth Willamette Valley than in the north. Propane burn-ing and Flail 3X consistently reduced yield in Pennfme.Yield in Linn was increased in 1994 in proportion to in-creased thoroughness of straw removal. Seed yield was notinfluenced by residue management in 1995. Most cultivarsof perennial ryegrass that had shown yield reductions withno straw removal (Flal 3X) in previous years were nolonger in production (pkwed out) after the third year of thestand (2nd year of our trials). Manhattan lIE, Pennant, andYorktown 111 yields were never reduced by the Flail 3Xtreatment over the duraton of our study.
Tall fescue seed yield was inconsistently affected by resi-due practices at specific sites and in certain years (Table 5).The most noticeable trend was for a reduction in yield asthe stand aged when straw was not removed (Flail 3X).Both north Willamette alley sites (Rebel Jr. - Wilfong siteand Crewcut) exhibited significant reductions in seed yieldin Flail 3X-treated plots in 1994. Yield of Rebel Jr. tallfescue was reduced in 1995 by Flail 3X regardless of thelocation of the field. Although we did not observe statisti-cal differences in seed yield for the other tall fescue culti-vars in 1995, the Flail 3X treatment tended to producelower yields in both Rebel II and Crewcut. All residue
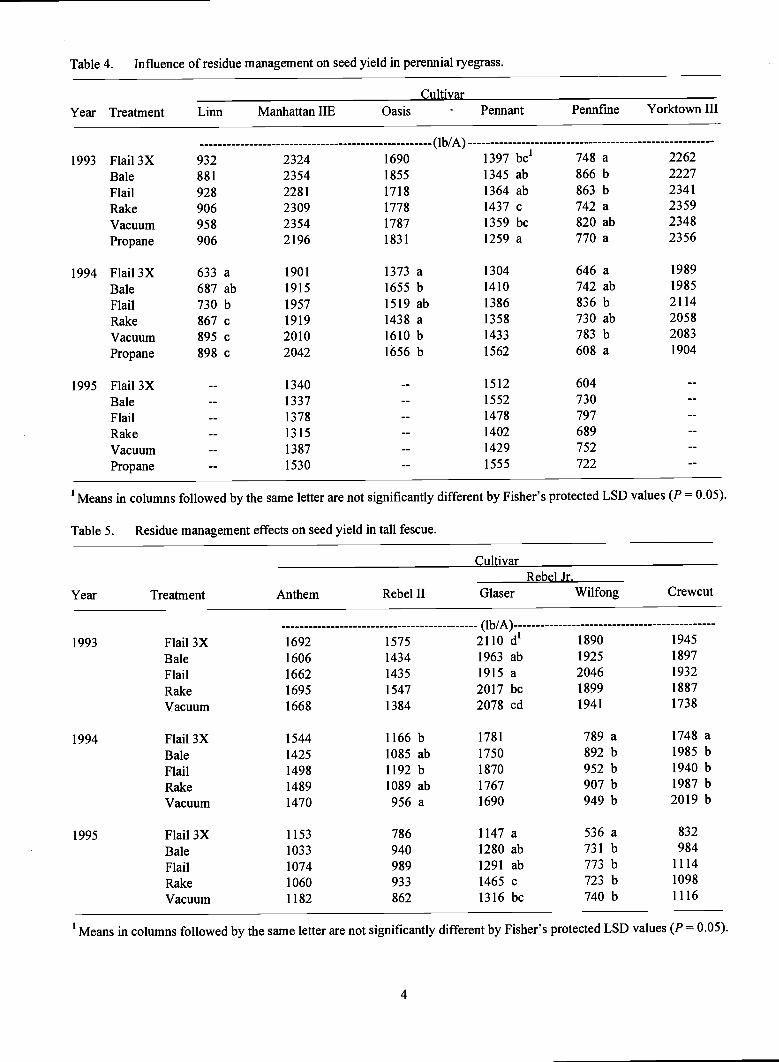
Table 4. Influence of residue management on seed yield in perennial ryegrass.
CultivarYear Treatment Linn Manhattan lIE Oasis Pennant Pennfme Yorktown III
(lb/A)
1993 Flail3X 932 2324 1690 1397 bc' 748 a 2262
Bale 881 2354 1855 1345 ab 866 b 2227
Flail 928 2281 1718 1364 ab 863 b 2341
Rake 906 2309 1778 1437 c 742 a 2359
Vacuum 958 2354 1787 1359 bc 820 ab 2348
Propane 906 2196 1831 1259 a 770 a 2356
1994 Flail3X 633 a 1901 1373 a 1304 646 a 1989
Bale 687 ab 1915 1655 b 1410 742 ab 1985
Flail 730 b 1957 1519 ab 1386 836 b 2114
Rake 867 c 1919 1438 a 1358 730 ab 2058
Vacuum 895 c 2010 1610 b 1433 783 b 2083
Propane 898 c 2042 1656 b 1562 608 a 1904
1995 Flail3X 1340 1512 604
Bale 1337 1552 730
Flail 1378 1478 797
Rake 1315 1402 689
Vacuum 1387 1429 752
Propane 1530 1555 722
'Means in columns followed by the same letter are not significantly different by Fisher's protected LSD values (P = 0.05).
Table 5. Residue management effects on seed yield in tall fescue.
CultivarRebel Jr.
Year Treatment Anthem Rebel II Glaser Wilfong Crewcut
(lb/A)
1993 Flail3X 1692 1575 2110 d' 1890 1945
Bale 1606 1434 1963 ab 1925 1897
Flail 1662 1435 1915 a 2046 1932
Rake 1695 1547 2017 bc 1899 1887
Vacuum 1668 1384 2078 cd 1941 1738
1994 Flail3X 1544 1166 b 1781 789 a 1748 a
Bale 1425 1085 ab 1750 892 b 1985 b
Flail 1498 1192 b 1870 952 b 1940 b
Rake 1489 1089 ab 1767 907 b 1987 b
Vacuum 1470 956 a 1690 949 b 2019 b
1995 Flail3X 1153 786 1147 a 536 a 832
Bale 1033 940 1280 ab 731 b 984
Flail 1074 989 1291 ab 773 b 1114
Rake 1060 933 1465 c 723 b 1098
Vacuum 1182 862 1316 bc 740 b 1116
'Means in columns followed by the same letter are not significantly different by Fisher's protected LSD values (P = 0.05).
4

management treatments produced equivalent yields in or-chardgrass over the three-year duration of our study (Table6).
Table 6. Influence of residue management on Elsie or-chardgrass seed yield.
All nonthermal residue management treatments producedseed yields that were inferior to open-field burning increeping red fescue except the Vacuum treatment in 1993(Table 7). Propane burning produced seed yields that wereequivalent to burning in 1993 and 1995. Nonthermal resi-due treatments burning produced yields that were not ac-ceptable over the entire duration of the study in creepingred fescue. Chewings fescue seed yields in the WillametteValley were not influenced by residue management methodin any year during our study (Table 7).
No differences in seed yield were evident in Highlandbentgrass in 1993 and in 1995 (Table 7). Rake and Vac-uum treatments produced seed yields that were equivalentto open-field burning in Highland bentgrass in 1994, butPropane and Flail reduced yields.
Seed germination in all seed crops tested was not influ-enced by thoroughness of straw and stubble removal. Formost treatments and seed crops, seed purity was not af-fected by residue management practices. However, puritywas sometimes lessened in the Flail 3X treatment. Thiswas usually due to an increase in inert matter and wassometimes accompanied by increased percent cleanout.Nonthermal treatments other than the Vacuum treatmenttended to increase the presence of weed seed in Chewingsfescue.
Conclusions and RecommendationsHigh perennial ryegrass and tall fescue seed yields can beattained without thermal management of post-harvest strawand stubble. Perennial ryegrass and tall fescue seed yieldswere best maintained over the life of the stand by nonther-ma! management practices that remove more than 60% ofthe straw. Perennial ryegrass seed yield was independentof fall regrowth and plant development, whereas the heightof tall fescue regrowth in fall seemed to have some impacton subsequent seed yields. To our surprise, perennial rye-grass seed yield was inversely related in proportion to theproduction of spring vegetative tillers (r _0.88*) and wasnot related to fertile tiller production (r = 0.21). Orchard-
5
grass plant performance and seed yields were never influ-enced by residue management practices.
Table 7. Residue mnagement effects on fme fescue andHighland bntgrass seed yield.
Year Treatment
Penilawn Bannercre ping Chewings Highland
red i'escue fescue bentgrass
(lb/A)
Means in columns followed by the same letter are notsignificantly different by Fisher's protected LSD values(P = 0.05).
Since the numbers of tillers produced in fall might not berelated to seed yield in Highland bentgrass or Chewingsfescue, it is possible that the environment in which the till-ers are formed may play a role in determining seed yield.Fall regrowth and fertile tiller production were both linkedto successful seed produ$tion in creeping red fescue.
Growers need to be aware that failure to remove any strawfrom perennial ryegrass and tall fescue fields can some-times reduce seed yield and purity. Better methods formanaging a full straw load in these crops need to be devel-oped. Full straw management should not be attempted inChewings fescue, Highl4nd bentgrass, or creeping red fes-cue. Growers interested in using nonthermal methods inany of these crops need to be mindful of the potential forincreased weed problens as has been demonstrated inChewings fescue. At present, we recommend that post-harvest residues in creeping red fescue be managed withopen-field burning.
1993 Flail 694 a' 1072 594Rake 717 a 1075 590Vacuum 914 b 991 587Propane 876 b 1042 611Bum 1023 b 1057 610
1994 Flail 544 a 613 710 aRake 58 a 607 734 abVacuum 498 a 670 778 bPropane 542 a 695 686 aBurn 752 b 625 763 b
1995 Flail 527 a 411 242Rake 477 a 370 249Vacuum 414 a 355 257Propane 518 ab 271 255Burn 67 b 341 251
Flail 3X 921 502 24Bale 961 448 54Flail 926 496 15
Rake 946 446 32Vacuum 914 458 629
Treatment 1993 1994 1995
(lb/A)
INTENSIVE MANAGEMENT OF GRASSSEED CROP STRAW AND STUBBLE
7'. G. Chastain, W. C. Young III, G.L. Kiemnec,C.J. Garbacik, B.M Quebbeman, G.A. Gingrich,
ME. Mellbye and G.H. Cook
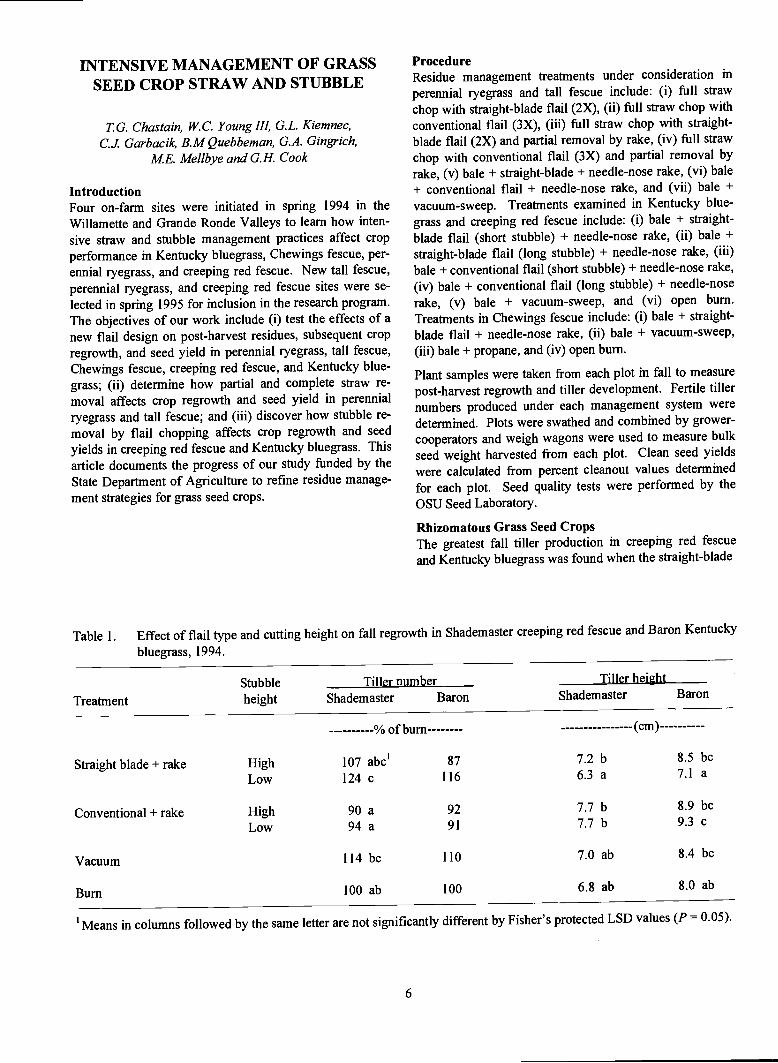
IntroductionFour on-farm sites were initiated in spring 1994 in theWillamette and Grande Ronde Valleys to learn how inten-sive straw and stubble management practices affect cropperformance in Kentucky bluegrass, Chewings fescue, per-ennial ryegrass, and creeping red fescue. New tall fescue,perennial ryegrass, and creeping red fescue sites were se-lected in spring 1995 for inclusion in the research program.The objectives of our work include (i) test the effects of anew flail design on post-harvest residues, subsequent cropregrowth, and seed yield in perennial ryegrass, tall fescue,Chewings fescue, creeping red fescue, and Kentucky blue-grass; (ii) determine how partial and complete straw re-moval affects crop regrowth and seed yield in perennialryegrass and tall fescue; and (iii) discover how stubble re-moval by flail chopping affects crop regrowth and seedyields in creeping red fescue and Kentucky bluegrass. Thisarticle documents the progress of our study funded by theState Department of Agriculture to refine residue manage-ment strategies for grass seed crops.
Table 1. Effect of flail type and cutting height on fall regrowth in Shademaster creeping red fescue and Baron Kentucky
bluegrass, 1994.
ProcedureResidue management treatments under consideration inperennial ryegrass and tall fescue include: (i) full strawchop with straight-blade flail (2X), (ii) full straw chop withconventional flail (3X), (iii) full straw chop with straight-blade flail (2X) and partial removal by rake, (iv) full strawchop with conventional flail (3X) and partial removal byrake, (v) bale + straight-blade + needle-nose rake, (vi) bale+ conventional flail + needle-nose rake, and (vii) bale +vacuum-sweep. Treatments examined in Kentucky blue-grass and creeping red fescue include: (i) bale + straight-blade flail (short stubble) + needle-nose rake, (ii) bale +straight-blade flail (long stubble) + needle-nose rake, (iii)bale + conventional flail (short stubble) + needle-nose rake,(iv) bale + conventional flail (long stubble) + needle-noserake, (v) bale + vacuum-sweep, and (vi) open bum.Treatments in Chewings fescue include: (i) bale + straight-blade flail + needle-nose rake, (ii) bale + vacuum-sweep,(iii) bale + propane, and (iv) open burn.
Plant samples were taken from each plot in fall to measurepost-harvest regrowth and tiller development. Fertile tillernumbers produced under each management system weredetermined. Plots were swathed and combined by grower-cooperators and weigh wagons were used to measure bulk
seed weight harvested from each plot. Clean seed yieldswere calculated from percent cleanout values determinedfor each plot. Seed quality tests were performed by theOSU Seed Laboratory.
Rhizomatous Grass Seed CropsThe greatest fall tiller production in creeping red fescueand Kentucky bluegrass was found when the straight-blade
% of burn
6
(cm)
7.2 b 8.5 bc6.3a 7.la
7.7 b 8.9 bc7.7b 9.3c
7.0 ab 8.4 bc
6.8 ab 8.0 ab
'Means in columns followed by the same letter are not significantly different by Fisher's protected LSD values (P = 0.05).
Bum 100 ab 100
Straight blade + rake High 107 abc' 87
Low 124 c 116
Conventional + rake High 90 a 92
Low 94 a 91
Vacuum 114 bc 110
Stubble Tiller number Tiller height
Treatment height Shademaster Baron Shademaster Baron
flail was operated at the low (1.25 and 0.83 inches, respec-tively) stubble height setting (Table 1). The straight-bladeflail tended to produce more fall tillers in both seed cropsthan the conventional flail. Tiller number was lower thanwas expected in both seed crops when the conventionalflail was operated at the low stubble height setting. Reduc-tion in stubble height caused a reduction in fall tiller heightin both species when the stubble was chopped by thestraight-blade flail, but not by the conventional flail. Thelikely reason for the differential response to stubbleheightamong flail types was that the cutting height could belowered more with the straight-blade flail than with theconventional flail. The difference in cutting heightbetween the high and low cut for the conventional flailaveraged 0.27 inches, whereas the difference between thehigh and low cut for the straight-blade flail averaged 0.55inches.Fertile tiller production was reduced by nonthermalmanagement in creeping red fescue but was not affected byresidue management practices in Kentucky bluegrass
'Means in columns followed by the same letter are notsignificantly different by Fisher's protected LSD values (P= 0.05).
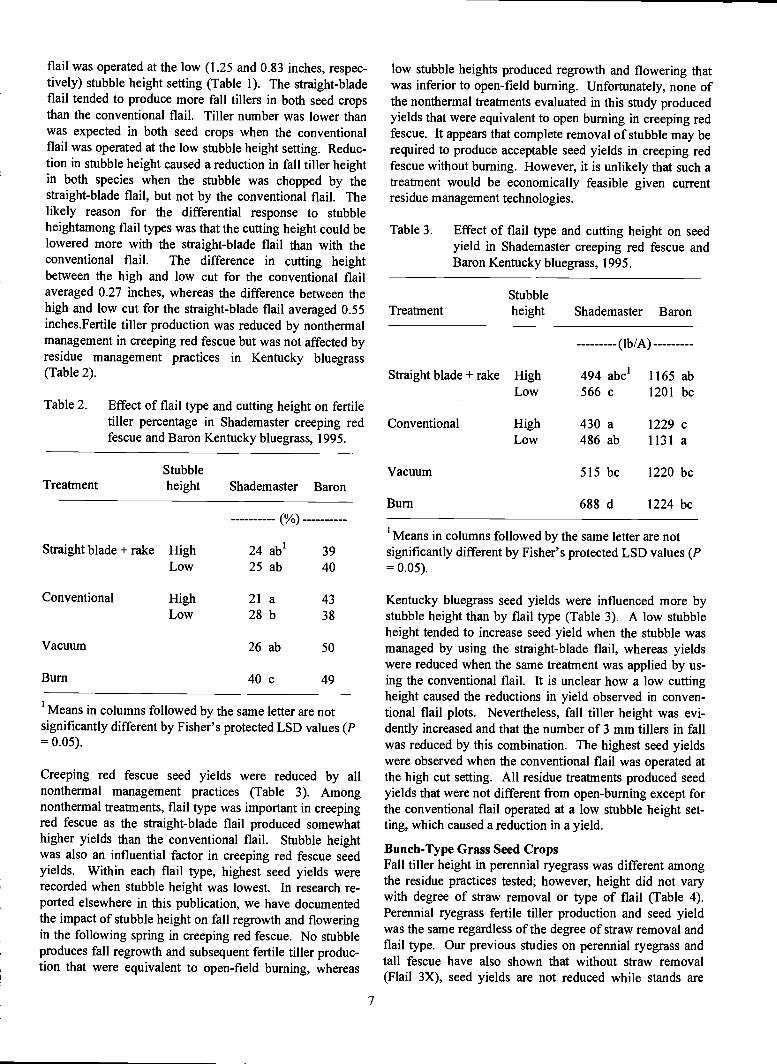
Creeping red fescue seed yields were reduced by allnonthermal management practices (Table 3). Amongnonthermal treatments, flail type was important in creepingred fescue as the straight-blade flail produced somewhathigher yields than the conventional flail. Stubble heightwas also an influential factor in creeping red fescue seedyields. Within each flail type, highest seed yields wererecorded when stubble height was lowest. In research re-ported elsewhere in this publication, we have documentedthe impact of stubble height on fall regrowth and floweringin the following spring in creeping red fescue. No stubbleproduces fall regrowth and subsequent fertile tiller produc-tion that were equivalent to open-field burning, whereas
7
low stubble heights produced regrowth and flowering thatwas inferior to open-field burning. Unfortunately, none ofthe nonthermal treatments evaluated in this study producedyields that were equivalent to open burning in creeping redfescue. It appears that complete removal of stubble may berequired to produce acceptable seed yields in creeping redfescue without burning. However, it is unlikely that such atreatment would be economically feasible given currentresidue management technologies.
'Means in columns followed by the same letter are notsignificantly different by Fisher's protected LSD values (P= 0.05).
Kentucky bluegrass seed yields were influenced more bystubble height than by flail type (Table 3). A low stubbleheight tended to increase seed yield when the stubble wasmanaged by using the straight-blade flail, whereas yieldswere reduced when the same treatment was applied by us-ing the conventional flail. It is unclear how a low cuttingheight caused the reductions in yield observed in conven-tional flail plots. Nevertheless, fall tiller height was evi-dently increased and that the number of 3 mm tillers in fallwas reduced by this combination. The highest seed yieldswere observed when the conventional flail was operated atthe high cut setting. All residue treatments produced seedyields that were not different from open-burning except forthe conventional flail operated at a low stubble height set-ting, which caused a reduction in a yield.
Bunch-Type Grass Seed CropsFall tiller height in perennial ryegrass was different amongthe residue practices tested; however, height did not varywith degree of straw removal or type of flail (Table 4).Perennial ryegrass fertile tiller production and seed yieldwas the same regardless of the degree of straw removal andflail type. Our previous studies on perennial ryegrass andtall fescue have also shown that without straw removal(Flail 3X), seed yields are not reduced while stands are
(Table 2).
Table 2. Effect of flail type and cutting height on fertiletiller percentage in Shademaster creeping redfescue and Baron Kentucky bluegrass, 1995.
TreatmentStubbleheight Shademaster Baron
(%)
Straight blade + rake High 24 ab' 39Low 25ab 40
Conventional High 21a 43Low 28b 38
Vacuum 26ab 50
Bum 40c 49
Table 3. Effect of flail type and cutting height on seedyield in Shademaster creeping red fescue andBaron Kentucky bluegrass, 1995.
TreatmentStubbleheight Shademaster Baron
(lb/A)
Straight blade + rake High 494 abc' 1165 abLow 566 c 1201 bc
Conventional High 430 a 1229 cLow 486 ab 1131 a
Vacuum 515 bc 1220 bc
Burn 688 d 1224 bc
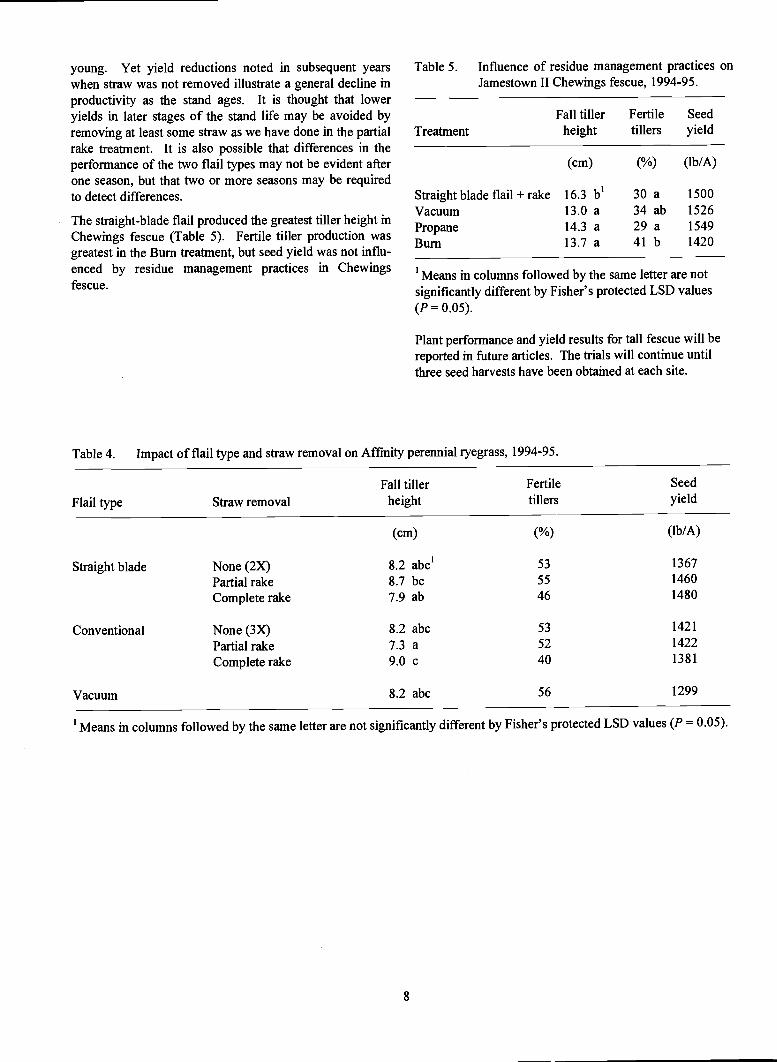
young. Yet yield reductions noted in subsequent yearswhen straw was not removed illustrate a general decline inproductivity as the stand ages. It is thought that loweryields in later stages of the stand life may be avoided byremoving at least some straw as we have done in the partialrake treatment. It is also possible that differences in theperformance of the two flail types may not be evident afterone season, but that two or more seasons may be requiredto detect differences.
The straight-blade flail produced the greatest tiller height inChewings fescue (Table 5). Fertile tiller production wasgreatest in the Bum treatment, but seed yield was not influ-enced by residue management practices in Chewingsfescue.
8
Table 5. Influence of residue management practices onJamestown II Chewings fescue, 1994-95.
'Means in columns followed by the same letter are notsignificantly different by Fisher's protected LSD values(P = 0.05).
Plant performance and yield results for tall fescue will bereported in future articles. The trials will continue untilthree seed harvests have been obtained at each site.
1500152615491420
'Means in columns followed by the same letter are not significantly different by Fisher's protected LSD values (P = 0.05).
Table 4. Impact of flail type and straw removal on Affmity perennial ryegrass, 1994-95.
Fall tiller Fertile Seed
Flail type Straw removal height tillers yield
(cm) (%) (lb/A)
Straight blade None (2X) 8.2 abc' 53 1367
Partial rake 8.7 bc 55 1460
Complete rake 7.9 ab 46 1480
Conventional None (3X) 8.2 abc 53 1421
Partial rake 7.3 a 52 1422
Complete rake 9.0 c 40 1381
Vacuum 8.2 abc 56 1299
Fall tiller Fertile SeedTreatment height tillers yield
(cm) (%) (lb/A)
Straight blade flail + rake 16.3 b' 30 aVacuum 13.0 a 34 abPropane 14.3 a 29 aBum 13.7 a 41 b
WEED CONTROL IN TALL FESCUEOVER THREE GROWING SEASONS
G. W. Mueller-Warrant, S.C. Rosato and D.S. Culver
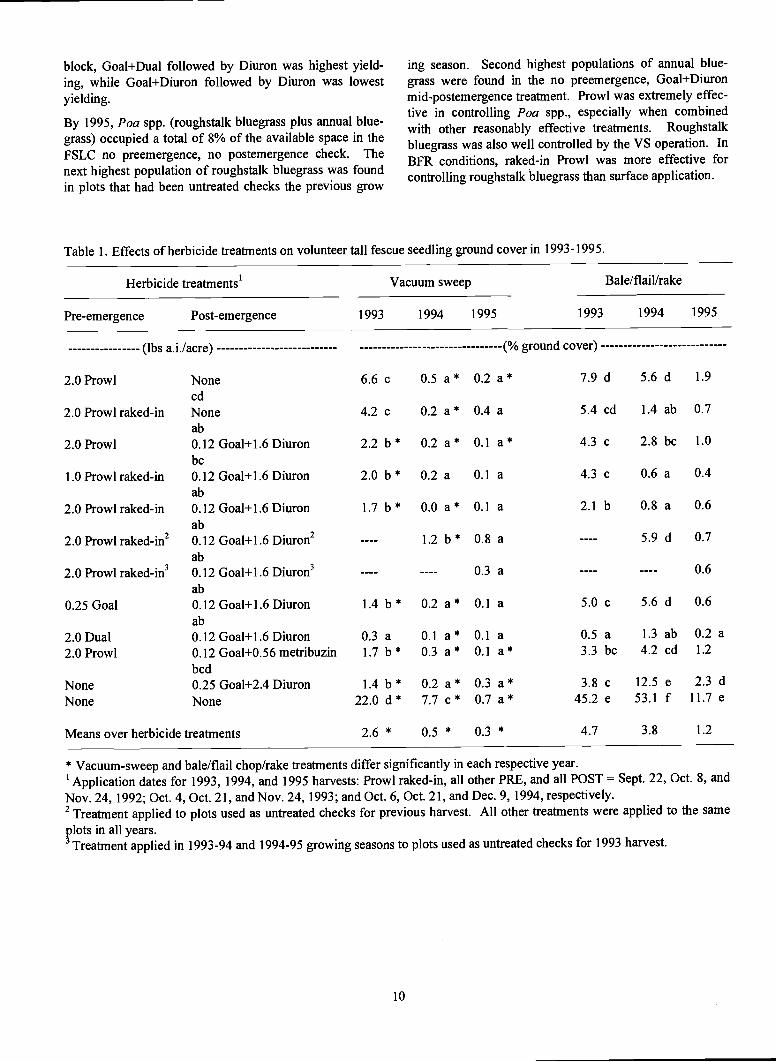
Vacuum sweep (VS), bale/flail chop/needlenose rake(BFR), and full straw load chop in place (FSLC) manage-ment have been imposed on a Rebel Jr. tall fescue fieldsince the summer of 1992. Herbicide treatments have beenapplied to the same subplots each year with a few excep-tions: untreated checks have been rotated with duplicateapplications of relatively aggressive treatments, an En-quik+0.8 lbs/acre Diuron treatment in FSLC for the firstyear was replaced with Goal+0.8 lbs/acre Diuron for thenext two years, and granular rake-incorporated Prowl inFSLC the first two years was replaced the third year withthe standard EC formulation sprayed under the straw usinga modified Rear's straight-blade flail. Weed populationswere counted during late winter, with volunteer tall fescuebeing the primary weed, although roughstalk bluegrass(Poa trivialis) and annual bluegrass (Poa annua) becameconcerns in some treatments by the third year. Plots wereharvested by swathing into windrows followed by combin-ing with a Wintersteiger plot combine when dry.
Most herbicide treatments provided adequate control ofvolunteer tall fescue seedlings in VS and BFR managementin all three years (Table 1). Volunteer tall fescue seedlingground cover in the untreated checks in BFR varied from ahigh of 53% in 1994 to a low of 12% in 1995, while in VSit varied from 22% in 1993 to 1% in 1995. The poor es-tablishment of tall fescue seedlings in the 1994-95 growingseason was probably caused by high rainfall and prolongedstanding water. Volunteer tall fescue control was signifi-cantly better in VS than BFR in 22 out 32 cases, with bothsystems providing near total control in another 8 cases.The trend for improved performance of VS over time wasprobably related to better operating conditions or greateroperator expertise. Dual followed by Goal+Diuron pro-vided nearly total control in all cases. Postemergence ap-plication of Goal+2.4 lbs/acre Diuron without a preemer-gence treatment provided only 76% control in BFR in1994. Prowl incorporated with a rotary rake tedder wassignificantly more effective than simple surface applicationin 4 out of 6 cases in BFR, while differences were nonsig-nificant in VS.
Treatments had no significant effect on seed yield in 1993for both VS and BFR (Table 2). In 1994, VS yielded sig-nificantly more than BFR for 3 out of 11 herbicide treat-ments. Lowest yield for both VS and BFR occurred inplots which had been the untreated checks the previousyear, pointing to the potential for year-old volunteer cropseedlings and other weeds to compete with the crop. Yieldin 1994 with BFR for surface-applied Prowl without anypost-emergence treatment was also reduced by competitionwith year-old seedlings. In 1995, VS yielded significantly
9
more than BFR for 7 out of 12 herbicide treatments. Yieldswere low in 1995 in plots which had been untreated checksin previous years in both VS and BFR. Yields were alsolow in 1995 for the sequential Goal followed byGoal+Diuron treatment, similar to results obtained in other,earlier studies.
Weed control was generally poorer in FSLC than VS orBFR, despite application of more aggressive herbicidetreatments in FSLC (Table 3). Incorporated Prowl by itselfprovided an average of 67% control of volunteer tall fescueseedlings. A tank-mix of the maximum labeled rates ofGoal+Diuron applied mid-postemergence controlled anaverage of 62% of the seedlings, while the sequential ap-plication of early postemergence Goal followed by latepostemergence Diuron controlled slightly more, an averageof 67%. Best control was achieved by early postemergenceGoal+Dual followed by late postemergence Diuron, al-though this treatment still allow nearly 7 times as manyseedlings to establish as occurred with preemergence Dualfollowed by postemergence Goal+Diuron in VS and BFR.Incorporated Prowl significantly improved control in allcases in the first two years, and when applied without anypostemergence treatment in the third year.
Tall fescue seed yield with FSLC management (Table 4)was substantially lower than with VS or BFR (Tables 2) in1993, 1994, and 1995. Tall fescue grown with FSLC man-agement appeared to suffer from both competition withweeds and injury from herbicide treatments. Weeds in-cluded volunteer tall fescue seedlings, older volunteerplants, roughstalk bluegrass, and annual bluegrass. Lowestyields in FSLC in 1993 occurred in treatments which al-lowed large numbers of seedling tall fescue and roughstalkbluegrass to survive. Lowest yields in 1994 (464 lbs/acre,Table 4) occurred in plots which had been the fully un-treated checks in the first year of the study, receiving nei-ther preemergence incorporated Prowl nor any early or latepostemergence treatment. Yields were significantly lowerwithout preemergence treatment than with Prowl incorpo-rated through the straw for 3 out of the 8 postemergencetreatments in 1993, 5 out of 8 in 1994, and 3 out of 8 in1995 (Table 4). Averaged over all postemergence herbi-cide treatments, total yields over the three year period forincorporated-Prowl exceeded those for the no-preemer-gence treatment by 451 lbs/acre. Highest yields in 1994occurred for preemergence Prowl-only (1018 lbs/acre) andfor preemergence Prowl followed by early Goal+Dual andlate Diuron (1051 lbs/acre). While tall fescue is generallyless sensitive to competition from volunteer crop seedlingsthan perennial ryegrass is, tall fescue yield in 1994 wasreduced by weed competition (seedling volunteers plusroughstalk bluegrass) in the no preemergence, no post-emergence full straw check (766 lbs/acre) compared to thepreemergence Prowl-only treatment (1018 lbs/acre). In1995, postemergence treatments in FSLC had no signifi-cant effects on seed yield in the preemergence incorpo-rated-Prowl blocks. In the no preemergence treatment
block, Goal+Dual followed by Diuron was highest yield-ing, while Goal+Diuron followed by Diuron was lowestyielding.
By 1995, Poa spp. (roughstalk bluegrass plus annual blue-grass) occupied a total of 8% of the available space in theFSLC no preemergence, no postemergence check. Thenext highest population of roughstalk bluegrass was foundin plots that had been untreated checks the previous grow
Table 1. Effects of herbicide treatments on volunteer tall fescue seedling ground cover in 1993-1995.
2.0 Prowl
2.0 Prowl raked-in
2.0 Prowl
1.0 Prowl raked-in
2.0 Prowl raked-in
2.0 Prowl raked-in2
2.0 Prowl raked-in3
0.25 Goal
2.0 Dual2.0 Prowl
NoneNone
Herbicide treatments'
* Vacuum-sweep and'Application dates forNov. 24, 1992; Oct. 4,2 Treatment applied toplots in all years.Treatment applied in
NonecdNoneab0.12 Goal+1.6 Diuronbc0.12 Goal+1.6 Diuronab0.12 Goal+l.6 Diuronab0.12 Goal+1.6 Diuron2ab0.12 Goal+1.6 Diuron3ab0.12 Goal+1.6 Diuronab0.12 Goal+1.6 Diuron0.12 Goal+0.56 metribuzinbcd0.25 Goal+2.4 DiuronNone
ing season. Second highest populations of annual blue-grass were found in the no preemergence, Goal+Diuronmid-postemergence treatment. Prowl was extremely effec-tive in controlling Poa spp., especially when combinedwith other reasonably effective treatments. Roughstalkbluegrass was also well controlled by the VS operation. InBFR conditions, raked-in Prowl was more effective forcontrolling roughstalk bluegrass than surface application.
Vacuum sweep Bale/flaillrake
6.6 c 0.5 a * 0.2 a * 7.9 d 5.6 d 1.9
4.2 c 0.2 a* 0.4 a 5.4 cd 1.4 ab 0.7
2.2 b * 0.2 a * 0.1 a * 4.3 c 2.8 bc 1.0
2.0 b * 0.2 a 0.1 a 4.3 c 0.6 a 0.4
1.7 b * 0.0 a * 0.1 a 2.1 b 0.8 a 0.6
1.2 b* 0.8 a 5.9 d 0.7
0.3 a 0.6
1.4 b * 0.2 a * 0.1 a 5.0 c 5.6 d 0.6
0.3 a 0.1 a* 0.1 a 0.5 a 1.3 ab 0.2 a1.7 b * 0.3 a * 0.1 a * 3.3 bc 4.2 cd 1.2
1.4 b * 0.2 a * 0.3 a * 3.8 c 12.5 e 2.3 d22.0 d * 7.7 c * 0.7 a * 45.2 e 53.1 f 11.7 e
bale/flail chop/rake treatments differ significantly in each respective year.1993, 1994, and 1995 harvests: Prowl raked-in, all other PRE, and all POST = Sept. 22, Oct. 8, and
Oct. 21, and Nov. 24, 1993; and Oct. 6, Oct. 21, and Dec. 9, 1994, respectively.plots used as untreated checks for previous harvest. All other treatments were applied to the same
1993-94 and 1994-95 growing seasons to plots used as untreated checks for 1993 harvest.
10
Pre-emergence Post-emergence 1993 1994 1995 1993 1994 1995
Means over herbicide treatments 2.6 * 0.5 * 03 * 4.7 3.8 1.2
(lbs a.i./acre) (% ground cover)
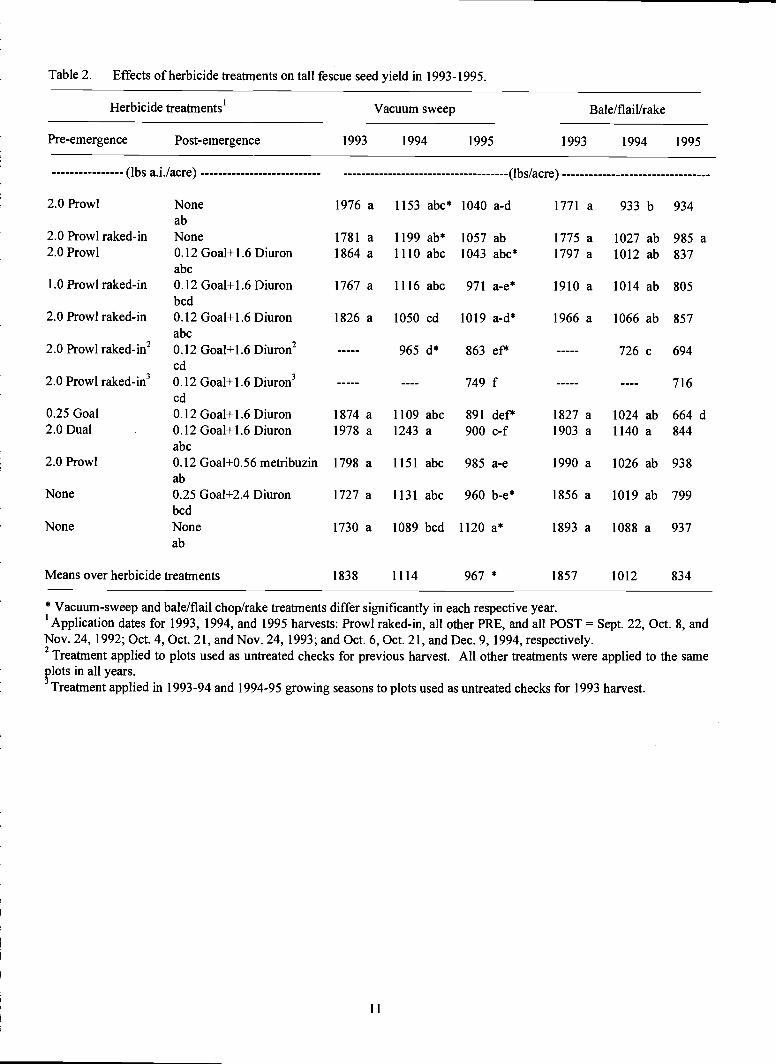
Table 2. Effects of herbicide treatments on tall fescue seed yield in 1993-1995.
Herbicide treatments1 Vacuum sweep Bale/flail/rake
Pre-emergence Post-emergence 1993 1994 1995 1993 1994 1995
(lbs a.i./acre) (lbs/acre)
2.0 Prowl None 1976 a 1153 abc* 1040 a-d 1771 a 933 b 934ab
2.0 Prowl raked-in None 1781 a 1199 ab* 1057 ab 1775 a 1027 ab 985 a2.0 Prowl 0.12 Goal+1.6 Diuron 1864 a 1110 abc 1043 abc* 1797 a 1012 ab 837
abc1.0 Prowl raked-in 0.12 Goal+1.6 Diuron 1767 a 1116 abc 971 ae* 1910 a 1014 ab 805
bcd2.OProwlraked-in 0.12 Goal+1.6 Diuron 1826 a 1050 cd 1019 ad* 1966 a 1066 ab 857
abc2.0 Prowl raked-in2 0.12 Goal+1.6 Diuron2 965 d* 863 ef1' 726 C 694
cd2.0 Prowl raked-in3 0.12 Goal+1.6 Diuron3 749 f 716
cd0.25 Goal 0.12 Goal+1.6 Diuron 1874 a 1109 abc 891 deF 1827 a 1024 ab 664 d2.0 Dual 0.12 Goal+1.6 Diuron 1978 a 1243 a 900 c-f 1903 a 1140 a 844
abc2.0 Prowl 0.12 Goal+0.56metribuzin 1798 a 1151 abc 985 a-e 1990 a 1026 ab 938
abNone 0.25 Goal+2.4 Diuron 1727 a 1131 abc 960 be* 1856 a 1019 ab 799
bcdNone None 1730 a 1089 bcd 1120 a* 1893 a 1088 a 937
ab
Means over herbicide treatments 1838 1114 967 * 1857 1012 834
* Vacuum-sweep and bale/flail chop/rake treatments differ significantly in each respective year.dates for 1993, 1994, and 1995 harvests: Prowl raked-in, all other PRE, and all POST = Sept. 22, Oct. 8, and
Nov. 24, 1992; Oct. 4, Oct. 21, and Nov. 24, 1993; and Oct. 6, Oct. 21, and Dec. 9, 1994, respectively.2Treatment applied to plots used as untreated checks for previous harvest. All other treatments were applied to the same
?lots in all years.Treatment applied in 1993-94 and 1994-95 growing seasons to plots used as untreated checks for 1993 harvest.
11
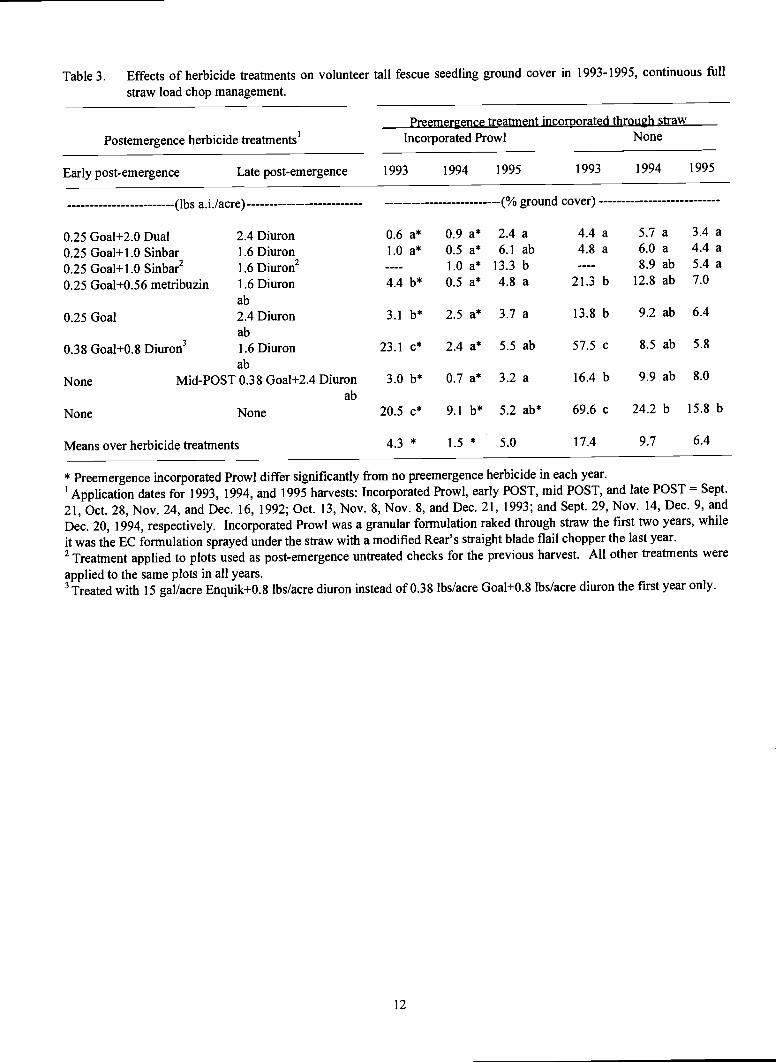
Table 3. Effects of herbicide treatments on volunteer tall fescue seedling ground cover in 1993-1995, continuous full
straw load chop management.
Postemergence herbicide treatments'Preemergence treatment incorporated through straw
Incorporated Prowl None
Early post-emergence Late post-emergence 1993 1994 1995 1993
(lbs a.i./acre) (% ground cover)
0.25 Goal+2.0 Dual 2.4 Diuron 0.6 a* 0.9 a* 2.4 a 4.4 a0.25 Goal+1.0 Sinbar 1.6 Diuron 1.0 a 0.5 a* 6.1 ab 4.8 a0.25 Goal+1.0 Sinbar2 1.6 Diuron2 1.0 a* 13.3 b0.25 Goal+0.56 metribuzin 1.6 Diuron 4.4 b* 0.5 a* 4.8 a 21.3 b
ab0.25 Goal 2.4 Diuron 3.1 b* 2.5 a* 3.7 a 13.8 b
ab0.38 Goal+0.8 Diuron3 1.6Diuron 23.1 c" 2.4 a* 5.5 ab 57.5 c
abNone Mid-POST 0.38 GoaI+2.4 Diuron 3.0 b* 0.7 a* 3.2 a 16.4 b
ab
None None 20.5 c" 9.1 b* 5.2 ab* 69.6 c
Means over herbicide treatments 4.3 * 1.5 * 5.0 17.4
* Preemergence incorporated Prowl differ significantly from no preemergence herbicide in each year.'Application dates for 1993, 1994, and 1995 harvests: Incorporated Prowl, early POST, mid POST, and late POST = Sept.
21, Oct. 28, Nov. 24, and Dec. 16, 1992; Oct. 13, Nov. 8, Nov. 8, and Dec. 21, 1993; and Sept. 29, Nov. 14, Dec. 9, andDec. 20, 1994, respectively. Incorporated Prowl was a granular formulation raked through straw the first two years, while
it was the EC formulation sprayed under the straw with a modified Rear's straight bladeflail chopper the last year.2 Treatment applied to plots used as post-emergence untreated checks for the previous harvest. All other treatments were
applied to the same plots in all years.with 15 gallacre Enquik+0.8 lbs/acre diuron instead of 0.38 lbs/acre Goal+0.8 lbs/acre diuron the first year only.
12
1994 1995
5.7 a 3.4 a6.0 a 4.4 a8.9 ab 5.4 a
12.8 ab 7.0
9.2 ab 6.4
8.5 ab 5.8
9.9 ab 8.0
24.2 b 15.8 b
9.7 6.4
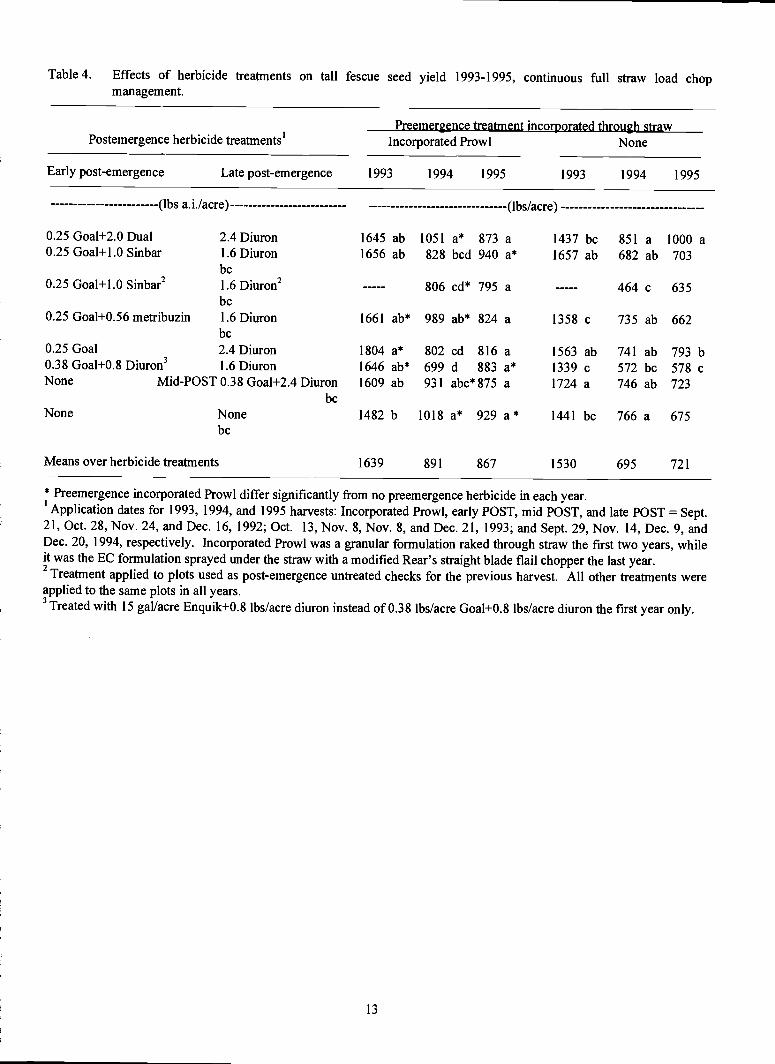
Table 4. Effects of herbicide treatments on tall fescue seed yield 1993-1995, continuous full straw load chopmanagement.
Postemergence herbicide treatments'Preemergence treatment incorporated through straw
Incorporated Prowl None
(lbs a.i./acre) (lbs/acre)
0.25 Goal+2.0 Dual 2.4Diuron 1645 ab 1051 a* 873 a 1437 bc 851 a 1000 a0.25 GoaI+1.0 Sinbar 1.6Diuron 1656 ab 828 bcd 940 a* 1657 ab 682 ab 703
bc0.25 Goal+1.0 Sinbar2 1.6 Diuron2 806 cd* 795 a 464 C 635
bc0.25 Goal+0.56 metribuzin 1.6Diuron 1661 ab* 989 ab* 824 a 1358 c 735 ab 662
bc0.25 Goal 2.4Diuron 1804 a* 802 cd 816 a 1563 ab 741 ab 793 b0.38 Goal+0.8 Diuron3 l.6Diuron 1646 ab* 699 d 883 a* 1339 c 572 bc 578 cNone Mid-POST 0.38 Goal+2.4Diuron 1609 ab 931 abc* 875 a 1724 a 746 ab 723
bcNone None 1482 b 1018 a* 929 a* 1441 bc 766 a 675
bc
Means over herbicide treatments 1639 891 867 1530 695 721
* Preemergence incorporated Prowl differ significantly from no preemergence herbicide in each year.'Application dates for 1993, 1994, and 1995 harvests: Incorporated Prowl, early POST, mid POST, and late POST = Sept.21, Oct. 28, Nov. 24, and Dec. 16, 1992; Oct. 13, Nov. 8, Nov. 8, and Dec. 21, 1993; and Sept. 29, Nov. 14, Dec. 9, andDec. 20, 1994, respectively. Incorporated Prowl was a granular formulation raked through straw the first twoyears, whileit was the EC formulation sprayed under the straw with a modified Rear's straight blade flail chopper the lastyear.2
Treatment applied to plots used as post-emergence untreated checks for the previous harvest. All other treatments wereapplied to the same plots in all years.
with 15 gal/acre Enquik+0.8 lbs/acre diuron instead of 0.38 lbs/acre Goal+0.8 lbs/acre diuron the firstyear only.
13
Early post-emergence Late post-emergence 1993 1994 1995 1993 1994 1995
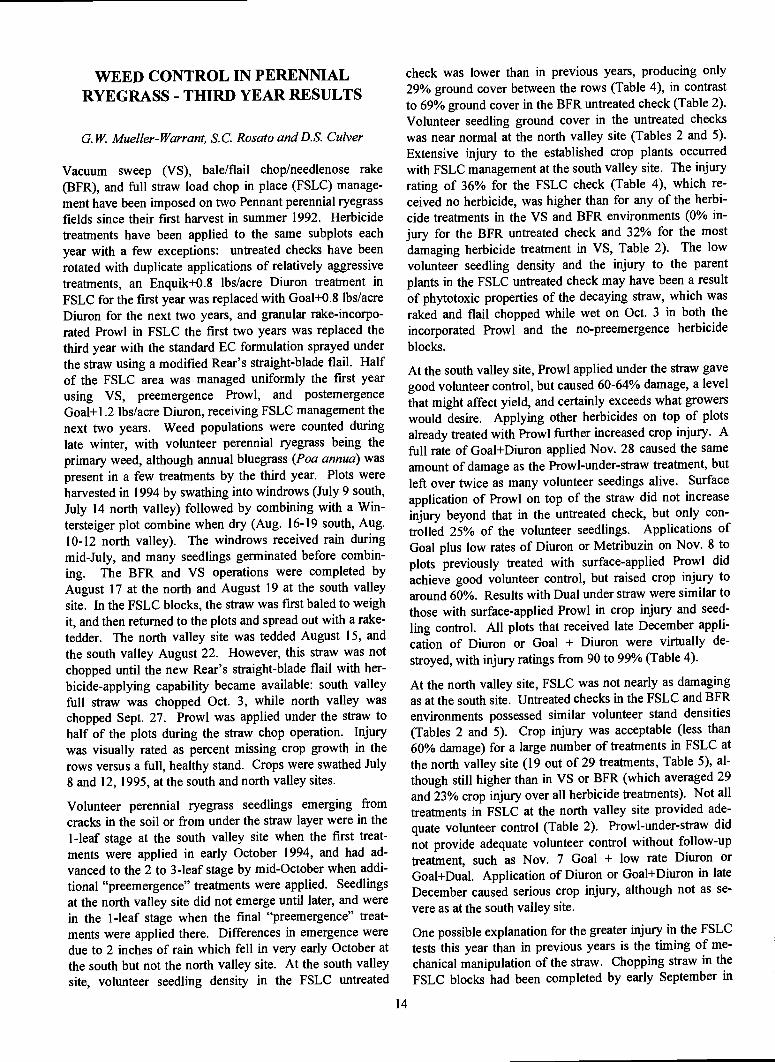
WEED CONTROL IN PERENNIALRYEGRASS - THIRD YEAR RESULTS
G. W. Mueller-Warrant, S.C. Rosato and D.S. Culver
Vacuum sweep (VS), bale/flail chop/needlenose rake(BFR), and full straw load chop in place (FSLC) manage-merit have been imposed on two Pennant perennial ryegrassfields since their first harvest in summer 1992. Herbicidetreatments have been applied to the same subplots eachyear with a few exceptions: untreated checks have beenrotated with duplicate applications of relatively aggressivetreatments, an Enquik+0.8 lbs/acre Diuron treatment inFSLC for the first year was replaced with Goal+0.8 lbs/acreDiuron for the next two years, and granular rake-incorpo-rated Prowl in FSLC the first two years was replaced thethird year with the standard EC formulation sprayed underthe straw using a modified Rear's straight-blade flail. Halfof the FSLC area was managed uniformly the first yearusing VS, preemergence Prowl, and postemergenceGoal+1 .2 lbs/acre Diuron, receiving FSLC management thenext two years. Weed populations were counted duringlate winter, with volunteer perennial ryegrass being theprimary weed, although annual bluegrass (Poa annua) waspresent in a few treatments by the third year. Plots wereharvested in 1994 by swathing into windrows (July 9 south,July 14 north valley) followed by combining with a Win-tersteiger plot combine when dry (Aug. 16-19 south, Aug.10-12 north valley). The windrows received rain duringmid-July, and many seedlings germinated before combin-ing. The BFR and VS operations were completed byAugust 17 at the north and August 19 at the south valleysite. In the FSLC blocks, the straw was first baled to weighit, and then returned to the plots and spread out with a rake-tedder. The north valley site was tedded August 15, andthe south valley August 22. However, this straw was notchopped until the new Rear's straight-blade flail with her-bicide-applying capability became available: south valleyfull straw was chopped Oct. 3, while north valley waschopped Sept. 27. Prowl was applied under the straw tohalf of the plots during the straw chop operation. Injurywas visually rated as percent missing crop growth in therows versus a full, healthy stand. Crops were swathed July
8 and 12, 1995, at the south and north valley sites.
Volunteer perennial ryegrass seedlings emerging fromcracks in the soil or from under the straw layer were in the1-leaf stage at the south valley site when the first treat-ments were applied in early October 1994, and had ad-vanced to the 2 to 3-leaf stage by mid-October when addi-tional "preemergence" treatments were applied. Seedlingsat the north valley site did not emerge until later, and werein the 1-leaf stage when the final "preemergence" treat-ments were applied there. Differences in emergence weredue to 2 inches of rain which fell in very early October atthe south but not the north valley site. At the south valleysite, volunteer seedling density in the FSLC untreated
14
check was lower than in previous years, producing only29% ground cover between the rows (Table 4), in contrastto 69% ground cover in the BFR untreated check (Table 2).Volunteer seedling ground cover in the untreated checkswas near normal at the north valley site (Tables 2 and 5).Extensive injury to the established crop plants occurredwith FSLC management at the south valley site. The injuryrating of 36% for the FSLC check (Table 4), which re-ceived no herbicide, was higher than for any of the herbi-cide treatments in the VS and BFR environments (0% in-jury for the BFR untreated check and 32% for the mostdamaging herbicide treatment in VS, Table 2). The lowvolunteer seedling density and the injury to the parentplants in the FSLC untreated check may have been a resultof phytotoxic properties of the decaying straw, which wasraked and flail chopped while wet on Oct. 3 in both theincorporated Prowl and the no-preemergence herbicideblocks.
At the south valley site, Prowl applied under the straw gavegood volunteer control, but caused 60-64% damage, a levelthat might affect yield, and certainly exceeds what growerswould desire. Applying other herbicides on top of plotsalready treated with Prowl further increased crop injury. Afull rate of Goal+Diuron applied Nov. 28 caused the sameamount of damage as the Prowl-under-straw treatment, butleft over twice as many volunteer seedings alive. Surfaceapplication of Prowl on top of the straw did not increaseinjury beyond that in the untreated check, but only con-trolled 25% of the volunteer seedlings. Applications ofGoal plus low rates of Diuron or Metribuzin on Nov. 8 toplots previously treated with surface-applied Prowl didachieve good volunteer control, but raised crop injury toaround 60%. Results with Dual under straw were similar tothose with surface-applied Prowl in crop injury and seed-ling control. All plots that received late December appli-
cation of Diuron or Goal + Diuron were virtually de-stroyed, with injury ratings from 90 to 99% (Table 4).
At the north valley site, FSLC was not nearly as damagingas at the south site. Untreated checks in the FSLC and BFRenvironments possessed similar volunteer stand densities(Tables 2 and 5). Crop injury was acceptable (less than60% damage) for a large number of treatments in FSLC atthe north valley site (19 out of 29 treatments, Table 5), a!-
though still higher than in VS or BFR (which averaged 29
and 23% crop injury over all herbicide treatments). Not all
treatments in FSLC at the north valley site provided ade-quate volunteer control (Table 2). Prowl-under-straw didnot provide adequate volunteer control without follow-uptreatment, such as Nov. 7 Goal + low rate Diuron orGoal+Dual. Application of Diuron or Goal+Diuron in lateDecember caused serious crop injury, although not as se-vere as at the south valley site.
One possible explanation for the greater injury in the FSLC
tests this year than in previous years is the timing of me-chanical manipulation of the straw. Chopping straw in the
FSLC blocks had been completed by early September in

previous years, and the 3 week delay in chopping in latesummer of 1994 may be the primary reason for the greatercrop injury. Damage was most severe in blocks receivingtheir third consecutive year of full straw management, butwas almost as bad in the second-year areas. The tests didnot have a new first year full straw treatment in the 1994-95 growing season. Plant samples dug this spring revealedhigh numbers of inhibitory microorganisms in the fullstraw blocks. Given the weak condition of the ryegrass inthe second and third year full straw no-herbicide checks, itis not surprising that most of the herbicide treatmentscaused serious stand loss. Still, the substantially greatercrop injury seen this year than in previous years poses aproblem for growers desiring to use FSLC management intheir perennial ryegrass.
At the north valley site, seed yield in VS plots was not af-fected by herbicide treatment, and averaged 1068 lbs/acre(Table 3). In BFR plots, the three highest yielding treat-ments averaged 1191 lbs/acre, significantly outyielding thethree lowest yielding treatments, which averaged 1004lbs/acre. Two of the three lowest yielding treatments werealso the treatments with the poorest control of volunteerperennial ryegrass (the untreated check and postemergence-only Goal+Diuron, Table 2). Yield in FSLC blocks wasalso strongly affected by volunteer seedlings: the fourtreatments with poorest control averaged 846 lbs/acre,whereas the remaining 25 treatments averaged 1069lbs/acre (Table 5). Interestingly, the two treatments withthe highest injury ratings (around 85% damage, Nov. 8Goal+Dual followed by Dec. 20 1.6 lbs/acre Diuron, withor without Sept. 27 Prowl-under-straw) were the highestyielding treatments at this site.
Injury at the south valley site was much more severe thanat the north site, and residue management treatments dif-fered in yield, with VS and BFR greatly outyielding FSLC(Tables 3 and 4). Nearly all of the perennial ryegrassplants present at harvest in those FSLC plots that had ex-ceeded 90% injury came from seedlings that germinated inlate winter and early spring after the herbicides had dissi-pated. Perennial ryegrass yielded well for all herbicide
15
treatments with both VS and BFR management. Raked-inProwl followed by Goal+Diuron applied to plots that hadbeen the untreated checks in the previous growing seasonproduced the highest yield in both VS and BFR. Manysurviving plants from the previous year's seedlings werepresent in this treatment, but had been thinned and suffi-ciently injured to be mistaken for current-year seedlings,and their presence increased the seed yield. Yield for thepostemergence-only Goal+Diuron treatment in VS man-agement was significantly reduced compared to the fourhighest yielding treatments, a result of competition frominadequately controlled seedlings. Yield with FSLC man-agement was reduced by all treatments exceeding an Aprilcrop injury rating of 64%. The most severely injured plots,the ten treatments that received Diuron or Goal+Diuron inlate December, averaged only 311 lbs/acre of seed. Treat-ments providing adequate control of volunteer seedlingswith FSLC management at the south valley site withoutreducing seed yield included Prowl under straw, Prowl onstraw or Dual under straw followed by Nov. 8Goal+Diuron or Goal+Metribuzin, and Roundup rowspray.
Numerous herbicide treatments provided adequate controlof volunteer seedlings over all three years with VS andBFR management, and maintained normal seed yields.Results with FSLC management were much more variable,with some treatments providing adequate volunteer seed-ling control in one year but not another, or at one site butnot another. Similarly, crop tolerance under FSLC man-agement varied from year to year and site to site. Whenvolunteer seedlings were adequately controlled and cropinjury was not excessive, perennial ryegrass grown withFSLC management produced similar yields to that grownwith VS or BFR. While other weeds did not become seri-ous problems at these sites, annual bluegrass was presentby the end of the study in those VS and BFR plots that hadnot received Prowl, while it was absent in all Prowl-treatedplots and in all treatments under FSLC management.

Table 1. Crop injury in vacuum sweep and bale/flail/rake at both perennial ryegrass sites, 1995 harvest.
Herbicide treatments (lbs ai/acre)' South valley perennial ryegrass North valley perennial ryegrass
Pre-emergence Post-emergence VS BFR Average VS BFR Average
Means over herbicide treatments 13 * 8 10 28 22 25
* Indicates vacuum sweep and bale/flaillrake differed significantly.1 Prowl raked-in, other pre-emergence treatments, and all post-emergence treatments were applied in fall 1994 at south and
north valley sites on Oct. 7 and 12, Oct. 21 and 24, and Nov. 28 and 5, respectively.2Treatment applied for two years to plots used as untreated checks for the 1993 harvest.3Treatment applied to plots used as untreated checks for the 1994 harvest.
16
(% less than full stand in early spring)
Prowl 2.0 None 8 abc 4 a 6 a-d 34 c * 17 abc 25 bcdProwl 2.0 raked-in None 15 cd * 6 ab 11 de 34 c * 21 bcd 28 cdProwl 2.0 Goal 0.12 + Diuron 1.2 11 bc 5 ab 8 cd 29 bc 25 c-f 27 cdProwl 1.0 raked-in Goal 0.12 + Diuron 1.2 20 de 12 b 16 e 27 bc * 19 bcd 23 bcProwl 2.0 raked-in Goal 0.12 + Diuron 1.2 26 ef 30 d 28 f 30 bc 32 f 31 d
Prowl 2.0 raked-in2 Goal 0.12 + Diuron 1.2 32 f * 22 c 27 f 32 bc 31 ef 31 d
Prowl 2.0 raked-in3 Goal 0.12 + Diuron 1.2 4 ab 3 a 3 abc 33 bc * 23 b-e 28 cd
Goal 0.25 Goal 0.12 + Diuron 1.2 10 abc 4 ab 7 bed 28 bc 27 def 27 cd
Dual 1.5 Diuron 1.6 10 abc * 2 a 6 a-d 25 b 24 b-f 24 bc
Prowl 2.0 Goal 0.12 + Metribuzin 0.56 8 abc 3 a 6 a-d 29 bc 24 b-f 26 cd
None Goal 0.25 + Diuron 1.6 2 a 0 a 1 a 25 b 16 ab 20 b
None None 5 ab 0 a 2 ab 7 a 10 a 9 a

Table 2. Volunteer perennial ryegrass seedling ground cover in vacuum sweep and bale/flail/rake at both sites, 1995harvest.
Herbicide treatments (lbs ai/acre)' South valley perennial ryegrass North valley perennial ryegrassPre-emergence Post-emergence VS BFR Average VS BFR Average
(% ground cover)
Prowl 2.0 None 39 e 49 cde 44 de 2 bc * 17 ef 6 cProwl 2.0 raked-in None 13 bc * 27 cd 19 b 1 bc * 17 ef 6 cProwl 2.0 Goal 0.12 + Diuron 1.2 16 c * 39 cde 25 bc 1 ab * 7 ab 3 aProwl 1.0 raked-in Goal 0.12 + Diuron 1.2 11 bc * 30 c 19 b 3 d * 13 cde 7 cProwl 2.0 raked-in Goal 0.12 + Diuron 1.2 4 a * ii a 7 a 0 a * 9 abc 3 aProwl 2.0 raked-in2 Goal 0.12 + Diuron 1.2 7 ab * 16 ab 11 a 1 ab * 10 b-e 3 aProwl 2.0 raked-in3 Goal 0.12 + Diuron 1.2 30 de 32 c 31 cd I abc * 16 def 5 bcGoal 0.25 Goal 0.12 + Diuron 1.2 16 c * 36 cd 24 bc 1 abc * 6 a 3 aDual 1.5 Diuron 1.6 12 bc * 34 c 21 bc 2 cd * 23 f 7 cProwl 2.0 Goal 0.12 + Metribuzin 0 56 19 cd * 40 cde 28 bc I abc * 9 a-d 4 abNone Goal 0.25 + Diuron 1.6 44 e 65 de 53 e 13 e * 58 g 27 dNone None 45 e 69 e 56 e 29 f * 81 g 49 e
Means over herbicide treatments 18 *34 25 2 * 16 6
* Indicates vacuum sweep and bale/flail/rake differed significantly.1
Prowl raked-in, other pre-emergence treatments, and all post-emergence treatments were applied in fall 1994 at south andnorth valley sites on Oct. 7 and 12, Oct. 21 and 24, and Nov. 28 and 5, respectively.2 applied for two years to plots used as untreated checks for the 1993 harvest.
applied to plots used as untreated checks for the 1994 harvest.
Table 3. Perennial ryegrass seed yield in vacuum sweep and bale/flail/rake at both sites, 1995 harvest.
Herbicide treatments (lbs ai/acre)' South valley perennial rvgrass North valley perennial ryegrassPre-emergence Post-emergence VS BFR Average VS BFR Average
(lbs/acre)
Prowl 2.0 None 1176 abc 1145 bc 1161 bc 1065 a 1111 ab 1088 abcProwl 2.0 raked-in None 1202 abc 1149 bc 1176 bc 1160 a 1096 ab 1128 abProwl 2.0 Goal 0.12 + Diuron 1.2 1192 abc 1054 c 1123 bc 1075 a 1192 a 1134 abProwl 1.0 raked-in Goal 0.12 +Diuron 1.2 1111 bc 1214 b 1163 bc 1013 a * 1183 a 1098 abcProwl2.Oraked-in Goal0.12+Diuronl.2 1200 abc 1222 b 1211 b 1053 a 1059 ab 1056 abcProwl 2.0 raked-in2 Goal 0.12 + Diuron 1.2 1111 be 1188 bc 1149 bc 1052 a 1089 ab 1071 abcProwl2.0 raked-in3 GoalO.12+Diuronl.2 1277 a 1382 a 1329 a 1129 a 1129 ab 1129 abGoal 0.25 Goal 0.12 +Diuron 1.2 1214 ab 1216 b 1215 b 1119 a 1197 a 1158 aDual 1.5 Diuron 1.6 1216 ab 1179 be 1197 b 1080 a 1107 ab 1094 abcProwl 2.0 Goal 0.12 +Metribuzin 0.56 1128 ab 1189 be 1158 be 997 a 1006 b 1002 cNone Goal 0.25 +Diuron 1.6 1051 c 1112 be 1082 c 1052 a 995 b 1024 beNone None 1101 be 1107 be 1101 be 1026 a 1011 b 1018 be
Means over herbicide treatments 1165 1180 1172 1068 1098 1083
* Indicates vacuum sweep and bale/flail/rake differed significantly.1
Prowl raked-in, other pre-emergence treatments, and all post-emergence treatments were applied in fall 1994 at south andnorth valley sites on Oct. 7 and 12, Oct. 21 and 24, and Nov. 28 and 5, respectively.2
applied for two years to plots used as untreated checks for the 1993 harvest.applied to plots used as untreated checks for the 1994 harvest.
17

Table 4. Crop injury, volunteer stand, and seed yield at south valley perennial ryegrass, 1995 harvest, full straw load.
Herbicide treatment (lbs ai/acre, application dates faIl 1994)
Prowl 2.0 under straw, Oct. 3/Dual 1.5 + Diuron 1.2, Nov. 8/Dual 1.5 + Diuron 1.2, Nov. 8/Diuron 0.8, Dec. 22*
Prowl 2.0 under straw, Oct. 3/Dual 1.5 + Diuron 1.2, Nov. 8/Diuron 0.8, Dec. 22*
Banded Roundup + Goal + Diuron, Nov. 28Banded Roundup, Nov. 28
Means over herbicide treatments
*Thffd year full straw treatment. All others are second year full straw.
Crop injury,April 1995
Vol. Perennialryegrass seedling
ground coverCrop seed yield
July 8, 1995
(% less thanfull stand) (% cover) (lbs/acre)
Untreated check* 36 a 29 i 1124 a-e
Prowl 2.0 under straw, Oct. 3* 64 b 4 g 961 dgProwl 2.0 under straw, Oct. 3 60 b 4 g 1176 a-d
Prowl2.0 on straw, Oct. 21 37 a 21 i 1301 ab
Prowl 2.0 on straw, Oct. 21/Goal 0.38 + Diuron 0.8, Nov. 8 62 b 3 g 1188 a-d
Prowl 2.0 on straw, Oct. 21/Goal 0.25 + Metribuzin 0.25, Nov. 8 59 b 4 g 1203 abc
Dual 1.5 under straw, Oct. 7 32 a 16 hi 1316 aDual 1.5 under straw, Oct. 7/Goal 0.38 + Diuron 0.8, Nov. 8 64 b 2 efg 1217 abcDual 1.5 under straw, Oct. 7/Goal 0.25 + Metribuzin 0 25, Nov. 8 59 b 4 g 1231 abc
Prowl 2.0 under straw, Oct. 3/Goal 0.25 + Diuron 0.8, Nov. 8 74 cd 2 d-g 832 ghi--/Goal 0.25 + Diuron 0.8, Nov. 8/Goal 0.12 + Diuron 1.2, Dec. 22* 90 efg 1 b-f 435 kIm
Prowl 2.0 under straw, Oct. 3/Goal 0.25 + Diuron 0.8, Nov. 8/Goal 0.12 + Diuron 1.2, Dec. 22* 98 g 0 ab 268 mno
Prowl 2.0 under straw, Oct. 3/Goal 0.25 + Dual 1.5, Nov. 8 86 ef 1 a-d 610 ijk/Goal 0.25 + Dual 1.5, Nov. 8/Diuron 1.6, Dec. 22* 97 g 0 abc 326 l-o
Prowl 2.0 under straw, Oct. 3/Goal 0.25 + Dual 1.5, Nov. 8/Diuron 1.6, Dec. 22* 99 g 0 a 103 o
Prowl 2.0 under straw, Oct. 3/Goal 0.25 + Metribuzin 0.25, Nov. 8 66 bc 2 efg 1077 cde/Goal 0.25 + Metribuzin 0.25, Nov. 8/Goal 0.12 + Diuron 1.2, Dec. 22* 94 fg 1 a-d 394 klm
Prowl 2.0 under straw, Oct. 3/Goal 0.25 + Metribuzin 0.25, Nov. 8/Goal 0.12 + Diuron 1.2, Dec. 22* 97 g 0 abc 236 Imo
Prowl 2.0 under straw, Oct. 3/Goal 0.25 + Sinbar 0.5, Nov. 8 76 cd 1 c-f 932 efg/, Goal 0.25 + Sinbar 0.5, Nov. 8/Goal 0.12 + Diuron 1.2, Dec. 22* 93 fg 1 a-d 398 k-n
Prowl 2.0 under straw, Oct. 3/Goal 0.25 + Sinbar 0.5, Nov. 8/Goal 0.12 + Diuron 1.2, Dec. 22* 98 g 0 ab 167 no
84d Oab 67lhij93 fg I a-c 461 jkl94 fg 0 abc 318 l-o
34 a 1 a-d 1303 ab34 a 1 a-c 1306 ab
74 2 783
/Goal 0.38 + Diuron 1.6, Nov. 28* 61 b 10 h 1082 b-fProwl 2.0 under straw, Oct. 3/Goal 0.38 + Diuron 1.6, Nov. 28* 83 de 3 fg 869 fghProwl 2.0 under straw, Oct. 3/Goal 0.38 + Diuron 1.6, Nov. 28 76 d 1 a-f 859 fgh

Table 5. Crop injury, volunteer stand, and seed yield at north valley perennial ryegrass, 1995 harvest, full straw load.
Herbicide treatment (lbs ailacre, application dates fall 1994)
* Third year full straw treatment. All others are second year full straw.
Crop injury,April 1995
Vol. Perennialryegrass seedling
ground coverCrop seed yield
July 8, 1995
(% less thanfull stand) (% cover) (lbs/acre)
Untreated check*Prowl 2.0 under straw, Sept. 27*Prowl 2.0 under straw, Sept. 27
/Goal 0.38 + Diuron 1.6, Dec. 5*Prowl 2.0 under straw, Sept. 27/Goal 0.38 + Diuron 1.6, Dec. 5*Prowl 2.0 under straw, Sept. 27/Goal 0.38 + Diuron 1.6, Dec. 5Prowl 2.0 on straw, Oct. 12Prowl 2.0 on straw, Oct. 12/Goal 0.38 + Diuron 0.8, Nov. 7Prowl 2.0 on straw, Oct. 12/Goal 0.25 + Metribuzm 0 25, Nov. 7Dual 1.5 under straw, Oct. 10Dual 1.5 under straw, Oct. 10/Goal 0.38 + Diuron 0.8, Nov. 7Dual 1.5 under straw, Oct. 10/Goal 0.25 + Metribuzin 0.25, Nov. 7Prowl 2.0 under straw, Sept. 27/Goal 0.25 + Diuron 0.8, Nov. 7
/Goal 0.25 + Diuron 0.8, Nov. 7/Goal 0.12 + Diuron 1.2, Dec. 20*Prowl 2.0 under straw, Sept. 27/Goal 0.25 + Diuron 0.8, Nov. 7/Goal 0.12 + Diuron 1.2, Dec. 20*Prowl 2.0 under straw, Sept. 27/Goal 0.25 + Dual 1.5, Nov. 7
/Goal 0.25 + Dual 1.5, Nov. 8/Diuron 1.6, Dec. 20*Prowl 2.0 under straw, Sept. 27/Goal 0.25 + Dual 1.5, Nov. 8fDiuron 1.6, Dec. 20*Prowl 2.0 under straw, Sept. 27/Goal 0.25 + Metribuzin 0.25, Nov. 7
/Goal 0.25 + Metribuzin 0.25, Nov. 7/Goal 0.12 + Diuron 1.2, Dec. 20*Prowl 2.0 under straw, Sept. 27/Goal 0.25 + Metribuzin 0.25, Nov. 7/Goal 0.12 + Diuron 1.2, Dec. 20*Prowl 2.0 under straw, Sept. 27/Goal 0.25 + Sinbar 0.5, Nov. 7
/Goal 0.25 + Sinbar 0.5, Nov. 7/Goal 0.12 + Diuron 1.2, Dec. 20*Prowl 2.0 under straw, Sept. 27/Goal 0.25 + Sinbar 0.5, Nov. 7/Goal 0.12 + Diuron 1.2, Dec. 20*Prowl 2.0 under straw, Sept. 27/Dual 1.5 + Diuron 1.2, Nov. 7
/Duall.5 +Diuron 1.2, Nov. 7/Diuron 0.8, Dec. 20*Prowl 2.0 under straw, Sept. 27/Dual 1.5 + Diuron 1.2, Nov. 7/Diuron 0.8, Dec. 20*Banded Roundup + Goal + Diuron, Nov. 28BandedRoundup,Nov.28Means over herbicide treatments
16 a 79 q 951 c-g31 bc 31 op 911 d-g31 bc 24 i-p 868 efg48 efg 23 k-p 1119 a-d49 efg 9 e-j 1008 b-f56 f-i 3 a-d 984 b-f25 ab 43 pq 744 g46 ef 16 i-o 1067 a-e42 de 12 h-rn 1030 b-e29 b 71 q 779 fg58 ghi 9 f-j 1119 a-d55 fgh 20 j-p 1005 b-f49 efg 8 d-i 1075 a-e69 jkl 11 g-1 1084 a-e64 h-k 5 b-g 1174 abc49 efg 7 c-i 1105 a-e85 m 4 b-f 1298 a86 m 1 a 1200 ab48 efg 11 h-k 1080 b-e66 ijk 10 f-k 1093 a-e74 ki 3 abc 1005 b-f41 cde 11 h-k 943 c-g70 jk 5 b-g 1117 a-d79 im 2 ab 1119 a-d48 efg 14 i-rn 984 b-f60 hij 12 h-rn 1163 abc61 hij 4 a-e 1060 a-e30 b 6 b-h 969 b-f33 bcd 26 mop 1068 a-e53 11 1041
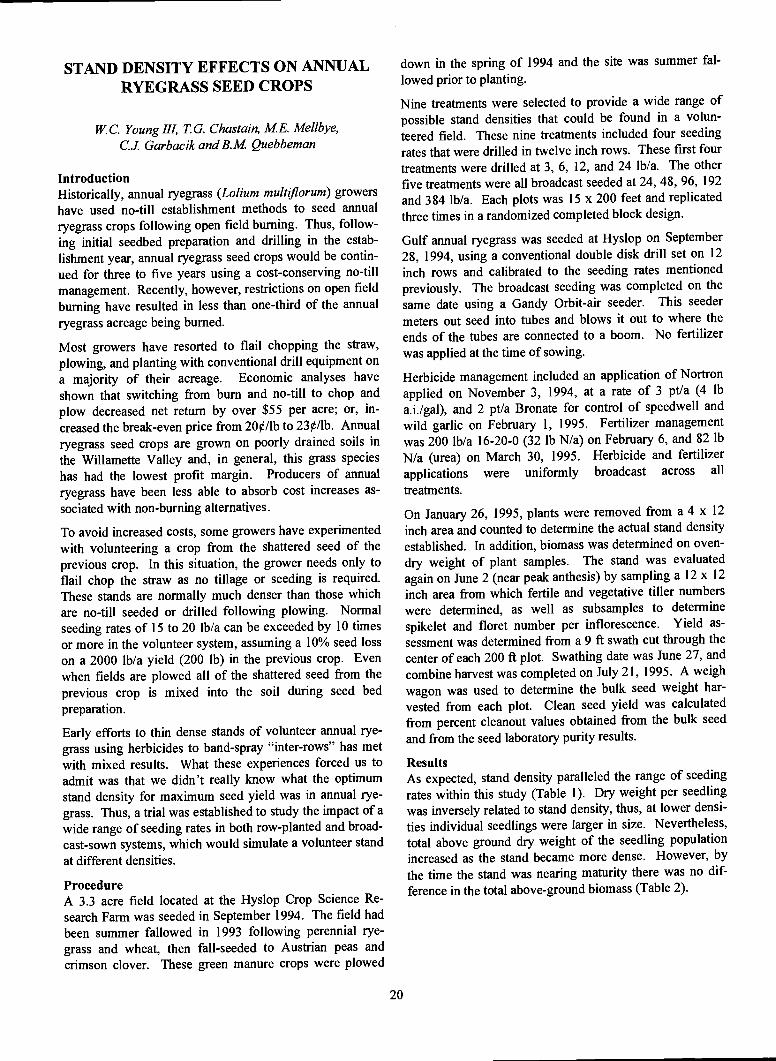
STAND DENSITY EFFECTS ON ANNUALRYEGRASS SEED CROPS
W. C'. Young III, 7'. G. Chastain, ME, Mellbye,C.J. Garbacik and B.M Quebbeman
IntroductionHistorically, annual ryegrass (Lolium mu1tflorum) growershave used no-till establishment methods to seed annualryegrass crops following open field burning. Thus, follow-
ing initial seedbed preparation and drilling in the estab-lishment year, annual ryegrass seed crops would be contin-ued for three to five years using a cost-conserving no-tillmanagement. Recently, however, restrictions on open fieldburning have resulted in less than one-third of the annualryegrass acreage being burned.
Most growers have resorted to flail chopping the straw,plowing, and planting with conventional drill equipment ona majority of their acreage. Economic analyses haveshown that switching from burn and no-till to chop andplow decreased net return by over $55 per acre; or, in-creased the break-even price from 200/lb to 230/lb. Annualryegrass seed crops are grown on poorly drained soils inthe Willamette Valley and, in general, this grass specieshas had the lowest profit margin. Producers of annualryegrass have been less able to absorb cost increases as-sociated with non-burning alternatives.
To avoid increased costs, some growers have experimentedwith volunteering a crop from the shattered seed of theprevious crop. In this situation, the grower needs only toflail chop the straw as no tillage or seeding is required.These stands are normally much denser than those whichare no-till seeded or drilled following plowing. Normalseeding rates of 15 to 20 lb/a can be exceeded by 10 timesor more in the volunteer system, assuming a 10% seed losson a 2000 lb/a yield (200 Ib) in the previous crop. Evenwhen fields are plowed all of the shattered seed from theprevious crop is mixed into the soil during seed bedpreparation.
Early efforts to thin dense stands of volunteer annual rye-grass using herbicides to band-spray "inter-rows" has metwith mixed results. What these experiences forced us toadmit was that we didn't really know what the optimumstand density for maximum seed yield was in annual rye-grass. Thus, a trial was established to study the impact of awide range of seeding rates in both row-planted and broad-cast-sown systems, which would simulate a volunteer standat different densities.
ProcedureA 3.3 acre field located at the Hyslop Crop Science Re-search Farm was seeded in September 1994. The field hadbeen summer fallowed in 1993 following perennial rye-grass and wheat, then fall-seeded to Austrian peas andcrimson clover. These green manure crops were plowed
20
down in the spring of 1994 and the site was summer fal-
lowed prior to planting.
Nine treatments were selected to provide a wide range ofpossible stand densities that could be found in a volun-teered field. These nine treatments included four seedingrates that were drilled in twelve inch rows. These first fourtreatments were drilled at 3, 6, 12, and 24 lb/a. The otherfive treatments were all broadcast seeded at 24, 48, 96, 192and 384 lb/a. Each plots was 15 x 200 feet and replicatedthree times in a randomized completed block design.
Gulf annual ryegrass was seeded at Hyslop on September28, 1994, using a conventional double disk drill set on 12
inch rows and calibrated to the seeding rates mentionedpreviously. The broadcast seeding was completed on thesame date using a Gandy Orbit-air seeder. This seedermeters out seed into tubes and blows it out to where theends of the tubes are connected to a boom. No fertilizerwas applied at the time of sowing.
Herbicide management included an application of Nortronapplied on November 3, 1994, at a rate of 3 pt/a (4 lba.i./gal), and 2 pt/a Bronate for control of speedwell andwild garlic on February 1, 1995. Fertilizer managementwas 200 lb/a 16-20-0 (32 lb N/a) on February 6, and 82 lbN/a (urea) on March 30, 1995. Herbicide and fertilizerapplications were uniformly broadcast across all
treatments.
On January 26, 1995, plants were removed from a 4 x 12
inch area and counted to determine the actual stand densityestablished. In addition, biomass was determined on oven-dry weight of plant samples. The stand was evaluatedagain on June 2 (near peak anthesis) by sampling a 12 x 12inch area from which fertile and vegetative tiller numberswere determined, as well as subsamples to determinespikelet and floret number per inflorescence. Yield as-sessment was determined from a 9 ft swath cut through thecenter of each 200 ft plot. Swathing date was June 27, andcombine harvest was completed on July 21, 1995. A weighwagon was used to determine the bulk seed weight har-vested from each plot. Clean seed yield was calculatedfrom percent cleanout values obtained from the bulk seedand from the seed laboratory purity results.
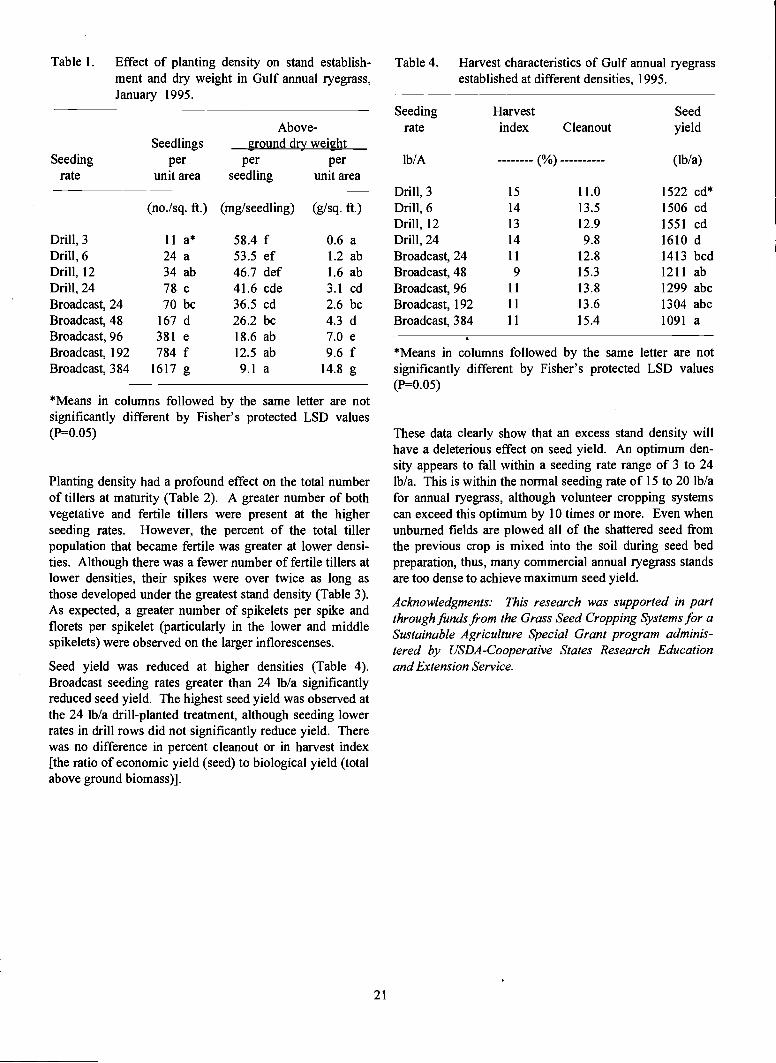
ResultsAs expected, stand density paralleled the range of seedingrates within this study (Table 1). Dry weight per seedlingwas inversely related to stand density, thus, at lower densi-ties individual seedlings were larger in size. Nevertheless,total above ground dry weight of the seedling populationincreased as the stand became more dense. However, by
the time the stand was nearing maturity there was no dif-
ference in the total above-ground biomass (Table 2).
*Means in columns followed by the same letter are notsignificantly different by Fisher's protected LSD values(P=0.05)
Planting density had a profound effect on the total numberof tillers at maturity (Table 2). A greater number of bothvegetative and fertile tillers were present at the higherseeding rates. However, the percent of the total tillerpopulation that became fertile was greater at lower densi-ties. Although there was a fewer number of fertile tillers atlower densities, their spikes were over twice as long asthose developed under the greatest stand density (Table 3).As expected, a greater number of spikelets per spike andflorets per spikelet (particularly in the lower and middlespikelets) were observed on the larger inflorescenses.
Seed yield was reduced at higher densities (Table 4).Broadcast seeding rates greater than 24 lb/a significantlyreduced seed yield. The highest seed yield was observed atthe 24 lb/a drill-planted treatment, although seeding lowerrates in drill rows did not significantly reduce yield. Therewas no difference in percent cleanout or in harvest index[the ratio of economic yield (seed) to biological yield (totalabove ground biomass)].
21
Table 4. Harvest characteristics of Gulf annual ryegrassestablished at different densities, 1995.
* Means in columns followed by the same letter are notsignificantly different by Fisher's protected LSD values(P=0.05)
These data clearly show that an excess stand density willhave a deleterious effect on seed yield. An optimum den-sity appears to fall within a seeding rate range of 3 to 24lb/a. This is within the normal seeding rate of 15 to 20 lb/afor annual ryegrass, although volunteer cropping systemscan exceed this optimum by 10 times or more. Even whenunburned fields are plowed all of the shattered seed fromthe previous crop is mixed into the soil during seed bedpreparation, thus, many commercial annual ryegrass standsare too dense to achieve maximum seed yield.
Acknowledgments: This research was supported in partthroughfundsfrom the Grass Seed Cropping Systems for aSustainable Agriculture Special Grant program adminis-tered by USDA-Cooperative States Research Educationand Extension Service.
Table 1. Effect of planting density on stand establish-ment and dry weight in Gulf annual ryegrass,January 1995.
Seedingrate
Seedlingsper
unit area
Above-ground dry weight
per perseedling unit area
(no./sq. ft.) (mg/seedling) (g/sq. ft.)
Drill, 3 11 a* 58.4 f 0.6 aDrill, 6 24 a 53.5 ef 1.2 abDrill, 12 34 ab 46.7 def 1.6 abDrill, 24 78 c 41.6 cde 3.1 cdBroadcast, 24 70 bc 36.5 cd 2.6 bcBroadcast, 48 167 d 26.2 bc 4.3 dBroadcast, 96 381 e 18.6 ab 7.0 eBroadcast, 192 784 f 12.5 ab 9.6 fBroadcast, 384 1617 g 9.1 a 14.8 g
Seedingrate
Harvestindex Cleanout
Seedyield
lb/A (%) (lb/a)
Drill,3 15 11.0 1522 cd*Drill,6 14 13.5 1506 cdDrill, 12 13 12.9 1551 cdDrill, 24 14 9.8 1610 dBroadcast, 24 11 12.8 1413 bcdBroadcast, 48 9 15.3 1211 abBroadcast, 96 11 13.8 1299 abcBroadcast, 192 11 13.6 1304 abcBroadcast, 384 11 15.4 1091 a
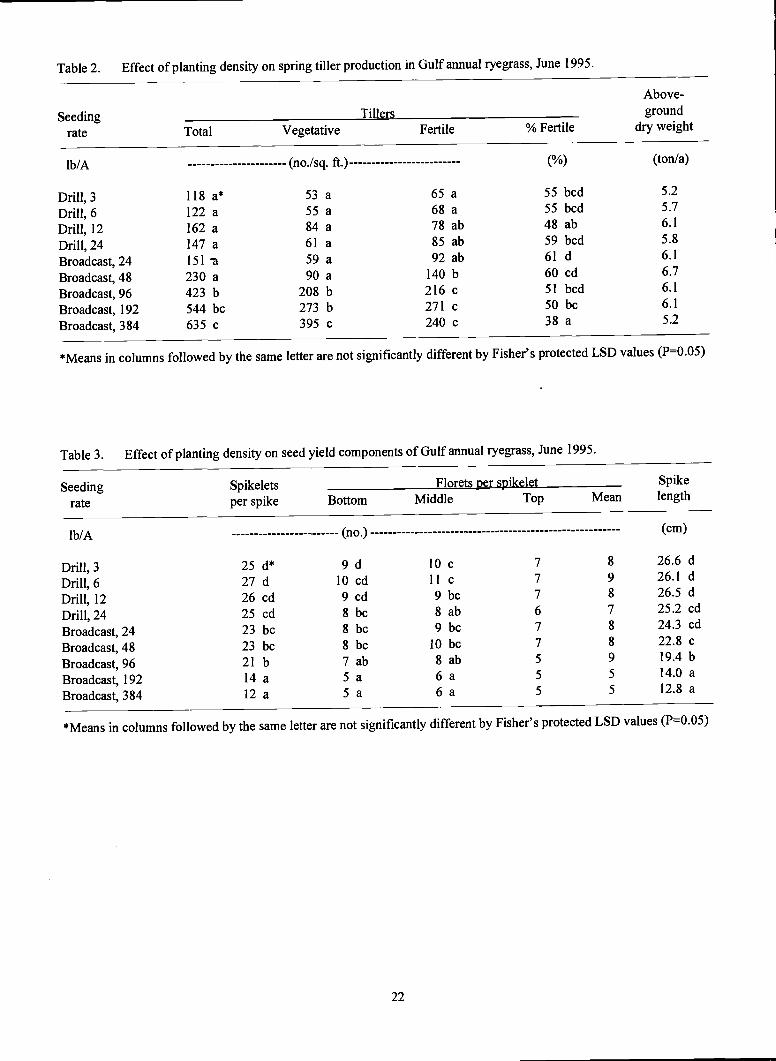
Table 2. Effect of planting density on spring tiller production in Gulf annual ryegrass, June 1995.
Seedingrate Total Vegetative
lb/A (no./sq. ft.)
Drill,3 118 a* 53 aDrill,6 122 a 55 aDrill, 12 162 a 84 aDrill, 24 147 a 61 aBroadcast, 24 151 a 59 aBroadcast, 48 230 a 90 aBroadcast, 96 423 b 208 bBroadcast, 192 544 bc 273 bBroadcast, 384 635 c 395 c
22
*Means in columns followed by the same letter are not significantly different by Fisher's protected LSD values (P=0.05)
Table 3. Effect of planting density on seed yield components of Gulf annual ryegrass, June 1995.
Seeding Spikelets Florets per spikelet Spike
rate per spike Bottom Middle Top Mean length
lb/A (no.) (cm)
Drill, 3 25 d* 9 d 10 c 7 8 26.6 d
Drill,6 27 d 10 cd 11 c 7 9 26.1 d
Drill, 12 26 cd 9 cd 9 bc 7 8 26.5 d
Drill, 24 25 cd 8 bc 8 ab 6 7 25.2 cd
Broadcast, 24 23 bc 8 bc 9 bc 7 8 24.3 cd
Broadcast, 48 23 bc 8 bc 10 bc 7 8 22.8 c
Broadcast, 96 21 b 7 ab 8 ab 5 9 19.4 b
Broadcast, 192 14 a 5 a 6 a 5 5 14.0 a
Broadcast, 384 12 a 5 a 6 a 5 5 12.8 a
*Means in columns followed by the same letter are not significantly different by Fisher's protected LSD values (P0.05)
Above-
Tillers groundFertile % Fertile dry weight
(%) (ton/a)
65 a 55 bcd 5.2
68 a 55 bcd 5.7
78 ab 48 ab 6.1
85 ab 59 bcd 5.8
92 ab 61d 6.1
140 b 60 cd 6.7
216 c 51 bcd 6.1
271 c 50 bc 6.1
240 c 38a 5.2
CROP RESIDUE MANAGEMENT ANDESTABLISHMENT SYSTEMS
FOR ANNUAL RYEGRASS SEEDPRODUCTION
W. C Young III, T G. C'hastain, ME. Mellbye,Cf Garbacik andB.M Quebbeman
IntroductionFew studies have focused on the improvement of croppingsystems for annual ryegrass seed production. A low-costproduction system based on open field burning of post-har-vest residue followed by no-till drilling to establish thesubsequent crop has been very effective. Consequently,much of the Willamette Valley's annual ryegrass produc-tion acreage has been in a continuous annual productioncycle based on open field burning followed by no-tilldrilling to establish the subsequent crop.
Recent restrictions on open field burning have resulted inless than one-third of the annual ryegrass acreage beingburned. The most common nonthermal residue manage-ment strategy currently used by annual ryegrass growers isflail chopping and plowing under the crop residue beforeconventional preparation of a seed bed for the next crop.Other crop establishment strategies, however, are evolving.These nonthermal management options include: (i) remov-ing the straw by baling and seeding into the stubble by no-tillage methods, and (ii) producing a new seed crop withseed lost from the previous crop (volunteering) without anystraw removal. The producer's objective in choosing eitheroption is to cut the production costs over standard seed bedpreparation.
Currently there is little off-farm market opportunity forannual ryegrass straw, thus baled straw is disposed of understack burning provisions of the state's smoke managementprogram. Both operations (baling and stack burning) resultin additional grower expense. Volunteer cropping withtotal straw residue remaining on the soil surface is notwithout problems. Growers perceive that volunteeredstands produce lower seed yields than drilled stands, al-though no scientific comparisons have been made.
Thus, we designed a study to investigate low cost cropresidue management and seeding practices for annual rye-grass seed production, and to determine the effects of cropresidue management and seeding practices on establish-ment, growth, development, and yield of subsequent annualryegrass seed crops.
ProcedureThe two on-farm sites near Halsey, OR were selected forfield scale experiments using grower-owned, commercialsize farm equipment. One on-farm site, owned by John andDavid Smith, is located on a tiled, Woodbum silt loam soil,and is moderately well drained. Gulf Annual Ryegrass hasbeen grown on it continuously for at least the past twenty
23
years. The cropping system and residue management his-tory is as follows:
1993 straw flailed, plowed, and conventionally drilled.1992 straw burned and no-till drilled.1991 straw flailed, plowed, and conventionally drilled.1990 straw burned and no-till drilled.
The other on-farm site is owned by Jack Pimm. This site islocated on a Dayton silt loam soil and is poorly drained. Inthe two previous years this field was planted to TAM-90annual ryegrass; prior to 1992 this field was producing tallfescue seed. The cropping system and residue managementhistory for the past two years is as follows:
1993 Straw burned and no-till drilled.1992 Straw burned and no-till drilled.
In July-August, 1994 straw was baled and removed fromhalf the plots at both sites. The remaining straw was flailedtwice. The baled plots were flailed once to keep stubbleheight consistent in all treatments. Straw samples weretaken following baling and flailing to assess the amount ofstraw that remained in the baled and full straw plots. Fol-lowing this straw management, the conventionally tilledtreatments were plowed and worked into a seed bed at bothsites.
The two on-farm sites were drilled with the same no-tilldrill. This drill seeded 15 lb/a and also band-applied 120lb/a (broadcast equivalent) of dry fertilizer (16-20-0) in thedrilled row. The row spacing on the drill was ten inches.The drill was pulled over the volunteer plots, applying onlythe fertilizer, to keep the fertilizer application consistentover all treatments. Seeding dates at Pimms and Smithswere September 8 and September 15, 1994, respectively.
The experimental design used was achieved a randomizedsplit block design, where each site has three main treat-ments: (i) plow and conventional drill, (ii) no-till drill, and(iii) volunteer. Each main plot treatment is split, with halfhaving the straw baled and removed and half having thestraw flailed and left on the soil surface. In total, six treat-ments were arranged in three replications at each site.
Plot size was 25 x 400 ft at Smiths and 22 x 600 ft atPimms, which allowed plots to be harvested with the grow-ers' swathers and combines. A weigh wagon was used todetermine the bulk seed weight harvested from each plot.Clean seed yield was calculated from percent cleanout val-ues obtained from the bulk seed and from the seed labora-tory purity results.
Roundup herbicide (1 pt/a) was applied about one weekafter seeding to no-till plots at both sites for the control ofvolunteer seedlings that had germinated on the soil surface.This technique, known as a "sprout spray," can be effectivein controlling stand density when there is a "sprout" of vol-unteer seedlings before the crop emerges. Absence of earlyfall rains limited soil moisture and reduced the effective-ness of this practice in 1994. Treatment with Nortron her-

bicide was broadcast at 3 pt/a (4 lb a.i./gal) in mid-Novem-ber to all plots. The growers' normal fertilizer manage-ment (135-140 lb N/a in early April) was broadcast appliedto all plots.
In January 1995, plants were removed from a 4 x 10 incharea and counted to determine the actual stand density es-tablished. In addition, plant biomass was dried andweighed. The stands were evaluated again in June (nearpeak anthesis) by sampling a 10 x 10 inch area from whichfertile and vegetative tiller numbers were determined, aswell as subsamples to determine spikelet and floret numberper inflorescence. Yield assessment was determined byswathing through the center of each plot (June 29 and July3 at Smiths and Pimms, respectively). Combine harvestwas completed on July 27 August 4 at Smiths and Pimms,respectively.
ResultsStand density was significantly greater in no-till and volun-teer established plots at both locations (Tables 1 and 2).No-till established plots had a slightly greater density overvolunteer established plots suggesting that no benefit re-sulted from the "sprout spray" treatment. Dry weight perseedling was inversely related to stand density, thus, atlower densities individual seedlings were larger in size.Nevertheless, total above-ground dry weight of seedlingsfrom the drill seeded stand was less than the biomass in theno-till or volunteer stands. Straw removal (baling) had noeffect on stand density or above ground dry weight.
Table 1. Effect of establishment cropping system onstand establishment and dry weight of TAM 90annual iyegrass at Pimm Farm, January 1995.
(no./sq. ft.) (mg/seedling) (g/sq. ft.)
Sowing methodDrill 179 a* 38 b 5aNo-till 1143 b 12 a 12 bVolunteer 1013 b 15 a 13 b
Residue removalBaleNo removal
* Means in columns followed by the same letter are notsignificantly different by Fisher's protected LSD values(P=0.05)
24
Sowing methodDrill
766 24 10 No-till
791 19 11 Volunteer
(no./sq. ft.)
Residue removalBaleNo removal
*Means in columns followed by the same letter are notsignificantly different by Fisher's protected LSD values(P=0.05)
Straw removal did affect total tiller population at maturityat the Pimm site (Table 3). Regardless of stand density, ahigh percentage (70 - 79%) of the stand was comprised offertile tillers. Fertile tiller number at Pimms was signifi-cantly higher in both no-till and volunteer establishedstands where straw was baled and removed (Table 4).Fertile tiller number was not affected by straw managementin drill sown plots. No significant effect on spring tillerproduction was observed at the Smith site (data not shown).
Table 3. Effect of establishment cropping systems onspring tiller production in TAM 90 annual rye-grass at Pimm Farm, June 1995.
(%) (g/sq. ft.)
5.25.35.2
5.45.0
**
*Means in columns followed by the same letter are notsignificantly different by Fisher's protected LSD values(P=O.05)* * Significant sowing method x residue removal interaction
Croppingsystem
Seedlingsper
unit area
Above-ground dry weightper per
seedling unit area
(no./sq. ft.) (mg/seedling) (g/sq. ft.)
Sowing methodDrill 382 a* 23 7aNo-till 1845 b 13 18 bVolunteer 1545 b 15 19 b
Residue removalBale 1463 16 14
No removal 1051 18 15
230 71 159 70
621 148 474 75
531 108 423 79**
521 b* 105 416 78
400 a 112 288 72
Table 2. Effect of establishment cropping system onstand establishment and dry weight of Gulf an-nual iyegrass at Smith Farm, January 1995.
Above-Tillers ground
Croppingsystem Total Vegetative Fertile Fertile weight
% dry
Seedlings Above-ground dry weightCropping per per persystem unit area seedling unit area

Table 4. Interaction of sowing method and residue re-moval on fertile tiller number in TAM 90 an-nual ryegrass at Pimm Farm, June 1995.
Residueremoval
Croppingsystem
Sowing methodDrill No-till Volunteer
(no./sq. ft.)
*Means in columns followed by the same letter are notsignificantly different by Fisher's protected LSD values(P=0.05)
Seed yield was significantly lower in the drill sown plots atPimms (Table 5). No significant difference in seed yieldwas observed at Smiths (Table 6). Seed yields above theindustry average were obtained across treatments at bothsites. It is likely that differences in soil drainage character-istics and varieties at these two sites could explain thedifferent results observed. Percent cleanout was slightlyhigher at Pimms where the full straw load was left on thefield, and at Smiths cleanout was greater in the no-till andvolunteer treatments. These field treatments will be main-tained for two additional crop years; thus, our first-yearresults should not be used to establish conclusive recom-mendations.
Table 5. Harvest characteristics of TAM 90 annual rye-grass established under different cropping sys-tems at Pimm Farm, 1995.
Harvest characteristicsHarvest Seed
index Cleanout yield
(%) (lb/a)Sowing method
Drill 21 1.6 2218 a*No-till 25 1.5 2507 bVolunteer 26 1.4 2605 b
Residue removalBale 23 1.4 a 2246No removal 25 1.6 b 2440
*Means in columns followed by the same letter are notsignificantly different by Fisher's protected LSD values(P=0.05)
25
Table 6. Harvest characteristics of Gulf annual ryegrassestablished under different cropping systems atSmith Farm, 1995.
Croppingsystem
Harvest characteristicsHarvest Seedindex Cleanout yield
(%) (lb/a)
* Means in columns followed by the same letter are notsignificantly different by Fisher's protected LSD values(P=0.05)
Acknowledgments. This research was supported in partthrough funds from the Grass Seed Cropping Systems for aSustainable Agriculture Special Grant program adminis-tered by USDA-Cooperative States Research Educationand Extension Service. We are also appreciative of theassistance of John and David Smith, and Jack and EricPimm in providing equipment and labor to accomplish nu-merous farming operations.
MANAGING SLUGS IN GRASSESGROWN FOR SEED
G. C. Fisher, I T. DeFrancesco, and R.N Horton
Section 1: Effects of Post Harvest Residue Managementon Slug PopulationsTrials were established in various types of grass seed fields(perennial ryegrass, tall fescue, and Chewings fescue) inthe Willamette Valley to determine the effects of posthar-vest crop residue management practices on slugpopulations.
As part of a larger, on-going study, the crop residue man-agement treatments had been in place for at least threeyears; for this current study, slug populations were moni-tored in selected residue management regimes during Oc-tober, November, and December 1995. Not all fields hadsimilar residue treatments but included, among others, a"clean" treatment (where crop residue was either burned,raked, or baled/vacuumed) and a "full straw" treatment(where crop residue was cut and left in field). Each cropresidue treatment plot was approximately 22 ft. x 400 ft.and replicated three times in a randomized block experi-mental design.
Sowing methodDrill 26 3.1 a* 2596No-till 28 3.8 b 2421Volunteer 27 3.7 b 2257
Residue removalBale 28 3.6 2424No removal 26 3.5 2425
Bale 147 a 549 b 552 bNo removal 172 a 399a 295a
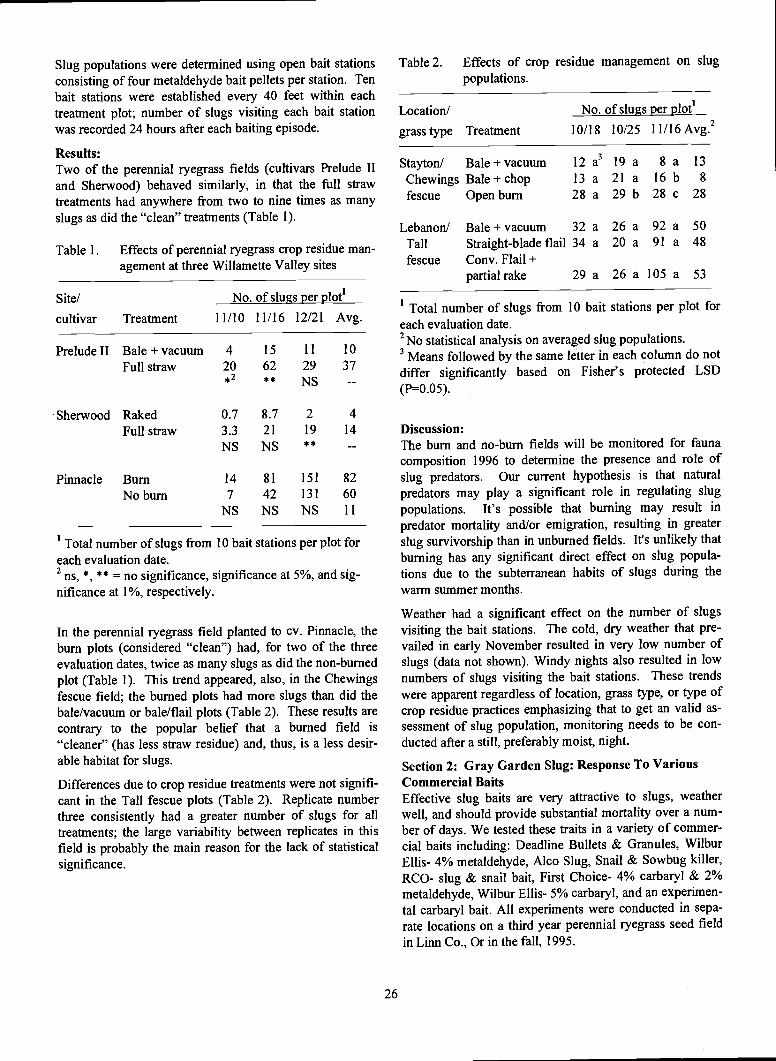
Slug populations were determined using open bait stationsconsisting of four metaldehyde bait pellets per station. Tenbait stations were established every 40 feet within eachtreatment plot; number of slugs visiting each bait stationwas recorded 24 hours after each baiting episode.
Results:Two of the perennial ryegrass fields (cultivars Prelude IIand Sherwood) behaved similarly, in that the full strawtreatments had anywhere from two to nine times as manyslugs as did the "clean" treatments (Table 1).
Table 1. Effects of perennial ryegrass crop residue man-agement at three Willamette Valley sites
Site! No. of slugs per plot'
cultivar Treatment 11/10 11/16 12/21 Avg.
Prelude II Bale + vacuum 4 15 11 10
Full straw 20 62 29 37*2 ** NS
'Total number of slugs from 10 bait stations per plot foreach evaluation date.2 ns, ', * * = no significance, significance at 5%, and sig-nificance at 1%, respectively.
In the perennial ryegrass field planted to cv. Pinnacle, theburn plots (considered "clean") had, for two of the threeevaluation dates, twice as many slugs as did the non-burnedplot (Table 1). This trend appeared, also, in the Chewingsfescue field; the burned plots had more slugs than did thebale/vacuum or bale/flail plots (Table 2). These results arecontrary to the popular belief that a burned field is
"cleaner" (has less straw residue) and, thus, is a less desir-able habitat for slugs.
Differences due to crop residue treatments were not signifi-cant in the Tall fescue plots (Table 2). Replicate numberthree consistently had a greater number of slugs for alltreatments; the large variability between replicates in thisfield is probably the main reason for the lack of statisticalsignificance.
26
Table 2. Effects of crop residue management on slugpopulations.
Location! No. of slugs per plot'
grass type Treatment 10/18 10/25 11/16 Avg.2
Discussion:The burn and no-burn fields will be monitored for faunacomposition 1996 to determine the presence and role ofslug predators. Our current hypothesis is that naturalpredators may play a significant role in regulating slugpopulations. It's possible that burning may result inpredator mortality and/or emigration, resulting in greaterslug survivorship than in unburned fields. It's unlikely thatburning has any significant direct effect on slug popula-tions due to the subterranean habits of slugs during thewarm summer months.
Weather had a significant effect on the number of slugsvisiting the bait stations. The cold, dry weather that pre-vailed in early November resulted in very low number ofslugs (data not shown). Windy nights also resulted in lownumbers of slugs visiting the bait stations. These trendswere apparent regardless of location, grass type, or type ofcrop residue practices emphasizing that to get an valid as-sessment of slug population, monitoring needs to be con-ducted after a still, preferably moist, night.
Section 2: Gray Garden Slug: Response To VariousCommercial BaitsEffective slug baits are very attractive to slugs, weatherwell, and should provide substantial mortality over a num-ber of days. We tested these traits in a variety of commer-cial baits including: Deadline Bullets & Granules, WilburEllis- 4% metaldehyde, Alco Slug, Snail & Sowbug killer,RCO- slug & snail bait, First Choice- 4% carbaryl & 2%metaldehyde, Wilbur Ellis- 5% carbaryl, and an experimen-tal carbaryl bait. All experiments were conducted in sepa-rate locations on a third year perennial ryegrass seed fieldin Linn Co., Or in the fall, 1995.
Sherwood Raked 0.7 8.7 2 4
Full straw 3.3 21 19 14
NS NS **
Pinnacle Burn 14 81 151 82
No burn 7 42 131 60NS NS NS 11
Stayton/ Bale + vacuum 12a3 l9a 8a 13
Chewings Bale + chop 13a 21a 16b 8
fescue Open burn 28 a 29 b 28 c 28
Lebanon! Bale + vacuum 32 a 26 a 92 a 50
Tall Straight-blade flail 34 a 20 a 91 a 48
fescue Cony. Flail +partial rake 29 a 26 a 105 a 53
Total number of slugs from 10 bait stations per plot foreach evaluation date.2 statistical analysis on averaged slug populations.
Means followed by the same letter in each column do notdiffer significantly based on Fisher's protected LSD(P=0.05).

The first experiments included 7.5 lb and 15 lb per acreapplications of bait. The eight products and an untreatedcheck were set out in plots 21 ft2 (equaling 1/100th of anacre) and replicated four times using a randomized blockdesign. Plots were evaluated 10 DAT (days after treatment)using bait stations to establish relative numbers of slugs intreated plots compared to the untreated check (Table 3).
Table 3. Efficacy of baits applied at 7.5 & 15 lb for-mulated product per acre. Average number ofGray Garden Slugs attracted to a bait station 10DAT.
'Plots evaluated 10 DAT
The same baits were also evaluated for their attractivenessto the Gray Garden Slug after weathering. In the first trial,weathering consisted of exposing the equivalent of threepellets of bait to 0.10 & 0.25 inches of water by sprinkler.Each bait and water level were replicated five times in arandomized block design. The baits were then placed in thefield and the numbers of slugs attracted to each bait thenext morning were recorded (Table 4). A second weather-ing experiment, consisted of placing the equivalent of threepellets of bait in the same location at a later date and allow-ing the local weather to have its affect. Five replications ofeach bait were placed in a randomized block design. Num-bers of slugs visiting the baits over a period of six dayswere recorded (Table 5). These raw data show that all ofthe baits lost attractiveness over the six day period (Figure1). Most baits attracted few slugs after the first three or fourdays.
27
Table 4. Effect of 0.10 and 0.25 inches precipitationfollowed by 48 hours of weathering on attrac-tiveness of baits to the Gray Garden Slug. Totalnumber of slugs recorded at baits the morningfollowing placement in the field. Large num-bers of slug coming to the more attractive baits.
BaitTotal number of slugs0.10 in. 0.25 in.
Deadline Bullets (Met 4%) 73 50Wilbur Ellis (Met 4%) 38 26Deadline Granules (Met 4%) 33 34RCO Slug & Snail Bait 20 8
(Met 3.25%)Western Farm Service First 17 35Choice (Car 4%, Met 2%)
Alco Slug, Snail, & Sowbugkiller (Car 5%, Met 3%)
7 4
Experimental Carbaryl 7 1
Wilbur Ellis (Car 5%) 3 0
Average number of slugs'
15 lb. rate 7.5 lb. rate
Wilbur Ellis (Met 4%) 3.1 1.5
Deadline Granules (Met 4%) 1.3 1.7
Alco Slug, Snail & Sowbug killer 4.0 1.8(Car 5%, Met 3%)
Deadline Bullets (Met 4%) 4.0 2.1RCO Slug & Snail Bait 4.5 3
(Met 3.25%)Western Farm Service First 14 3.3Choice (Car 4%, Met 2%)
Experimental Carbaryl 15.7 8.4Wilbur Ellis (Car 5%) 18.3 9.0Untreated Check 32.4 13.9
Table 5. Total number of Gray Garden Slugs attracted tobaits over a six day period.
Bait Total number of slugs
Deadline Granules 114
Deadline Bullets 111
Wilbur Ellis 5% metaldehyde 90First Choice (4% car & 2%) 78RCO Slug & Snail bait 56Alco Slug, Snail & Sowbug killer 49
(Car 5%, Met 3%)Neilsen 5% carbaryl 17
Wilbur Ellis 5% carbaryl 13

45
40 -
35 -
30 -
25 -
20 -
15-
10-
5-0 rL
Odaylday2mdays
Dday4
day5
day6
Figure 1. Number of Gray Garden Slugs attracted to baitsover a six day period.
In 1994 we observed the best time to bait for slugs was inthe fall (October) in the Willamette Valley. Sexually matureGray Garden Slugs began frequenting the soil surface withregularity as dew points were reached in the late afternoon.They readily accepted Bran and/or Metaldehyde baits,traveling up to ten feet across bare soil to feed. Littleprecipitation at this time extends bait longevity. Often cooldamp nights are followed by sunny warm days, greatlyenhancing mortality of slugs having fed on baits throughdesiccation. Slug control is particularly important at thistime in dryland agriculture as it occurs at the beginning ofthe reproductive cycle. Our research suggests that bran baitscontaining metaldehyde are superior to carbaryl baits.Deadline baits are particularly attractive, weather well andresult in the greatest control. The metaldehyde baits haveminimal impact on other organisms in the grass fields.Lastly, the best rate for these baits is 7.5 lb/a as both the 15& 7.5 lb rates had about the same affect on the slug popu-lations at the 10 day after treatment time.
OCCURRENCE OF BLIND SEED IN THEWILLAMETTE VALLEY
S.C. Alderman and H.R. Danielson
During 1995, several seed lots of tall fescue from the 1994harvest had low germination (70-80%). The seed was ex-amined and blind seed infection, caused by the fungusGloeotinia temulenta, was found in 10-20% of the seed.The seed lots were traced to several fields of tall fescue.Examination of seed from the fields prior to harvest in 1995confirmed that high levels of infection reoccurred in thefields. To determine the extent of blind seed infectionamong seed samples in the Willamette Valley, a survey ofseed samples for blind seed infection was initiated.
28
During July-December, 1995, samples of perennial ryegrassor tall fescue seed sent to the OSU seed lab were sub-sampled for blind seed testing. Five gram subsamples weremixed with 15 ml water. After soaking 15 minutes, theeffluent was transferred to 15 ml test tubes. Tubes werevigorously stirred on a vortex mixer and a 10 tl sample wasimmediately taken and transferred to a hemacytometercounting chamber. The number of conidia of Gloeotiniatemulenta in a 1 mm2 grid in the hemacytometer werecounted and recorded.
Samples were rated based on number of conidia present.Conidial numbers of 0-100, 100-500, 500-1000, and greaterthan 1000 corresponded to trace, low, moderate, or highlevels of infection. Samples with the highest level ofinfection contained about 20% infected seed. Percent seedinfection was based on the individual testing of each of 96seed, in each of four replications. Conidial numbers of100-500 corresponded to about 1% infection.
High levels of infection were not observed in perennialryegrass and only two out of 2,243 samples examined wererated at moderate infection (Table 1). Several samples oftall fescue did occur at a high level of infection. Thesesamples were traced to the original fields found with highblind seed during 1995. About 5% of the samples wererated trace-low.
Table 1. Number of samples examined and number ofsamples found with a trace, low, moderate, orhigh level of blind seed infection.
This study will serve as a baseline from which to evaluatefuture surveys. At this point it is too early to determine ifthere is a significant trend of increasing blind seedoccurrence.
EFFECT OF DISEASE CONTROL ONSEED YIELDS OF CREEPING RED
FESCUE
G.A. Gingrich and R.J. Burr
For the past ten or so years leaf and stem diseases havebeen increasing in many Willamette valley fine fescue seedfields. Stem and leaf rusts (Puccinia sp.) infest seed fieldsof both Chewings and creeping red fescue. Many growersnow routinely apply fungicides for rust control. Past re-search trial plots and grower experience has demonstrated
Samples Infection classGrass examined trace low moderate high
Perennial rye 2243 32 2 2 0
Tall fescue 1278 65 20 4 3
Deadline Wilbur RCO SlugGranules Ellis 5% & Snail
carbaryl

that properly timed fungicide applications can reduce rustdamage and increase seed yields.
Other leaf and stem diseases also are being found in somecreeping red fescue fields. Certain varieties are severelyaffected and growers suspect that seed yields are beingreduced. The plant symptoms are similar to the stem eye-spot (Didymella festucae) disease reported in red fescueseed fields in the Peace River region of northern BritishColumbia and Alberta Canada. During the past five yearsOSU and USDA plant pathologists have attempted to iso-late and identify the organism responsible for the diseasesymptoms. To date the stem eyespot fungus reported inCanada has not been identified as the cause of the leaf spotsfound on creeping red fescue plants here. In 1995 USDAPlant Pathologist Dr. Ron Welty was able to identify a fun-gus called Spermospora blight on plant samples from areacreeping red fescue fields.
In 1995 two fields of creeping red fescue with a knownhistory of severe leaf spot infestations were selected fortrial sites to evaluate disease control and seed yield re-sponse to applied fungicides. Experimental plots were es-tablished in each field using a randomized complete blockdesign with four replications. Individual plots were 23 ft.wide by 200 ft. long. Fungicides were applied with a trac-tor mounted sprayer at 20 gallons water per acre usingTeejet XR8003 nozzles at 30 psi. A tank mix of Tilt andBravo was used to provide maximum disease control with-out applying a large number of different treatment combi-nations. Dates of applications, stage of plant growth andapplication rates for each field site are presented in Table 1.Except for the fungicide applications all other field opera-tions were done by the grower. Yields were determinedusing the grower's combine for threshing. Seed weight per100 feet of windrow was determined and converted to yieldper acre. A subsample was collected from each plot andanalyzed for percent clean-out and weight per 1000 seeds.
Table 1. Application data for disease control in creepingred fescue, 1995.
Fungicides applied each date: Tilt at 6 oz. plus Bravo at 2pts per acre.
4/18/95 30-35% headed 15-20% headed
5/8/95 70% headed 80% headed
5/24/95 95% headed, 100% headed,early bloom early bloom
Swathing date: 7/10/95 7/13/95Combine date: 7/18/95 7/31/95
29
Leaf spot symptoms were present at both locations, how-ever in the 'Salem' location infection occurred later andwas less severe than in the 'Claudia' field. Seed yield in-creases were obtained with all fungicide treatments whencompared to the untreated check plots. Seed weight wasdetermined and the fungicide applications provided greaterindividual seed weights when compared to seed from theuntreated plots (Tables 2 & 3).
Table 2. Seed yield and seed weight of creeping redfescue, cv. 'Claudia,' 1995.
ApplicationDates
Clean- Cleanout seed wgt.
(%) (lb/A)
1000seed wgt.
(g)
Table 3. Seed yield and seed weight of creeping redfescue, cv. 'Salem,' 1995.
(%) (lb/A) (g)
In the 'Claudia' field there was also a significant infestationof stem rust present. No attempt was made to evaluate thelevel of infection nor the relative amount of leaf spot to rustfound on the plants. Two fungicide applications providedgreater seed yields than did a single treatment at both loca-tions. The later treatments tended to have slightly greaterseed yields than did the early applications.
4/18/95 9.8 1051 1.203
4/18 + 5/8/95 6.9 1137 1.243
5/8 + 5/24/95 7.8 1165 1.247
Untreated 9.2 903 1.162
LSD 0.05 2.3 55 0.035
4/18/95 8.5 858 1.089
4/18 + 5/8/95 7.3 977 1.159
5/8 + 5/24/95 9.0 963 1.145
Untreated 12.2 634 1.080
LSD 0.05 3.5 54 NS
Application cv. 'Claudia' cv. 'Salem'Dates Growth stage Growth stage
Appi. Clean- Clean 1000
Dates out seed wt. seed wgt.
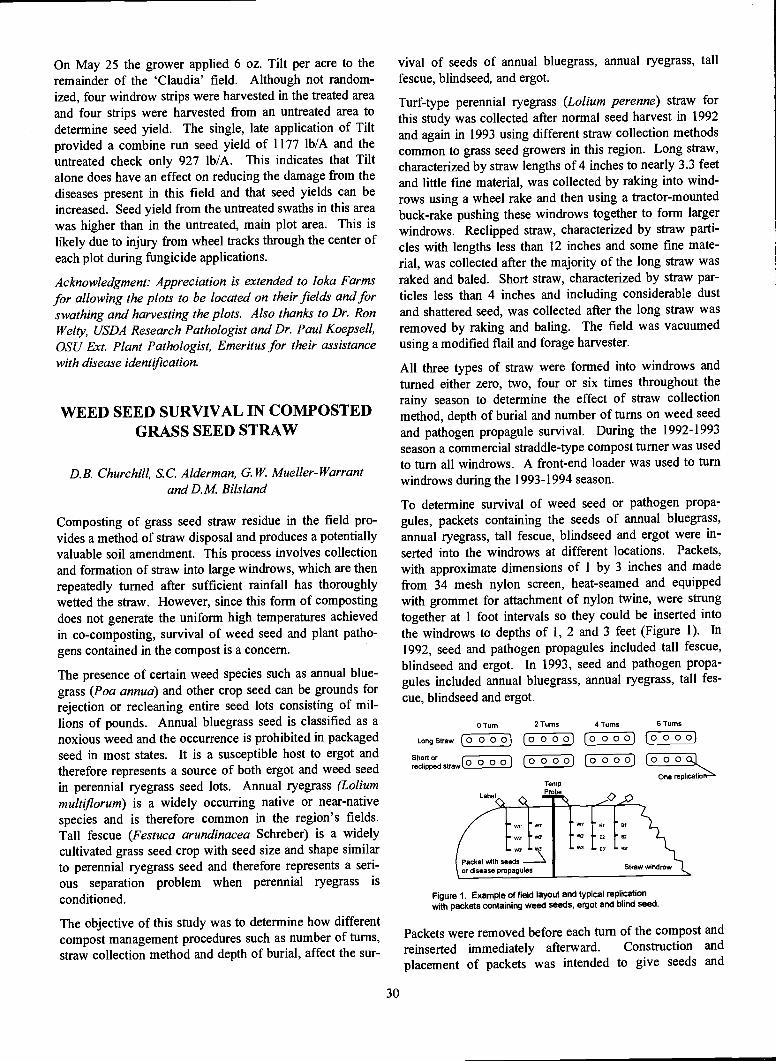
On May 25 the grower applied 6 oz. Tilt per acre to theremainder of the 'Claudia' field. Although not random-ized, four windrow strips were harvested in the treated areaand four strips were harvested from an untreated area todetermine seed yield. The single, late application of Tiltprovided a combine run seed yield of 1177 lb/A and theuntreated check only 927 lb/A. This indicates that Tiltalone does have an effect on reducing the damage from thediseases present in this field and that seed yields can beincreased. Seed yield from the untreated swaths in this areawas higher than in the untreated, main plot area. This islikely due to injury from wheel tracks through the center ofeach plot during fungicide applications.
Acknowledgment: Appreciation is extended to loka Farmsfor allowing the plots to be located on their fields and forswathing and harvesting the plots. Also thanks to Dr. RonWelty, USDA Research Pathologist and Dr. Paul Koepsell,OSU Ext. Plant Pathologist, Emeritus for their assistancewith disease ident?/Ication.
WEED SEED SURVIVAL IN COMPOSTEDGRASS SEED STRAW
D.B. Churchill, S.C. Alderman, G. W. Mueller-Warrantand D.M Bilsiand
Composting of grass seed straw residue in the field pro-vides a method of straw disposal and produces a potentiallyvaluable soil amendment. This process involves collectionand formation of straw into large windrows, which are thenrepeatedly turned after sufficient rainfall has thoroughlywetted the straw. However, since this form of compostingdoes not generate the uniform high temperatures achievedin co-composting, survival of weed seed and plant patho-gens contained in the compost is a concern.
The presence of certain weed species such as annual blue-grass (Poa annua) and other crop seed can be grounds forrejection or recleaning entire seed lots consisting of mil-lions of pounds. Annual bluegrass seed is classified as anoxious weed and the occurrence is prohibited in packagedseed in most states. It is a susceptible host to ergot andtherefore represents a source of both ergot and weed seedin perennial ryegrass seed lots. Annual ryegrass (Loliummult/lorum) is a widely occurring native or near-nativespecies and is therefore common in the region's fields.Tall fescue (Festuca arundinacea Schreber) is a widelycultivated grass seed crop with seed size and shape similarto perennial ryegrass seed and therefore represents a seri-ous separation problem when perennial ryegrass is
conditioned.
The objective of this study was to determine how differentcompost management procedures such as number of turns,straw collection method and depth of burial, affect the sur-
30
vival of seeds of annual bluegrass, annual ryegrass, tallfescue, blindseed, and ergot.
Turf-type perennial ryegrass (Lolium perenne) straw forthis study was collected after normal seed harvest in 1992and again in 1993 using different straw collection methodscommon to grass seed growers in this region. Long straw,characterized by straw lengths of 4 inches to nearly 3.3 feetand little fine material, was collected by raking into wind-rows using a wheel rake and then using a tractor-mountedbuck-rake pushing these windrows together to form largerwindrows. Reclipped straw, characterized by straw parti-cles with lengths less than 12 inches and some fine mate-rial, was collected after the majority of the long straw wasraked and baled. Short straw, characterized by straw par-ticles less than 4 inches and including considerable dustand shattered seed, was collected after the long straw wasremoved by raking and baling. The field was vacuumedusing a modified flail and forage harvester.
All three types of straw were formed into windrows andturned either zero, two, four or six times throughout therainy season to determine the effect of straw collectionmethod, depth of burial and number of turns on weed seedand pathogen propagule survival. During the 1992-1993season a commercial straddle-type compost turner was usedto turn all windrows. A front-end loader was used to turnwindrows during the 1993-1994 season.
To determine survival of weed seed or pathogen propa-gules, packets containing the seeds of annual bluegrass,annual ryegrass, tall fescue, blindseed and ergot were in-serted into the windrows at different locations. Packets,with approximate dimensions of 1 by 3 inches and madefrom 34 mesh nylon screen, heat-seamed and equippedwith grommet for attachment of nylon twine, were strungtogether at 1 foot intervals so they could be inserted intothe windrows to depths of 1, 2 and 3 feet (Figure 1). In
1992, seed and pathogen propagules included tall fescue,blindseed and ergot. In 1993, seed and pathogen propa-gules included annual bluegrass, annual ryegrass, tall fes-cue, blindseed and ergot.
Long Straw
Short orrechpped straw
0 Turn
0 0 0
(0 0 0 o)
7/
(0 0 002 TurnS
(0 0 00)
TempProbe
4 Turns
(0 0 0 o)
(0 o 0 0
St
Straw w,ndrow
6 Turns
(o o 00(0 OO
One replicatiO
Packet with seedsor disease propagules
Figure 1. Example of field layout and typical replicationwith packets containing weed seeds, ergot and blind seed.
Packets were removed before each turn of the compost and
reinserted immediately afterward. Construction andplacement of packets was intended to give seeds and

pathogen propagules exposure similar to the physical andchemical conditions that nonpacketed particles receive inthe composting process yet enable their retrieval at thetest's conclusion. Internal temperatures were measuredweekly at depths corresponding to packet locations. Afterapproximately 8 months in the compost, packets containingseeds and pathogen propagules were removed, cleaned andcontents germinated in the laboratory using standard ger-mination tests for seeds and standard laboratory tests forblindseed and ergot. Analysis of variance tests were con-ducted to determine the significance of number of turns andpacket depth on survival of weed seeds and diseasepropagules.
Results and DiscussionResults from 1992-93 - Commercial compost turner
Average and high internal temperatures and percent sur-vival of blindseed, ergot, and tall fescue, in long and shortstraw windrows with different numbers of turns with acommercial, straddle-type compost turner during 1992-93were determined. During the 1992-93 season, survival oftall fescue seed in long straw windrows was not signifi-cantly affected by number of turns or depth of burial. Inshort straw windrows, the effect of depth of burial was in-significant on tall fescue seed survival. However, in-creased numbers of turns significantly reduced tall fescueseed survival. Blindseed survival in long straw was notsignificantly affected by either depth of burial or number ofturns. None of the blindseed propagules placed in shortstraw windrows survived any number of turns or burialdepths. Survival of ergot in long straw was significantlyreduced by increased numbers of turns but not by burialdepth. None of the ergot propagules survived in shortstraw at any number of turns or burial depth.
Results from 1993-94 - Front-end loader
Annual bluegrass seed survival in long straw windrows wassignificantly reduced by increased number of turns but wasnot affected by burial depth. Annual bluegrass seed did notsurvive burial at any depth or any number of turns in re-clipped straw. Survival of annual ryegrass seed in longstraw windrows was significantly reduced by increasednumbers of turns but not depth of burial. None of the an-nual ryegrass seed placed in reclipped straw survived atany depth or number of turns. Tall fescue seed survivalwas significantly reduced by increased numbers of turnsbut not by depth in long straw windrows. None of the tallfescue seeds survived burial at any depth or at any numberof turns in reclipped straw.
Depth of burial and number of turns did not significantlyaffect the survival of blindseed in long straw windrows andnone of the blindseed survived burial at any depth or anynumber of turns in reclipped straw windrows. Ergotpropagule survival in long straw was significantly reducedby increased numbers of turns but not by depth of burial.Survival of ergot propagules in reclipped straw was notsignificantly affected by number of turns or burial depth.
31
Effect of turning method and straw collection method
An analysis of variance showed depth of burial had nosignificant effect on the survival of the seeds and pathogenpropagules as a group turned by either method. Straw col-lection method (and therefore straw type) had no signifi-cant effect directly on mean survival of seeds or pathogenpropagules.
These results suggest that increased numbers of turns aremost important in controlling survival of weed seed andpathogen propagules for all types of straw tested. Based ona least significant difference test, this study demonstratedthat to minimize survival of annual bluegrass, ergot, annualryegrass, tall fescue, and blindseed required at least 4, 6, 2,2, and 2 turns, respectively were required for maximumreduction in survival (Table 1). As a general rule, compostof all types of straw could be turned using either a com-mercial compost turner or front end loader a minimum offour turns for best overall control of the weed seed andpathogen species tested here.
Thorough mixing to expose seeds and propagules to greaterdepths, while possibly important in forming compost withdesirable physical properties, appears to be less importantthan originally believed in controlling survival of seeds andpropagules. These findings suggest that growers compost-ing straw should make an effort to turn compost frequentlybut that the expense of exposing all portions of the compostto greater depths may be less important in the survival ofthe species tested here.
Summary and ConclusionsGreater numbers of turns and an increased internal tem-perature of the compost windrow was found to reduce sur-vival of all species. Depth of burial, straw collectionmethod, and therefore straw type, were largely insignificantin survival of seeds and pathogen propagules. However,differences in high and average temperatures did exist as aresult of number of turns, straw collection method anddepth of burial. Additionally temperature was significantlyaffected by the interaction of these variables. Blindseedwas most susceptible to turning, with their survival beingeliminated with two or more turns. Tall fescue seed wasmost resistant to the effects of turning with a small percent-age surviving six turns in some cases.

Table 1. Mean survival of weed seeds and pathogenpropagules in composted grass seed straw.
(% survival)
Values in the same column with different letters are sig-nificantly different (P=0.05).
WATER STRESS IMPACTS ON DIEBACKOF PERENNIAL RYEGRASS SEED FIELDS
TM Velloza, T G. Chastain, W. C. Young IIIand ME. Mellbye
IntroductionThe premature decline of perennial ryegrass seed fields,commonly known as dieback, is a widespread problem ofeconomic importance to seed producers. The incidenceand severity of dieback symptoms appears to vary amongperennial ryegrass varieties. Moreover, the severity of thisdisorder has been observed to increase proportionally withthe age of the stand. One possible explanation for this phe-nomenon is that as the plant ages it is increasingly less ca-pable of withstanding water stress and producing the criti-cal regrowth required for the development of the next sea-son's crop. Young tillers are most vulnerable to stressconditions, consequently, the plant's ability to replace oldertillers is markedly reduced under drought or other stressconditions. The impact of water deficit at critical times inthe regrowth of the crop cannot be underestimated.
Extremely dry summers, as are sometimes experienced inOregon, no doubt impose water stress in the field that maydelay the regrowth of the crop in the fall. Most of the per-ennial ryegrass seed crops in the Willamette Valley arerain-fed, thus later rains in fall may hinder the regrowthand development of the crop after summer harvesting. Itseems plausible that any factor adversely affecting thegrowth of tillers in fall may also reduce subsequent flower-ing and seed yield. Since there is limited information onthe effect of water supply on flowering and seed yield inperennial ryegrass, we designed this study to assess theimpact of summer and early fall rainfall on the field per-formance of perennial ryegrass seed crops. The fmdings ofthis project could also be used to assist in irrigation man-agement of perennial ryegrass seed crops.
32
Our objectives include: (i) investigate how post-harvestleaf and tiller development in perennial grass seed crops isimpacted by the timing, severity, and length of water stress;(ii) identify potential relationships to flowering and seedyield; and (iii) disseminate results through educational pro-grams for producers and agricultural support industries.
ProcedureField StudiesAffinity and Buccaneer perennial ryegrass were sown atHyslop Farm in fall 1994 to determine the impact of theincidence and severity of water deficit on tiller growth anddevelopment during the critical late summer and early fallregrowth period. Plots were initiated in summer 1995 fol-lowing seed harvest from the first seed crop.
Rain-out shelters and a special irrigation system were con-structed and installed. Rain-out shelters were used to ex-clude natural rainfall from all plots except the irrigationtreatments. Rainfall was simulated by using a drip-emittersystem specifically designed for small plot irrigation. Thedevice frame was 6 ft. by 25 ft. (same size as each plot) andwas constructed of 1 in. PVC pipe. The irrigation tubesand the drip-emitters on each line of tubing were one ft. oncenter. Water was delivered via a Pak tank by a piston-driven pump, passing through a screen before output to theplots. Pressure (PSI) and output (gal./min.) were alsomeasured.
The irrigation system was used to simulate significant rain-fall events (one inch precipitation) in mid-August(summer), in mid-September (early fall), and the combina-tion of rainfall events during both periods. These treat-ments were compared with no rainfall and ambient rainfallconditions. To deliver the equivalent of one inch of pre-cipitation, we used an output level of 1.25 gal.Imin for 75minutes. Each treatment was replicated four times.
Sequential samples were taken at three weeks after eachtreatment to follow plant development through the fall pe-riod. Plant growth and developmental characteristics in-cluding the number of leaves per tiller, the number of aerialand basal tillers, tiller dry weight, tiller basal diameter, andtiller height were measured. Water stress levels weremonitored using time domain reflectometry and infraredthermometry.
The effect of summer and fall drought stress on floweringin the following spring will be determined by taking fertile
tiller samples prior to harvest. Seed yield will be measured
by small plot swather and combine.
Controlled Environment StudiesWe are now in the process of testing the responses of sev-eral commercial perennial ryegrass cultivars to water stress.These cultivars represent the range of dieback symptomsfrom unaffected to high incidence and severity. Protocolsfor controlled environment water stress trials have beendeveloped. We have tested a vapor pressure osmometermethod for measuring the level of water stress to be im-
0 45.25 a1 16.50 a 6.11 a 0.06 a 0.25 a
2 1l.16b 0.63b 0.85b 0.00b 0.15a4 0.00 bc 0.00 b 0.21 b 0.00 b 0.06 b
6 0.00 bc 0.00 b 0.21 b 0.00 b 0.00 bc
Numberof Annual Annual Tall Blind
turns bluegrass ryegrass fescue seed ergot

posed by polyethylene glycol (PEG) solutions. Apparatusfor the osmotic adjustment of the modified Hoaglunds(nutrient) solution to simulate water stress conditions hasbeen constructed. Our purpose is to learn whether waterstress is a causal factor in the development of diebacksymptoms in perennial ryegrass plants.
ProgressPreliminary data from our field studies reveal that the twocultivars responded differently to water stress; however, norainfall generally produced less regrowth than other simu-lated rainfall treatments (Table 1). There were no differ-ences in tiller number or tiller basal diameter at the firstsampling date (7 August 1995). This date was immediatelyafter harvest and preceded the summer rainfall treatment.Differences among simulated rainfall treatments becameapparent in later sampling dates.
Ambient conditions produced the highest number of totaltillers in both cultivars while no rainfall typically had thelowest. Rainfall conditions in late summer and early fall1995 were much above normal for the Willamette Valley.
It is noteworthy that in almost all cases the combinedsummer and fall rain was not different from the summerrainfall alone, though it was often better than rain in fallonly (Table 1). This may indicate that a summer rainfallmay be more critical than rain in the early fall. Combinedsummer and fall rainfall events provided precipitationroughly equivalent to the normal level attained during theregrowth period, but tiller production in this treatment wasnot different than that observed in the ambient rainfalltreatment, which received nearly twice normal precipita-tion. No rainfall during the regrowth period reduced tillerproduction by 30%.
Climatic data indicate that over the past 20 years, the aver-age rainfall during the late summer and early fall period isabout 3 inches. Nevertheless, about 4 inches of precipita-tion after seed harvest is required to produce the optimumtiller population in perennial ryegrass (Figure 1). Bothcultivars responded to the amount of applied and naturalrainfall in the same manner. Therefore, perennial ryegrassseed crops may be under moderate to severe levels of waterstress during summer and early fall in most years. Fur-thermore, this stress may limit the plant's ability to recoverand produce tillers critical for persistence of the stand andfor next season's seed crop.
Though irrigation is expensive, it may be economicallyfeasible in many situations where water is available tomaximize stand persistence and seed yield. Since ourfmdings to date indicate that summer rainfall events aremore beneficial than early fall events for fall tiller produc-tion, this characteristic may be used by breeders to selectfor better drought tolerance and stand persistence in per-ennial ryegrass seed fields. The efficacy of irrigation in
33
perennial ryegrass will be better elucidated in the summerwhen fertile tiller numbers and seed yield data will be ob-tained and analyzed. We intend to continue the trialsthrough seed harvest in 1997.
1000
800 -
600 -
4o0
20O-
00
Figure 1.
1 2 3
A AffinityE Buccaneer
4 5 6 7
Natural and Applied Rainfall (Inches)
Impact of precipitation on Affmity and Bucca-neer perennial ryegrass tiller populations dur-ing post-harvest regrowth.

Table 1. Influence of quantity and timing of rainfall on post-harvest regrowth in perennial ryegrass seed crops.
Regrowth Rainfallcharacteristics treatment
Basal diameter
AmbientNo rainSummer rainFall rainSummer + fall
AmbientNo rainSummer rainFall rainSummer + fall
132 a' 592 b162a 380a150 a 492 abl58a 368a112a 554b
1.4 a 1.7 c1.6 a 1.4 a1.3 a 1.6 bc1.4 a 1.6 bc1.5 a 1.5 ab
INFLUENCE OF STUBBLE AND PLANTGROWTH REGULATORS ON CREEPING
RED FESCUE SEED CROPS
PD. Meints, T. G. Chastain, W. C. Young III,G.M Banowetz and C.i Garbacik
IntroductionOpen-field burning is associated with stable seed yields increeping red fescue and Kentucky bluegrass. Creeping redfescue and Kentucky bluegrass are both rhizome-forminggrass seed crops. Seed yields are often reduced in theseseed crops when standing stubble and straw remain in thefield after harvest. Understanding how the presence ofstubble affects regrowth is essential to developing ways toproduce creeping red fescue and Kentucky bluegrass seedcrops without fire. Our research has shown that creepingred fescue has the greatest requirement for open-fieldburning among grass seed crops grown in the PacificNorthwest. Unlike Kentucky bluegrass, creeping red fes-cue cannot be produced without fire. Elimination of fieldburning would leave creeping red fescue producers withoutresidue management options.
Rhizome production often increases in fields wherenonthermal management has been practiced. Production ofrhizomes has been shown to be inversely related to seedproduction. In other words, increased numbers of rhizomesoften mean reduced seed yields for the grower. Tillers and
Affinity7Aug 8Sep
34
Cultivar
924 b666 a810 ab718 ab902 ab
(mm)
1.9 a1.9 a2.2 ab2.3 b2.2 ab
Means followed by the same letter are not different by Fisher's protected LSD values.
174 a204 a144 a134 a170 a
1.6 a1.6 a1.8 a1.4 a1.5 a
622b 964c370a 618a470 ab 844 bc512 ab 726 ab598 ab 914 bc
rhizomes both arise from buds located in the plant crown.The differentiation of crown buds is thought to be influ-enced by the microenvironment near the crown duringpost-harvest regrowth.
Stubble remaining in the field can also change the qualityand quantity of the light reaching the crown both beforeand during regrowth of the crop. Light quality (red lightvs. far-red light) may also be changed by stubble left in thefield in the aftermath of nonthermal management. Lowred/far-red ratios have been linked to reduced tiller pro-duction in other grass species and may produce the sameeffects in creeping red fescue. Tillers growing in stubbletend to be etiolated and immature at the cessation of fallregrowth. Immature tillers are less likely to be induced toflower and, in turn, produce seed in the following season.
Plant growth hormones are compounds that naturally occurin the plant, which are involved in the mediation of growthand developmental processes. A change in the balance ofhormones may play a role in the differentiation of crownbuds to tillers or rhizomes. Plant growth regulators (PGRs)are natural or synthetic compounds that are functionalanalogs to the hormones found in the plant. PGRs may beapplied to induce a desired response in the plant.
The focus of our research was to examine the influence ofpartial and complete stubble removal, light quality, andPGRs on post-harvest vegetative development and flower-ing in creeping red fescue.
1.8 a 2.1 a1.6 a 2.2 a1.6 a 2.0 a1.7 a 2.0 a1.5 a 2.0 a
Buccaneer13 Oct 7Aug 8Sep 13 Oct
Tiller no. (no./sq. ft.)

ProcedureField trials were established after the first seed harvest inShademaster (1994) and Hector (1995) creeping red fescuegrown near Silverton, OR. Trials were also conducted inShademaster and Seabreeze creeping red fescue planted infaIl 1994 at Hyslop Farm. Partial and complete stubbleremoval treatments were conducted after harvest. A gaso-line-powered brushcutter was used to achieve completeremoval of crop stubble (0 inch stubble height). Stubblewas also partially removed to 1 inch and 2 inch stubbleheights by using a sickle bar mower. PGRs were appliedafter harvest at 1 0 M and 1 6 M rates on non-burned andburned plots. PGRs evaluated include auxin (IAA), ab-scisic acid (ABA), cytokinin (BA), ethylene (ethephon),and gibberellic acid (GA). Tiller and leaf developmentalresponses to stubble height reduction and PGR were ascer-tained on samples taken in late fall. Stubble cutting heightand PGR impacts on rhizome formation were determined.Root zone cores were taken with a golf course cup cutter todetermine rhizome:root and rhizome:tiller ratios. Fertiletiller numbers were measured in late spring prior to harvest.
ProgressStubble height treatment affected fall tiller production(Table 1). Complete stubble removal (0 inch) reduced car-bohydrate storage available for regrowth, thereby causingdelayed maturity (measured by leaf number per tiller) andlower above-ground dry weight. Tiller maturity was simi-lar for the burn treatment, and one and two inch stubbleheights. Fall tiller number was not different from the burntreatment when all stubble was removed. Rhizome pro-duction was lowest when the crop was burned or whenstubble was completely removed. Complete removal ofstubble produced fall regrowth that was essentially equiva-lent to open-field burning. Fertile tiller production wasgreatest when the stubble was burned or when stubble wascompletely removed in the previous fall. Partial stubbleremoval (one and two inch stubble heights) reduced fertiletiller production.
Of particular interest in this first-year data, is the compari-son of fertile tiller number and rhizome weight. As thenumber of fall vegetative tillers and fertile tillers increased,the weight of the rhizomes correspondingly decreased. Thecomplete removal of stubble by mechanical means or byopen-burning had a direct influence on the differentiationof crown buds to form tillers during fall regrowth. Tillerswere more likely to be induced to flower when stubble wasnot present. Our results indicate that as more of the crownbuds were differentiated into tillers, fewer rhizomes wereformed. The presence of stubble inhibits regrowth ofcreeping red fescue and increases rhizome production, andin turn, causes a reduction in flowering and seed yield po-tential of the crop. Apart from the benefits of pest control,perhaps the most important benefit of field burning for rhi-zome-forming grass seed crops (creeping red fescue andKentucky bluegrass) is the inexpensive removal of stubbleand subsequent promotion of crop regrowth.
35
PGR application showed no differential response for any ofthe fall tiller measurements (Table 2). Weight of fall re-growth, however, was greater when the crop was open-burned (data not shown). Unlike the stubble reductiontreatments, PGR application did not exhibit a significanteffect on rhizome weight and was not different from theopen burn treatment. Fertile tiller number was lower whentreated by ethephon than when the crop was burned, butwas not different from other PGRs or the non-burn check.Our first-year data suggests that the natural production ofethylene by decaying stubble may have an indirect negativeimpact on floral induction in creeping red fescue. Ethylenemay damage tiller growth or development in a way that wehave not detected and, in turn, may cause the subsequentreduction noted in fertile tillers in the following spring. Ifso, more thorough removal of stubble may reduce ethyleneproduction or eliminate the direct contact with stubble andthereby remove an impediment to flowering.
SummaryRemoval of all stubble without burning in creeping redfescue produced tiller growth and development, rhizomeproduction, and flowering responses that were similar toopen-field burning. Partial stubble removal (one and twoinches) reduced tiller number, increased rhizome weight,and reduced fertile tiller production. Ethephon applicationreduced fertile tiller production in creeping red fescueproviding possible evidence of the role of ethylene in re-ducing seed yields in this species when stubble is notburned. Work is underway with PGRs to learn how naturalplant hormones affect crop regrowth and fertile tiller pro-duction. Light quality at the crown in fall is also beingexamined to find out how stubble may change the lightenvironment at the level of the bud. Growth chamber ex-periments are also in progress to examine the effects oflight quality on tiller vs. rhizome formation.
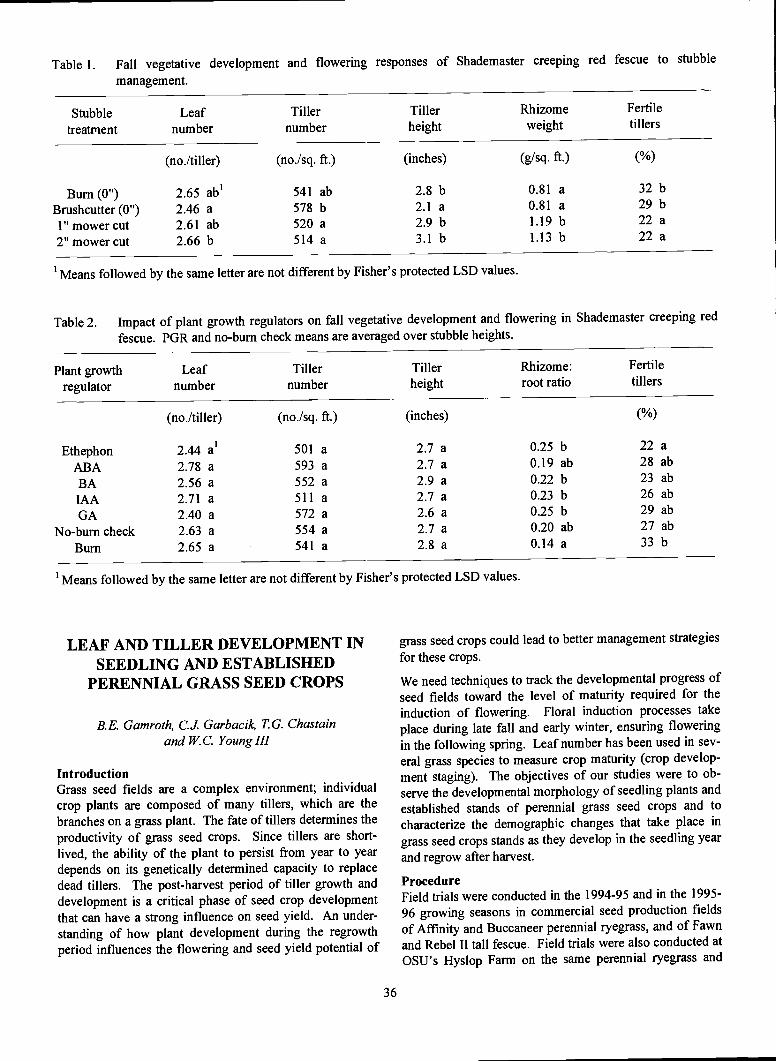
Table 1. Fall vegetative development and flowering responses of Shademaster creeping red fescue to stubblemanagement.
'Means followed by the same letter are not different by Fisher's protected LSD values.
Table 2. Impact of plant growth regulators on fall vegetative development and flowering in Shademaster creeping red
fescue. PGR and no-bum check means are averaged over stubble heights.
Plant growthregulator
Leafnumber
(no./tiller)
Tillernumber
(no.Isq. ft.)
'Means followed by the same letter are not different by Fisher's protected LSD values.
LEAF AND TILLER DEVELOPMENT INSEEDLING AND ESTABLISHED
PERENNIAL GRASS SEED CROPS
B.E. Gamroth, C.J. Garbacik, T. G. Chastainand W.C. Young HI
IntroductionGrass seed fields are a complex environment; individualcrop plants are composed of many tillers, which are thebranches on a grass plant. The fate of tillers determines theproductivity of grass seed crops. Since tillers are short-lived, the ability of the plant to persist from year to yeardepends on its genetically determined capacity to replacedead tillers. The post-harvest period of tiller growth anddevelopment is a critical phase of seed crop developmentthat can have a strong influence on seed yield. An under-standing of how plant development during the regrowthperiod influences the flowering and seed yield potential of
36
Tillerheight
(inches)
Rhizome:root ratio
Fertiletillers
(%)
grass seed crops could lead to better management strategies
for these crops.
We need techniques to track the developmental progress ofseed fields toward the level of maturity required for theinduction of flowering. Floral induction processes takeplace during late fall and early winter, ensuring floweringin the following spring. Leaf number has been used in sev-eral grass species to measure crop maturity (crop develop-ment staging). The objectives of our studies were to ob-
serve the developmental morphology of seedling plants andestablished stands of perennial grass seed crops and tocharacterize the demographic changes that take place ingrass seed crops stands as they develop in the seedling yearand regrow after harvest.
ProcedureField trials were conducted in the 1994-95 and in the 1995-
96 growing seasons in commercial seed production fields
of Affinity and Buccaneer perennial ryegrass, and of Fawnand Rebel II tall fescue. Field trials were also conducted atOSU's Hyslop Farm on the same perennial ryegrass and
Ethephon 2.44 a' 501 a 2.7 a 0.25 b 22 a
ABA 2.78 a 593 a 2.7 a 0.19 ab 28 ab
BA 2.56 a 552 a 2.9 a 0.22 b 23 ab
IAA 2.71 a 511 a 2.7 a 0.23 b 26 ab
GA 2.40 a 572 a 2.6 a 0.25 b 29 ab
No-bum check 2.63 a 554 a 2.7 a 0.20 ab 27 ab
Bum 2.65 a 541 a 2.8 a 0.14 a 33 b
Bum (0") 2.65 ab' 541 ab 2.8 b 0.81 a 32 b
Brushcutter (0") 2.46 a 578 b 2.1 a 0.81 a 29 b1" mower cut 2.61 ab 520 a 2.9 b 1.19 b 22 a
2" mower cut 2.66 b 514 a 3.1 b 1.13 b 22 a
Stubble Leaf Tiller Tiller Rhizome Fertile
treatment number number height weight tillers
(no.!tiller) (no.Isq. ft.) (inches) (g!sq. ft.) (%)
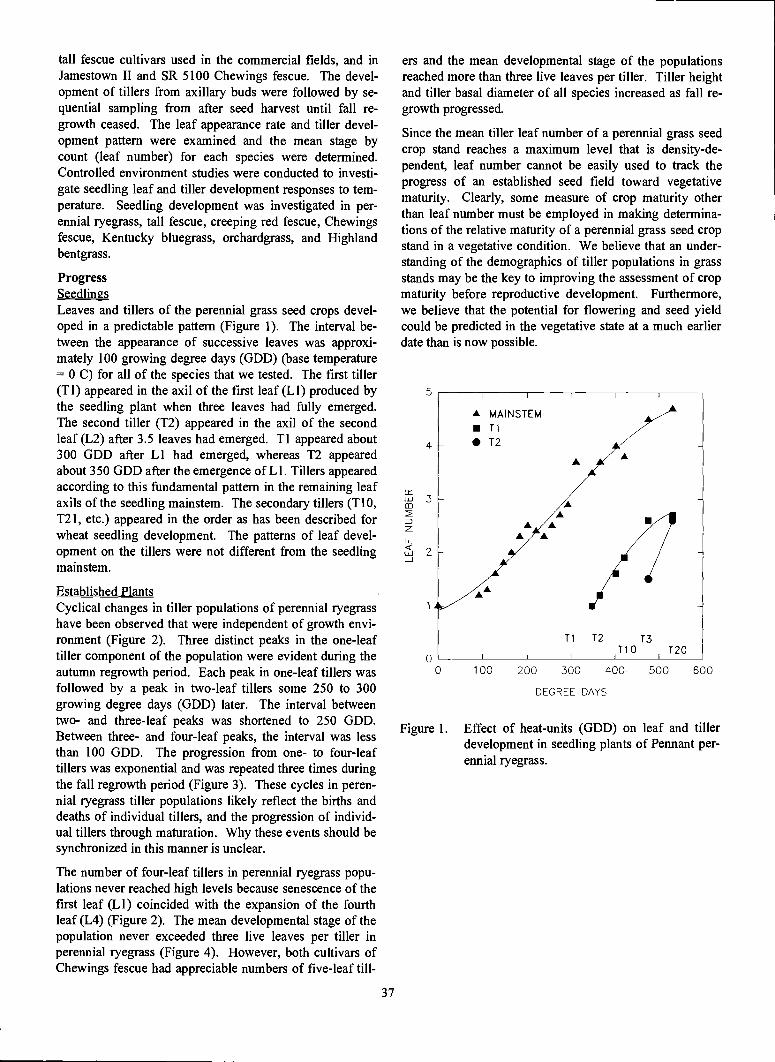
tall fescue cultivars used in the commercial fields, and inJamestown 11 and SR 5100 Chewings fescue. The devel-opment of tillers from axillary buds were followed by se-quential sampling from after seed harvest until fall re-growth ceased. The leaf appearance rate and tiller devel-opment pattern were examined and the mean stage bycount (leaf number) for each species were determined.Controlled environment studies were conducted to investi-gate seedling leaf and tiller development responses to tem-perature. Seedling development was investigated in per-ennial ryegrass, tall fescue, creeping red fescue, Chewingsfescue, Kentucky bluegrass, orchardgrass, and Highlandbentgrass.
ProgressSeedlingsLeaves and tillers of the perennial grass seed crops devel-oped in a predictable pattern (Figure 1). The interval be-tween the appearance of successive leaves was approxi-mately 100 growing degree days (GDD) (base temperature= 0 C) for all of the species that we tested. The first tiller(Ti) appeared in the axil of the first leaf (LI) produced bythe seedling plant when three leaves had fully emerged.The second tiller (T2) appeared in the axil of the secondleaf (L2) after 3.5 leaves had emerged. Ti appeared about300 GDD after Li had emerged, whereas T2 appearedabout 350 GDD after the emergence of Li. Tillers appearedaccording to this fundamental pattern in the remaining leafaxils of the seedling mainstem. The secondary tillers (Tb,121, etc.) appeared in the order as has been described forwheat seedling development. The patterns of leaf devel-opment on the tillers were not different from the seedlingmainstem.
Established PlantsCyclical changes in tiller populations of perennial ryegrasshave been observed that were independent of growth envi-ronment (Figure 2). Three distinct peaks in the one-leaftiller component of the population were evident during theautumn regrowth period. Each peak in one-leaf tillers wasfollowed by a peak in two-leaf tillers some 250 to 300growing degree days (GDD) later. The interval betweentwo- and three-leaf peaks was shortened to 250 GDD.Between three- and four-leaf peaks, the interval was lessthan 100 ODD. The progression from one- to four-leaftillers was exponential and was repeated three times duringthe fall regrowth period (Figure 3). These cycles in peren-nial ryegrass tiller populations likely reflect the births anddeaths of individual tillers, and the progression of individ-ual tillers through maturation. Why these events should besynchronized in this manner is unclear.
The number of four-leaf tillers in perennial ryegrass popu-lations never reached high levels because senescence of thefirst leaf (Li) coincided with the expansion of the fourthleaf (L4) (Figure 2). The mean developmental stage of thepopulation never exceeded three live leaves per tiller inperennial ryegrass (Figure 4). However, both cultivars ofChewings fescue had appreciable numbers of five-leaf till-
37
ers and the mean developmental stage of the populationsreached more than three live leaves per tiller. Tiller heightand tiller basal diameter of all species increased as faIl re-growth progressed.
Since the mean tiller leaf number of a perennial grass seedcrop stand reaches a maximum level that is density-de-pendent, leaf number cannot be easily used to track theprogress of an established seed field toward vegetativematurity. Clearly, some measure of crop maturity otherthan leaf number must be employed in making determina-tions of the relative maturity of a perennial grass seed cropstand in a vegetative condition. We believe that an under-standing of the demographics of tiller populations in grassstands may be the key to improving the assessment of cropmaturity before reproductive development. Furthermore,we believe that the potential for flowering and seed yieldcould be predicted in the vegetative state at a much earlierdate than is now possible.
5
4
3
2
00 100 200 300 400 500 600
DEGREE DAYS
Figure 1. Effect of heat-units (GDD) on leaf and tillerdevelopment in seedling plants of Pennant per-ennial ryegrass.
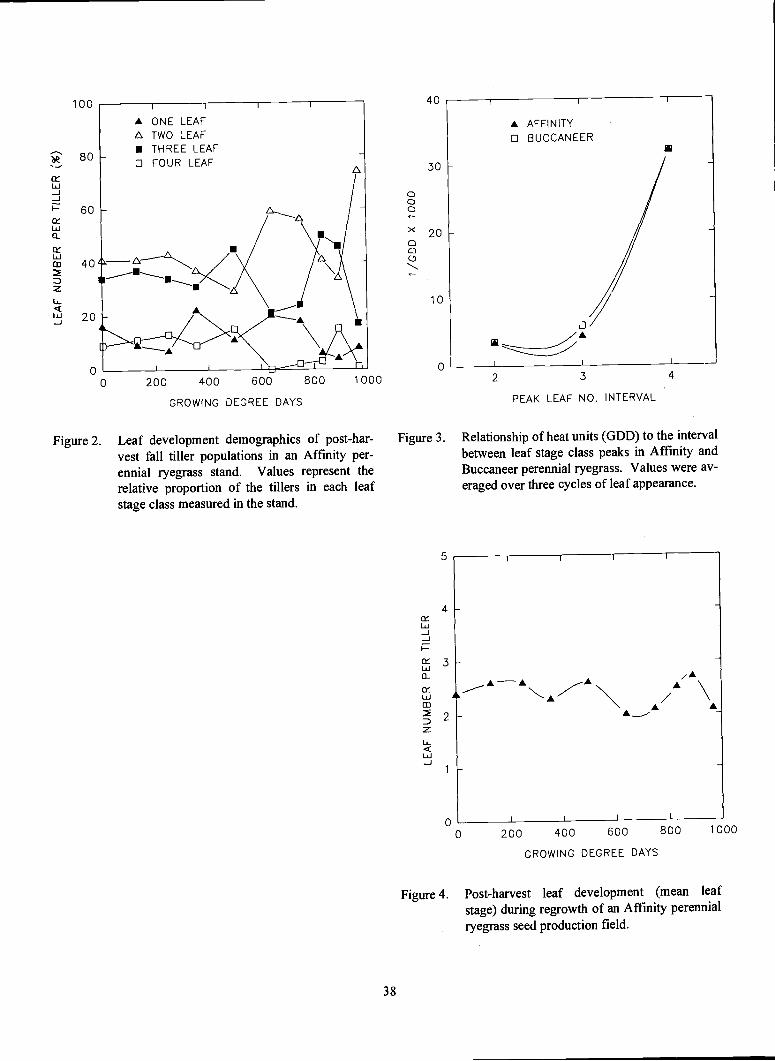
100
80 -
60 -
40
20
00
Figure 2.
A ONE LEAFL TWO LEAF
THREE LEAFo FOUR LEAF
U
A
n
38
CD00x000
40
30
20
10
0
5
4
Figure 4. Post-harvest leaf development (mean leafstage) during regrowth of an Affinity perennialryegrass seed production field.
2 3 4
PEAK LEAF NO. INTERVAL
Figure 3. Relationship of heat units (GDD) to the intervalbetween leaf stage class peaks in Affmity andBuccaneer perennial ryegrass. Values were av-eraged over three cycles of leaf appearance.
200 400 600 800 1000
CROWING DECREE DAYS
Leaf development demographics of post-har-vest fall tiller populations in an Affmity per-ennial ryegrass stand. Values represent therelative proportion of the tillers in each leafstage class measured in the stand.
0 10000 200 400 600 800
CROWING DECREE DAYS

SELECTION FOR STEM RUSTRESISTANCE IN TALL FESCUE
RE. Barker and R.E. Welly
IntroductionTall fescue is an important grass grown for forage and turfin the southeast and midwest regions of the USA. It ranksthird among grasses in number of acres grown for seed inthe Willamette Valley of Oregon. Stem rust, first reportedon the seed crop in 1987 (Welty and Mellbye, 1989), hasincreased in economic impact in seed production fields inrecent years. Fungicides have been used to control the dis-ease. Genetic resistance, however, would provide a moreenvironmentally sound approach to control the disease.
Welty and Barker (1993) surveyed 20 cultivars of tall fes-cue for resistance to stem rust. None of the cultivars werejudged resistant, but there were differences among cultivarsfor number of plants with a resistant response when inocu-lated with stem rust. Resistant plants were saved from thesurvey, and this study reports results from two cycles ofrecurrent selection in controlled environment screening.
Materials and MethodsSource plants for this study were selected from among1,400 plants in a nursery established in 1990 containing 70plants from each of 20 cultivars (Welty and Barker, 1993).Plants with resistant reaction for the turf-type populationscame from tall fescue cultivars Arid (6 plants), Mesa (6),Thoroughbred (4), Finelawn I (2), Finelawn 5GL (1), andAdventure (1), and for forage-type populations from culti-vars Kentucky 31(10), Forager (3), and Johnstone (1).The initial selection criterion, using procedures describedby Welty and Barker (1993), was freedom of any stem rustsymptoms during two inoculations on seedlings in a green-house and two scoring periods in 1990 after plants weretransplanted to the field.
Populations were developed through two selection cyclesin the same way (Figure 1). Ten vegetative cuttings(ramets) were collected from each selected plant and estab-lished in isolated polycross (PX) blocks. Open pollinated(OP) seed from the resistant plants in the original nurserywas also harvested. Two cycles of PX and one cycle of OPfollowed by one cycle of PX selection using the 2-stagegreenhouse screening process were completed.
Following an establishment year, seed was harvested fromeach plant and composited by maternal line. Sixty seed-lings from each maternal line were screened through twoinoculations with stem rust spores in the greenhouse (Weltyand Barker, 1993). Maternal family lines with the lowestaverage infection type score were selected and individualplants within families chosen based on freedom of anystem rust symptoms in both inoculations. Three plantswere saved from each of seven lines for the turf-typepopulation and five lines for the forage-type. The second
39
cycle of OP selection included reverse selection for sus-ceptibility to stem rust. Selected plants for all populationswere divided into ten ramets each and established in iso-lated crossing blocks in the field.
Co
Cl
C2
Figure 1. Diagrammatic representation for developmentof tall fescue populations through two cycles ofselection (CO to C2) for stem rust. Each of theturf-type and forage-type populations weredeveloped in the same way in reference to theirorigin. Open pollinated (OP) and isolatedpolycross (PX) populations are represented.
Equal quantities of seed from each plant were compositedto form the populations used to determine response fromselection. Selection progress was measured on ten plants ineach of twelve replications and was tested by the two-stageinoculation procedure in the greenhouse.
Results and DiscussionNumber of plants with resistant reaction in both inocula-tions based on pustule type increased from 5 to 52% in thePX forage-type population and from 5 to 50% in the PXturf-type (Figure 2). The first cycle of PX selection pro-duced 74 and 89% of the gain in the two populations, re-spectively. Overall response from initial OP selection wassimilar to PX selection, but 78 and 49% of the gain, re-spectively, was made in the PX cycle. Reverse selectionfor susceptibility caused all resistant plants to be lost inonly one cycle of selection.
Results indicated that rapid progress from selection in thegreenhouse for stem rust resistance in tall fescue is possi-ble, but most of the additive genetic variance was used af-ter one cycle of PX selection and genetic improvement willbe slower in ftiture cycles.
All cultivars tested using this inoculation procedure wereclassified as susceptible and had less than 10% plants thatwere judged resistant (data not shown). The PX cycle 2populations were prepared to provide sources of resistanceto stem rust that will be useful in developing improved cul-tivars. These germplasms were designated ORTFRR-T94for the turf-type population and ORTFRR-F94 for the for-age-type.

Seed of ORTFRR-T94 and ORTFRR-F94 will be stored bythe USDA-ARS National Forage Seed Production ResearchCenter and limited quantities of each germplasm madeavailable upon written request. Appropriate recognitionshould be given to the source of this germplasm when itcontributes to development of a new cultivar or is used inscientific studies. Request seed from Reed E. Barker,USDA-ARS National Forage Seed Production ResearchCenter, 3450 SW Campus Way, Corvallis, OR 97331-7102.
ReferencesWelty, R.E., and R.E. Barker. 1993. Reaction of twenty
cultivars of tall fescue to stem rust in controlled andfield conditions. Crop Sd. 33:963-967.
Welty, R.E., and M.E. Mellbye. 19989. Puccinia graminissubsp. graminicola identified on tall fescue in Oregon.Plant Dis. 73 :775.
40
SEED YIELD RESPONSES OF FIVE TALLFESCUE SELECTIONS SUSCEPTIBLE OR
RESISTANT TO STEM RUST
R.E. Welty and MD. Azevedo
Stem rust caused by Puccinia gram mis subsp. gram inicolais a serious disease of tall fescue (Festuca arundinacea)grown for seed in the Willamette Valley of Oregon. Afield study was done at the OSU Botany Farm, to determinethe influence of stem rust on seed yield in selections of tallfescue susceptible or resistant to stem rust, and to deter-mined year-to-year variation in seasonal occurrence ofstem rust.
Materials and MethodsPlant selection. Stem rust susceptible (SRS) and stem rustresistant (SRR) selections from five cultivars of tall fescueused in the study were originally part of a greenhouse/fieldstudy started in 1990 with 1,400 plants from 20 cultivars.One SRS selection came from each of three forage cultivars(Arid, Forager, and Kentucky 31) and two turf-type culti-vars (Rebel II and Shortstop) with a susceptible lesion type
as seedlings in the greenhouse and 100% severity as adultsin the field. Likewise, one SRR selection came from eachof the same cultivars with a resistant lesion type as seed-lings and 0% severity as adults in the field.
Field plots. Paired tillers of each selection were trans-planted side-by-side on 1 m centers into field plots on IOctober 1990. Twelve plots contained 20 plants each (5SRS and 5 SRR selections with two duplicates). Six plotswere treated with Tilt and six plots were not treated andserved as controls. Each year, fungicide treatment of sixplots was selected at random.
Fungicide application. Propiconazole (Tilt® 3.6 BC) wasmixed at 4 fi oz product/acre with water and applied at 30
gal/acre at 40 psi with a spray boom fitted with flat-fannozzles (type 8004). Sprays were applied at dawn on dayswithout wind to provide thorough coverage and continued
at 14-21 day intervals until flowering. Sometimes raindelayed applications beyond 21 days and traces of stemrust developed in fungicide-treated plants of SRS selec-tions. Tilt was applied in 1991, 1992, 1993 and 1994, butnot in 1995.
Disease assessment. Stem rust was assessed by the modi-
fied Cobb scale one or more times during the growing sea-son. Assessments for each selection were made either onthe penultimate leaf, flag leaf, or seed panicle, dependingon the growth stage of the plant at the first appearance ofstem rust. Means were calculated for 10 randomly selectedleaves for each plant. Final stem rust assessments weremade on panicles. In years when stem rust was slow todevelop, assessments were made on panicles not harvested
for seed yield.
70 -
60-
1
Forage-type populations
:oX,Pr
50
403
>30-
C
Turf-type populations
CO C1C2Cycle
Figure 2. Response curves for two cycles of selection forstem rust in tall fescue populations originatingfrom forage-type and turf-type cultivars.Plants were scored for pustule type andresistant reaction was freedom of symptoms intwo inoculations.
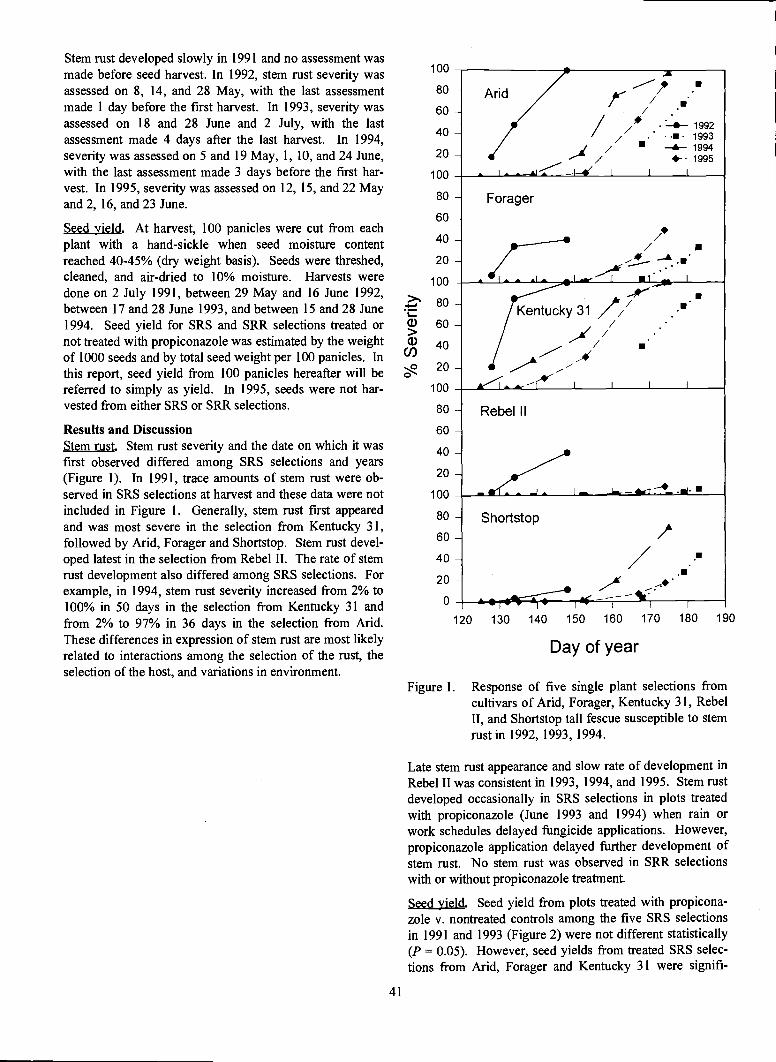
Stem rust developed slowly in 1991 and no assessment wasmade before seed harvest. In 1992, stem rust severity wasassessed on 8, 14, and 28 May, with the last assessmentmade 1 day before the first harvest. In 1993, severity wasassessed on 18 and 28 June and 2 July, with the lastassessment made 4 days after the last harvest. In 1994,severity was assessed on 5 and 19 May, 1, 10, and 24 June,with the last assessment made 3 days before the first har-vest. In 1995, severity was assessed on 12, 15, and 22 Mayand 2, 16, and 23 June.
Seed yield. At harvest, 100 panicles were cut from eachplant with a hand-sickle when seed moisture contentreached 40-45% (dry weight basis). Seeds were threshed,cleaned, and air-dried to 10% moisture. Harvests weredone on 2 July 1991, between 29 May and 16 June 1992,between 17 and 28 June 1993, and between 15 and 28 June1994. Seed yield for SRS and SRR selections treated ornot treated with propiconazole was estimated by the weightof 1000 seeds and by total seed weight per 100 panicles. Inthis report, seed yield from 100 panicles hereafter will bereferred to simply as yield. In 1995, seeds were not har-vested from either SRS or SRR selections.
Results and DiscussionStem rust. Stem rust severity and the date on which it wasfirst observed differed among SRS selections and years(Figure 1). In 1991, trace amounts of stem rust were ob-served in SRS selections at harvest and these data were notincluded in Figure 1. Generally, stem rust first appearedand was most severe in the selection from Kentucky 31,followed by Arid, Forager and Shortstop. Stem rust devel-oped latest in the selection from Rebel II. The rate of stemrust development also differed among SRS selections. Forexample, in 1994, stem rust severity increased from 2% to100% in 50 days in the selection from Kentucky 31 andfrom 2% to 97% in 36 days in the selection from Arid.These differences in expression of stem rust are most likelyrelated to interactions among the selection of the rust, theselection of the host, and variations in environment.
41
100
80
60
40
20
100
80
60
40
20
100
80
60
40
20
100
80
60
40
20
100
80
60
40
20
0
.A>//7
r/ /// 1993A 1994/ 4-- 1995- T_1-' I I
Forager
/l,a.___i_ 1_ I
_fr_Kentucky 31
/////
..
I I I
Rebel II
- I - _-4 ...0Shortstop
/A/-U.
-4.-
120 130 140 150 160 170 180 190
Day of year
Figure 1. Response of five single plant selections fromcultivars of Arid, Forager, Kentucky 31, RebelII, and Shortstop tall fescue susceptible to stemrust in 1992,1993, 1994.
Late stem rust appearance and slow rate of development inRebel II was consistent in 1993, 1994, and 1995. Stem rustdeveloped occasionally in SRS selections in plots treatedwith propiconazole (June 1993 and 1994) when rain orwork schedules delayed fungicide applications. However,propiconazole application delayed further development ofstem rust. No stem rust was observed in SRR selectionswith or without propiconazole treatment.
Seed yield. Seed yield from plots treated with propicona-zole v. nontreated controls among the five SRS selectionsin 1991 and 1993 (Figure 2) were not different statistically(P = 0.05). However, seed yields from treated SRS selec-tions from Arid, Forager and Kentucky 31 were signifi-

cantly larger than nontreated controls in 1992 (P = 0.001).In 1994, SRS selections from Arid and Kentucky 31 (P =0.001) and Shortstop (P = 0.01) were significantly largerthan nontreated controls. Propiconazole treatment neverhad an effect on seed weights for the SRS selection fromRebel II. Propiconazole treatment did not improve seedyield of any SRR selection (Figure 3).
c,)
C/)
a)
-c
a)
a)a.)
(I)
120
100
80
60
40
20
12010080604020
120100
80604020
12010080604020
0
A F K RSFigure 2. Seed yield (grams per 100 tillers) of five selec-
tions of tall fescue susceptible to stem rustwithout (check) or with Tilt (126 g a.i., propi-conazole) in 1991-1994. Selections were madefrom five cultivars, A = Arid; F Forager; K =Kentucky 31; R = Rebel II; and S = Shortstop.Yield differences were compared by F-values;P = <0.05 = ns (nonsignificant difference); P005 = *;p 001 = **; andP0.001 =
42
14012010080604020
120100
80604020
12010080604020
12010080604020
0
A F K RSFigure 3. Seed yield (grams per 100 tillers) of five selec-
tions of tall fescue resistant to stem rust without(check) or with Tilt (126 g a.i., propiconazole)in 1991-1994. Selections were made from fivecultivars , A = Arid; F = Forager; K = Ken-tucky 31; R = Rebel II; and S = Shortstop.Yield differences were compared by F-values;P <0.05 = ns (nonsignificant difference).
Comparing 1000 seed weights for SRS selections treated ornot treated with propiconazole showed no significant dif-
ferences in 1991 and 1993, but showed significant differ-ences in 1992 and 1994 (Figure 4). These responses meas-ured by 1000 seed weights were generally similar seedyield among SRS selections (Figure 2). A different re-sponse was found in 1992 for the SRS selection from Rebel
II with or without propiconazole treatment. Seed yieldfrom plots treated or not treated with propiconazole werestatistically similar, whereas 1000 seed weight from propi-conazole-treated plants were significantly larger than
- 1991ns
L
ns - CHECKTILT
- 1992- ns
L
- 1993
-- ns-
ns
ns ns
- 1994
nsns ns
ns ns
1991
-ns\ nns
CHECKTILT
- 1992
- ***
- 1993
-
=n
ns ns
- 1994
=
n
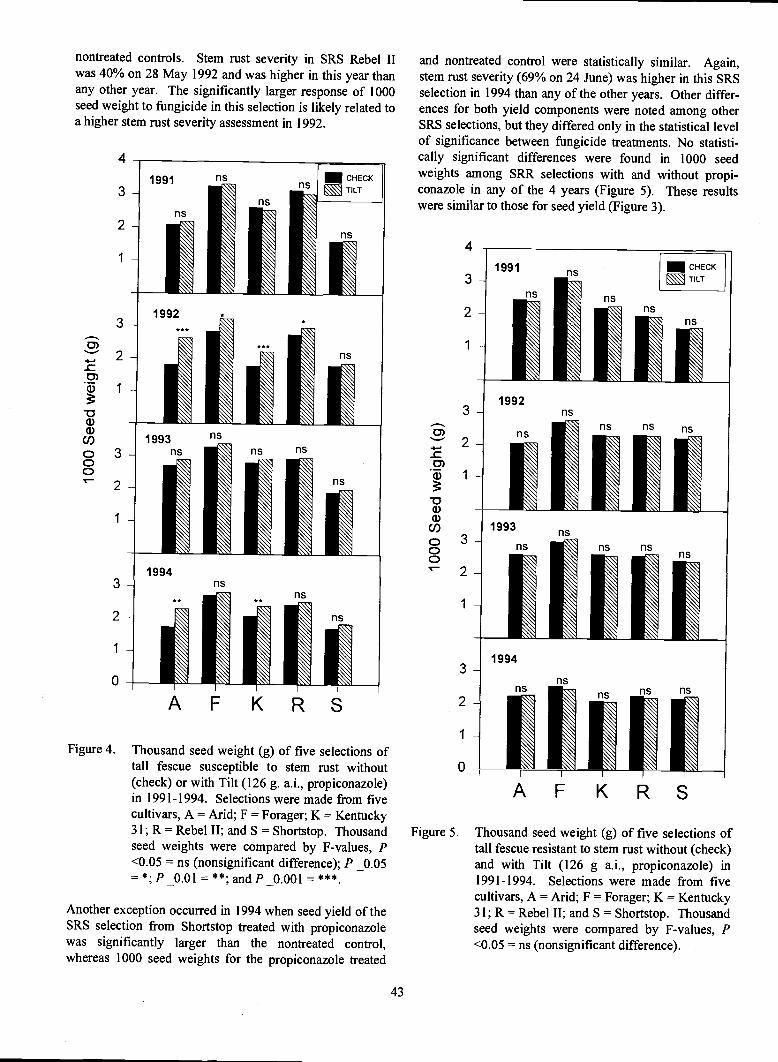
nontreated controls. Stem rust severity in SRS Rebel IIwas 40% on 28 May 1992 and was higher in this year thanany other year. The significantly larger response of 1000seed weight to fungicide in this selection is likely related toa higher stem rust severity assessment in 1992.
1992
1994ns
ns
A F K RSFigure 4. Thousand seed weight (g) of five selections of
tall fescue susceptible to stem rust without(check) or with Tilt (126 g. a.i., propiconazole)in 1991-1994. Selections were made from fivecultivars, A = Arid; F = Forager; K Kentucky31; R = Rebel H; and S = Shortstop. Thousandseed weights were compared by F-values, P<0.05 = ns (nonsignificant difference); P _0.05
*;pO0l =**;andP0.001=***.
Another exception occurred in 1994 when seed yield of theSRS selection from Shortstop treated with propiconazolewas significantly larger than the nontreated control,whereas 1000 seed weights for the propiconazole treated
ns
'is
ns
43
and nontreated control were statistically similar. Again,stem rust severity (69% on 24 June) was higher in this SRSselection in 1994 than any of the other years. Other differ-ences for both yield components were noted among otherSRS selections, but they differed only in the statistical levelof significance between fungicide treatments. No statisti-cally significant differences were found in 1000 seedweights among SRR selections with and without propi-conazole in any of the 4 years (Figure 5). These resultswere similar to those for seed yield (Figure 3).
1992'is
1994
'is
'is
'is'is
CHECK
TILT
ns
'is
A F K RSFigure 5. Thousand seed weight (g) of five selections of
tall fescue resistant to stem rust without (check)and with Tilt (126 g a.i., propiconazole) in1991-1994. Selections were made from fivecultivars, A = Arid; F = Forager; K = Kentucky31; R = Rebel II; and S = Shortstop. Thousandseed weights were compared by F-values, P<0.05 = ns (nonsignificant difference).
4
3- 1991 ns
nsns
nsCHECK
TILT
2-ns
1-
1993 nsns
1991 'is
'is
1993 ns
ns 'is 'is
'is 'is 'is
'is ns
ns 'is 'is 'is

A lack of yield response of the SRS selection from Rebel IIis consistent with a delayed appearance and a slow rate ofdevelopment of stem rust in each of the four years. Thisstudy does not explain why selections from Rebel II thatconsistently scored susceptible to stem rust in both con-trolled greenhouse inoculations and field conditions in1990, 1991, and 1992 did not respond to fungicide controlof stem rust with a seed yield response. Perhaps the lack ofmeasurable differences in seed yield of SRS Rebel II werebecause stem rust was slow to develop and severity waslow.
In 1992 and 1994, stem rust developed by early-May. Seedyield and 1000 seed weights were significantly larger forthree of five SRS selections when treated with propicona-zole compared to the nontreated controls. In 1991 and1993, when stem rust did not develop until mid- to lateJune, seed yield and 1000 seed weight did not differ be-tween treated and control plots for SRS selections. Suchyear-to-year variation in occurrence and development ofstem rust makes timing fungicide applications complicatedand costly, because in some years fungicide treatment pro-vides no benefit.
Seed yield among SRS and SRR selections treated withpropiconizole decreased each year (Figure 2 & 3). Al-
though stem rust reduced seed yield of the SRS selectionsin nontreated controls, seed yield of SRR selections fromnontreated controls also decreased over time. Rankingselections for seed yield from highest to lowest was gen-erally similar each year, Forager>Kentucky 3 1>RebelII>Arid>Shortstop. Reasons for this decreasing seed yieldover time were not examined in this study. However, re-moval of crop residue by close clipping and sweeping orfield burning has been shown to maintain seed yield byeliminating older, non-reproductive tillers. Residue re-moval creates a favorable microenvironment to enhancetillering and floral initiation. Plants in this study wereclose-clipped, but not swept nor burned.
Year-to-year variation in stem rust development empha-sizes the need for developing stem rust resistant cultivars toreduce dependency on fungicides for disease control andstabilize production of tall fescue seed. Important ques-tions remain concerning how the host, pathogen, environ-ment, and time interact to alter disease development andinfluence seed yield losses. Such information would beuseful in developing models to predict stem rust occurrenceand development.
44
POTENTIAL DENITRIFICATION LOSSESIN PERENNIAL RYEGRASS SEED
PRODUCTION
W.R. Horwath, L.F. Elliott, S.M GrfJIth,J.1 Steiner and P.1 Wigington
A cultivated first-year perennial ryegrass field and a natural
grass riparian area, located on Dayton and Amity soils inthe Willamette Valley, OR, were sampled to determinedenitrification potentials.
This study is part of a larger study that examines hydro-logical flow processes, fate of nutrients, and pesticide proc-essing in riparian areas bordering grass seed fields. Soilfrom each area was sampled bi-weekly from March 3 toJune 6, 1995. These samples were used to measure deni-trification potential, nitrate, nitrite, ammonium, total or-ganic carbon, soluble carbon, and microbial biomass.
Soil nitrate and nitrite levels were low in the grass seedfield and natural grass riparian area, while ammonium lev-els were high. Grass seed field soil nitrate-N levels aver-aged less than 1 ppm, while the natural grass riparian areasoil nitrate-N levels were well below field values. It is un-known at this time the contribution of fertilizer-N from the
field to the grass riparian area. Denitrification in the grassseed production field was 0.24 lb N per acre per day for the
top six inches of soil. In contrast, denitrification in theunfertilized natural grass riparian area averaged 0.02 lb Nper acre per day. Denitrification potential was positivelycorrelated to soil NH4-N level in the grass seed field.
Grass seed field denitrification rates were associated, in
time, with spring N fertilizer application. Microbial
biomass was higher in the soil of the naturally vegetated
area while soluble carbon was higher in the grass seedproduction soils. These results indicate adequate
microorganisms and carbon source are available for
denitrification to proceed.
In summary, these denitrification data indicated that in thepoorly drained soils of grass seed fields there was the po-tential for N loss from fertilization of up to 24 lb N per acreduring a 100-day period. It is hypothesized that the priming
affect from N fertilization induced the observed high deni-
trification rates in the grass seed field. In contrast, the low
denitrification rate in the unfertilized natural grass riparian
area was probably associated with consumption of nitrate
by plants and soil microorganisms.

EFFECTS OF POST-HARVEST RESIDUEMANAGEMENT ON KENTUCKY
BLUEGRASS SEED YIELD IN CENTRALOREGON
F.J. Crowe, D.D. Coats, NA. Farris, MK. Durette,C.L. Yang and MD. Butler
The intermountain region of Idaho, Washington and Ore-gon provides a stable supply of high quality Kentuckybluegrass (Poa pratensis L.) seed. Early in the develop-ment of Kentucky bluegrass (KBG) seed production sys-tems, growers became aware of the importance of post-harvest residue removal. Open field burning (OFB) wasadopted as the standard practice for post-harvest residueremoval, primarily for suppression or elimination of dis-eases. In addition to disease control, however, post-harvestOFB has been responsible for maintenance of high yieldand high quality seed production of KBG in the PacificNorthwest. Previous studies strongly suggested that re-moval of straw residue increases seed yields in KGB. Be-cause of increased concern for the effects of burning on airquality, alternative ways of removing post-harvest debrisare still being sought.
The primary focus for this study was to evaluate the mostadvanced technology in post-harvest residue equipment.As a result, we needed to identify to what extent residueremoval was desired. The most common practice of openfield burning (OFB) leaves the field absent of any non-combustible debris and also eliminates debris around thecrown of the plant. This cleansing of the soil surface al-lows maximum light penetration as well as allowing maxi-mum efficiency for pesticide applications. Mechanicalresidue removal can be accomplished by using variousmethods. Each method varies in the amount and efficiencyof soil cleansing. New equipment used in this study in-cluded a needle-nose wheel rake (NNR), which has stifftines to scratch the residue and thatch and remove debrisfrom around the crowns; and a redesigned close-clippingand vacuuming machine (CC) both developed by Rear'sManufacturing in Eugene, Oregon. The Grass Vac machineenabled us to clip and vacuum remove the stubble to a 1inch height. With NNR, the bulk of the residue is wind-rowed, which is baled or otherwise disposed. Otherequipment tested included a conventional flail mower (FC),a mulching flail (FM) and a propane flamer (PF). Propaneflaming was tested because it produced relatively littlesmoke after vacuum sweep or wheel rake treatments. TheNNR was introduced into the study in 1994, and FM wasonly introduced into the study in 1995.
Commercial grass seed fields in central Oregon normallyhave a large portion of the crop residue removed as baledstraw, followed by OFB of stubble, propane burning orboth. Thus, a standard "field treatment" consisted of balingfollowed by OFB (and followed by PF if necessary). This
45
standard treatment was compared with several alternativemethods of stubble management as listed in Tables 1 and 2.
With new technology in available equipment, the objec-tives of this study were to: 1) demonstrate different me-chanical residue management practices; 2) determine theeffect of mechanical residue management treatments oncrop growth and development of KBG; and 3) compare themechanical treatments to OFB for their effects on seedyield and seed quality. The overall project in central Ore-gon included replicated field trials on commercial farms,and replicated field trials in successive years at the CentralOregon Agricultural Research Center (COARC).
Two paired on-farm sites were established (on separate butnearby farms) in 1991 in central Oregon to evaluate the fullcompliment of the latest technology for mechanical post-harvest residue removal on KBG seed production. Onefield was planted with an aggressive variety (highly rhi-zomatous) and the other field with a non-aggressive variety(less rhizomatous). Similarly, two more paired fields wereadded in 1992 and in 1993 (for a total of six fields) for acomparison over time. Beginning in 1994 the oldest twofields from each year of planting were deleted. Thus, thelast harvest, on two fields, will be in 1996. This reportincludes harvest data through 1995. Dates for harvest andtreatments are not shown here, but were conducted within aday or so of the comparable commercial activity. Experi-mental design on all fields was a randomized block designwith three or four replications. The treatment plot size was100 x 22 ft.
Data were collected for vegetative tiller development, fer-tile tiller development, seed yield, and seed quality. Allother management practices such as fertilizing, irrigating,and pest control were done as the normal grower practicesfor the individual fields. Harvest was completed with theuse of conventional equipment and sub-samples were col-lected to obtain a percent clean out. Clean seed yield,1,000 seed weight and percent germination weredetermined.
in addition to the on-farm studies above, replicated fieldtrials were established at the Madras field of the COARC,in an attempt to investigate residue management undermore conditions and in a more statistically-sound experi-mental design than can be accomplished among diversegrowers' fields. Two varieties (aggressive and non-aggres-sive) were planted side by side as split plots in three sepa-rate plantings in 1992, 1993 and 1994. Treatments listed inTable 2 were applied within three randomized blockswithin each variety, with plots sized similar to on-farmtrials. In this successive year planting project, post-harvestresidue treatments were applied each year to observe theresidue treatment effect on the age of stand. There were atotal of three successive plantings, each a year apart and thedata were (or will be) collected for two years after the lastplanting. Both seed yield and seed quality will be observedthroughout this project. Harvesting was done with a 5 foot

plot swather followed by a Wintersteiger plot combine.The samples were rethrashed and clean on a M2B Clippercleaner.
Plantings in the successive year planting trial were onAugust 20, 1992, August 23, 1993, and August 23, 1994, atthe research center in Madras. Varieties include Abbey(non-aggressive type) and Bristol (aggressive type). Thetreatments were completed following baling the combinerun windrows. Residue management treatments werecompleted between August 12-20 for each of 1993, 1994and 1995.
On-Farm results: Significant differences in seed yield re-sulted from the various management treatments. The high-est yields consistently were produced where the residuewas removed completely either by mechanical means or byburning. Bale-only treatment resulted in the least seedyield as well as the lowest number of fertile tillers. Table 1shows clean seed yields (lbs/acre) for 1992 through 1995.When averaged over all test sites, seed yield and fertiletiller numbers were highest with the open-field burningtreatment. In comparison, for plots in which residue wasremoved by vacuum-sweep followed by propaning, vac-uum-sweep alone, flail-only and bale-only, mean seedyields were 85, 85, 79, and 67%, respectively, per twofields in 1992; were 94, 90, 90, and 83%, respectively, perfour fields in 1993; were 94, 86, 80, and 75%, respectftilly,per six fields in 1994, and were 80, 98, 97, and 87, respec-tively, for four fields in 1995. Needle-nose wheel raketreatments used on some fields in 1993, 1994, and 1995resulted in mean seed yields within the range of other me-chanical means of residue removal. (The mulching flailwas not used in on-farm trials.) In general, seed yieldsdeclined with age of stand. Fertile tiller numbers followedthe same trend as seed yields. Thousand seed weight andseed germination percentages were comparable among alltreatments for each field (P 0.05), and were unaffected byresidue management.
The overall yield averages summarized above mask differ-ences observed among varieties and years with respect toresidue treatments. For second year harvest in 1992, theaggressive variety showed a significant need for a morecomplete residue removal, the non-aggressive variety alittle less so. Differences were inconsistent for the secondharvest years 1993 and 1994 for the non-aggressive varie-ties (although some residue removal was required as indi-cated by the low yields for the bale-only treatment) andwere absent for the aggressive varieties. For the third har-vest years, greater residue removal was favored in 1993and 1994 on both aggressive and non-aggressive varieties,but B/OFB was not superior to some other treatments. Forthe third harvest year in 1995, B/OFB may have suppressedyields in the aggressive variety, although non-significantly,and statistically, there were no significant differencesamong any treatments for either aggressive or non-aggres-sive varieties. For the fourth harvest years, there was a
46
strong trend for greater residue removal for both aggressiveand non-aggressive varieties.
The general trend of fertile tiller numbers was the same asseed yield. Fall and spring vegetative tiller numbersshowed no differences among treatments, with the excep-tion that in the bale-only treatment there were fewer tillers(data not shown). Seed quality was determined by observ-ing germination percentage and by measuring 1,000 seedweight. Seed quality was not affected by different residuemanagement treatments (data not shown).
Experiment station results: Averaged over the two varietytypes, the highest yields were obtained by open field burn-ing followed by the mechanical removal methods (Table2). Second year data for 1994 showed unusually low yieldsfor the aggressive variety compared with the non-aggres-sive variety. Such low yields may have masked sometreatment differences from appearing for the aggressivevariety. Yields for the aggressive variety were greatest forthe vacuum sweep plus propane treatment, and lowest forthe bale-only treatment. Yields for the non-aggressive va-riety was greatest for open field burning. The other treat-ments were intermediate and fairly consistent with eachother. No significant differences were found for mean seedyields for second year harvest data for 1995, for either thenon-aggressive or aggressive variety. For the non-aggres-sive variety, yield was highest for the open field burningtreatment, and lowest for bale-only. For the aggressivevariety, yields were highest for the conventional flail andneedle-nose rake. Third year harvest data for 1995 show ayield depression for the bale-only treatment, but othertreatments yielding comparably, for both the non-aggres-sive and aggressive variety. The mulching flail followedby the needle-nose rake treatment yielded slightly betterthan other treatments in 1995. Statistical interaction effectshave not yet been analyzed for (1) different ages of standwithin years, and (2) the same age of stand across years.At this stage of the project, the field trial at the COARCdoes not show as many yield differences as the on-farmtrials. This situation may change when fourth year databegin to appear in 1996.
In general, mechanical removal performed much better inour studies compared to bale-only treatment. Compared toOFB, removal of residue with vacuum-sweep or vacuum-sweep followed by propane flaming frequently were asgood or better, but were not as reliable as OFB. It is likelythat mechanical means of straw removal will elevate thecost of production over the cost of open-field burning, bothby requiring additional equipment purchase and usage andby depressing yield. For non-aggressive varieties, thesemechanical means of residue removal may prove adequateto maintain yields for the second and third harvest years,but not the fourth harvest year. For aggressive varieties,OFB proved to be more consistent than other means ofresidue removal, but not consistently so. Nevertheless, inmost years, OFB proved to be better than mechanical

means of residue removal, even for the second harvest the first year of use as a cheaper more efficient mechanicalyear. The rake plus propane treatment showed promise in stubble removal technique.
Table 1. Cleaned-seed yields of non-aggressive (Abbey and Merit) and aggressive (Bristol and Rugby) Kentucky blue-grass cultivars under residue-management treatments from on-farm trials in Central Oregon, 1992-1995.
Non-aggressive Aggressive Non-aggressive Aggressive Non-aggressive Aggressive(Abbey) (Bristol) (Merit) (Rugby) (Abbey) (Bristol)
(lbs/acre)
Second harvest year 1992 1993 1994
B/OFB 1996 a 1262 a 1671 a 1066 a 943 a 824 aB/CC/PF 1842 ab 983 b 1619 abc 962 a 919 ab 857 aB/CC 2010 a 863 b 1684 ab 987 a 1078 a 836 aB/FC 1676 b 915 b 1475 c 988 a 823 ab 839 aBIFCINNR * 829 b 1529 abc 992 a 1003 a 958 aB/FC/NNRJPF * * 1768 a * * *B/NNRJPF * * * * 851 b 802 aB/NNR * * * * * *
B 1752 b 570 c 1573 bc 912 a 890 ab 842 a
Third harvest year 1993 1994 1995
B/OFB 1170 a 978 a 1257 a 958 a 771 a 351 aB/CC/PF 1009 ab 1003 a 1059 ab 922 a 647 a 536 aB/CC 931 ab 860 ab 927 bcd 856 ab 625 a 580 aB/FC 983 ab 919 ab 887 cd 699 ab 501 a 441 aBIFC/NNR 1064 ab 848 ab 880 cd 843 ab * *
B/FC/NNRJPF * * * * * *
B/NNRJPF * * 1015 bc * 569 a 466 aB/NNR * * * * 583a 564aB 815 b 798 b 806 d 621 b * *
Fourth year harvest 1994 1995 1996
B/OFB 1133 a 831 a 809 a 763 abB/CC/PF 1021 ab 783 a 621 ab 802 aB/CC 911 bc 604 b 609 ab 670 abcB/FC 721 d 593 b 665 ab 856 abcB/FC/NNR 814 cd 578 b 656 ab 563 bc
B/FC/NNR/PF * * * *
B/NNRJPF * * * *
B/NNR * * * *
B/FC/PF * * 619 ab *
B 793 cd 403 c 527 b 524 c
Each field independently analyzed. Means followed by the same letter were not statistically separable, P0.05.Abbreviations: OFB = Open field bum; B = Bale; CC = crewcut (vacuum); PF = propane flame;FC = flail - conventional; NNR = needle-nose rake.
*treatment not included in this trial
47
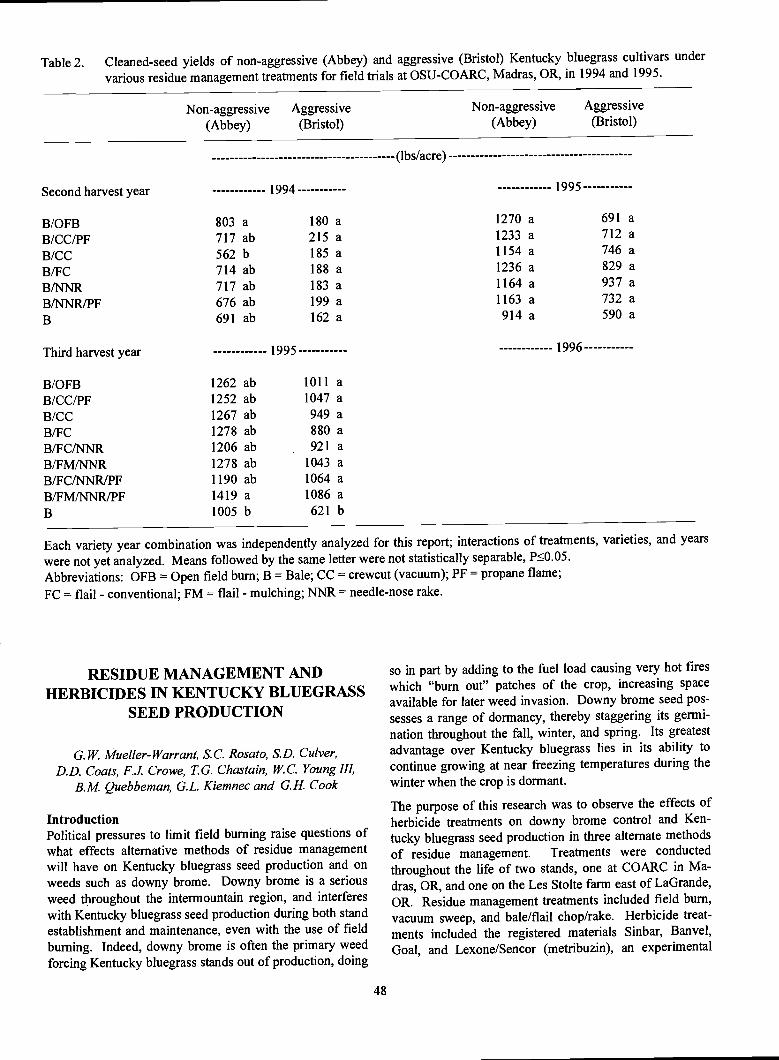
Table 2. Cleaned-seed yields of non-aggressive (Abbey) and aggressive (Bristol) Kentucky bluegrass cultivars undervarious residue management treatments for field trials at OSU-COARC, Madras, OR, in 1994 and 1995.
Non-aggressive Aggressive(Abbey) (Bristol)
Each variety year combination was independently analyzed for this report; interactions of treatments, varieties, and years
were not yet analyzed. Means followed by the same letter were notstatistically separable, P0.05.
Abbreviations: OFB = Open field bum; B = Bale; CC crewcut (vacuum); PF = propane flame;
FC = flail - conventional; FM = flail - mulching; NNR = needle-nose rake.
RESIDUE MANAGEMENT ANDHERBICIDES IN KENTUCKY BLUEGRASS
SEED PRODUCTION
G. W. Mueller-Warrant, S.C. Rosato, S.D. Culver,D.D. Coats, F.J. Crowe, TG. Chastain, W.C. Young III,
B.M Quebbeman, G.L. Kiemnec and G.H. Cook
IntroductionPolitical pressures to limit field burning raise questions ofwhat effects alternative methods of residue managementwill have on Kentucky bluegrass seed production and onweeds such as downy brome. Downy brome is a seriousweed throughout the intermountain region, and interfereswith Kentucky bluegrass seed production during both standestablishment and maintenance, even with the use of fieldburning. Indeed, downy brome is often the primary weedforcing Kentucky bluegrass stands out of production, doing
48
(lbs/acre)
Second harvest year 1994 1995
Non-aggressive(Abbey)
Aggressive(Bristol)
so in part by adding to the fuel load causing very hot fireswhich "bum out" patches of the crop, increasing spaceavailable for later weed invasion. Downy brome seed pos-sesses a range of dormancy, thereby staggering its germi-nation throughout the fall, winter, and spring. Its greatestadvantage over Kentucky bluegrass lies in its ability tocontinue growing at near freezing temperatures during the
winter when the crop is dormant.
The purpose of this research was to observe the effects ofherbicide treatments on downy brome control and Ken-tucky bluegrass seed production in three alternate methods
of residue management. Treatments were conductedthroughout the life of two stands, one at COARC in Ma-dras, OR, and one on the Les Stolte farm east of LaGrande,OR. Residue management treatments included field bum,
vacuum sweep, and bale/flail chop/rake. Herbicide treat-ments included the registered materials Sinbar, Banvel,
Goal, and Lexone/Sencor (metribuzin), an experimental
B/OFB 803 a 180 a 1270 a 691 a
B/CCfPF 717 ab 215 a 1233 a 712 a
B/CC 562 b 185 a 1154 a 746 a
BIFC 714 ab 188 a 1236 a 829 a
B/NNR 717 ab 183 a 1164 a 937 a
BINNR/PF 676 ab 199 a 1163 a 732 a
B 691 ab 162 a 914 a 590 a
Third harvest year 1995 1996
B/OFB 1262 ab 1011 aB/CC/PF 1252 ab 1047 aB/CC 1267 ab 949 aB/FC 1278 ab 880 aB/FCINNR 1206 ab 921 aB/FM!NNR 1278 ab 1043 aB/FC/NNRJPF 1190 ab 1064 aB/FMINNRIPF 1419 a 1086 aB 1005 b 621 b

herbicide, Beacon, and a biological weed control agent,Pseudomonasfiuorescens strain D7.
Materials and MethodsBoth stands were planted in 1992, received no grass controltreatments while establishing, and produced their first seedcrops in 1993. Residue management treatments were im-posed after each harvest from 1993 through 1995 to thesame mainplots, which were 60 ft. by 135 ft. in size. Vac-uum sweep plots were baled and then cut to a 0.75-inchstubble height with a Rear's "Grasshopper," sucking seed,straw, and dirt off the ground. Bale/flail chop/rake plotswere baled, flail chopped to a 1.5-inch stubble height, andthen raked with a Rear's "Needle-nose" rake. Straw wasspread uniformly and then burned in the field burn plots.Herbicides were applied at 26 GPA through a Rear's plotsprayer equipped with an MT-3000 controller pulled be-hind a Yamaha 4-wheeler to subplots 9 ft. wide by 60 ft.long. Subplots were aligned in the direction of planting atMadras, and at right angles to it at LaGrande. The same 15herbicide treatments were applied in all three residue man-agement mainplots, and four replications were used. Someof the herbicide treatments varied between sites due to dif-ferent weed emergence patterns, weather conditions, andavailability of supplies. Application timing was changedsomewhat between years, dropping the less effective springapplication to focus on applications in the fall. R- 11 at0.25% was added to all treatments containing Beacon, in-cluding Sinbar plus Beacon tank-mixes, while no surfac-tants were used with any other treatment. Herbicide treat-ments common to both years were applied to the same plotlocations to follow the buildup of downy brome popula-tions over time. Plots were trimmed before harvest to 55 ft.long at Madras and 40 ft. at LaGrande. Swath width was 5ft., taken from the center of the 9 ft. wide plots.
Downy brome plants were counted in the central 324 ft2 ofeach plot in both years at LaGrande and the first year atMadras, and in 260 ft2 areas the second year at Madras.Plots were swathed between midnight and 10 AM tominimize seed shatter, combined with a Wintersteiger plotcombine when dry, and stored in polypropylene bags untilseed cleaning. Seed was rethreshed just before finalcleaning. Air screen cleaners were adjusted to producenearly pure, separate samples of Kentucky bluegrass anddowny brome seed from each plot. Data were analyzed assplit plot RCBs, and means were separated at the 5% levelof significance. Downy brome density was log trans-formed for analysis of variance and means separation dueto the wide range in values (>100 fold) between treatments.Raw, untransformed values are presented in the tables, al-though the means were separated based on log transforma-tion analysis. The same means separation would apply fordowny brome control as for downy brome density.
49
Results and DiscussionDowny brome density in the untreated checks was low thefirst year at LaGrande (0.053 plants per ft2), moderate thefirst year at Madras and the second year at LaGrande(0.847 and 0.477 plants per ft2), and high the second year atMadras (4.096 plants per ft2). Sinbar applied in Septemberat 0.75 lbs ai/acre provided good control of downy brome(from 89 to 97%), but caused significant visual crop injury,especially the second year at Madras. Control from 2.0lbs/acre Banvel was erratic, reaching 87% the first year atMadras but none at LaGrande in either year. Sequentialapplication of Sinbar early followed by Banvel in mid tolate fall improved control slightly at Madras, but not atLaGrande. Addition of 0.25 lbs/acre Goal to Banvel im-proved control only once, the first year at LaGrande. Earlypostemergence application of 0.75 lbs/acre Goal plus 0.5lbs/acre Sinbar reduced crop injury compared to earlierapplication of the full rate of Sinbar, but also reduceddowny brome control at Madras. Application of 0.25lbs/acre Goal plus 0.38 lbs/acre metribuzin gave moder-ately good control (82 to 89%) in three cases, but failed thesecond year at Madras, when the application was delayeduntil Dec. 21 by continuing high winds during several ear-lier attempts to apply treatments.
Beacon applied in the fall provided moderately good con-trol of downy brome with little crop injury. Split applica-tion of Beacon (0.018 lbs/acre at both early postemergenceand mid-postemergence) improved control at both sites inthe second year compared to the full rate applied only atmid-postemergence. Application of Beacon in the springwas ineffective on downy brome, and was discontinuedafter one year. Excellent control of downy brome wasachieved by combinations of Sinbar plus Beacon, evenexceeding that achieved by early Sinbar in several cases.However, combinations of Sinbar plus Beacon interactedrather strangely in crop tolerance. At LaGrande in the firstyear, all tank-mixes or sequential applications of Sinbarand Beacon caused considerably greater crop injury thanSinbar alone. Little injury occurred at Madras the first yearfrom any treatments. In the second year at LaGrande, un-like the first year, tank-mixes or sequential applications ofSinbar plus Beacon caused no more crop injury than earlySinbar by itself. In the second year at Madras, some com-binations increased injury while others decreased it. Great-est injury occurred when Sinbar applied in October wasfollowed by Beacon in December, whereas tank-mixes ofSinbar plus Beacon reduced injury compared to Sinbaralone or to Sinbar followed by Beacon. A possible expla-nation for the safening effect of the tank-mixes might bethat the temporary injury caused by Beacon slowed downcrop growth and transpiration, thereby reducing the uptakeof Sinbar during the fall. Most of the injury symptomsseen were consistent with those from Sinbar.
Response of crop seed yield to herbicides is a mixture ofdirect effects (i.e., injury to the crop) and indirect effects(e.g., changes in competition as weeds are weakened orkilled by the herbicide). As downy brome populations in-crease, more of the treatments can be expected to outyieldthe untreated checks, because the benefits from controllingthe weed will outweigh the injury from the chemicals.Over the two years, only 33% of the treatments at La-Grande, the less weedy site, yielded numerically more thanthe untreated check, while 70% of them did so at Madras.Similarly, when combined over the two sites, the numberof treatments numerically outyielding the checks increasedfrom 43% in 1993-94 to 62% in 1994-95. The full rate ofSinbar applied early reduced Kentucky bluegrass seed yieldcompared to the untreated check at Madras the first year,but not at LaGrande in either year. In the second year atMadras, Sinbar yield was virtually identical to the untreatedcheck, which yielded 260 lbs/acre less seed than the aver-age of the five highest yielding treatments, a reduction of28%. Sequential application of Banvel following Sinbarreduced yields further at Madras, but not at LaGrande.Sequential application of Beacon following Sinbar reducedyield in all cases. Tank-mixing 0.0 18 lbs/acre Beacon plus0.75 lbs/acre Sinbar on Oct. 17 followed by 0.0 18 lbs/acreBeacon on Dec. 21 increased yield by 462 lbs/acre oversequential full-rate Sinbar followed by full-rate Beacon atMadras in the 1994-95 growing season. Split applicationof half-rates of Sinbar plus Beacon (0.38+0.0 18 followedby 0.38+0.018 lbs/acre) performed very well both years atMadras, controlling 98-99% of the downy brome, and in-creasing Kentucky bluegrass seed yield compared to theuntreated check in the second year. While this treatmentalso controlled downy brome well at LaGrande, it did de-press seed yield there. The LaGrande site was less wellfertilized and watered than the Madras site, producing ashorter crop with less total dry matter. It appeared that ashortage of water and nutrients limited the ability of Ken-tucky bluegrass at LaGrande to respond favorably to theremoval of downy brome competition, and so the cropfailed to overcome the stunting caused by herbicides.Treatments containing Beacon but not Sinbar were amongthe highest yielding at Madras in both years and at La-Grande in the first year. While the yield depression fromBeacon the second year at LaGrande might be a varietaleffect, it is more likely due to a shortage of nitrogen andwater needed to overcome the slight stunting that Beaconoften causes Kentucky bluegrass. Only one application ofPseudomonas fluorescens strain D7 caused any obvioussymptoms on downy brome, the Feb. 7, 1995, applicationwhich reduced downy brome stands by 32 to 48% andshortened the weeds by 2 inches in the spring. However,downy brome populations were still high enough to com-pete severely with the crop, and none of the D7 treatmentsincreased Kentucky bluegrass seed yield significantly.
50
Residue management had no significant effects at eithersite on downy brome control in the first year or on Ken-tucky bluegrass seed production in either year. In the sec-ond year, downy brome control at Madras was better invacuum sweep than bale/flail/rake or field burn, while
control at LaGrande was better in field burn thanbale/flail/rake, with vacuum sweep being intermediate.
Downy brome populations are increasing in both tests, andseeds scattered from neighboring plots will pose increas-ingly severe tests of the ability of all treatments to controlthis weed. Because of stand loss and yield reductions from0.75 lbs/acre Sinbar, possibly due to accumulation of Sin-bar in the soil, the maximum total rate of Sinbar applied peryear was reduced by 20% in the 1995-96 growing season atboth sites. This study will terminate with the 1996 harvestat LaGrande, but will continue until at least 1997 atMadras.
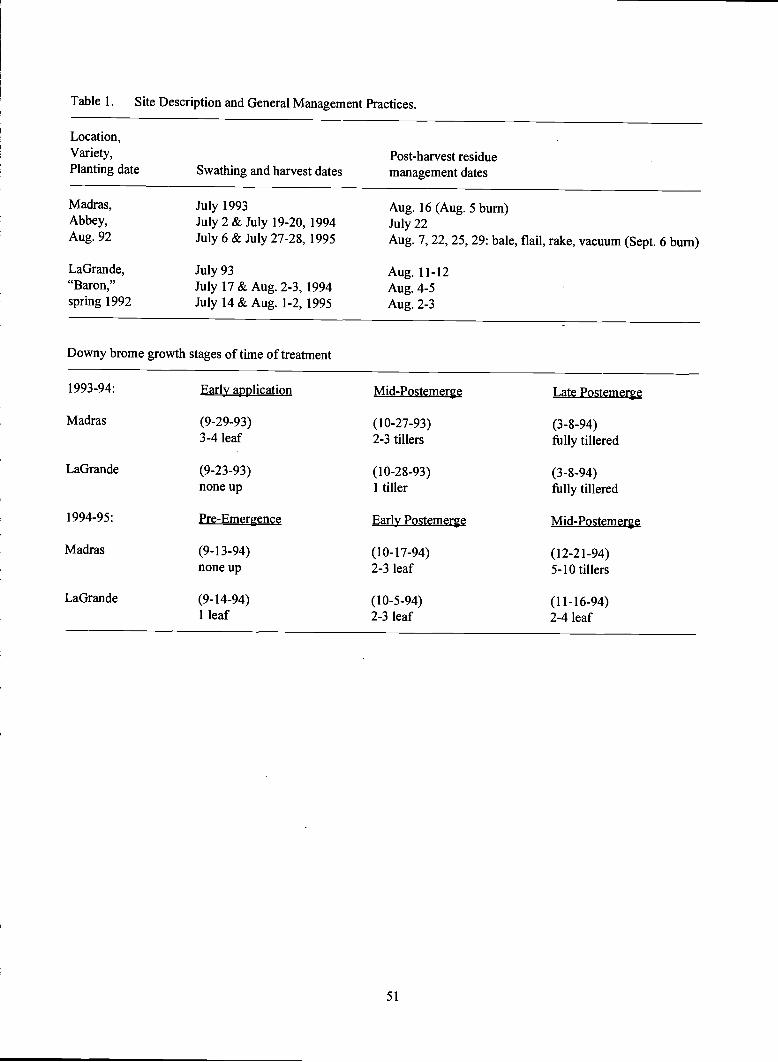
Table 1. Site Description and General Management Practices.
Location,Variety, Post-harvest residuePlanting date Swathing and harvest dates management dates
Madras, July 1993 Aug. 16 (Aug. 5 burn)Abbey, July 2 & July 19-20, 1994 July22Aug. 92 July 6 & July 27-28, 1995 Aug. 7, 22, 25, 29: bale, flail, rake, vacuum (Sept. 6 burn)
LaGrande, July 93 Aug. 11-12"Baron," July 17 & Aug. 2-3, 1994 Aug. 4-5spring 1992 July 14 & Aug. 1-2, 1995 Aug. 2-3
Downy brome growth stages of time of treatment
51
1993-94: Early application Mid-Postemerge Late Postemerge
Madras (9-29-93) (10-27-93) (3-8-94)3-4 leaf 2-3 tillers frilly tillered
LaGrande (9-23-93) (10-28-93) (3-8-94)none up 1 tiller fully tillered
1994-95: Pre-Emergence Early Postemerge Mid-Postemerge
Madras (9-13-94) (10-17-94) (12-21-94)none up 2-3 leaf 5-10 tillers
LaGrande (9-14-94) (10-5-94) (11-16-94)1 leaf 2-3 leaf 2-4 leaf
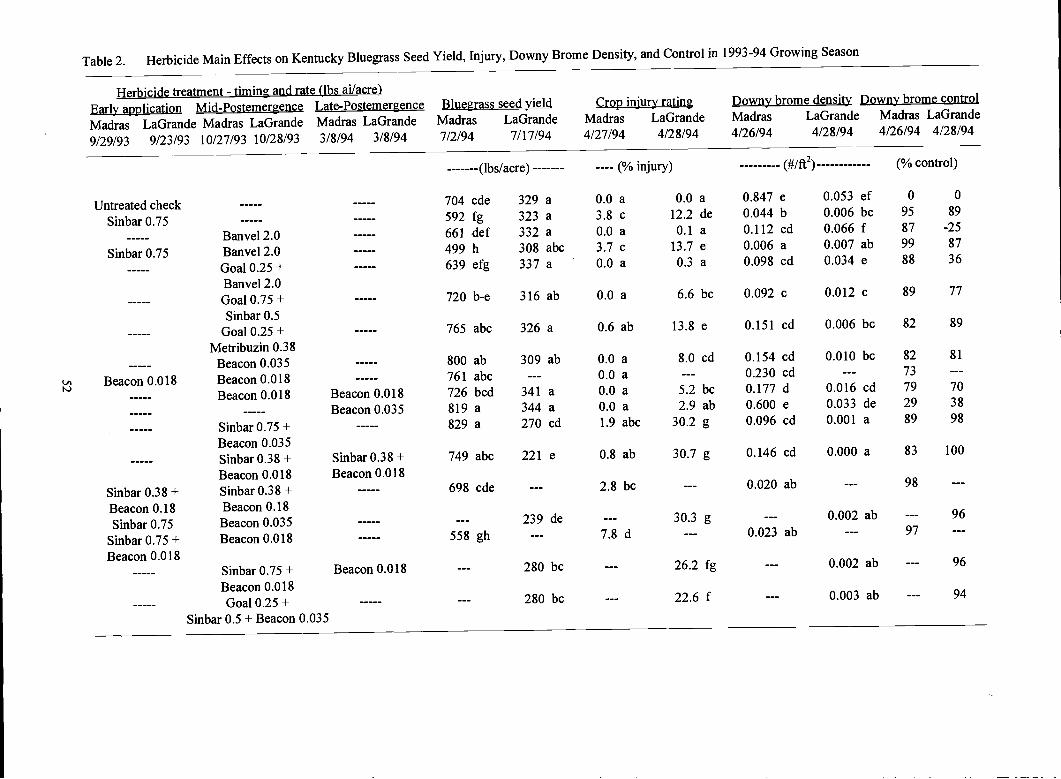
Table 2. Herbicide Main Effects on Kentucky Bluegrass Seed Yield, Injury, Downy Brome Density, and Control in 1993-94 Growing Season
Herbicide treatment - timing and rate (lbs ailacre)Early application Mid-Postemergence Late-PostemerenceMadras LaGrande Madras LaGrande Madras LaGrande
9/29/93 9/23/93 10/27/93 10/28/93 3/8/94 3/8/94
Untreated checkSinbar 0.75
Sinbar 0.75
Beacon 0.0 18
Sinbar 0.38 +Beacon 0.18Sinbar 0.75
Sinbar 0.75 +Beacon 0.0 18
Banvel 2.0Banvel 2.0Goal 0.25 +Banvel 2.0Goal 0.75 +SinbarO.5
Goal 0.25 +Metribuzin 0.38
Beacon 0.03 5Beacon 0.018Beacon 0.018
Sinbar 0.75 +Beacon 0.03 5Sinbar 0.38 +Beacon 0.0 18Smbar 0.38 +Beacon 0.18Beacon 0.035Beacon 0.0 18
Beacon 0.018Beacon 0.035
Sinbar 0.38 +Beacon 0.0 18
Sinbar 0.75 + Beacon 0.0 18
Beacon 0.018Goal 0.25 +
Sinbar 0.5 + Beacon 0.035
Bluegrass seed yieldMadras LaGrande7/2/94 7/17/94
704 cde 329 a 0.0 a 0.0 a592 fg 323 a 3.8 c 12.2 de661 def 332 a 0.0 a 0.1 a499 h 308 abc 3.7 c 13.7 e639 efg 337 a 0.0 a 0.3 a
720 b-e 316 ab 0.0 a 6.6 bc
765 abc 326 a 0.6 ab 13.8 e 0.151 cd 0.006 bc 82 89
800 ab 309 ab 0.0 a 8.0 cd761 abc 0.0 a726 bcd 341 a 0.0 a 5.2 bc819 a 344 a 0.0 a 2.9 ab829 a 270 cd 1.9 abc 30.2 g
749 abc 221 e 0.8 ab 30.7 g 0.146 cd 0.000 a 83 100
698 cde 2.8 bc
239 de 30.3 g558 gh 7.8 d
280 bc 26.2 fg
280 bc 22.6 f
Crop injury ratingMadras LaGrande4/27/94 4/28/94
Downy brome density Downy brome controlMadras LaGrande Madras LaGrande4/26/94 4/28/94 4/26/94 4/28/94
0.847 e 0.053 ef 0 0
0.044 b 0.006 bc 95 89
0.112 cd 0.066 f 87 -25
0.006 a 0.007 ab 99 87
0.098 cd 0.034 e 88 36
0.092 c 0.012 c 89 77
0.154 cd 0.010 bc 82 81
0.230 cd 73
0.177 d 0.016 cd 79 70
0.600 e 0.033 de 29 38
0.096 cd 0.001 a 89 98
0.002 ab 96
0.023 ab 97
0.002 ab 96
0.003 ab 94
(lbs/acre) (% injury) (#/ft2) (% control)
0.020 ab 98
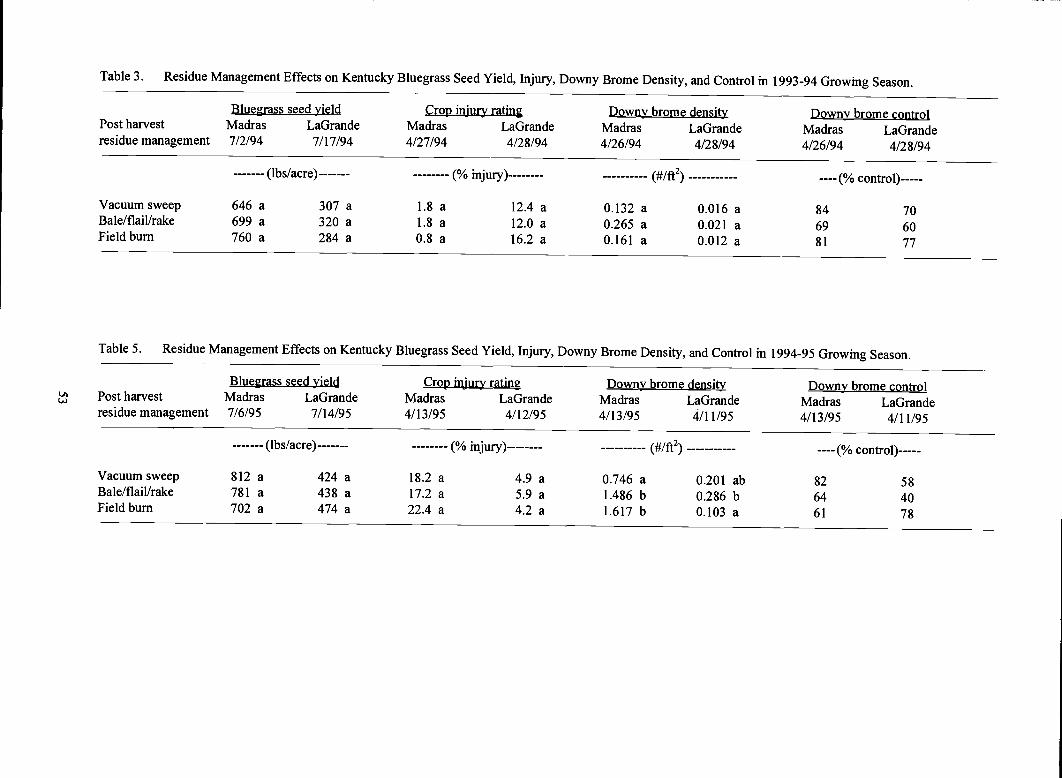
Table 3. Residue Management Effects on Kentucky Bluegrass Seed Yield, Injury, Downy Brome Density, and Control in 1993-94 Growing Season.
Bluegrass seed yield Crop injury rating Downy brome density Downy brome controlPost harvest Madras LaGrande Madras LaGrande Madras LaGrande Madras LaGranderesidue management 7/2/94 7/17/94 4/27/94 4/28/94 4/26/94 4/28/94 4/26/94 4/28/94
(lbs/acre) (% injury) (#/ft2) ---- (% control)
Vacuum sweep 646 a 307 a 1.8 a 12.4 a 0.132 a 0.016 a 84 70Bale/flaillrake 699 a 320 a 1.8 a 12.0 a 0.265 a 0.021 a 69 60Fieldburn 760 a 284 a 0.8 a 16.2 a 0.161 a 0.012 a 81 77
Table 5. Residue Management Effects on Kentucky Bluegrass Seed Yield, Injury, Downy Brome Density, and Control in 1994-95 Growing Season.
Bluegrass seed yield Crop injury rating Downy brome density Downy brome controlPost harvest Madras LaGrande Madras LaGrande Madras LaGrande Madras LaGranderesidue management 716/95 7/14/95 4/13/95 4/12/95 4/13/95 4/11/95 4/13/95 4/11/95
(lbs/acre) (% injury) (#/ft2) ---- (% control)
Vacuum sweep 812 a 424 a 18.2 a 4.9 a 0.746 a 0.201 ab 82 58Bale/flail/rake 781 a 438 a 17.2 a 5.9 a 1.486 b 0.286 b 64 40Field bum 702 a 474 a 22.4 a 4.2 a 1.617 b 0.103 a 61 78
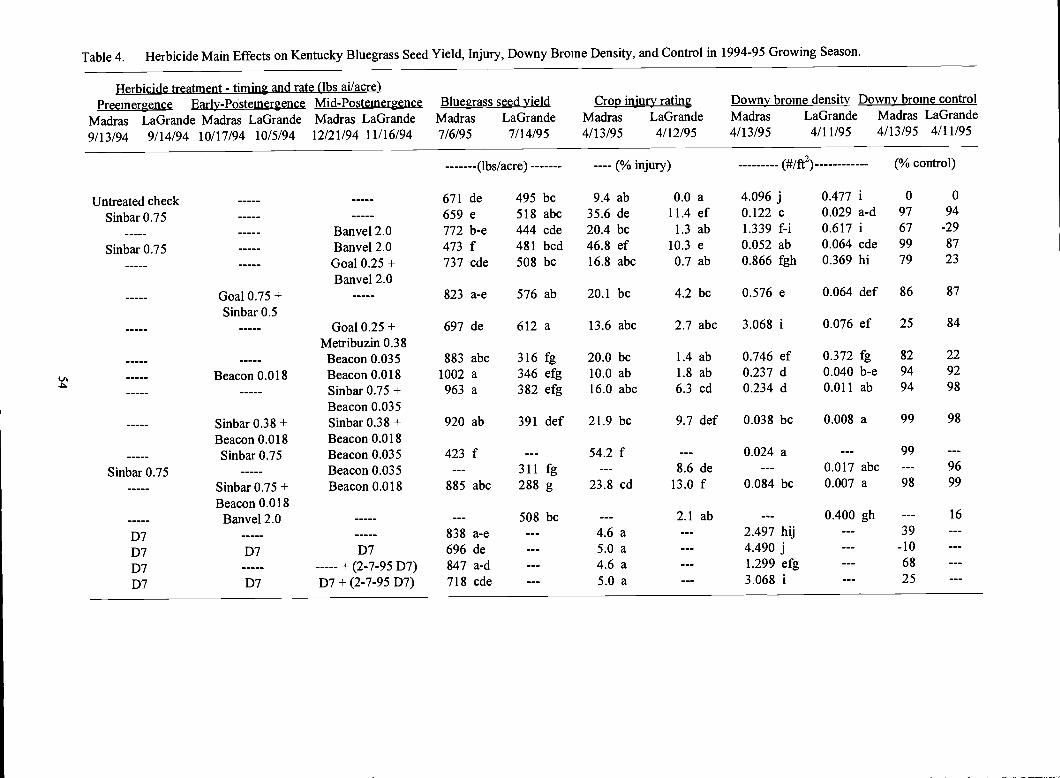
Table 4. Herbicide Main Effects on Kentucky Bluegrass Seed Yield, Injury, Downy Brome Density, and Control in 1994-95 Growing Season.
Herbicide treatment - timing and rate (lbs ailacre)Preemergence Early-Postemergence Mid-Postemergence Bluegrass seed yield Crop injury rating Downy brome density Downy brome control
Madras LaGrande Madras LaGrande Madras LaGrande Madras LaGrande Madras LaGrande Madras LaGrande Madras LaGrande
9/13/94 9/14/94 10/17/94 10/5/94 12/21/94 11/16/94 7/6/95 7/14/95 4/13/95 4/12/95 4/13/95 4/11/95 4/13/95 4/11/95
Untreated checkSinbar 0.75
Sinbar 0.75
Goal 0.75 +Sinbar0.5
(lbs/acre) ---- (% injury) (#/ft2) (% control)
671 de 495 bc 9.4 ab 0.0 a 4.096 j 0.477 i 0 0
659 e 518 abc 35.6 de 11.4 ef 0.122 c 0.029 a-d 97 94
Banvel2.0 772 b-e 444 cde 20.4 bc 1.3 ab 1.339 f-i 0.617 i 67 -29
Banvel2.0 473 f 481 bcd 46.8 ef 10.3 e 0.052 ab 0.064 cde 99 87
Goal 0.25 + 737 cde 508 bc 16.8 abc 0.7 ab 0.866 fgh 0.369 hi 79 23
Banvel 2.0823 a-e 576 ab 20.1 bc 4.2 bc 0.576 e 0.064 def 86 87
GoalO.25+ 697 de 612 a 13.6 abc 2.7 abc 3.068 i 0.076 ef 25 84
Metribuzin 0 38Beacon 0.035 883 abc 316 fg 20.0 bc 1.4 ab 0.746 ef 0.372 fg 82 22
Beacon 0.018 Beacon 0.018 1002 a 346 efg 10.0 ab 1.8 ab 0.237 d 0.040 b-e 94 92
Sinbar 0.75 + 963 a 382 efg 16.0 abc 6.3 cd 0.234 d 0.011 ab 94 98
Beacon 0.03 5Sinbar0.38+ SinbarO.38+ 920 ab 391 def 21.9 bc 9.7 def 0.038 bc 0.008 a 99 98
Beacon 0.018 Beacon 0.0 18Sinbar 0.75 Beacon 0.035 423 f 54.2 f 0.024 a 99
SinbarO.75 BeaconO.035 311 fg 8.6 de 0.017 abc 96
Sinbar 0.75 + Beacon 0.018 885 abc 288 g 23.8 cd 13.0 f 0.084 bc 0.007 a 98 99
Beacon 0.0 18Banvel2.0 508 bc 2.1 ab 0.400 gh 16
D7 838 a-e 4.6 a 2.497 hij 39
D7 D7 D7 696 de 5.0 a 4.490 j -10
D7 + (2-7-95 D7) 847 a-d 4.6 a 1.299 efg 68
D7 D7 D7 + (2-7-95 D7) 718 cde 5.0 a 3.068 i 25

WATER USE OF BLUEGRASS SEED ANDITS EFFECT ON YIELD
A.R. Mitchell andS.M GrfJIth
AbstractBluegrass water stress was studied in a preliminaryexperiment with six irrigation levels. Biomass and seedyield were very responsive to water stress. Yieldcontinued to increase for the highest irrigation treatment,and was attributed to lesser soil water tension in the finaldays after irrigation ceased. Bluegrass seed water use for1995 was 12.6 inches, and was similar to the water useestimates from the Bureau of Reclamation's AgriMetweather network.
IntroductionWater allocation for agricultural use is a matter ofincreasing concern in the arid Northwest. Because highquality bluegrass seed is produced in arid regions on bothirrigated and rain-fed land, it is important to documentthe crop water use of bluegrass to produce optimal seedyield. It is also important to investigate the relationshipbetween yield and crop water use to better manageirrigation. This study was initiated as part of a theUSDA-CSREES project "Grass Seed Cropping Systemsfor a Sustainable Agriculture."
The overall objectives of the three-year study are:
Determine the crop water use of bluegrass seed foraggressive and nonaggressive cultivars, and forthermal and nonthermal residue management.
Determine the El/yield relationship for bluegrassseed during the spring for aggressive and non-ag-gressive cultivars.
Measure water stress response in bluegrass for ag-gressive/non-aggressive cultivars throughdifferences in tillering, plant water potential, drymatter, and seed yield.
Measure the soil nutrient status (P, K, C, and 5)and the soil N and plant N uptake and partitioningin the plantlsoil system under different irrigationtreatments.
To gain preliminary information about the yield responseto water, we applied six irrigation treatments to an estab-lished stand of bluegrass 'Wildwood' at COARC. Thisreport will cover findings on soil moisture, yield, seedyield, and water use.
55
MethodsA line-source sprinkler experimental design (Hanks etal., 1976) was used to apply six different irrigation rateson an established stand of bluegrass 'Wildwood' at theCOARC. The rates ranged from no irrigation (level 1) toa the highest irrigation at level 6. Three replicationswere located at three corners of the 2-acre field.Fertilizer and herbicide were applied uniformly atstandard rates. In April, prior to irrigation, soil sampleswere taken for water content. At the same time,Watermark soil moisture sensors were installed in eachplot at depths of 4-6 inches, 10-12 inches, and 16-18
inches. Readings were taken thrice weekly until harvest.Irrigations were scheduled based on the measured soilwater depletion of the fifth irrigation level. Irrigationwas measured throughout the season for each plot withcatch cans that were raised to the height of the grasscanopy.
Harvest consisted of taking above-ground biomass, andseed yield. Biomass was taken on June 29 from three 1-ft2 areas, and the samples were used to determine thenumber of fertile and non fertile tillers. Seed yield wastaken from a 1-rn2 area of each plot and thrashed at theUSDA-NFSPRC.
1500
Y = 7.75 W- 1186c'J
E 10000)(/)C,)CO
E0
00
2=0.84
500
Figure 1. Biornass as a function of water use,Wildwood Bluegrass, Madras, Oregon, 1995.
50 100 150 200 250 300 350
Water Use (mm)

56
differences, but after June 21 there was a markeddifference in soil water potential between the twotreatments. These data suggest that the improved yieldof the highest irrigation treatment may have resultedfrom less water stress in the final days of development.
160
120
80
40
400
-k-- 5 -H-- 16
0.-i -
05/02 05/06 05/16 05/23 05/30 06/06 06/14 06/2 1 06/28
Day of the Year
Figure 3. Soil water tension at the six-inch depth forirrigation treatments IS and 16 of WildwoodBluegrass, Madras, Oregon, 1995.
003/15 03/29 04/12 04/26 05/10 05/24 06/07 06/21
Date
Figure 4. Cumulative water use of WildwoodBluegrass compared to AgriMet estimates,Madras, Oregon, 1995.
The cumulative water use of Wildwood bluegrass isshown in Figure 4 for all irrigation treatments. Alsoshown are the AgriMet estimates of bluegrass water usefrom a weather station with 400 m of the experimentalfield. The differences between estimates by AgriMet andtreatment 6 in April and May are a result of thecalculation of water use that included the soil waterdepletion as occurring during that time period. Thevirtually identical results at the end of the season showthat AgriMet did a good job of estimating bluegrasswater use.
Water use, or evapotranspiration (ET), estimates forbluegrass vary widely. Using central Oregon as anexample, the most recent OSU publication on water use(Cuenca et al. 1992) listed the yearly median water use
Y=1.16W-240
r2=0.75
/.
-o
Ii14
+ 12 H
AgnMe( Z3
16
J.
.----1
200
50 100 150 200 250 300 350
Water Use (mm)
Figure 2. Seed yield as a function of water use, Wild-wood Bluegrass, Madras, Oregon, 1995.
ResultsOne entire replicate was eliminated from the followinganalyses because it received overland flow of irrigationwater from another location that compromised theintegrity of the plot. The bluegrass biomass and seedyield responded to irrigation treatment at a highlysignificant level (Table 1). The harvest index, or ratio ofseed yield to biomass, also responded to increasingirrigation treatment. There was no difference in yieldcomponents between irrigation treatments 3, 4, and 5 inspite of the differences in calculated water use.However, irrigation treatment 6 was significantly higherin seed yield and harvest index. This will be explainedlater.
Fertile and non-fertile tiller counts were not significantlydifferent for the irrigation treatments (data not shown),however, the biomass of fertile tillers, when weighedseparately, was significantly greater for higher irrigationtreatments (Table 1).
The relationships between water use and yield are shownin Figure 1 for biomass and Figure 2 for seed yield.Linear regression was used to produce the equationslisted on the graphs. The 1995 data at Madras showedthat without irrigation, the 229 mm (9.0 inches) ofprecipitation plus soil water depletion can produce lowlevels of biomass, but not significant seed yield. Themaximum water use of 321 mm (12.6 inches) producedan average seed yield of 161 g/m2 (1,436 lb/A). Anystress below the maximum resulted in a severe yieldreduction. According to the linear relationship, a 1-inchchange in water use results in an 195-lb/A change in seedyield!
There was a large yield response between irrigationlevels 5 and 6 although there was little difference inwater use (Table 1). The difference in soil matricpotential can be observed in time in Figure 3, where thegreater values indicate drier soil. There was nodifference throughout May until after the last irrigationJune 12. Rain on June 14 and 15 minimized the
EE5)
300
200
J 100ED0
200
150
100
>-
a)6) 50
U)
0

for grass seed as 35.9 inches, while the Bureau ofReclamation's AgriMet system (USBOR, 1995)calculated a seven-year average as 15.5 inches, andWatts et al. (1968) listed 5.95 inches. The 1995 AgriMetcalculation was 14.9 inches. It appears that the AgriMetcalculations was the best estimate of water use available.
Future research will concentrate on the water use andyield of aggressive and non-aggressive bluegrass. Withthe information from the 1995 experiment, we will be ina position to investigate irrigation in late June thatappears to influence yield. We have already establishedan experimental plot of bluegrass cultivars Abbey andBristol that are aggressive and non-aggressive,respectively. The design was a double line-sourcesprinkler (Frenkel, et al., 1990) with room to conductnested experiments on nitrogen fertility and residueremoval. These factors will be tested in 1996, and 1997.
AcknowledgmentWe appreciate the efforts of the late D. Dale Coats, ourformer friend and colleague, who inspired andencouraged this work. We also are grateful to JessicaJacks and the USDA-NFSPRC staff for care in collectingand processing samples.
(mm)
1 2292 2423 2724 3005 3186 321
548 a623 a
1010 b1171 cb1181 cb1375 C
(g/m2)
'Water use is the sum of irrigation, precipitation, and change in soil water.2
values followed by the same letter are not significantly different at the 0.05 level.
57
ReferencesCuenca, R.H., J.L. Nuss, A. Martinez-Cob, G. G. Katul,
and J.M.F. Gonzalez. 1992. Oregon crop water useand irrigation requirements. OSU Ext. Misc. 8530. pp184.
Frenkel, H., A. Mantell, A. Vinten, and A. Meiri. 1990.Double line-source sprinkler system for determiningthe separate and interactive effects of water andsalinity on forage corn. 1mg. Sci. 11:227-231.
Hanks, R.J. 1983. Yield and water-use relationships: anoverview. p. 393-412. In H.M. Taylor (ed)Limitations to Efficient Water Use in CropProduction. ASA, Madison, WI.
U.S. Bureau of Reclamation. 1995. Agricultural cropwater use summary, 1988-1994. USBOR, PacificNorthwest Region, Boise, ID.
Watts, D.G. C.R. Dehlinger, J.W. Wolfe, and M.N.Shearer. 1968. Consumptive use and net irrigation re-quirements for Oregon. Circular of Information 628.Agric. Exp. Sta. OSU, Corvallis, OR. 40 p.
Table 1. Water use, yield components, and TKN of Wildwood bluegrass seed by irrigation treatment, Madras, OR, 1995.
(gIm2)
203 a246 ab496 bc607 c731 c630 c
Irrigation Harvest Fertile TillerTreatment Water Use' Biomass Seed Yield Index TKN Biomass
Significance P<0.Ol P<0.0l P<0. 10 P<0.01 P<0.05
(%)
12 a 2.15 1.68 a45 ab 7.05 1.16 bc83 bc 8.42 1.14 bc
103 c 8.81 0.99 c102 c 8.84 1.06 c161 d 11.72 1.01 c

EVALUATION OF HERBICIDES FORCONTROL OF ROUGHSTALKBLUEGRASS IN KENTUCKY
BLUEGRASS, 1994-1995
MD. Butler
Historically central Oregon has been an important Ken-tucky bluegrass seed production area. In recent years,however, roughstalk bluegrass production has increasedand currently accounts for over one-third of grass seedgrown in the area. Contamination of Kentucky bluegrassseed with roughstalk bluegrass has become an increasinglyserious problem for the central Oregon grass seed industry.Evaluation of herbicides for control of roughstalk bluegrassin Kentucky bluegrass were initiated during the 1993-1994season, and expanded during 1994-1995.
To evaluated herbicides for crop injury three trials were setup in three commercial Kentucky bluegrass fields (cv.Merit, Coventry, and Unique). To evaluate percent controlof established and seedling plants of roughstalk bluegrass,three commercial fields of roughstalk bluegrass (cv. Saber,Laser, and Cypress) were used. Eight herbicides were fall-applied November 3 at all three roughstalk bluegrass fields,and November 7 to fields of Coventry and Unique, andNovember 22, 1994 to the Merit field. The ninth herbicide,Horizon, was applied to all locations March 25, 1995.Materials were applied at two rates in a grid pattern of 10 ftx 10 ft plots with 100 plots per location. The low rate ofthe nine herbicides was applied in strips across ten plotsand the high rate of the same herbicides was applied instrips across ten plots perpendicular to the low rateapplications. Application was made using a CO2pressurized, hand-held, boom sprayer at 40 psi and 20 gal/aof water. A non-ionic surfactant, Spray BoosterS®, wasapplied at 1 qt/100 gal in combination with all herbicides.
The Saber field was removed from production afterevaluation March 17, 1995 for control of established andseedling roughstalk bluegrass plants. The other tworoughstalk bluegrass fields were evaluated March 28, 1995.An evaluation of percent crop injury, based on reduction inplant biomass, was made on the Kentucky bluegrass fieldsMarch 29, 1995. Evaluation of the spring-applied Horizonplots was conducted May 10, 1995. Pre-harvestevaluations of percent reduction in seed set were conductedon June 9 and 12, 1995. Visual assessment of treatmentsshowing the greatest roughstalk bluegrass control with theleast injury to established Kentucky Bluegrass were chosenfor statistical analysis. Data from these most promising ofthe 100 herbicide combinations are shown in Table 1.
58
The greatest injury to Kentucky bluegrass across cultivarsresulted from Assert at 1 V2 pt/a with 20 percent injury andSinbar at 11/4 lb/a with 18 percent injury. Assert at 11/2 pt/aproduced 10 to 12 percent injury in combination with othermaterials, while Beacon at 1 '/8 ozia produced 10 percentinjury. Coventry and Unique appeared to be more sensitiveto Beacon, while Merit showed increased injury from Sin-
bar, Nortron and Banvel, Evaluation of phytotoxicity onMay 10 following the spring application of Horizon re-vealed up to 30 percent damage to Kentucky bluegrass.Pre-harvest evaluation of seed set indicated reductionsfrom Horizon in all three cultivars, up to 90 percent forMerit, 60 percent for Coventry, and 85 percent for Unique.
Eighty-nine percent of roughstalk bluegrass plants werecontrolled with Sinbar at 1¼ lb/a, while Sinbar plus Diuroncombinations provided 79 to 83 percent control. Saber wascontrolled at 70-98 percent with combinations of Sinbar at
lb/a, while Laser appeared to be more resistant withgenerally a lesser degree of control from either Sinbar at 3/4
lb/a or Diuron at 2 lb/a. The best combination was Diuronplus Sinbar with 85 percent control. The greatest promisefor control of Cypress was Sinbar, Diuron, Assert, andLexone in combination with other materials. Evaluation ofphytotoxicity May 10 following the spring application ofHorizon showed some damage to roughstalk bluegrass. Upto 10 percent reduction in biomass was observed at I V2 pt/a,
with 15 to 20 percent control was provided at 2¼ pt/a forboth Laser and Cypress.
Seedling roughstalk bluegrass between the rows was 94percent controlled with Sinbar at 1¼ lb/a or 92 percentcontrolled with Sinbar plus Diuron combinations. Sinbarin combination with Beacon or Goal provided 85 percentcontrol, while Sinbar in combination with Lexone gave 80percent. As with established roughstalk plants, Sinbar ateither rate, and Diuron at 2 lb/a provided the most consis-tent control across combinations. The only effective mate-rial on Saber was Sinbar, while Beacon and Diuron pro-vided consistent control above 80 percent on Laser (exceptin combination with Banvel). Some control was also pro-vided by Lexone and Sinbar. As with established plants,Cypress was the most sensitive cultivar for seedling controlwith Sinbar, Diuron, and Lexone being the most effectivematerials.

Table 1. Percent control for selected fall-applied herbicides providing the best overall performance on established andseedling roughstalk bluegrass and corresponding crop injury to Kentucky bluegrass evaluated March, 1995 nearMadras and Culver, Oregon.
Data are the average of three fields; Saber, Laser and Cypress.2
Data are the average of three fields; Merit, Coventry and Unique.'Means in the same column with different letters are significantly different (P=0.05).
DEVELOPMENT OF CONTROLPROGRAM FOR ERGOT IN KENTUCKY
BLUEGRASS SEED PRODUCTION
MD. Butler, Fl Crowe, D.D. Coats and S.C. Alderman
Ergot, caused by the fungus Claviceps purpurea, is an im-portant flower-infecting pathogen in grass seed productionregions of the Pacific Northwest. Of the grass speciesgrown for seed in Oregon, Kentucky bluegrass is particu-larly affected by ergot. Historically the disease has beenpartially controlled by open-field burning.
During the 1995 season fungicides were evaluated for con-trol of ergot in a 'Coventry' Kentucky bluegrass seed fieldat Trail Crossing, near Culver, Oregon. Fungicide evalua-tions were also conducted at a second field of 'Coventry'located at the Central Oregon Agricultural Research Center(COARC), Powell Butte site, which was inoculated withergot at 1 sclerotia/ft2 in 1993 and 1994 to insure an ade-quate level of disease. Fusilazole (Dupont's Punch®),progiconazole (Ciba's Tilt®), tebuconazole (Miles' Foli-cur
fl)and Best Sulfur Products' Orthorix® were evaluated
during the 1995 season, with an emphasis on Tilt since it iscurrently registered for grass seed. Surfactants Sylgard 309and Penaturf were evaluated individually as the second oftwo applications following Tilt.
Materials were applied to 10 ft x 20 ft plots replicated fourtimes in a randomized complete block design with 8003TwinJet nozzles on a 9 foot CO2 pressurized boom sprayerat 40 psi and 30 gal/a water. Silicone surfactant, Sylgard309, and spreader-sticker, R-56, were each applied at 1
pt/lOO gal in combination with all fungicide treatments
Roughstalk bluegrass control' Injury to
59
except Orthorix, and one 4 fi oz/a Tilt treatment. Treat-ments were applied at the Trail Crossing location on June 3and June 16 and at the Powell Butte site on June 3 and June13. The first treatments were applied at the initiation ofanthesis at Powell Butte and just prior to anthesis at TrailCrossing.
One hundred panicles were collected from each plot onJune 13 at the Powell Butte location and July 14 at theTrail Crossing site. Number of panicles with sclerotia andtotal sclerotia per sample were determined for each plot.Seed weight per sample and weight per 1,000 seed wasdetermined following standard separation procedures.Analysis of variance was used to evaluate fungicide effecton suppression of ergot at both locations.
Incidence of ergot at the Powell Butte site was quite high,while the infection level at Trail Crossing was relativelylow. Comparison of the number of panicles with sclerotiaand the total number of scierotia per sample at the PowellButte site (Table 1) indicates a single application of Punchprovides the most effective control of ergot. A singlePunch application, both a single and double application ofTilt at 8 ozla, and a double application of Tilt plus Or-thorix statistically out-performed both single and doubleapplications of Orthorix and the nontreated plots. Due tolow incidence of ergot at the Trail Crossing location, therewere no significant differences between treatments whencomparing either panicles with sclerotia or total sclerotiaper 100 panicle sample (Table 2).
Seed weight per sample or weight per 1,000 seed were notsignificantly different at either location, indicating no effectof fungicide applications on seed size.
Material and rate seedlings established plants Kentucky bluegrass2
(%) (%)
SinbarO.5 lb+SinbarO.75lb 94 a3 89 a 18 aSinbar 0.5 lb + Diuron 2.0 lb 92 a 83 a 2 abDiuron 1.0 lb + Sinbar 0.75 lb 92 a 79 a 3 abSinbar 0.5 lb + Beacon 0.75 oz 85 a 32 a 7 abGoal 10 oz + Sinbar 0.75 lb 85 a 68 a 5 abSmbar 0.5 lb + Lexone 5.33 oz 80 a 50 a ObLexone 2.67 oz + Sinbar 0.75 lb 80 a 68 a 7 abAssert 0.75 lb + Sinbar 0.75 lb 75 a 68 a 3 ab

Table 1 Evaluation of fungicides applied for ergot control to 'Coventry Kentucky' bluegrass at the COARC Powell
Butte site in central Oregon on June 3 and June 13, 1995.
Fungicide Rate Panicles Total scierotia Weight 1000 seed
Treatment June 3 June 13 with scierotia per sample per sample weight
1 Application with Penaturf at 42 fi oz rather than standard surfactants.2 Silgard applied at 32 fl oz per 100 gals.
60
'Application with Penaturf at 42 fi oz rather than standard surfactants.2 Silgard applied at 32 fi oz per 100 gals.
Means in the same column with different letters are significantly different (P=0.05).
Table 2. Evaluation of fungicides applied for ergot control to 'Coventry Kentucky' bluegrass in the Trail Crossing area
near Culver, Oregon on June 3 and June 16, 1995.
Fungicide Rate Panicles Total sclerotia Weight 1000 seed
Treatments June 3 June 16 with scierotia per sample per sample weight
(fl oz/a) (%) (no.) (g) (mg)
Punch2SE 28 1.3 1.3 3.03 291
Tilt 3.6E/Orthorix + Tilt 3.6E/Orthorix 4/64 4/64 1.0 1.3 3.03 273
Tilt 3.6E 4 1.8 3.3 3.44 291
Tilt 3.6E41 4.0 8.5 3.38 306
Tilt 3.6E+Tilt 3.6E 4 4 1.8 2.0 3.01 296
Tilt 3.6E + Orthorix 4 64 2.3 3.8 2.96 295
Tilt 3.6E + Silgard 4 322 2.5 5.5 3.23 297
Tilt 3.6E + Penaturf 4 42 3.0 6.0 3.34 280
Tilt 3.6E 8 1.0 1.5 3.16 285
Tilt 3.6E + Tilt 3.6E 8 8 0.3 0.3 3.59 275
Folicur3.6F 4 1.0 2.8 3.53 285
Folicur3.6F 8 0.3 0.3 3.24 280
Orthorix 64 6.8 36 3.53 292
Orthorix + Orthorix 64 64 3.0 5.8 3.28 302
Untreated 5.0 10 3.48 296
LSD .05 NS NS NS NS
(fl ozia) (%) (no.) (g) (mg)
Punch25E 28 13 f3 23 d 4.47 a 334 a
Tilt 3.6E/Orthorix + Tilt 3.6E/Orthorix 4/64 4/64 34 cdef 89 cd 4.75 a 335 a
Tilt 3.6E 4 50 abcde 194 bcd 4.63 a 350 a
Tilt 3.6E41 57 abc 221 abcd 4.63 a 344 a
Tilt 3.6E+Tilt 3.6E 4 4 43 bcde 152 bcd 4.37 a 344 a
Tilt 3.6E + Orthorix 4 64 45 bcde 145 bcd 4.71 a 337 a
Tilt 3.6E + Silgard 4 322 66 ab 282 abc 4.23 a 335 a
Tilt 3.6E + Penaturf 4 42 56 abcd 262 abc 4.40 a 324 a
Tilt 3.6E 8 33 def 89 cd 4.76 a 340 a
Tilt 3.6E + Tilt 3.6E 8 8 27 ef 72 cd 4.44 a 329 a
Folicur3.6F 4 49 abcde 172 bcd 4.67 a 338 a
Folicur3.6F 8 51 abcde 177 bcd 4.59 a 346 a
Orthorix 64 65 ab 348 ab 4.86 a 327 a
Orthorix + Orthorix 64 64 61 ab 325 ab 4.59 a 340 a
Untreated 71 a 415 a 4.85 a 327 a
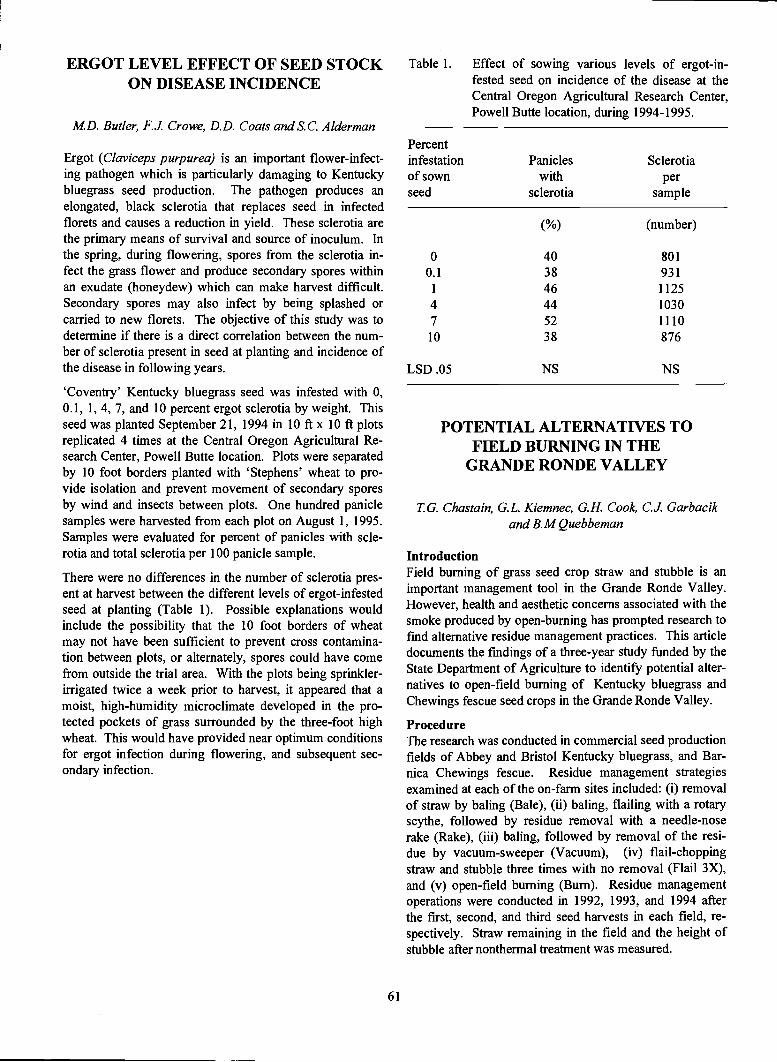
ERGOT LEVEL EFFECT OF SEED STOCKON DISEASE INCIDENCE
MD. Butler, F.J. Crowe, D.D. Coats and S.C. Alderman
Ergot (Claviceps purpurea) is an important flower-infect-ing pathogen which is particularly damaging to Kentuckybluegrass seed production. The pathogen produces anelongated, black sclerotia that replaces seed in infectedflorets and causes a reduction in yield. These scierotia arethe primary means of survival and source of inoculum. Inthe spring, during flowering, spores from the scierotia in-fect the grass flower and produce secondary spores withinan exudate (honeydew) which can make harvest difficult.Secondary spores may also infect by being splashed orcarried to new florets. The objective of this study was todetermine if there is a direct correlation between the num-ber of sclerotia present in seed at planting and incidence ofthe disease in following years.
'Coventry' Kentucky bluegrass seed was infested with 0,0.1, 1, 4, 7, and 10 percent ergot sclerotia by weight. Thisseed was planted September 21, 1994 in 10 ft x 10 ft plotsreplicated 4 times at the Central Oregon Agricultural Re-search Center, Powell Butte location. Plots were separatedby 10 foot borders planted with 'Stephens' wheat to pro-vide isolation and prevent movement of secondary sporesby wind and insects between plots. One hundred paniclesamples were harvested from each plot on August 1, 1995.Samples were evaluated for percent of panicles with scie-rotia and total sclerotia per 100 panicle sample.
There were no differences in the number of sclerotia pres-ent at harvest between the different levels of ergot-infestedseed at planting (Table 1). Possible explanations wouldinclude the possibility that the 10 foot borders of wheatmay not have been sufficient to prevent cross contamina-tion between plots, or alternately, spores could have comefrom outside the trial area. With the plots being sprinkler-irrigated twice a week prior to harvest, it appeared that amoist, high-humidity microclimate developed in the pro-tected pockets of grass surrounded by the three-foot highwheat. This would have provided near optimum conditionsfor ergot infection during flowering, and subsequent sec-ondary infection.
61
POTENTIAL ALTERNATIVES TOFIELD BURNING IN THE
GRANDE RONDE VALLEY
T G. Chastain, G.L. Kiemnec, G.H. Cook, C.J Garbacikand B. M Quebbeman
IntroductionField burning of grass seed crop straw and stubble is animportant management tool in the Grande Ronde Valley.However, health and aesthetic concerns associated with thesmoke produced by open-burning has prompted research tofmd alternative residue management practices. This articledocuments the findings of a three-year study funded by theState Department of Agriculture to identify potential alter-natives to open-field burning of Kentucky bluegrass andChewings fescue seed crops in the Grande Ronde Valley.
ProcedureThe research was conducted in commercial seed productionfields of Abbey and Bristol Kentucky bluegrass, and Bar-nica Chewings fescue. Residue management strategiesexamined at each of the on-farm sites included: (i) removalof straw by baling (Bale), (ii) baling, flailing with a rotaryscythe, followed by residue removal with a needle-noserake (Rake), (iii) baling, followed by removal of the resi-due by vacuum-sweeper (Vacuum), (iv) flail-choppingstraw and stubble three times with no removal (Flail 3X),and (v) open-field burning (Burn). Residue managementoperations were conducted in 1992, 1993, and 1994 afterthe first, second, and third seed harvests in each field, re-spectively. Straw remaining in the field and the height ofstubble after nonthermal treatment was measured.
Table 1. Effect of sowing various levels of ergot-in-fested seed on incidence of the disease at theCentral Oregon Agricultural Research Center,Powell Butte location, during 1994-1995.
Percentinfestation Panicles Sclerotiaof sown with perseed sclerotia sample
(%) (number)
0 40 8010.1 38 931
46 11254 44 10307 52 111010 38 876
LSD .05 NS NS
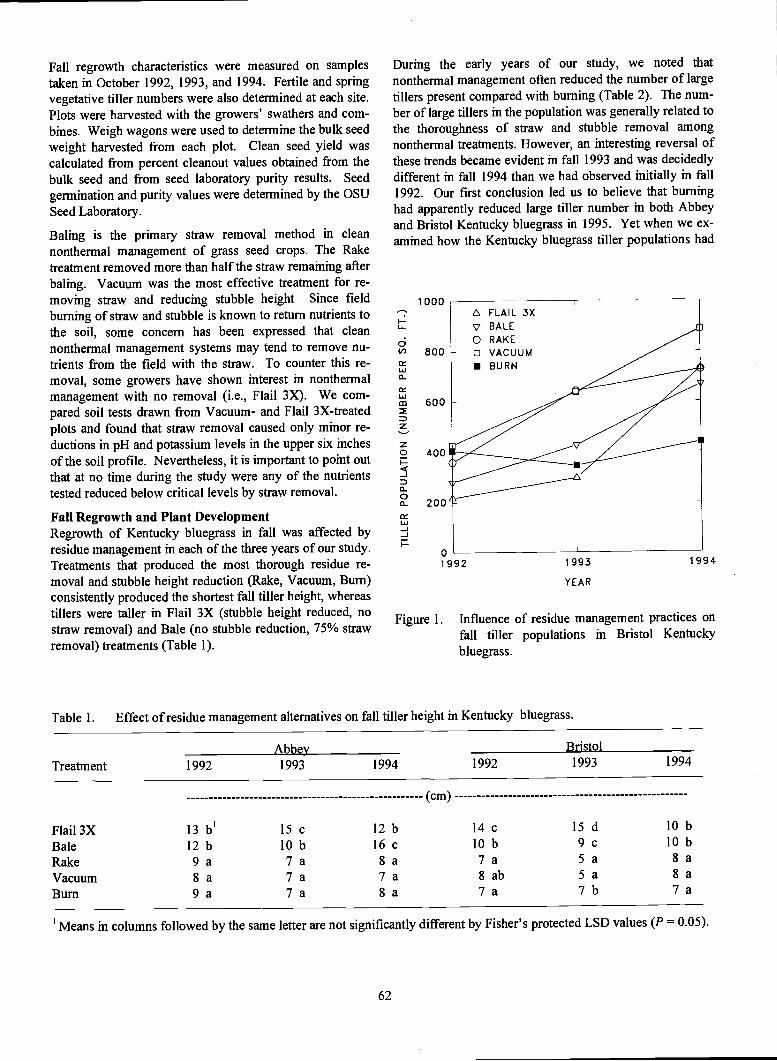
Fall regrowth characteristics were measured on samplestaken in October 1992, 1993, and 1994. Fertile and springvegetative tiller numbers were also determined at each site.Plots were harvested with the growers' swathers and com-bines. Weigh wagons were used to determine the bulk seedweight harvested from each plot. Clean seed yield wascalculated from percent cleanout values obtained from thebulk seed and from seed laboratory purity results. Seedgermination and purity values were determined by the OSUSeed Laboratory.
Baling is the primary straw removal method in cleannonthermal management of grass seed crops. The Raketreatment removed more than half the straw remaining afterbaling. Vacuum was the most effective treatment for re-moving straw and reducing stubble height Since fieldburning of straw and stubble is known to return nutrients tothe soil, some concern has been expressed that cleannonthermal management systems may tend to remove nu-trients from the field with the straw. To counter this re-moval, some growers have shown interest in nonthermalmanagement with no removal (i.e., Flail 3X). We com-pared soil tests drawn from Vacuum- and Flail 3X-treatedplots and found that straw removal caused only minor re-ductions in pH and potassium levels in the upper six inchesof the soil profile. Nevertheless, it is important to point outthat at no time during the study were any of the nutrientstested reduced below critical levels by straw removal.
Fall Regrowth and Plant DevelopmentRegrowth of Kentucky bluegrass in fall was affected byresidue management in each of the three years of our study.Treatments that produced the most thorough residue re-moval and stubble height reduction (Rake, Vacuum, Burn)consistently produced the shortest fall tiller height, whereastillers were taller in Flail 3X (stubble height reduced, nostraw removal) and Bale (no stubble reduction, 75% strawremoval) treatments (Table 1).
AbbeyTreatment 1992 1993
Flail 3XBaleRakeVacuumBurn
62
During the early years of our study, we noted thatnonthermal management often reduced the number of largetillers present compared with burning (Table 2). The num-ber of large tillers in the population was generally related tothe thoroughness of straw and stubble removal amongnonthermal treatments. However, an interesting reversal ofthese trends became evident in fall 1993 and was decidedlydifferent in fall 1994 than we had observed initially in fall1992. Our first conclusion led us to believe that burninghad apparently reduced large tiller number in both Abbeyand Bristol Kentucky bluegrass in 1995. Yet when we ex-amined how the Kentucky bluegrass tiller populations had
1000
I-
c(/' 800
Lia-
600
zz2 400I-
-J
200
01992
Table 1. Effect of residue management alternatives on fall tiller height in Kentucky bluegrass.
1994 1992
(cm)
13b' 15c 12b 14c12b lOb 16c lOb9a 7a 8a 7a8a 7a 7a 8ab9a 7a 8a 7a
FLAIL 3XBALE
o RAKEE VACUUM
BURN
Figure 1. Influence of residue management practices onfall tiller populations in Bristol Kentuckybluegrass.
Bristol1993 1994
'in columns followed by the same letter are not significantly different by Fisher's protected LSD values (P = 0.05).
15 d9c5a5a7b
10 b10 b8a8a7a
1993 1994
YEAR

Table 2 Impact of residue management alternatives on number of large (2mm diameter) fall tillers in Kentuckybluegrass.
Abbey BristolTreatment 1992 1993 1994 1992 1993 1994
(% of burn)
Flail3X 65 ab1 35 a 183 ab 43 a 86 a 264 bBale 64 a 89 b 171 ab 48 a 97 a 237 bRake 115 c 99 b 255 bc 78 b 156 bc 236 bVacuum 108 c 101 b 299 c 92 b 168 c 315 bBum 100 c 100 b 100 a 100 b 100 ab 100 a
'Means in columns followed by the same letter are not significantly different by Fisher's protected LSD values (P 0.05).
Table 3. Leaf development responses to alternative residue management in Kentucky Bluegrass.
Abbey BristolTreatment 1992 1993 1994 1992 1993 1994
(leaf number per tiller)
Flail3X 2.3 ab' 1.7 a 2.9 2.1 2.5 ab 3.2Bale 1.9 a 2.3 b 2.7 2.2 3.0 b 3.1Rake 2.8 c 2.4 b 2.7 2.3 2.1 a 3.3Vacuum 2.7 bc 2.1 b 2.7 2.3 2.5 ab 3.0Burn 2.3 ab 2.4 b 2.6 2.2 2.5 ab 3.0
'Means in columns followed by the same letter are not significantly different by Fisher's protected LSD values (P = 0.05).
Table 4. Effect of residue management alternatives on fertile tiller percentage in spring tiller populations of Kentuckybluegrass.
Abbey BristolTreatment 1993 1994 1995 1993 1994 1995
(%)
Flail3X 14 6 a' 6 a 18 a 14 a 22 aBale 28 20 b 13 a 30 b 17 a 28 abRake 31 28 b 28 b 32 b 30 bc 41 bcVacuum 29 25 b 29 b 39 b 37 c 38 bcBurn 28 25 b 29 b 42 b 26 b 49 C
'Means in columns followed by the same letter are not significantly different by Fisher's protected LSD values (P 0.05).
63

changed over the years, it became clear to us that burningdoes not reduce tiller number. Rather, it is maintained byburning at a nearly constant level over time (Figure 1). In-stead, we found that tiller number had increased as thestands aged when the crop was managed by nonthermalmethods. This increase in tiller number was likely due togreater rhizome production in nonthermal managementtreatments, which has been documented by other investiga-tors in Kentucky bluegrass. The rhizomes establishdaughter plants that, in turn, produce the additional tillersrecorded in our samples.
Leaf development in fall-fonned tillers of Kentucky blue-grass was not consistently affected by the presence or ab-sence of burning nor was leaf development influenced bythe thoroughness of straw and stubble removal amongnonthermal treatments (Table 3).
The regrowth of Chewings fescue after residue manage-ment exhibited different responses than we had observedfor Kentucky bluegrass. As we had found in Kentuckybluegrass, tiller height was typically greatest when Chew-ings fescue was managed with Flail 3X, but other treat-ments did not have a consistent effect on tiller height.Tiller number was not affected by residue management inChewings fescue. Unlike Kentucky bluegrass, Chewingsfescue is not a rhizome-forming species so it is expectedthat tiller populations would respond differently to residuemanagement practices. Nevertheless, the number of aerialtillers in the population was reduced in proportion to thethoroughness of stubble and straw removal. Aerial tillersaccounted for more than 20% of the total tiller populationin Bale and Flail 3X treatments in fall 1993, whereas noaerial tillers were found when the crop was burned.
Spring Tiller ProductionProducing Kentucky bluegrass without straw removal (Flail3X) consistently caused low fertile tiller numbers in thefollowing spring (Table 4). Management by baling withoutadditional straw removal by a secondary method (Rake orVacuum) or stubble height reduction often resulted infewer fertile tillers than in the burn treatment. We foundthat the Rake and Vacuum treatments had fertile tiller pro-duction that was equivalent to burning. The number ofspring vegetative tillers produced by Kentucky bluegrasswas reduced by burning in 1993 and 1995, but not in 1994.
Fertile tiller production in Chewings fescue was not af-fected by residue management practices in 1993, but fertiletiller numbers were reduced without straw removal (Flail3X) in 1994 and 1995 (Table 5). Burning produced thegreatest number of fertile tillers in 1994 and 1995. Incon-sistent effects of residue management on spring vegetativetiller numbers were noted in Chewings fescue.
64
Table 5. Residue management impacts on fertile tillerpercentage in spring tiller populations of Bar-nica Chewings fescue.
Flail 3XBaleRakeVacuumBurn
'Means in columns followed by the same letter are notsignificantly different by Fisher's protected LSD values(P = 0.05).
Table 6. Effect of residue management on Kentuckybluegrass and Chewings fescue seed yield inthe Grande Ronde Valley.
(lb/A)
1993 Flail3X 836 a' 431 a 801 aBale 1100 b 600 b 931 abRake 1242 b 642 bc 965 bVacuum 1170 b 627 bc 1032 bBurn 1224 b 674 c 1021 b
1994 Flail3X 245 a 226 a 335 aBale 490 b 356 b 599 bRake 766 c 452 c 639 bcVacuum 661 c 442 c 745 cBurn 749 c 434 bc 749 c
1995 Flail 3X 637 a 500 a 285 aBale 968 b 667 c 629 bRake 1200 c 623 bc 652 bVacuum 1163 c 611 b 698 bBurn 959 b 615 b 839 b
'Means in columns followed by the same letter are notsignificantly different by Fisher's protected LSD values(P = 0.05).
Seed Yield and Seed QualityRake and Vacuum treatments produced Kentucky bluegrassseed yields that were equivalent to field burning (Table 6).To attain seed yields that were not different from the burntreatment, our Rake and Vacuum treatments had to removeat least 90% of the straw and stubble height was reduced to
Treatment 1993 1994 1995
Kentucky Chewingsbluegrass fescue
Year Treatment Abbey Bristol Barnica
(%)
53 7 a' 10 a38 20 b 19 ab45 22 bc 23 b45 28 bc 18 ab30 32 c 34 c

less than two inches. Removal of straw by baling withoufurther reduction in stubble height (Bale) did not aiwayproduce seed yields that were equivalent to burning. Wheno straw was removed (Flail 3X), we consistently founmajor reductions in Kentucky bluegrass seed yield.
The poorest seed yields in Chewings fescue were observein the Flail 3X treatment, whereas Rake and Vacuumtreatments produced yields that were not different fromburning (Table 6). Although not statistically different, theRake treatment tended to produce lower yields than theBurn treatment.
Seed germination was not reduced by nonthermal man-agement anytime during our study in Kentucky bluegrass.Germination was not affected by residue management inmost instances in Chewings fescue. However, germinationwas reduced by the Flail 3X treatment in Chewings fescuein 1994. Seed purity was often reduced in the Flail 3Xtreatment in both Kentucky bluegrass and Chewings fes-cue. This reduction in purity was caused by an increase ininert matter. No increases in weed seed, other crop seed, orergot were detected.
Conclusions and RecommendationsOur observations have led us to conclude that a sizableportion of the seed yield potential in Kentucky bluegrass isset in fall prior to the onset of conditions favoring vernali-zation of the crop (low temperatures and short days inwinter). We believe that this component of the crops' yieldpotential is largely a function of the quality of crop re-growth in fall and that there is no "physiological shock"associated with field burning. Field burning simply re-moves stubble and straw that inhibit regrowth characteris-tics, which otherwise would improve the chances for suc-cessful induction of flowering. Factors such as heat anddrought, pests, insufficient nutrients, and others can indi-vidually and collectively, influence the realization of theseed yield potential during spring and summer months.
Our research has identified several regrowth characteristicsthat may be associated with flowering and seed yield. For
65
instance, large diameter tillers in fall were important earlyindicators of seed yield, particularly in younger stands.However, large tiller number alone did not account for thevariation in seed yield that we observed among treatments.The height of Kentucky bluegrass tillers in fall was in-versely related to the seed yield harvested in the followingseason. In other words, tall tillers were indicative of poorseed yields, whereas short tillers were indicative of goodseed yields. Other morphological and possibly, biochemi-cal characteristics of quality regrowth in Kentucky blue-grass still need to be identified.
We cannot recommend that growers use Flail 3X to man-age post-harvest residues in Kentucky bluegrass andChewings fescue grown in the Grande Ronde Valley. Lowseed yields, higher seed cleaning costs, and the potentialfor low seed quality all point to low profitability for grow-ers managing straw without removal. Our work clearlyshows that seed yield and seed quality can be maintained inKentucky bluegrass and Chewings fescue without burningif growers use management techniques (Rake or Vacuum)that will remove most of the straw and reduce stubbleheight. We feel that thorough removal of straw and reduc-tion in stubble height is necessary to ensure optimum cropregrowth in fall and to produce the highest seed yieldsconsistently.
Growers must use the most cost efficient means availableto attain the desired level of straw and stubble removal. Atpresent, field burning is the lowest cost method but theavailability and timeliness of burning are major concerns.Research conducted in the Grande Ronde Valley has shownthat a 30-day delay in burning caused significant reductionsin Kentucky bluegrass seed yield. To avoid major yieldlosses, nonthermal methods should be considered whenatmospheric conditions prevent a timely burn after harvest.We believe that the results of our work provide the basisfor the future development of residue management strate-gies that will both be cost effective and resourceconserving.
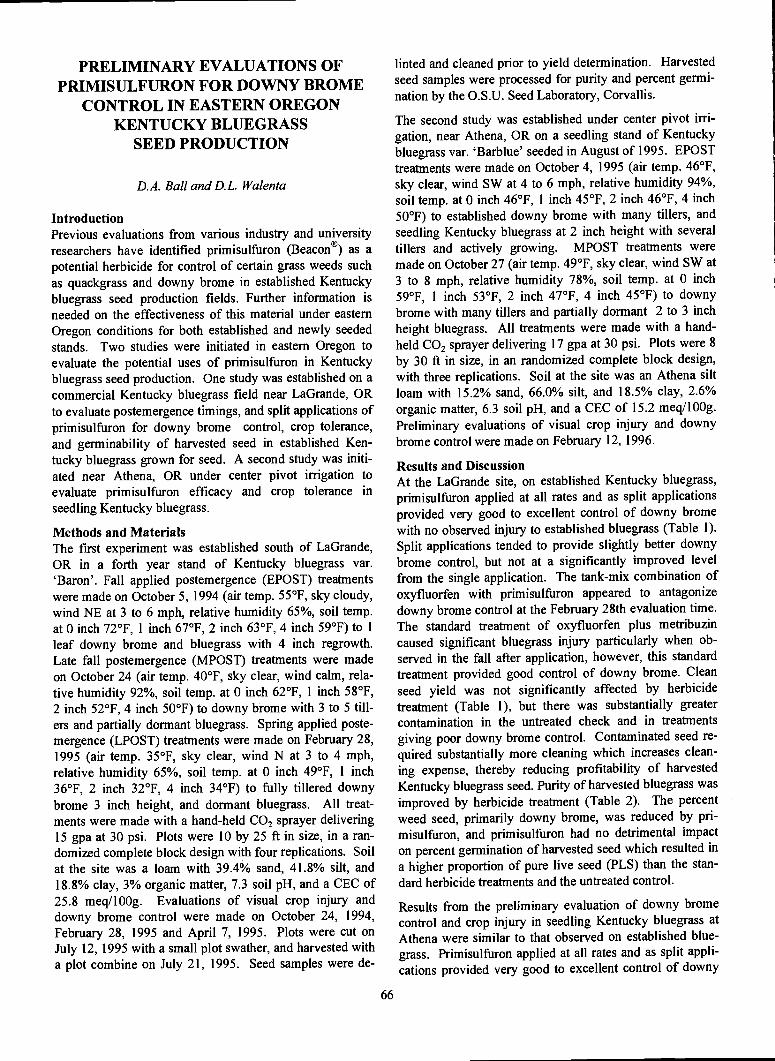
PRELIMINARY EVALUATIONS OFPRIMISULFURON FOR DOWNY BROME
CONTROL IN EASTERN OREGONKENTUCKY BLUEGRASS
SEED PRODUCTION
D.A. Ball and D.L. Walenta
IntroductionPrevious evaluations from various industry and universityresearchers have identified primisulfuron (Beacon®) as apotential herbicide for control of certain grass weeds suchas quackgrass and downy brome in established Kentuckybluegrass seed production fields. Further information isneeded on the effectiveness of this material under easternOregon conditions for both established and newly seededstands. Two studies were initiated in eastern Oregon toevaluate the potential uses of primisulfuron in Kentuckybluegrass seed production. One study was established on acommercial Kentucky bluegrass field near LaGrande, ORto evaluate postemergence timings, and split applications ofprimisulfuron for downy brome control, crop tolerance,and germinability of harvested seed in established Ken-tucky bluegrass grown for seed. A second study was initi-ated near Athena, OR under center pivot irrigation toevaluate primisulfuron efficacy and crop tolerance in
seedling Kentucky bluegrass.
Methods and MaterialsThe first experiment was established south of LaGrande,OR in a forth year stand of Kentucky bluegrass var.'Baron'. Fall applied postemergence (EPOST) treatmentswere made on October 5, 1994 (air temp. 55°F, sky cloudy,wind NE at 3 to 6 mph, relative humidity 65%, soil temp.at 0 inch 72°F, 1 inch 67°F, 2 inch 63°F, 4 inch 59°F) to Ileaf downy brome and bluegrass with 4 inch regrowth.Late fall postemergence (MPOST) treatments were madeon October 24 (air temp. 40°F, sky clear, wind calm, rela-tive humidity 92%, soil temp. at 0 inch 62°F, 1 inch 58°F,2 inch 52°F, 4 inch 50°F) to downy brome with 3 to 5 till-ers and partially dormant bluegrass. Spring applied poste-mergence (LPOST) treatments were made on February 28,1995 (air temp. 35°F, sky clear, wind N at 3 to 4 mph,relative humidity 65%, soil temp. at 0 inch 49°F, 1 inch36°F, 2 inch 32°F, 4 inch 34°F) to fully tillered downybrome 3 inch height, and dormant bluegrass. All treat-ments were made with a hand-held CO2 sprayer delivering15 gpa at 30 psi. Plots were 10 by 25 ft in size, in a ran-domized complete block design with four replications. Soilat the site was a loam with 39.4% sand, 41.8% silt, and18.8% clay, 3% organic matter, 7.3 soil pH, and a CEC of25.8 meq/lOOg. Evaluations of visual crop injury anddowny brome control were made on October 24, 1994,February 28, 1995 and April 7, 1995. Plots were cut onJuly 12, 1995 with a small plot swather, and harvested witha plot combine on July 21, 1995. Seed samples were de-
66
linted and cleaned prior to yield determination. Harvestedseed samples were processed for purity and percent germi-nation by the O.S.U. Seed Laboratory, Corvallis.
The second study was established under center pivot irri-gation, near Athena, OR on a seedling stand of Kentuckybluegrass var. 'Barblue' seeded in August of 1995. EPOSTtreatments were made on October 4, 1995 (air temp. 46°F,sky clear, wind SW at 4 to 6 mph, relative humidity 94%,soil temp. at 0 inch 46°F, 1 inch 45°F, 2 inch 46°F, 4 inch50°F) to established downy brome with many tillers, andseedling Kentucky bluegrass at 2 inch height with severaltillers and actively growing. MPOST treatments weremade on October 27 (air temp. 49°F, sky clear, wind SW at3 to 8 mph, relative humidity 78%, soil temp. at 0 inch59°F, 1 inch 53°F, 2 inch 47°F, 4 inch 45°F) to downybrome with many tillers and partially dormant 2 to 3 inchheight bluegrass. All treatments were made with a hand-held CO2 sprayer delivering 17 gpa at 30 psi. Plots were 8by 30 ft in size, in an randomized complete block design,with three replications. Soil at the site was an Athena siltloam with 15.2% sand, 66.0% silt, and 18.5% clay, 2.6%organic matter, 6.3 soil pH, and a CEC of 15.2 meq/lOOg.Preliminary evaluations of visual crop injury and downybrome control were made on February 12, 1996.
Results and DiscussionAt the LaGrande site, on established Kentucky bluegrass,primisulfuron applied at all rates and as split applicationsprovided very good to excellent control of downy bromewith no observed injury to established bluegrass (Table 1).Split applications tended to provide slightly better downybrome control, but not at a significantly improved levelfrom the single application. The tank-mix combination ofoxyfluorfen with primisuiftiron appeared to antagonizedowny brome control at the February 28th evaluation time.The standard treatment of oxyfluorfen plus metribuzincaused significant bluegrass injury particularly when ob-served in the fall after application, however, this standardtreatment provided good control of downy brome. Cleanseed yield was not significantly affected by herbicidetreatment (Table 1), but there was substantially greatercontamination in the untreated check and in treatmentsgiving poor downy brome control. Contaminated seed re-quired substantially more cleaning which increases clean-ing expense, thereby reducing profitability of harvestedKentucky bluegrass seed. Purity of harvested bluegrass wasimproved by herbicide treatment (Table 2). The percentweed seed, primarily downy brome, was reduced by pri-misulfuron, and primisulfuron had no detrimental impacton percent germination of harvested seed which resulted ina higher proportion of pure live seed (PLS) than the stan-dard herbicide treatments and the untreated control.
Results from the preliminary evaluation of downy bromecontrol and crop injury in seedling Kentucky bluegrass atAthena were similar to that observed on established blue-grass. Primisulfuron applied at all rates and as split appli-
cations provided very good to excellent control of downy
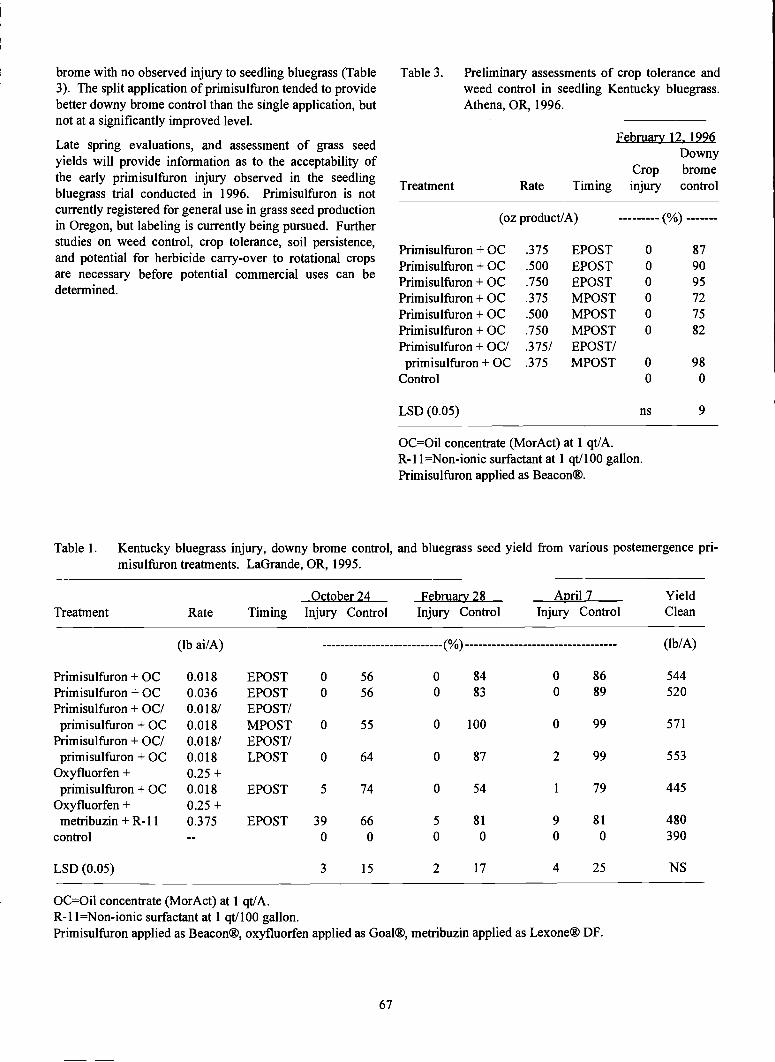
brome with no observed injury to seedling bluegrass (Table3). The split application of primisulfuron tended to providebetter downy brome control than the single application, butnot at a significantly improved level.
Late spring evaluations, and assessment of grass seedyields will provide information as to the acceptability ofthe early primisulfuron injury observed in the seedlingbluegrass trial conducted in 1996. Primisulfuron is notcurrently registered for general use in grass seed productionin Oregon, but labeling is currently being pursued. Furtherstudies on weed control, crop tolerance, soil persistence,and potential for herbicide carry-over to rotational cropsare necessary before potential commercial uses can bedetermined.
Table 3. Preliminary assessments of crop tolerance andweed control in seedling Kentucky bluegrass.Athena, OR, 1996.
February 12. 1996
OC=Oil concentrate (MorAct) at 1 qt/A.R- 1 1=Non-ionic surfactant at 1 qt/l 00 gallon.Primisulfuron applied as Beacon®.
Table 1. Kentucky bluegrass injury, downy brome control, and bluegrass seed yield from various postemergence pri-misulfuron treatments. LaGrande, OR, 1995.
October 24Treatment Rate Timing Injury Control
Primisulfuron + OCPrimisulfuron + OCPrimisulfuron + OC/primisulfuron + OC
Primisulfuron + OC/primisulfuron + OC
Oxyfluorfen +primisulfiiron + OC
Oxyfluorfen +metribuzin + R- 11
control
LSD (0.05)
0.0 180.0360.018/0.0180.0 18/0.0180.25 +0.0180.25 +0.375
EPOST 0 56EPOST 0 56EPOST/
MPOST 0 55
EPOST!LPOST 0 64
EPOST 5 74
EPOST 39 660 0
3 15
February 28Injury Control
0 840 83
0 100
0 87
0 54
5 81
0 0
2 17
April 7Injury Control
0 86o 89
o 99
2 99
1 79
9 81
0 0
4 25
OC=Oil concentrate (MorAct) at 1 qt/A.R-1 l=Non-ionic surfactant at 1 qt/100 gallon.Primisulfuron applied as Beacon®, oxyfluorfen applied as Goal®, metribuzin applied as Lexone® DF.
67
YieldClean
(lb/A)
544520
571
553
445
480390
NS
Treatment Rate TimingCropinjury
Downybromecontrol
(oz product/A) (%)
Primisulfuron + OC .375 EPOST 0 87Primisulfuron + OC .500 EPOST 0 90Primisulfuron + OC .750 EPOST 0 95Primisulfuron + OC .375 MPOST 0 72Primisulfuron + OC .500 MPOST 0 75Primisulfuron + OC .750 MPOST 0 82
Primisulfuron + OC! .375/ EPOST!primisulfuron + OC .375 MPOST 0 98
Control 0 0
LSD (0.05) ns 9
(%)(lb ai/A)
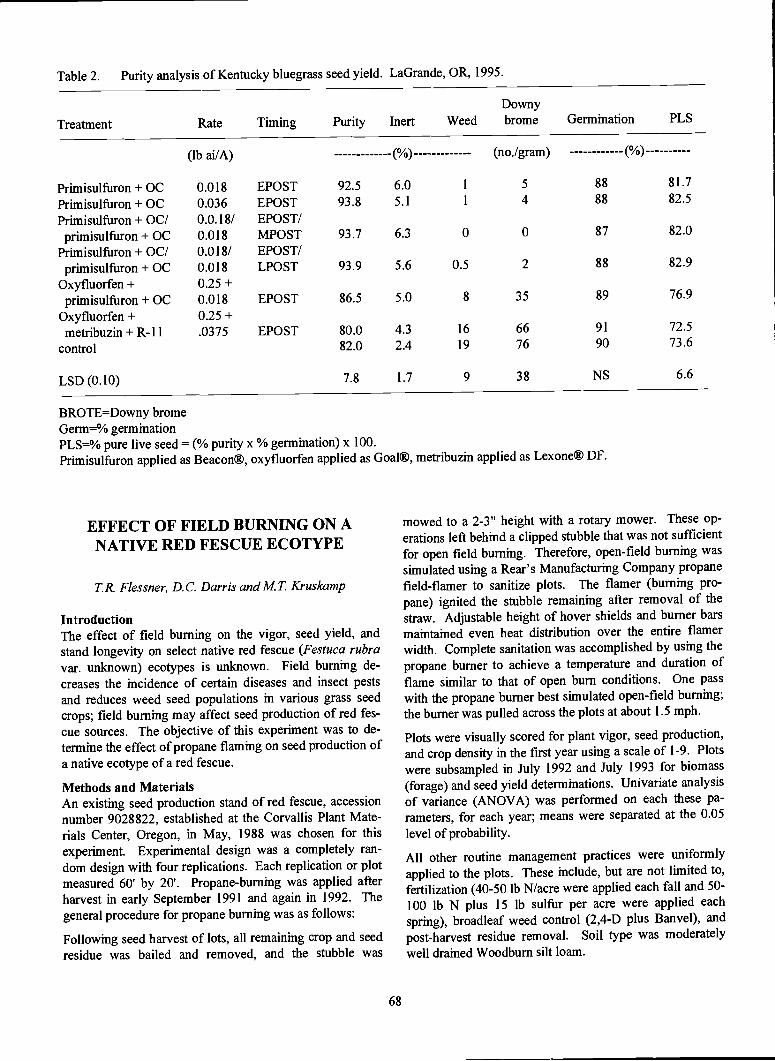
Table 2. Purity analysis of Kentucky bluegrass seed yield. LaGrande, OR, 1995.
Primisulfuron + OCPrimisulfuron + OCPrimisulfuron + OC/primisulfuron + OC
Primisulfuron + OCtprimisulfuron + OC
Oxyfluorfen +primisulfuron + OC
Oxyfluorfen +metribuzin + R- 11
control
LSD (0.10)
0.018 EPOST 92.5 6.0
0.036 EPOST 93.8 5.1
0.0.18/ EPOST/0.018 MPOST 93.7 6.3
0.018/ EPOST/0.018 LPOST 93.9 5.6
0.25 +0.018 EPOST 86.5 5.0
0.25 +.0375 EPOST 80.0 4.3
82.0 2.4
7.8 1.7
BROTE=Downy bromeGenn=r% germinationPLS=% pure live seed = (% purity x % germination) x 100.Primisulfuron applied as Beacon®, oxyfluorfen applied as Goal®, metribuzin applied as Lexone® DF.
EFFECT OF FIELD BURNING ON ANATIVE RED FESCUE ECOTYPE
TR. Flessner, D.C. Darns and MT. Kruskamp
IntroductionThe effect of field burning on the vigor, seed yield, andstand longevity on select native red fescue (Festuca rubravar. unknown) ecotypes is unknown. Field burning de-creases the incidence of certain diseases and insect pestsand reduces weed seed populations in various grass seedcrops; field burning may affect seed production of red fes-cue sources. The objective of this experiment was to de-termine the effect of propane flaming on seed production ofa native ecotype of a red fescue.
Methods and MaterialsAn existing seed production stand of red fescue, accessionnumber 9028822, established at the Corvallis Plant Mate-rials Center, Oregon, in May, 1988 was chosen for thisexperiment. Experimental design was a completely ran-dom design with four replications. Each replication or plotmeasured 60' by 20'. Propane-burning was applied afterharvest in early September 1991 and again in 1992. Thegeneral procedure for propane burning was as follows:
Following seed harvest of lots, all remaining crop and seedresidue was bailed and removed, and the stubble was
68
mowed to a 2-3" height with a rotary mower. These op-erations left behind a clipped stubble that was not sufficientfor open field burning. Therefore, open-field burning wassimulated using a Rear's Manufacturing Company propanefield-flamer to sanitize plots. The flamer (burning pro-pane) ignited the stubble remaining after removal of thestraw. Adjustable height of hover shields and burner barsmaintained even heat distribution over the entire flamerwidth. Complete sanitation was accomplished by using thepropane burner to achieve a temperature and duration offlame similar to that of open burn conditions. One passwith the propane burner best simulated open-field burning;the burner was pulled across the plots at about 1.5 mph.
Plots were visually scored for plant vigor, seed production,and crop density in the first year using a scale of 1-9. Plotswere subsampled in July 1992 and July 1993 for biomass(forage) and seed yield determinations. Univariate analysisof variance (ANOVA) was performed on each these pa-rameters, for each year; means were separated at the 0.05
level of probability.
All other routine management practices were uniformlyapplied to the plots. These include, but are not limited to,fertilization (40-50 lb N/acre were applied each fall and 50-100 lb N plus 15 lb sulfur per acre were applied each
spring), broadleaf weed control (2,4-D plus Banvel), and
post-harvest residue removal. Soil type was moderatelywell drained Woodbum silt loam.
Downy
Treatment Rate Timing Purity Inert Weed brome Germination PLS
(lb ai/A) (%) (no./gram) (%)
1 5 88 81.7
1 4 88 82.5
0 0 87 82.0
0.5 2 88 82.9
8 35 89 76.9
16 66 91 72.5
19 76 90 73.6
9 38 NS 6.6

Results and DiscussionPropane burning in 1991 increased plant vigor and seedproduction in 1992 (Table 1). However, propane-burningdid not affect stand density, but did reduce stand biomass.In 1993, propane-burning (in 1992) increased both biomassand seed production (Table 1). These results are consistentwith those observed in creeping red fescue and chewingsfescue seed production fields (Youngberg, 1980).
Table 1. Effect of propane burning on mean stand characteristics and seed production of native red fescue at the Corval-lis Plant Materials Center, Oregon, in 1992 and 1993.
'Scale 1-9 (1=best, 9=worst), July 1992.2Paired means denoted by different letters are different at alpha0.05.
SEED YIELD RESPONSE OF BLUEWILDRYE TO BURNING WITH A
PROPANE FLAMER
D.C. Darns, W. C. Young 111 and MT. Kruskamp
IntroductionBlue wildiye (Elymus glaucus Buckl.) is indigenous to thePacific Northwest USA and is being produced commer-cially on a small scale for revegetation and other specialpurpose plantings. However, little infonnation is availableon seed production technology, including post-harvest resi-due management. Field burning for sanitation and residueremoval is a traditional practice for many species of intro-duced grasses, but its effect on seed production of bluewildrye is unknown. In order to evaluate thermal andnonthermal treatments, two experiments were conducted tocompare the seed yield response of blue wildrye to simu-lated open field burning (propane flaming) versus me-chanical residue removal (baling and/or mowing).
Methods and MaterialsExperiment 1. Three stands of blue wildrye [accessions9019633 ('Arlington'), 9019643 and 9019678] at the Plant
Visual evaluations'
69
Until other residue management methods are tested, it isapparent that propane-burning increases seed yields at leastfor one source of native red fescue and should berecommended over a bale-and-mow method.
Literature CitedYoungberg, H. 1980. Techniques of seed production in
Oregon. p. 203-2 13. In P.D. Hebblethwaite (ed.) Seedproduction. Butterworths, London.
Materials Center (PMC), Corvallis, Oregon, were utilizedfor the study. Fields were established in May 1986(Arlington) and April 1987. All fields were treated uni-formly, including 12 inch row spacing, fertilization (20-50lb N/a in the fall and 100 lb N/a split applied in the spring,and broadleaf weed control using 2,4-D and dicamba. Ex-perimental design was a randomized completed block, withthe three accessions representing the three blocks. Fourtreatments were applied: (1) bale and burn, (2) bale andmow, (3) bale, mow and burn, and (4) bale only (control).Each plot measured 18 feet wide by 200 feet long.
Following seed harvest of the research plots (early July1988), all remaining crop and seed residue was baled andremoved within one week. The operation leaves behind astanding stubble of 9-12 inches. In addition, plots specifiedas "mow" treatments were clipped to a height of 2-3 inchesusing a rotary mower immediately after baling. In eithercase, the amount of residue remaining is insufficient toallow for open burning. Therefore, open-field burning wassimulated using a Rear's Mfg. Co. propane field flamer tosanitize plots. The flamer (burning propane) ignites thestubble remaining after removal of the straw. Adjustableheight of hover shields and burner bars maintains even heatdistribution over the entire flamer width. Complete sanita-
Stand Seed Crop Total SeedYear Treatment vigor production density biomass yield
1991 Burned 5a2 433b
1991 Unburned 7b 733a 100b
1992 Burned 300a
1992 Unburned 100b
(1-9) (lb/A)

tion is accomplished (simulated open field burn) by usingthe propane burner to achieve a temperature and durationof flame similar to that of open burn conditions. Accordingto previous experiments, simulation of open field burningis best accomplished with a single pass of a tractor-pulledpropane flamer at about 1.5 mph. Thermal treatments forthis experiment were completed September 13, 1988.
All plots were sampled for seed yield at maturity andvisually scored for "injury" on June 22, 1989. Three, 10square foot subsamples were collected per plot. One-wayanalysis of variance was performed on both variables andmeans separated by Fisher's Protected LSD test.
Experiment 2. An existing stand of Arlington blue wildrye,established in September 1988 at the Corvallis PMC, wasused for the study. Management practices were the same asdescribed for experiment 1. All plots were harvested forseed in June 1992 and the standing stubble baled and thenmowed to a height of 2-3 inches immediately thereafter.Experimental design consisted of completely randomizedplots with four replications. Two treatments were applied,burned and unburned; plots measured 18 feet wide by 60feet long. The burn treatment was applied on September 8,1992. The unburned plots constituted the control. Openfield burning was simulated using the same propane flamerdescribed above, except ground speed was faster (4-5mph).
At maturity, total above ground plant biomass was deter-mined by a single clipping of all above ground foliage andculms at a height of 1 inch within three 13.3 square footsubsamples per plot. Seed yield was measured by handharvesting three, 10 square foot sample areas within eachplot (July 1993). One-way analysis of variance was per-formed on both variables and the means were comparedwith a two-tailed T-test.
Results and DiscussionIn experiment 1, burning of blue wildrye had no significanteffect on seed yield when compared to nonthermal treat-ments (Table 1). However, there was a significant differ-ence in visual stand "injury" in the spring proceding har-vest. Lower ratings were a reflection of crown damage andwhole plant mortality in both burned treatments. Little ifany "injury" was observed in unburned plots, yet seedyields were not affected. This suggests that even thoughburned plots had greater injury (for example, lower standpopulations due to higher mortality) seed production mayhave been compensated for by other components of yieldsuch as higher numbers of fertile tillers per plant, fertileflorets per spike, seed weight, etc.
In terms of seed yield, the results of experiment 2 werecomparable, with no significant difference found betweenburned and unburned treatments. There was no differencein above ground biomass either (Table 2).
70
Treatment
bale and burnbale (control)bale, mow and burnbale and mow
1 Visual evaluations; scale 1-9 (1 =best, 9=worst).2 in columns followed by the same letter are notsignificantly different by Fisher's protected LSD values(P=0.05).
Table 2. Seed yield and biomass of blue wildrye in re-sponse to a thermal versus a nonthermal resi-due removal treatment. Experiment 2, 1993.
Seed yield
(lb/A)
593 a2574 a563 a479 a
(lbs/A)
Stand injury'
(1-9)
5.7 a2.3 b5.7 a2.7 b
For both experiments, field burning occurred approxi-mately two months after harvest. Minor plant recovery wasobserved prior to flaming, especially in the first experi-ment, which could have affected results. Any improvementin seed yield from burning may have been diminished bypotential crop damage. Additional studies of blue wildryeare required to determine the effect that timing of theburning after harvest may have on the total as well as indi-vidual components of seed yield. However, until more in-formation is known, burning of blue wildrye to increaseseed production is not recommended.
OPTIMAL FORAGE REMOVAL TIMEFOR RED CLOVER SEED PRODUCTION
if. Steiner, J.A. Leffel, G.A. Gingrich andS. Aldrich-Markham
A significant portion of the USA certified red clover seedcrop is produced in western Oregon and Washington.However, even larger amounts of uncertified common cul-tivars are produced in this same western region as well asIllinois, Indiana, Missouri, Ohio, Wisconsin, and central
bale and mow 411 3100bale, mow and burn 354 3596
NS NS
Table 1. Seed yield and stand "injury" of blue wildryein response to thermal and nonthermal residueremoval treatments. Experiment 1, 1989.
Treatment Seed yield Plant biomass
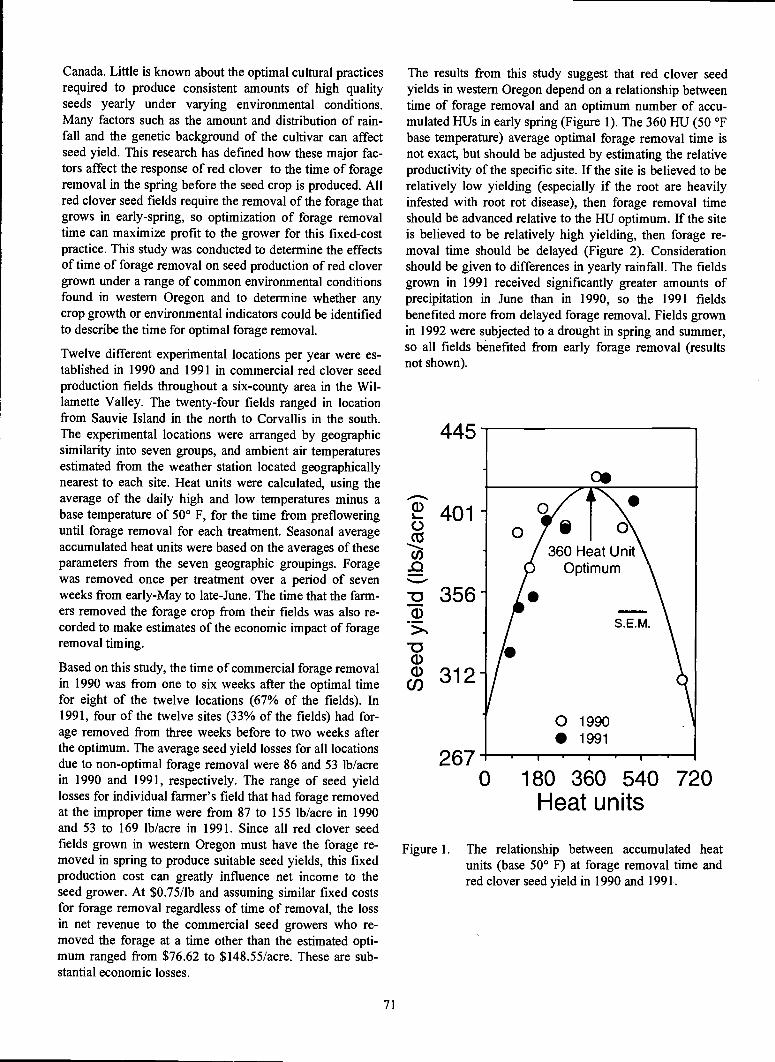
Canada. Little is known about the optimal cultural practicesrequired to produce consistent amounts of high qualityseeds yearly under varying environmental conditions.Many factors such as the amount and distribution of rain-fall and the genetic background of the cultivar can affectseed yield. This research has defined how these major fac-tors affect the response of red clover to the time of forageremoval in the spring before the seed crop is produced. Allred clover seed fields require the removal of the forage thatgrows in early-spring, so optimization of forage removaltime can maximize profit to the grower for this fixed-costpractice. This study was conducted to determine the effectsof time of forage removal on seed production of red clovergrown under a range of common environmental conditionsfound in western Oregon and to determine whether anycrop growth or environmental indicators could be identifiedto describe the time for optimal forage removal.
Twelve different experimental locations per year were es-tablished in 1990 and 1991 in commercial red clover seedproduction fields throughout a six-county area in the Wil-lamette Valley. The twenty-four fields ranged in locationfrom Sauvie Island in the north to Corvallis in the south.The experimental locations were arranged by geographicsimilarity into seven groups, and ambient air temperaturesestimated from the weather station located geographicallynearest to each site. Heat units were calculated, using theaverage of the daily high and low temperatures minus abase temperature of 500 F, for the time from prefloweringuntil forage removal for each treatment. Seasonal averageaccumulated heat units were based on the averages of theseparameters from the seven geographic groupings. Foragewas removed once per treatment over a period of sevenweeks from early-May to late-June. The time that the farm-ers removed the forage crop from their fields was also re-corded to make estimates of the economic impact of forageremoval timing.
Based on this study, the time of commercial forage removalin 1990 was from one to six weeks after the optimal timefor eight of the twelve locations (67% of the fields). In1991, four of the twelve sites (33% of the fields) had for-age removed from three weeks before to two weeks afterthe optimum. The average seed yield losses for all locationsdue to non-optimal forage removal were 86 and 53 lb/acrein 1990 and 1991, respectively. The range of seed yieldlosses for individual farmer's field that had forage removedat the improper time were from 87 to 155 lb/acre in 1990and 53 to 169 lb/acre in 1991. Since all red clover seedfields grown in western Oregon must have the forage re-moved in spring to produce suitable seed yields, this fixedproduction cost can greatly influence net income to theseed grower. At $0.75/lb and assuming similar fixed costsfor forage removal regardless of time of removal, the lossin net revenue to the commercial seed growers who re-moved the forage at a time other than the estimated opti-mum ranged from $76.62 to $148.55/acre. These are sub-stantial economic losses.
71
The results from this study suggest that red clover seedyields in western Oregon depend on a relationship betweentime of forage removal and an optimum number of accu-mulated HUs in early spring (Figure 1). The 360 HU (50 °Fbase temperature) average optimal forage removal time isnot exact, but should be adjusted by estimating the relativeproductivity of the specific site. If the site is believed to berelatively low yielding (especially if the root are heavilyinfested with root rot disease), then forage removal timeshould be advanced relative to the HU optimum. If the siteis believed to be relatively high yielding, then forage re-moval time should be delayed (Figure 2). Considerationshould be given to differences in yearly rainfall. The fieldsgrown in 1991 received significantly greater amounts ofprecipitation in June than in 1990, so the 1991 fieldsbenefited more from delayed forage removal. Fields grownin 1992 were subjected to a drought in spring and summer,so all fields benefited from early forage removal (resultsnot shown).
445
c0*10360 Heat Unit
Optimum
S.E.M.
o 19901991
2670 180 360 540 720
Heat units
Figure 1. The relationship between accumulated heatunits (base 500 F) at forage removal time andred clover seed yield in 1990 and 1991.

The genetic background of the cultivar may affect the seedyield response to time of forage removal. The average seedyield productivity of fields of named improved cultivarsdid not interact with the time of forage removal (Figure 3).However, Oregon-adapted common ecotypes did, so thegeneral productivity of each seed field should be consid-ered when deciding to remove the forage crop.
Specific crop indicators still need to be identified to predictaverage location productivity before the time of forageremoval. Preferably, the best time for this would be in thefall so the farmer could determine whether a field should be
712
0
356T
Ci) 178
0o 178 356 534 712 0 178 356 534 712
Average location seed yield (lbs/ac)
Figure 2. The effect of early-may and late-June forage removal time on red clover grown at twelve different fields in1990 and 1991 that range in average field seed yield at each location.
72
left in production for the next year or to change crops. Thisresearch is probably not applicable to irrigated regions ofeastern Oregon and Washington.
For a more detailed report of this research see: J.J. Ste-iner, .J.A. Leffel, G. Gingrich, and S. Aldrich-Markham.1995. Red Clover Seed Production: III. Effect of forageremoval time under varied environments. Crop Science35:1667-1675; or write to Jeffrey Steiner, National ForageSeed Production Research Center, USDA-ARS, 3450 SWCampus Way, Corvallis, OR 97331.
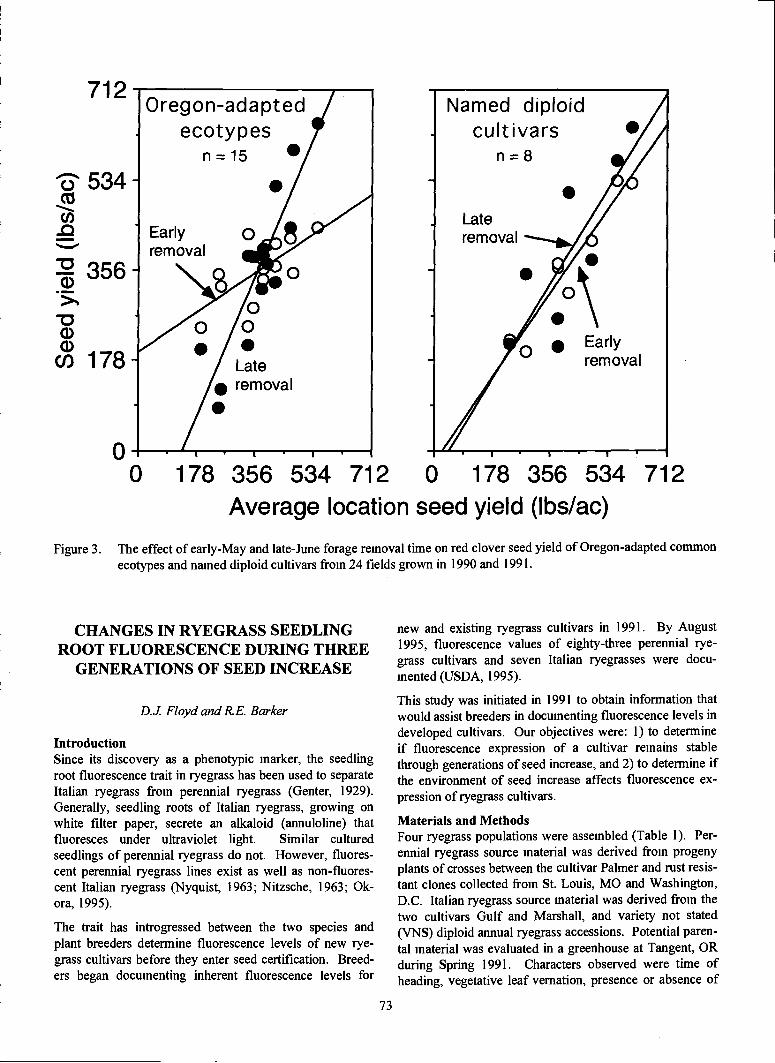
712
I I
CHANGES IN RYEGRASS SEEDLINGROOT FLUORESCENCE DURING THREE
GENERATIONS OF SEED INCREASE
Di. Floyd and R.E. Barker
IntroductionSince its discovery as a phenotypic marker, the seedlingroot fluorescence trait in ryegrass has been used to separateItalian ryegrass from perennial ryegrass (Genter, 1929).Generally, seedling roots of Italian ryegrass, growing onwhite filter paper, secrete an alkaloid (annuloline) thatfluoresces under ultraviolet light. Similar culturedseedlings of perennial ryegrass do not. However, fluores-cent perennial ryegrass lines exist as well as non-fluores-cent Italian ryegrass (Nyquist, 1963; Nitzsche, 1963; Ok-ora, 1995).
The trait has introgressed between the two species andplant breeders determine fluorescence levels of new rye-grass cultivars before they enter seed certification. Breed-ers began documenting inherent fluorescence levels for
73
o 178 356 534 712 0 178 356 534 712Average location seed yield (lbs/ac)
Figure 3. The effect of early-May and late-June forage removal time on red clover seed yield of Oregon-adapted commonecotypes and named diploid cultivars from 24 fields grown in 1990 and 1991.
new and existing ryegrass cultivars in 1991. By August1995, fluorescence values of eighty-three perennial rye-grass cultivars and seven Italian ryegrasses were docu-mented (USDA, 1995).
This study was initiated in 1991 to obtain information thatwould assist breeders in documenting fluorescence levels indeveloped cultivars. Our objectives were: 1) to determineif fluorescence expression of a cultivar remains stablethrough generations of seed increase, and 2) to determine ifthe environment of seed increase affects fluorescence ex-pression of ryegrass cultivars.
Materials and MethodsFour ryegrass populations were assembled (Table 1). Per-ennial ryegrass source material was derived from progenyplants of crosses between the cultivar Palmer and rust resis-tant clones collected from St. Louis, MO and Washington,D.C. Italian ryegrass source material was derived from thetwo cultivars Gulf and Marshall, and variety not stated(VNS) diploid annual ryegrass accessions. Potential paren-tal material was evaluated in a greenhouse at Tangent, ORduring Spring 1991. Characters observed were time ofheading, vegetative leaf vernation, presence or absence of

floral awns, and glume length (Nittler and Kenny, 1972;Tutm et al., 1980). Parents were placed into each of fourpopulations based on simultaneous heading times and/orsimilar vegetative and generative morphology (Table 1).Population 1 had ten parental clones and population 2 hadnine. They were phenotypically perennial ryegrass withone and two parents being fluorescent variants in the twopopulations, respectively. Population 3 represented anintermediate phenotype between perennial and Italianryegrass. It was composed of ten parents; seven of whichwere fluorescent types. Population 4 was composed of sixparents possessing Italian ryegrass phenotype; five parentsbeing non-fluorescent variants.
Six ramets of each parent were transplanted in randomizedcomplete block (RCB) designs at experiment stations ofOregon State University at Aurora, Corvallis, and Madras.The experimental plots for the two western Oregon loca-tions were established in November 1991. The plots inCentral Oregon (Madras) were established in April 1992.Seed was harvested from each population at each locationin June/July 1992. For the next two succeeding seasons,direct seeded rows were established in RCB experimentaldesigns at the western Oregon locations. Seed of eachpopulation was increased separately and in isolation fromeach other either by pollen barrier or distance in the field.Progressive generations of increase at Madras continued tobe established by transplanted seedlings. At all locations,representative seed from the Syn 1 (1992) harvest wassown for the 1993 generation and seed from the Syn 2(1993) harvest was sown for the Syn 3 (1994) generation.Cereal grains were used each year as a pollination barrierbetween populations at the western Oregon sites. A mini-mum of 70 m physical distance was used each year atMadras. Plots at Madras were irrigated weekly to maintainplant turgor and overall vigor. Supplemental irrigation wasnot necessary for the western Oregon sites.
As seed from each generation was harvested, it was handthreshed, cleaned, weighed, and placed in cold storage.Germination and fluorescence tests were conducted onsamples representing all populations for each location foreach of three years of increase. Each seed test was con-ducted twice beginning on September 15, 1994. Seed testswere conducted following the Association of Official SeedAnalysts (AOSA) guidelines (AOSA, 1994). Data wereanalyzed using the GLM procedure (SAS Institute, 1994).The statistical model considered populations, generations,and locations as fixed effects.
Results and DiscussionFluorescence level varied with generation and location ofincrease for each of the populations (Figure 1). Differencesamong populations were expected since they were pur-posely assembled with different base levels of fluores-cence. Except for population 3, fluorescence levels werehighest from seed produced at Corvallis.
74
There was significant location by generation interactionamong populations for fluorescence expression (Figure 1).Fluorescence of seed produced at Corvallis increased overthree generations in each of the four populations. Seedproduced at Aurora and Madras showed no significantchange in fluorescence levels over generations. Rumball(1970) in New Zealand monitored fluorescence expressionthrough seven generations of seed increase. He citednearly a one percent per generation increase in fluorescencefor a ryegrass cultivar.
It is not clear why location of increase has such a large im-pact on fluorescence level. A possibility may be pollencontamination from a concentration of commercial seedproduction fields of Italian ryegrass in southern WillametteValley. This contamination source may be higher thanrealized. It may also be that some locations provide agreater selection advantage for fluorescing genotypes in apopulation. Further research is needed to document theseconcerns. Future studies should accurately monitor differ-ences in climatological factors, especially weather condi-tions during flowering and seed maturation.
In general, commercial seed production of ryegrass doesnot exhibit such pronounced genotype X location (GxL)effects. Initial fluorescence values for cultivars, however,are usually lower for perennial ryegrass compared with theperennial ryegrass populations of this study. An accuratesurvey needs to be conducted among commercial cultivarssown at different locations from common seed stocksources to provide further information on GxL effects.
Conclusions1. Seedling root fluorescence level in ryegrass is
strongly affected by the location where seed is pro-duced, and the generation of seed increase.
2. The large genotype X environment interaction (GxE)reported here must be thoroughly examined. Furtherresearch is needed to determine:
Potential pollen contamination effects in rye-grass seed production.The possible selection advantage of fluorescentgenotypes in ryegrass populations.
3. Additional data collected from the present study willbe analyzed to help clarify questions related to GxE.These include:
Stand densities, mature plant height, and an-thesis dates for each population X locationcombination.Overall seed yield and 1000-seed weight foreach population.An assessment of soil type, structure, andavailable nutrient differences for each location.
4. Our results add evidence to help understand varia-tions in the seedling root fluorescence test. Fluores-cence used as a trait to characterize ryegrass cultivarsis questioned.

ReferencesAssociation of Official Seed Analysts. 1994. Rules for
testing seeds. J. Seed Technol. 16:14-15.
Genter, G. 1929. Ueber die Verwendbarkheit von ultra-violetten Strahien bei der Samenprufung. PraktischeBlatter f. Pflanzenbau u. Pflanzenschutz. 6:166-172.
Niftier, L.W., and T.J. Kenny. 1972. Distinguishing an-nual from perennial ryegrass. Agron. J. 64:767-768.
Nitzsche, W. 1963. Nichtfluoreszierendes Welsches wei-delgras (Lolium multflorum Lam.). Der Zuchier33:28 1-282.
Nyquist, W.E. 1963. Fluorescent perennial ryegrass. CropSci. 3:223-226.
Okora, J.O., C.E. Watson, and L.M. Gourley. 1995. Bo-tanical characteristics of fluorescent and non-fluorescentryegrass. p. 81. In Agronomy abstracts. ASA, Madi-son, WI.
75
Rumball, W. 1970. Changes in mean character and uni-formity of Lolium (perenne X multfiorum) var. 'Grass-lands Manawa' during seed increase. N,Z. J. Agric.Res. 13:605-615.
SAS Institute. 1994. SAS/STAT guide for personal com-puters. Version 6.10 ed. SAS Inst., Inc., Cary, NC.
Seed Regulatory and Testing Branch. 1995. Items of in-terest in seed control. USDA-AMS. U.S. Gov. Print.Office, Washington, D.C.
Tutin, T.G., V.11. Heywood, N.A. Burges, D.M. Moore,D.H. Valentine, S.M. Waiters, and D.A. Webb (ed.).1980. Flora Europaea. Vol. 5. Cambridge UniversityPress. Cambridge, U.K.
Acknowledgments: This research was supported in part byPickseed West, Inc., Tangent, OR. We are also thankful toPure Seed Testing, Inc., Hubbard, OR and Tangent SeedLab International, Tangent, OR for providing plants orseedlings used as parental stocks. In addition, technicaladvice was given by Drs. Jerry Pepin (Pickseed West, Inc.)and Virginia Lehman (Lofts Seed, Inc., Lebanon, OR.)

76
1 Leaf vemation was visually scored on expanding vegetative leaves: F=folded, R=rolled, Iintermediate2 Heading date was determined when one spike of the parental plant was emerged from boot.
3 Glume length was subjectively evaluated relative to the total spikelet length.* Half-sib family lines dropped from further increase from each population of all locations due to poor seed production in
1992.** Additional half-sib lines discarded from each population at Madras due to poor seed production in 1992.
Table 1. Parental description of four ryegrass populations.
Parental Leaf Fluorescence Greenhouse Presence Glume
designation vernation expression heading date of awns length
Population 1 (Constructed population base fluorescence 10.00%)
94-1 F May 23 no long
99-1 F May20 no long
l237** F June 1 no long
142-2 I + May 22 yes medium
152-1 F May20 no long
155-6 F May 23 no long
16015* F May 24 no long
171-5 F May 20 no long
176-2 F May24 no long
179-8 F June 1 no long
Population 2 (Constructed population base fluorescence = 22.22%)942** F + May 28 no long944* F - June 1 no long
123-3 F + May28 no long
152-8 F May 31 no long
155-2 F - May25 no long
160-4 F May22 no long
168-5 F May28 no long
176-1 F May28 no long
179-2 F June 1 no long
Population 3 (Constructed population base fluorescence 70.00%)
R + May 23 yes short
268* I + May 15 yes short
34-2 F - May21 no long
43-2 I + May 14 yes short
59-5 I + May 13 yes short
106-4 I May 12 yes medium
106-13 R May 13 yes long
112-9 I + May 13 yes medium
12614* R + May28 yes medium
14210** F + May20 yes long
Population 4 (Constructed population base fluorescence = 16.67%)228 F + May 28 yes long
4867 R May 13 yes short
4948 R May 31 yes short
5149 R May 31 yes medium
5182 R May 29 yes short
5304 R May 31 yes short
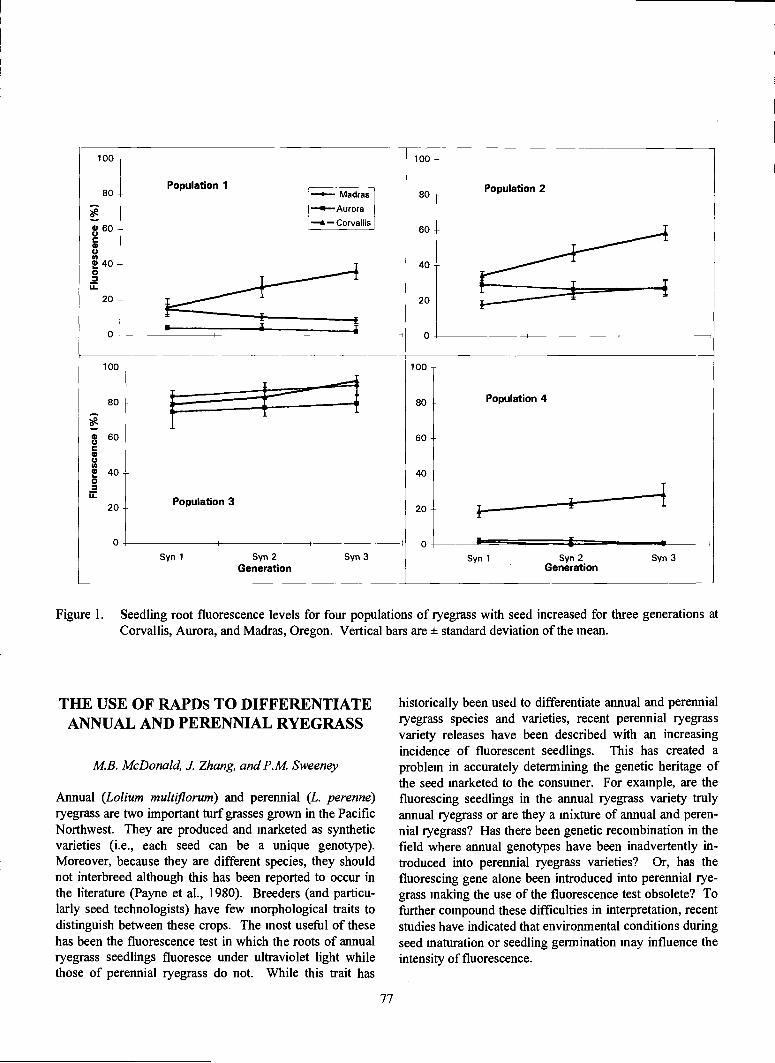
Figure 1. Seedling root fluorescence levels for four populations of ryegrass with seed increased for three generations atCorvallis, Aurora, and Madras, Oregon. Vertical bars are ± standard deviation of the mean.
THE USE OF RAPDs TO DIFFERENTIATEANNUAL AND PERENNIAL RYEGRASS
MB. McDonald, J. Zhang, and P.M Sweeney
Annual (Lolium multflorum) and perennial (L. perenne)ryegrass are two important turf grasses grown in the PacificNorthwest. They are produced and marketed as syntheticvarieties (i.e., each seed can be a unique genotype).Moreover, because they are different species, they shouldnot interbreed although this has been reported to occur inthe literature (Payne et al., 1980). Breeders (and particu-larly seed technologists) have few morphological traits todistinguish between these crops. The most useful of thesehas been the fluorescence test in which the roots of annualryegrass seedlings fluoresce under ultraviolet light whilethose of perennial ryegrass do not. While this trait has
77
historically been used to differentiate annual and perennialryegrass species and varieties, recent perennial ryegrassvariety releases have been described with an increasingincidence of fluorescent seedlings. This has created aproblem in accurately determining the genetic heritage ofthe seed marketed to the consumer. For example, are thefluorescing seedlings in the annual ryegrass variety trulyannual ryegrass or are they a mixture of annual and peren-nial ryegrass? Has there been genetic recombination in thefield where annual genotypes have been inadvertently in-troduced into perennial ryegrass varieties? Or, has thefluorescing gene alone been introduced into perennial rye-grass making the use of the fluorescence test obsolete? Tofurther compound these difficulties in interpretation, recentstudies have indicated that environmental conditions duringseed maturation or seedling germination may influence theintensity of fluorescence.
100
80Population 1
100
80 Population 2-e-- MadrasaAurora
- Corvallis 60-CaU
! 40 - 40 -0
20 - 20 -
0 I II 0
100 100
80 - _______________________________ 80 Population 4
60 60CaU'5 40 400
20
0
Population 3- 20 ___________________________________
- ------= -I 0Syn 1 Syn 2 Syn 3 Syn 1 Syn 2 Syn 3
Generation Generation
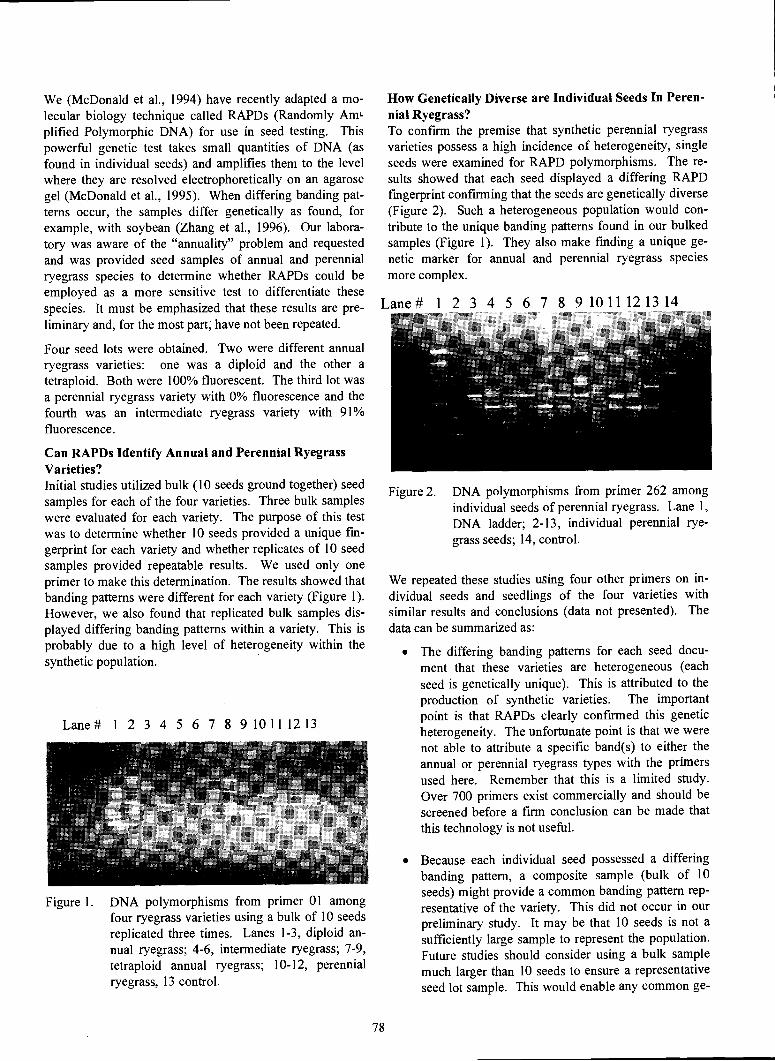
We (McDonald et al., 1994) have recently adapted a mo-lecular biology technique called RAPDs (Randomly Amplified Polymorphic DNA) for use in seed testing. Thispowerful genetic test takes small quantities of DNA (asfound in individual seeds) and amplifies them to the levelwhere they are resolved electrophoretically on an agarosegel (McDonald et al., 1995). When differing banding pat-terns occur, the samples differ genetically as found, forexample, with soybean (Zhang et al., 1996). Our labora-tory was aware of the "annuality" problem and requestedand was provided seed samples of annual and perennialryegrass species to determine whether RAPDs could beemployed as a more sensitive test to differentiate thesespecies. It must be emphasized that these results are pre-liminary and, for the most part; have not been repeated.
Four seed lots were obtained. Two were different annualryegrass varieties: one was a diploid and the other atetraploid. Both were 100% fluorescent. The third lot wasa perennial ryegrass variety with 0% fluorescence and thefourth was an intermediate ryegrass variety with 91%fluorescence.
Can RAPDs Identify Annual and Perennial RyegrassVarieties?Initial studies utilized bulk (10 seeds ground together) seedsamples for each of the four varieties. Three bulk sampleswere evaluated for each variety. The purpose of this testwas to determine whether 10 seeds provided a unique fin-gerprint for each variety and whether replicates of 10 seedsamples provided repeatable results. We used only oneprimer to make this determination. The results showed thatbanding patterns were different for each variety (Figure 1).However, we also found that replicated bulk samples dis-played differing banding patterns within a variety. This isprobably due to a high level of heterogeneity within thesynthetic population.
Lane# 1 2 3 4 5 6 7 8 910111213
Figure 1. DNA polymorphisms from primer 01 amongfour ryegrass varieties using a bulk of 10 seedsreplicated three times. Lanes 1-3, diploid an-nual ryegrass; 4-6, intermediate ryegrass; 7-9,tetraploid annual ryegrass; 10-12, perennialryegrass, 13 control.
78
How Genetically Diverse are Individual Seeds In Peren-nial Ryegrass?To confirm the premise that synthetic perennial ryegrassvarieties possess a high incidence of heterogeneity, singleseeds were examined for RAPD polymorphisms. The re-sults showed that each seed displayed a differing RAPDfingerprint confirming that the seeds are genetically diverse(Figure 2). Such a heterogeneous population would con-tribute to the unique banding patterns found in our bulkedsamples (Figure 1). They also make fmding a unique ge-netic marker for annual and perennial ryegrass speciesmore complex.
Lane# 1 2 3 4 5 6 7 8 91011121314
Figure 2. DNA polymorphisms from primer 262 amongindividual seeds of perennial ryegrass. Lane 1,DNA ladder; 2-13, individual perennial rye-grass seeds; 14, control.
We repeated these studies using four other primers on in-dividual seeds and seedlings of the four varieties withsimilar results and conclusions (data not presented). Thedata can be summarized as:
The differing banding patterns for each seed docu-ment that these varieties are heterogeneous (eachseed is genetically unique). This is attributed to theproduction of synthetic varieties. The importantpoint is that RAPDs clearly confirmed this geneticheterogeneity. The unfortunate point is that we werenot able to attribute a specific band(s) to either theannual or perennial ryegrass types with the primersused here. Remember that this is a limited study.Over 700 primers exist commercially and should bescreened before a firm conclusion can be made thatthis technology is not useful.
Because each individual seed possessed a differingbanding pattern, a composite sample (bulk of 10seeds) might provide a common banding pattern rep-resentative of the variety. This did not occur in ourpreliminary study. It may be that 10 seeds is not asufficiently large sample to represent the population.Future studies should consider using a bulk samplemuch larger than 10 seeds to ensure a representativeseed lot sample. This would enable any common ge-
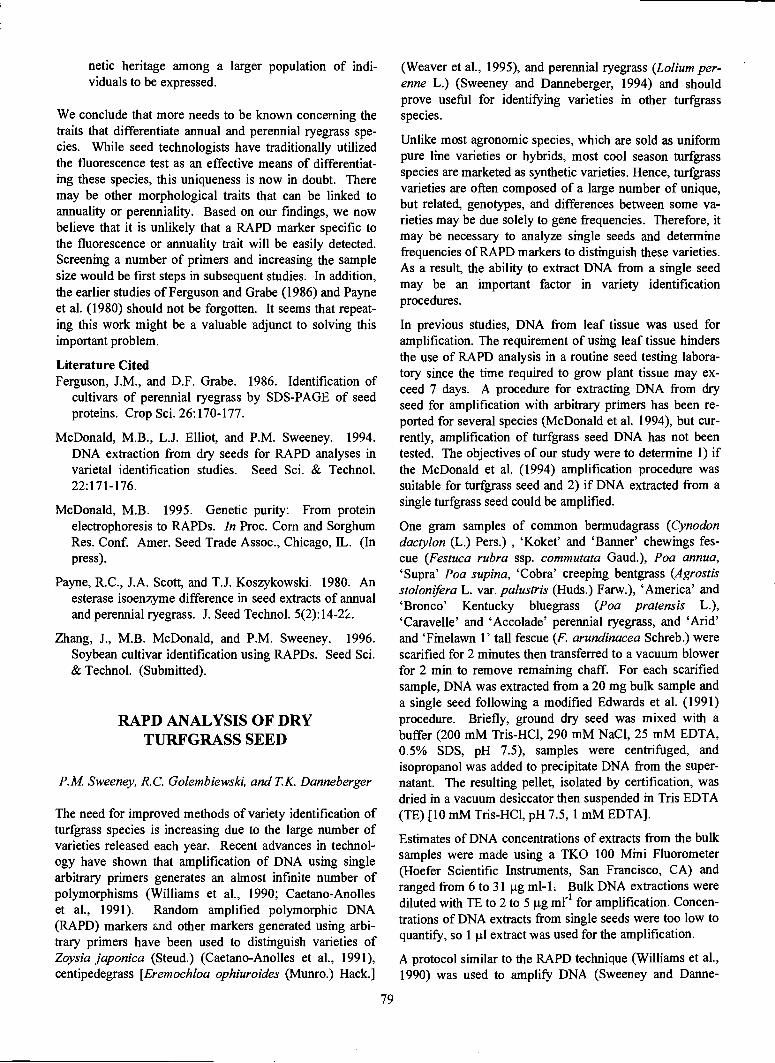
netic heritage among a larger population of indi-viduals to be expressed.
We conclude that more needs to be known concerning thetraits that differentiate annual and perennial ryegrass spe-cies. While seed technologists have traditionally utilizedthe fluorescence test as an effective means of differentiat-ing these species, this uniqueness is now in doubt. Theremay be other morphological traits that can be linked toannuality or perenniality. Based on our findings, we nowbelieve that it is unlikely that a RAPD marker specific tothe fluorescence or annuality trait will be easily detected.Screening a number of primers and increasing the samplesize would be first steps in subsequent studies. In addition,the earlier studies of Ferguson and Grabe (1986) and Payneet al. (1980) should not be forgotten. It seems that repeat-ing this work might be a valuable adjunct to solving thisimportant problem.
Literature CitedFerguson, J.M., and D.F. Grabe. 1986. Identification of
cultivars of perennial ryegrass by SDS-PAGE of seedproteins. Crop Sci. 26:170-177.
McDonald, M.B., L.J. Elliot, and P.M. Sweeney. 1994.DNA extraction from dry seeds for RAPD analyses invarietal identification studies. Seed Sci. & Technol.22:171-176.
McDonald, M.B. 1995. Genetic purity: From proteinelectrophoresis to RAPDs. In Proc. Corn and SorghumRes. Conf. Amer. Seed Trade Assoc., Chicago, IL. (Inpress).
Payne, R.C., J.A. Scott, and T.J. Koszykowski. 1980. Anesterase isoenzyme difference in seed extracts of annualand perennial ryegrass. J. Seed Technol. 5(2): 14-2k.
Zhang, J., M.B. McDonald, and P.M. Sweeney. 1996.Soybean cultivar identification using RAPDs. Seed Sci.& Technol. (Submitted).
RAPD ANALYSIS OF DRYTURFGRASS SEED
P.M Sweeney, R. C. Golembiewski, and TK. Danneberger
The need for improved methods of variety identification ofturfgrass species is increasing due to the large number ofvarieties released each year. Recent advances in technol-ogy have shown that amplification of DNA using singlearbitrary primers generates an almost infinite number ofpolymorphisms (Williams et al., 1990; Caetano-Anolleset al., 1991). Random amplified polymorphic DNA(RAPD) markers &nd other markers generated using arbi-trary primers have been used to distinguish varieties ofZoysia japonica (Steud.) (Caetano-Anolles et al., 1991),centipedegrass [Eremochloa ophiuroides (Munro.) Hack.]
79
(Weaver Ct al., 1995), and perennial ryegrass (Lolium per-enne L.) (Sweeney and Danneberger, 1994) and shouldprove useful for identifiing varieties in other turfgrassspecies.
Unlike most agronomic species, which are sold as uniformpure line varieties or hybrids, most cool season turfgrassspecies are marketed as synthetic varieties. Hence, turfgrassvarieties are often composed of a large number of unique,but related, genotypes, and differences between some va-rieties may be due solely to gene frequencies. Therefore, itmay be necessary to analyze single seeds and determinefrequencies of RAPD markers to distinguish these varieties.As a result, the ability to extract DNA from a single seedmay be an important factor in variety identificationprocedures.
In previous studies, DNA from leaf tissue was used foramplification. The requirement of using leaf tissue hindersthe use of RAPD analysis in a routine seed testing labora-tory since the time required to grow plant tissue may ex-ceed 7 days. A procedure for extracting DNA from dryseed for amplification with arbitrary primers has been re-ported for several species (McDonald et al. 1994), but cur-rently, amplification of turfgrass seed DNA has not beentested. The objectives of our study were to determine 1) ifthe McDonald et al. (1994) amplification procedure wassuitable for turfgrass seed and 2) if DNA extracted from asingle turfgrass seed could be amplified.
One gram samples of common bermudagrass (Cynodondaclylon (L.) Pers.) , 'Koket' and 'Banner' chewings fes-cue (Festuca rubra ssp. commutata Gaud.), Poa annua,'Supra' Poa supina, 'Cobra' creeping bentgrass (Agrostisstolonfera L. var. palustris (Huds.) Farw.), 'America' and'Bronco' Kentucky bluegrass (Poa pratensis L.),'Caravelle' and 'Accolade' perennial ryegrass, and 'Arid'and 'Finelawn 1' tall fescue (F. arundinacea Schreb.) werescarified for 2 minutes then transferred to a vacuum blowerfor 2 mm to remove remaining chaff. For each scarifiedsample, DNA was extracted from a 20 mg bulk sample anda single seed following a modified Edwards et al. (1991)procedure. Briefly, ground dry seed was mixed with abuffer (200 mM Tris-HC1, 290 mM NaCI, 25 mM EDTA,0.5% SDS, pH 7.5), samples were centrifuged, andisopropanol was added to precipitate DNA from the super-natant. The resulting pellet, isolated by certification, wasdried in a vacuum desiccator then suspended in Tris EDTA(TE) [10 mM Tris-HC1, pH 7.5, 1 mM EDTA].
Estimates of DNA concentrations of extracts from the bulksamples were made using a TKO 100 Mini Fluorometer(Hoefer Scientific Instruments, San Francisco, CA) andranged from 6 to 31 .tg ml- 1. Bulk DNA extractions werediluted with TE to 2 to 5 ig ml' for amplification. Concen-trations of DNA extracts from single seeds were too low toquantify, so 1 .t1 extract was used for the amplification.
A protocol similar to the RAPD technique (Williams et al.,1990) was used to amplify DNA (Sweeney and Danne-
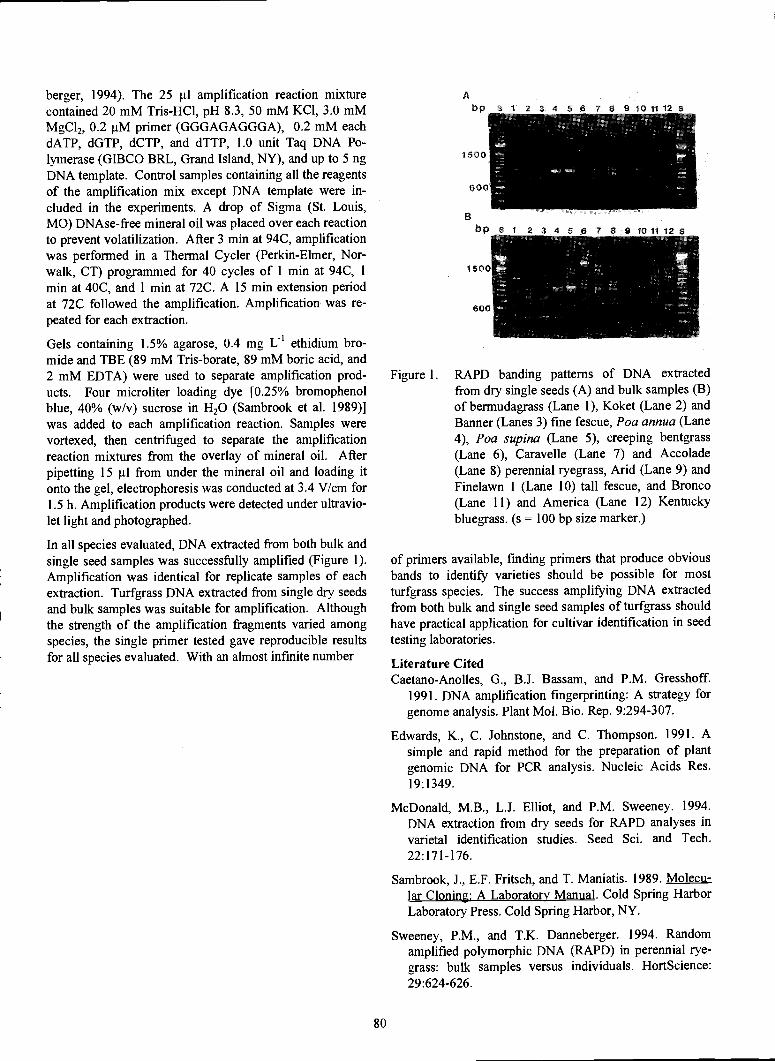
berger, 1994). The 25 .tl amplification reaction mixturecontained 20 mM Tris-HC1, pH 8.3, 50 mM KC1, 3.0 mMMgC12, 0.2 tM primer (GGGAGAGGGA), 0.2 mM eachdATP, dGTP, dCTP, and dTTP, 1.0 unit Taq DNA Po-lymerase (GIBCO BRL, Grand Island, NY), and up to 5 ngDNA template. Control samples containing all the reagentsof the amplification mix except DNA template were in-cluded in the experiments. A drop of Sigma (St. Louis,MO) DNAse-free mineral oil was placed over each reactionto prevent volatilization. After 3 miii at 94C, amplificationwas performed in a Thermal Cycler (Perkin-Elmer, Nor-walk, CT) programmed for 40 cycles of 1 mm at 94C, Imm at 40C, and 1 mm at 72C. A 15 mm extension periodat 72C followed the amplification. Amplification was re-peated for each extraction.
Gels containing 1.5% agarose, 0.4 mg U1 ethidium bro-mide and TBE (89 mM Tris-borate, 89 mM boric acid, and2 mM EDTA) were used to separate amplification prod-ucts. Four microliter loading dye [0.25% bromophenolblue, 40% (w/v) sucrose in H20 (Sambrook et al. 1989)]was added to each amplification reaction. Samples werevortexed, then centrifuged to separate the amplificationreaction mixtures from the overlay of mineral oil. Afterpipetting 15 1il from under the mineral oil and loading itonto the gel, electrophoresis was conducted at 3.4 V/cm for1.5 h. Amplification products were detected under ultravio-let light and photographed.
In all species evaluated, DNA extracted from both bulk andsingle seed samples was successfully amplified (Figure 1).Amplification was identical for replicate samples of eachextraction. Turfgrass DNA extracted from single dry seedsand bulk samples was suitable for amplification. Althoughthe strength of the amplification fragments varied amongspecies, the single primer tested gave reproducible resultsfor all species evaluated. With an almost infinite number
80
A
bp S 1 2 3 4 5 6 7 8 9 10 1112 S
1500
BOO
Bbp 1 2 3 4 5 6 7 8 9 10 ii 12 S
1500
600
Figure 1. RAPD banding patterns of DNA extractedfrom dry single seeds (A) and bulk samples (B)of bermudagrass (Lane 1), Koket (Lane 2) andBanner (Lanes 3) fine fescue, Poa annua (Lane4), Poa supina (Lane 5), creeping bentgrass(Lane 6), Caravelle (Lane 7) and Accolade(Lane 8) perennial ryegrass, Arid (Lane 9) andFinelawn 1 (Lane 10) tall fescue, and Bronco(Lane 11) and America (Lane 12) Kentuckybluegrass. (s = 100 bp size marker.)
of primers available, fmding primers that produce obviousbands to identif' varieties should be possible for mostturfgrass species. The success amplifying DNA extractedfrom both bulk and single seed samples of turfgrass shouldhave practical application for cultivar identification in seedtesting laboratories.
Literature CitedCaetano-Anolles, G., B.J. Bassam, and P.M. Gresshoff.
1991. DNA amplification fingerprinting: A strategy forgenome analysis. Plant Mo!. Bio. Rep. 9:294-307,
Edwards, K., C. Johnstone, and C. Thompson. 1991. Asimple and rapid method for the preparation of plantgenomic DNA for PCR analysis. Nucleic Acids Res.19: 1349.
McDonald, M.B., L.J. Elliot, and P.M. Sweeney. 1994.DNA extraction from dry seeds for RAPD analyses invarietal identification studies. Seed Sci. and Tech.22:17 1-176.
Sambrook, J., E.F. Fritsch, and T. Maniatis. 1989. Molecu-lar Cloning A Laboratory Manual. Cold Spring HarborLaboratory Press. Cold Spring Harbor, NY.
Sweeney, P.M., and T.K. Danneberger. 1994. Randomamplified polymorphic DNA (RAPD) in perennial rye-grass: bulk samples versus individuals. HortScience:29:624-626.

Weaver, K.R., L.M. Callahan, G. Caetano-Anolles, andP.M. Gresshoff. 1995. DNA amplification fmgerprintmgand hybridization analysis of centipedegrass. Crop Sci.35:881-885.
Williams, G.H., A.R. Kubelik, K.J. Livak, J.A. Rafalski,and S.V. Tingey. 1990. DNA polymorphisms amplifiedby arbitrary primers are useful as genetic markers. Nu-cleic Acids Res. 18:6531-6532.
RESTRICTION AMPLIFICATIONFRAGMENT LENGTH POLYMORPHISMS
(RAFLP) IN PERENNIAL RYEGRASS
P.M Sweeney and TK Danneberger
In the past, isozymes have been widely used to evaluateperennial ryegrass (Lolium perenne L.) genetics (Kennedyet al., 1985, Ostergaard et al., 1985). Although mostisozyme markers are known to be co-dominant, their use ingenetic studies is limited by the number of isozyme sys-tems available. A new genetic marker system, randomamplified polymorphic DNA (RAPD) (Williams et al.,1990) generates an almost infinite number of RAPD mark-ers, but the dominant gene action exhibited by RAPDmarkers limits their use in genetic studies. Restrictionfragment length polymorphisms (RFLP) are co-dominantmarkers and may be useful in some instances, but sinceRAFLP require large amounts of plant tissue, their useful-ness when only small amounts of tissue from individualplants are available is limited.
The restriction digestion of arbitrarily primed amplificationfragments has been suggested as a way to generate co-dominant markers (Grattapaglia et al., 1992). The diges-tion should produce a distinct phenotype for each genotypeat a polymorphic locus. The probable products of digestionare 1) homozygous undigested: the original fragment, 2)homozygous digested: two smaller fragments, but theoriginal fragment missing, and 3) heterozygous digested:both the original undigested fragment and the two smallerdigested fragments present.
These restriction amplification fragment length polymor-phisms (RAFLP) markers would be similar to RFLP mark-ers, since they would be co-dominant and detect changes inrestriction sites. In addition, they would have many theattributes of RAPD markers (small tissue requirements,fast, inexpensive, no previous knowledge of DNAsequences).
The ability to produce co-dominant markers increases thevalue of amplified markers in genetic studies of perennialryegrass, but the feasibility of generating these markers hasnot been evaluated. The objective of this study was to de-termine the suitability of RAFLP as genetic markers forperennial ryegrass by detennining the number of polymor-
81
phic restriction sites within DNA fragments amplified us-ing arbitrary primers.
Ten day old seedlings of 'Accolade' perennial ryegrasswere transferred to individual pots. Leaf tissue (5 cm) from13 week old plants was harvested and placed at -20 C untilDNA was extracted. DNA was extracted using a modifiedEdwards et al. (1991) procedure. Estimates of DNA con-centrations and dilutions were made as described bySweeney and Danneberger (1994).
A protocol similar to the RAPD technique (Williams et al.1990) was used to amplify DNA (Sweeney and Danne-berger, 1995). From a set of 200 decamers supplied by Dr.J.E. Carlson, University of British Columbia, 180 werescreened for use as primers. Control samples containing allthe reagents of the amplification mix except of DNA tem-plate were included in the experiments.
After amplification, 12 t1 of each reaction was transferredto a fresh microfuge tube and 3 units of a restriction en-zyme were added. Digestions were incubated for at least 3hr at temperatures recommended by the manufacturer(Hind III, Kpn I, Pst I at 37C, Apa I and Sma I at 30C).Digestion and amplification products were separated onagarose gels and visualized as previously described(Sweeney and Danneberger, 1995).
Polymorphic restriction loci were identified by evaluatingthe digestion products of amplification fragments from 12perennial ryegrass individuals. Amplification and digestionprocedures were repeated for polymorphic restriction loci.
Eighty-eight primers that produced distinct fragments wereused with five restriction enzymes (Hind III, Kpn I, Pst I,Apa I and Sma I) whose activity in the amplification bufferwas identical to their activity in recommended buffers (datanot shown). Sixty-four restriction loci were identified.Fourteen of these restriction loci were polymorphic amongthe twelve individuals we evaluated, and hence identifiedas RAFLP markers.
Figure 1 shows the amplification and Apa I digestion prod-ucts of primer 215. A 1200 base pair (bp) amplificationfragment digested in individual nine, was not digested inthe other individuals, suggesting that an Apa I restrictionloci within the fragment was polymorphic. An example ofan individual heterozygous for a restriction loci is illus-trated in Figure 2. A 1800 bp amplification fragment thatis digested in other individuals is only partially digested inindividual five. As expected, the original undigested frag-ment (1800 bp) as well a smaller fragment resulting fromPst I digestion is present in individual five. Figure 3 showsthe digestion of a 600 bp amplification fragment in 6 of 7individuals, but it is not digested in individual 5. Replica-tion of amplification and restriction digestion producedidentical results for these and the eleven other RAFLPmarkers we identified.
We have vernalized plants of the perennial ryegrass geno-types that were used to identify RAFLP markers. When
these plants flower, crosses will be made and progenytested. Those RAFLP markers that exhibit Mendelian ge-netic (segregate 1:2:1) and co-dominance should be usefulfor genetic studies. Since RAFLP markers can be used fordirect estimates of gene frequencies, they will be especiallyuseful in monitoring gene flow between populations andidentifying genetic shifts in cultivars and populations, andin verifying the success of crosses.
Literature CitedEdwards, K., C. Johnstone, and C. Thompson. 1991. A
simple and rapid method for the preparation of plantgenomic DNA for PCR analysis. Nucleic Acids Res.19:1349.
Grattapaglia, D., J. Chaparro, P. Wilcox, S. McCord, D.Werner, H. Amerson, S. McKeand, F. Bridgwater, R.Whetten, D. OMalley, and R. Sederoff. 1992. Mappingwoody plants with RAPD markers: applications tobreeding in forestry and horticulture. Proc. Symp. App!.RAPD Tech. to Plant Breeding. pp. 37-40 CSSA, Madi-son, WI.
82
Kennedy, S.J., S.J. Gardiner, T.J. Gilliland, and M.S. Cam-un. 1985. The use of electrophoretic techniques to dis-tinguish perennial ryegrass cultivars when sown inmixtures. J. Agric. Sci. Carnb. 104:1-9.
Ostergaard, H., G. Nielsen, and H. Johansen. 1985. Geneticvariation in cultivars of diploid ryegrass, Lolium per-enne and L. mu1tflorum, at five enzyme systems. Theor.App!. Genet. 69:409-421.
Sweeney, P.M., and T.K. Danneberger. 1994. Randomamplified polymorphic DNA (RAPD) in perennial rye-grass: bulk samples versus individuals. HortScience:29:624-626.
Sweeney, P.M., and T.K. Danneberger. 1995. RAPD char-acterization of Poa annua L. populations in golf coursegreens and fairways. Crop Sci. 35:1676-1680.
Williams, G.H., A.R. Kubelik, K.J. Livak, J.A. Rafaiski,and S.V. Tingey. 1990. DNA polymorphisms amplifiedby arbitrary primers are useful as genetic markers. Nu-cleic Acids Res 18:6531-6532.

Figure 1. Pairs of Apa I digested (right) and undigested (left) amplification products of primer 715 or nine individualperennial ryegrass samples.
6 7 8 9. - -
Figure 2. Pairs of Pst I digested (right) and undigested (left) amplification products of primer 717 for nine individualperennial ryegrass samples. X = Lambda DNA; Pst I = X DNA digested by Pst I, used as a size marker and toverify Pst I digestion.
bp s i 2 3 4 5 6 7
1500-
600--
Figure 3. Pairs of Hind III digested (right) and undigested (left) amplification products of primer 250 for seven individualperennial ryegrass samples. (s = 100 base pair ladder used as size marker.)
83
Appreciation is expressed to the Officers of the1995-96 Oregon Seed Council:
Tom Burns, PresidentMarshall Peters, First Vice PresidentKevin Turner, Second Vice President
Don Hector, TreasurerDavid S. Nelson, Executive Secretary
Business Address
Oregon Seed Council1193 Royvonne, S., Suite 11
Salem, OR 97302
Tel: (503) 585-1157FAX: (503) 585-1292
Sincere appreciation is also extended to the growers who have allowedtrials to be conducted on their farms. Data presented in many of theresearch reports would not be available without their cooperation.
Lastly, appreciation is also expressed to Mrs. Barbara Reed for her conscientiousattention to detail in formatting this manuscript for publication.

OfGON STATE UNIVER5TY
A L, EXTENSIONSERVICE
Agriculture, Home Economics, 4-H Youth, Forestry, Community Development,Energy, and Extension Sea Grant Programs. Oregon State University,United States Department of Agriculture, and Oregon counties cooperating.The Extension Service offers its programs and materials equally to all people.