199 final report - uc san diego library · 2001. 12. 19. · this report was prepared under...
TRANSCRIPT

FINAL REPORTDecember 26, 2001
The California Tobacco Control Program:A Decade of Progress, Results from the CaliforniaTobacco Survey, 1990-1999
California Department of Health ServicesTobacco Control Section
Prepared byCancer Prevention and Control Program
University of California, San Diego
Gray Davis, GovernorState of California
Grantland Johnson, SecretaryCalifornia Health and Human Services Agency
Diana M. Bonta, R.N., Dr.P.H., DirectorCalifornia Department of Health Services

This report was prepared under contract #98-15657 between the University of California,San Diego and the California Department of Health Services, and the value of thecontract was $2,025,169. The fieldwork for the 1999 California Tobacco Survey wassubcontracted to Westat, Inc., and the value of the subcontract was $1,816,661. Anyinterpretations of data or conclusions expressed in this report are those of the authors andmay not represent the views of the State of California.
Suggested Citation:
Gilpin EA, Emery SL, Farkas AJ, Distefan JM, White MM, Pierce JP. The CaliforniaTobacco Control Program: A Decade of Progress, Results from the California TobaccoSurveys, 1990-1998. La Jolla, CA: University of California, San Diego; 2001.

Table of Contents
iii
TABLE OF CONTENTS
PAGE
Executive Summary and Key Findings………………………………………………… I-i
Chapter 1 Comparison of California to the Rest of the United States ……….. 1-11. Per Capita Cigarette Consumption ………………………………… 1-2
Per Capita Cigarette Consumption from Sales Data and Smoker Reported Consumption ………..………………. 1-6
2. Adult Smoking Prevalence ………………………………………… 1-83. Summary ………………………………………………………….. 1-12Key Findings ………………………………………………………….. 1-14
Chapter 2 Smoking Prevalence in California:Results of the California Tobacco Surveys (CTS)………………….. 2-11. The Changing California Adult Smoker …………………………... 2-32. Daily Smoking Among California Adults ………………………… 2-43. Demographics of Total Adult Current Smoking ………………….. 2-6
Gender …………………………………………………………. 2-6Age …………………………………………………………….. 2-7Race/ethnicity ………………………………………………….. 2-10Education……………………………………………………….. 2-11
4. Adult Smoking Prevalence by Region……………………………... 2-135. Prevalence, Quitting and Changes in Population…………………... 2-166. Adolescent Smoking Prevalence…………………………………… 2-187. Adolescent Smoking Prevalence by Region……………………….. 2-218. Summary…………………………………………………………… 2-22Key Findings…………………………………………………………... 2-24Appendix………………………………………………………………. 2-25
Chapter 3 Protection of Nonsmokers …………………………………………… 3-11. Smokefree Workplaces …………………………………….……… 3-2
Report of Smokefree Workplaces ……………………………... 3-3Exposure of Nonsmokers to Secondhand Tobacco Smoke at Work …………………...……………….. 3-4Compliance with AB-13 ………………………………….……. 3-6
2. Exposure to Involuntary Smoking at Home ………………………. 3-8Reasons Respondents Give for Having Smokefree Homes……. 3-10Protection of Children and Youth from
Secondhand Tobacco Smoke in the Home ………………….. 3-113. Exposure to Secondhand Tobacco Smoke in Places Other Than Work or Home …………………………………….. 3-124. Perception that Secondhand Smoke is Harmful …………………... 3-135. Nonsmokers Activism ………………………………………….…. 3-17

Table of Contents
iv
6. Summary …………………………………………………………... 3-21Key Findings ………………………………………………………….. 3-23Appendix Tables………………………………………………………. 3-24
Chapter 4 Adolescent and Young Adult Smoking…….………….……………. 4-11. Trends in Adolescent Smoking Behavior …………………………. 4-2
Defining Levels of Experience with Smoking ………………… 4-2Never Smokers ………………………………………………… 4-4Experimenters …………………………………………………. 4-5Non-Current Experimenters …………………………………… 4-6Established Smokers …………………………………………... 4-8Adolescent Quitting …………………………………………… 4-9
2. Trends in Correlates of Adolescent Smoking ……………………... 4-113. Has the Smoking Uptake Window
Widened to Include Young Adults? ……………………………. 4-12 Occasional Smokers Who Have and
Have Not Smoked Daily in the Past ………..………….………. 4-14 Cigarette Consumption in Daily and
Occasional Established Smokers ……………..………………... 4-164. Summary …………………………………………………………... 4-18Key Findings ………………………………………………………….. 4-19Appendix………………………………………………………………. 4-20
Chapter 5 Parental Influences on Adolescent Smoking ………………………. 5-11. Adult Smoking in Adolescent Homes ………………….………… 5-32. Parental Expectations Regarding Adolescent Smoking ………….. 5-43. Quitting and Relapsing Among Parents ………………………….. 5-8
How Parents Who Smoke Explain Their Smoking Behavior To Adolescents …………………… 5-8How Parents Who Attempt to Quit Explain Relapsing to Their Adolescents. ……………………………………..…….. 5-9
4. Other Parenting Practices Related to Adolescent Smoking ………. 5-10Discussing the Risks of Smoking ……………………………… 5-10Parental Inquiry About Smoking Among Adolescents’ Friends ………………………………. 5-13Parental Knowledge of Adolescent Smoking Behavior ………. 5-15
5. Summary ………………………………………………………….. 5-16Key Findings …………………………………………………………. 5-18
Chapter 6 Smoking Cessation: California Smokers Are Trying to Quit……... 6-11. Trends in Important Predictors of Quitting ……………………….. 6-3
Smoking < 15 Cigarettes a Day ……………………………….. 6-3Recent Quitting History ……………………………………….. 6-6
2. Indications of Successful Quitting ………………………………… 6-83. Smokers Who May Never Quit …………………………………… 6-114. The Role of Workplace and Home Smoking Bans ……………….. 6-135. Smoking Cessation Assistance ……………………………………. 6-15

Table of Contents
v
6. Physician Advice and Referral for Smoking Cessation …………… 6-207. Summary ………………………………………………………….. 6-24Key Findings …………………………………………………………. 6-26
Chapter 7 Price Sensitivity and Taxes…. ……………………….……………… 7-11. The Economics of Cigarette Prices……………………………….. 7-2
Price Paid for Cigarettes, 1996-1999…………………………… 7-3Price Elasticity …………………………………………………. 7-7Expected and Actual Changes in Cigarette Consumption……… 7-7
2. Analysis of Tax Evasion Following Proposition 10 Excise Tax Increase……..……………………….. 7-83. Adult Price Sensitivity…………………………………………….. 7-11
Premium vs. Generic Cigarettes ……………………………….. 7-134. Support for a Cigarette Excise Tax of ≥ $0.50/Pack……………… 7-135. Adolescent Price Issues……………………………………………. 7-16
Price Elasticity…………………………………………………. 7-16Expenditures on Cigarettes ……………………………………. 7-17Generosity……………………. ……………………………….. 7-18Brand Smoked …………………………………………………. 7-20
6. Summary………………………………………………………….. 7-20Key Findings …………………………………………………………. 7-22
Chapter 8 Media Influences on Smoking ………….…………………………… 8-11. Exposure to Cigarette Advertisements on Televised Sporting Events…………..………………………… 8-32. Receptivity to Cigarette Advertising and Promotions…………….. 8-4
Favorite Ad ……………………………………………………. 8-4Cigarette Brand Promotional Items ……………………………. 8-6Willingness to Use a Promotional Item ……………………….. 8-8Adults’ Willingness to Give Children/Adolescents Tobacco Brand Promotional Items ………………………….. 8-9
3. Anti-Tobacco Media Exposure ………………………….………... 8-104. Attitudes About Tobacco Advertising Regulation…………………. 8-125. Summary………………………….. ………………………………. 8-14Key Findings …………………………………………………………. 8-16Appendix ……………………………………………………………… 8-17
Chapter 9 Access to and Ease of Purchase of Cigarettes……………………… 9-11. Adolescent Never Smokers’ Perceptions
of the Ease of Obtaining Cigarettes ………..……………………. 9-22. Never Smokers Offered Cigarettes ………………………………. 9-73. How Do Adolescents Usually Get Cigarettes?………………….… 9-9
Usual Source of Cigarettes …………………………………….. 9-9 Who Buys for or Gives Cigarettes to Minors? …………...…... . 9-12
Profile of Those Who Give Away Cigarettes …………………. 9-134. Where Adolescents Buy Cigarettes ……………………………….. 9-145. Adult Attitudes About Teen Access ………………………………. 9-15

Table of Contents
vi
6. Summary …………………………………………………………... 9-16Key Findings …………………………………………………………. 9-17
Chapter 10 School Smoking: Policies and Compliance….……………………… 10-11. Smokefree School Policies ……………………………………….. 10-2
Obeying the Rule Not to Smoke……………………………….. 10-2How Many Students Witnessed Smoking in School? ………… 10-4Trends in Student Preferences for Smokefree School Grounds 1993-1999 ……………...………………….. 10-6How do Adolescent Current Smokers View the School No-Smoking Policies? ……………………. 10-7
2. Trends in Perceptions of Teachers’ Smoking ……………………… 10-83. Trends in Health Education Classes at Schools 1990-1999 ………. 10-9
Adolescent Perception of Health Class Effectiveness …………. 10-114. Summary ………………………………………..,………………... 10-11Key Findings ………………………………………………………….. 10-13
Chapter 11 Other Tobacco Use………………………...…………………………. 11-11. Adult Use of Pipes and Smokeless Tobacco ………………………. 11-32. Adult Cigar Use …………………………………………………… 11-4
Cigarette Smoking Status and Cigar Smoking ………………… 11-5Intensity of Cigar Consumption ……………………………….. 11-6
3. Adolescent Use of Alternative Tobacco Products ………………… 11-7Smokeless Tobacco ……………………………………………. 11-7Cigars ………………………………………………………….. 11-9Bidis …………………………………………………………… 11-10
5. Summary ………………………………………………………….. 11-12Key Findings …………………………………………………………. 11-14Appendix Tables………………………………………………………. 11-15
Table of Contents
vii
FIGURES AND TABLES
Chapter 1 Comparison of California to the Rest of the United States.
Figure 1.1 Seasonally Adjusted Trend of Per Capita Consumption for Cigarettes, California vs. U.S.
Figure 1.2 Per Capita Consumption Trends, California vs. U.S.Table 1.1 Summary of Decreases in Per Capita Cigarette ConsumptionFigure 1.3 Comparison of Consumption Estimates from Wholesale Removal Data
and Self-ReportTable 1.2 Smokers’ Self-Reported Cigarette ConsumptionFigure 1.4 Smoking Prevalence Among California Adults, Aged 18 or OlderFigure 1.5 Smoking Prevalence Among Adults in the Rest of the United States,
Aged 18 or OlderTable 1.3 Summary of Decreases in Smoking PrevalenceFigure 1.6 Smoking Prevalence Among Adults Aged 18 and Older, California vs. U.S.
Chapter 2 Smoking Prevalence in California: Results of the California Tobacco Surveys (CTS)
Table 2.1 Percentage of Current Smokers Who Are Daily and Occasional SmokersEstimated from Adult Survey WITH 100 Cigarette Criterion
Figure 2.1 Adult Daily Smoking, Standardized and UnstandardizedTable 2.2 Standardized California Adult Daily Smoking Prevalence
WITH the 100-Cigarette CriterionFigure 2.2 Standardized Prevalence by GenderFigure 2.3 Standardized Prevalence by AgeTable 2.3 Standardized Adult Smoking Prevalence, Age Within Gender,
WITH the 100-Cigarette CriterionFigure 2.4 Age of Initiation of Regular Smoking by Age, Sex, and Birth CohortFigure 2.5 Standardized Prevalence by Race/EthnicityTable 2.4 Standardized California Adult Smoking Prevalence, Race/Ethnicity Within
Gender, WITH the 100-Cigarette CriterionFigure 2.6 Standardized Prevalence by EducationTable 2.5 Standardized California Adult Smoking Prevalence, Education Within Gender
WITH the 100-Cigarette CriterionFigure 2.7 Regions (Adult Smoking Prevalence by Region)Table 2.6 Adjusted Adult Smoking Prevalence by Region Within California,
WITH the 100-Cigarette CriterionTable 2.7 Recent Demographic Changes in California and Resultant Numbers of SmokersFigure 2.8 The Effect of Removing Population Distribution Changes from Adolescent
(12-17 Years) Smoking Prevalence in the Last 30 DaysTable 2.8 Standardized Adolescent (12-17 Years) Smoking Prevalence
(in Last 30 Days) in CaliforniaTable 2.9 Current Adolescent Smoking Prevalence by Region
(in Last 30 Days) in CaliforniaFigure A2.1 Determination of Daily and Occasional Smoking from Adult Surveys

Table of Contents
viii
Table A2.1 Unstandardized California Adult Smoking Prevalence WITH the 100-CigaretteCriterion
Table A2.2 Unstandardized California Adult Smoking Prevalence WITHOUT the 100-Cigarette Criterion
Table A2.3 Unstandardized Adult Smoking Prevalence by Region Within CaliforniaWITH the 100-Cigarette Criterion
Table A2.4 Unstandardized Adult Smoking Prevalence by Region Within CaliforniaWITHOUT the 100-Cigarette Criterion
Table A2.5 Unstandardized California Adult Daily Smoking PrevalenceWITH the 100-Cigarette Criterion
Table A2.6 Unstandardized Adolescent (12-17 Years) Smoking Prevalence (in Last 30 Days)in California
Table A2.7 Unstandardized Adolescent Smoking Prevalence (in Last 30 Days)by Region Within California
Chapter 3 Protection of Nonsmokers
Figure 3.1 Indoor Workers Reporting Smokefree WorkplacesFigure 3.2 Exposure of Nonsmoking Indoor Workers to Secondhand SmokeTable 3.1 Exposure of Nonsmokers to Secondhand Smoke in the Past Two Weeks in
Indoor Work Areas by Demographic CharacteristicsFigure 3.3 Exposure of Nonsmoking Indoor Workers by Type of Workplace in 1999Figure 3.4 Exposure of Nonsmoking Indoor Workers by Size of Workplace in 1999Figure 3.5 Home Smoking Restrictions Among All Californians
(Smokers and Nonsmokers)Figure 3.6 Home Smoking Restrictions Reported by California SmokersFigure 3.7 Reasons for Having Smokefree Homes by Smoking Status in 1999Figure 3.8 Protection of Young Children (0-5 Years) in Households
Where Adults SmokeFigure 3.9 Protection From Secondhand Smoke at Home for Children and Adolescents
by Race/EthnicityFigure 3.10 Place of Exposure to Someone Smoking in Last 6 Months Other Than Own
Home or Work in 1999Figure 3.11 Home Smoking Restrictions and Agreement That Secondhand Smoke
is HarmfulTable 3.2 Agreement that Secondhand Smoke Harms the Health of NonsmokersFigure 3.12 Agreement that Secondhand Smoke Causes Cancer in Nonsmokers
by Smoking Status and AgeFigure 3.13 Nonsmoker Activism by Exposure to Smokers and AgeTable 3.3 Nonsmoker Activism in 1999Figure 3.14 Who Nonsmoker Activists Asked Not to SmokeFigure 3.15 Reasons Nonsmoker Activists Give for Asking Smokers Not to SmokeTable A3.1 Workplace Smoking Policy (1999 Adult CTS)Table A3.2 Home Smoking Restriction (1999 Adult CTS)
Table of Contents
ix
Chapter 4 Adolescent and Young Adult Smoking
Table 4.1 Levels of Adolescent Smoking ExperienceFigure 4.1 Experience with Smoking Among 12-17 Year Old AdolescentsFigure 4.2 12-17 Year Old Committed Never SmokersTable 4.2 Committed Never Smokers in Demographic Subgroups of
Adolescents, 12-17 Years of AgeFigure 4.3 Non-Current Experimenters at Risk of Future Smoking Among 12-17 Year OldsTable 4.3 Non-Current Adolescent Experimenters (Last Cigarette >3 Months Ago) Among
Demographic Groups of Adolescent Ever Experimenters 12-17 Years of AgeTable 4.4 Established Smoking Among Demographic Subgroups of Adolescents,
15-17 Years of AgeFigure 4.4 15-17 Year Olds Who Have Become Established SmokersTable 4.5 Quitting Behavior Among Current Adolescent SmokersTable 4.6 Changes in Correlates of Adolescent Smoking PrevalenceTable 4.7 Transitions in the Smoking Uptake Process Among Adolescents
and Adults in 1992 and 1999Figure 4.5 Daily and Occasional Smoking in Adolescents and Young AdultsFigure 4.6 Mean Daily Cigarette Consumption Among Daily Smokers,
Ever-Daily Occasional Smokers, and Never-Daily Occasional Smokers
Chapter 5 Parental Influences on Adolescent Smoking
Table 5.1 Exposure to Smoking in Households of California Adolescents by Adult Smoking Status and Adolescent Demographic Group, 1999
Table 5.2 Perceived Parental Expectations for Adolescent Smoking Now and in the Future According to Adolescent Responses
Figure 5.1 Adolescent Smoking by Parental Smoking ExpectationsAmong 12-14 Year Olds
Figure 5.2 Adolescent Smoking by Parental Smoking ExpectationsAmong 15-17 Year Olds
Table 5.3 Strong Parental Expectations Regarding Adolescent Smokingby Adolescent Demographic Group, 1999
Figure 5.3 Reasons Parents Who Smoke Gave Their Adolescents for Their SmokingFigure 5.4 Mother and Adolescent Reports on Reasons for Parent RelapseFigure 5.5 If Parents See Children Under 10 Years of Age Pretending to Smoke, What
Do You Think They Should Do?Table 5.4 Adolescent Responses Regarding Parents Discussing the Risks of Smoking,
1996-1999 Cohort SurveyTable 5.5 Parent Responses-Asking Adolescents About Smoking When They Are
With Friends, 1996-1999 Cohort SurveyTable 5.6 Parent and Adolescent Responses Regarding Adolescent Ever Smoking,
1996-1999 Cohort Survey

Table of Contents
x
Chapter 6 Smoking Cessation: California Smokers are Trying to Quit
Figure 6.1 Light Smoking (<15 Cigarettes/Day) Among Current SmokersTable 6.1 Percentage of Current California Smokers Smoking <15 Cigarettes/DayFigure 6.2 Percent of Current Smokers Who Do Not Smoke EverydayFigure 6.3 Quit Attempts Among Smokers in the Last YearTable 6.2 Percent of Smokers in the Last Year Who Made a Quit Attempt
of One or More DaysFigure 6.4 Relapse Following Most Recent Quit Attempt for Smokers in the Last YearTable 6.3 Successful Quitting (≥90 Days of Abstinence) for Most Recent Quit Attempt
Among Smokers in the Last YearFigure 6.5 Cigarette Consumption Among Smokers Who Never Expect to QuitTable 6.4 Smokers >25 Years of Age Who Never Expect to QuitFigure 6.6 Smoking Bans at Work and at Home and Quitting Behavior in 1999Figure 6.7 Current Smokers and Smoking Bans at Home and in the WorkplaceTable 6.5 Smokers Both Working and Living with Complete Bans on SmokingFigure 6.8 Use of Smoking Cessation Assistance for Most Recent Quit AttemptTable 6.6 Use of Nicotine Replacement for Most Recent Quit Attempt Among
Smokers in the Last YearTable 6.7 Details of Users of Cessation Aids in 1999Figure 6.9 Relapse Following Most Recent Quit Attempt for Heavy Smokers
Who Did and Did Not Use a Medical AidFigure 6.10 Smokers Advised by Their Physicians to QuitTable 6.8 Physician Advice to Quit Among Smokers in the Last Year With a
Visit to a Physician in the Last YearFigure 6.11 Use of Nicotine Replacement Therapy with Most Recent Quit Attempt
and Physician Advice and Referral
Chapter 7 Price Sensitivity and Taxes
Figure 7.1 Average Real Price/Pack of Cigarettes in CaliforniaTable 7.1 Average Price/Pack Paid by California SmokersTable 7.2 Average Monthly Expenditures on Cigarettes by Amount Smoked and Income
Levels (Adjusted for Inflation)Figure 7.2 Monthly Expenditure by Income Level Among Those Who Smoke 25+
Cigarettes/DayFigure 7.3 Expected and Actual Percentage Changes in Cigarette Consumption Due to
Price Changes in California, 1989-1999Figure 7.4 Percent of Buyers and Cigarettes Purchased by Store TypeTable 7.3 Percent of Smokers Worried About Money Spent on CigarettesFigure 7.5 Cumulative Percentage Favoring Additional Cigarette Excise TaxTable 7.4 Support for Cigarette Excise Tax of ≥$0.50/packFigure 7.6 Actual and Expected Changes in Adolescent PrevalenceTable 7.5 Average Amount Smoked, Discretionary Income, and Percent
of Discretionary Income Spent on Cigarettes, 1999Table 7.6 Percent of Adolescent Cigarette Buyers Who Refused or Hesitated to Give
Away Cigarettes Because of Cost, 1999
Table of Contents
xi
Chapter 8 Media Influences on Smoking
Figure 8.1 Adolescents and Adults Who Reported They Saw a Tobacco Brand Logoon a Televised Sporting or Cultural Event “Very Often” in the Last Year
Figure 8.2 Favorite Ad Among Committed Never SmokersFigure 8.3 Respondents with a Favorite AdFigure 8.4 Adolescents and Adults With Tobacco Brand Item
by How They Obtained It, 1996-1999Figure 8.5 Adolescent Interest in Promotional Items, 1999Figure 8.6 Adults Who Are Willing to Use a Tobacco Industry Promotional ItemFigure 8.7 Adults That Have/Were Willing to Give a Child or Teenage a Tobacco Brand
Promotional Item, by Adult Smoking StatusFigure 8.8 Saw or Heard Lots Against Smoking in MediaTable 8.1 California Tobacco Control Program Anti-Tobacco Media ExpendituresTable 8.2 Adult Attitudes about Regulating Tobacco Industry Advertising and
Promotional Activities in 1999Table A8.1 Adolescents Reporting Seeing a Tobacco Logo on a Televised Sports Event Very
Often in the Last YearTable A8.2 Adults Reporting Seeing a Tobacco Logo on a Televised Sports Event Very
Often in the Last YearTable A8.3 Adolescents’ Named Brand of Favorite AdvertisementTable A8.4 Adults’ Named Brand of Favorite AdvertisementTable A8.5 Adolescents with Tobacco Brand Promotional ItemsTable A8.6 Adults with Tobacco Brand Promotional ItemsTable A8.7 Adolescent Willingness to Use a Tobacco Brand Promotional ItemTable A8.8 Adult Willingness to Use a Tobacco Brand Promotional Item, 1999
Chapter 9 Access to and Ease of Purchase of Cigarettes
Figure 9.1 Never Smokers Who Think it Would be Easy to get CigarettesTable 9.1 Adolescents’ Perceptions about the Ease of Buying Cigarettes
by Demographic CharacteristicsFigure 9.2 Perception of Ease of Buying a Pack of Cigarettes (Age 15-17 Years)Figure 9.3 Perception of Ease of Obtaining a Few Cigarettes (Age 12-14 Years)Table 9.2 Percent of Never Smokers Offered CigarettesFigure 9.4 Never Smokers Offered CigarettesFigure 9.5 Source of CigarettesTable 9.3 Usual Source of CigarettesFigure 9.6 Social Source of Cigarettes by Age of SupplierTable 9.4 Percent of Ever Smokers Who Have Ever Given Away Cigarettes, 1999Table 9.5 Ever-Buyers Often Buy Cigarettes at [Type of Store, Vending Machine, Other]Table 9.6 Adult Attitudes About Minimum Purchase Age Enforcement and Retail Licensing

Table of Contents
xii
Chapter 10 School Smoking: Policies and Compliance
Figure 10.1 Most or All Students Who Smoke Obey the Rule Not to Smokeon School Property
Table 10.1 How Many Students Who Smoke Obey the Rule Not to Smokeon School Property?
Table 10.2 Students Who Have Seen Anyone Smoking at SchoolTable 10.3 Students Who Preferred that Smoking be Banned on School GroundsFigure 10.2 School Policy Against Smoking by Current Smoking Status and YearFigure 10.3 Perception that Teachers Smoke by AgeFigure 10.4 Students Who Recall Taking a Class on the Health Dangers of SmokingTable 10.4 Students Who Recall Having a Class on the Health Risks of Smoking
Chapter 11 Other Tobacco Use
Figure 11.1 Prevalence of Pipe and Smokeless Tobacco Use by Age in Adult MenFigure 11.2 Current Cigar Use by Gender and AgeFigure 11.3 Current Cigar Use by Gender and Cigarette Smoking StatusTable 11.1 Cigar Smoking Patterns Among Current Cigar Users (Answered Every Day
or Some Days to Prevalence Question) by Cigarette Smoking StatusFigure 11.4 Experimentation with Smokeless Tobacco by Cigarette Smoking Experience
in Adolescent BoysFigure 11.5 Experimentation with Cigars by Cigarette Smoking ExperienceTable 11.2 Demographics of Bidi Use in California AdolescentsFigure 11.6 Bidi Use by Traditional Cigarette Smoking StatusFigure 11.7 Traditional Cigarette Consumption and Bidi Use Among Current
Cigarette SmokersTable A11.1 Current Tobacco Use Status (1999 Adult CTS)Table A11.2 Experimentation with Tobacco Products (1999 Youth CTS)

I-i
EXECUTIVE SUMMARY AND KEY FINDINGS

Executive Summary and Key Findings
I-ii
EXECUTIVE SUMMARY
During the 1990s in California, smoking behavior and attitudes about smoking havechanged, as measured from the California Tobacco Surveys (CTS) and other datasources. Some of the most important findings from the CTS are highlighted below. Fora more complete summary, see the Key Findings from each chapter of this report, whichappear both in this Executive Summary and at the end of each chapter. Throughout thisreport, results are given with the margin of error (±95% confidence limits).
Adult Smoking Behavior
• Over the decade, per capita cigarette consumption fell by a factor of 57% inCalifornia compared to only 27% in the rest of the United States. By the end of1999, Californians consumed only 4.1 packs of cigarettes per person per month,compared to 9.1 in the rest of the United States.
• While adult (18+ years) smoking prevalence decreased in the first few years of thedecade, after 1994 changes in prevalence were not statistically significant. The mostrecent CTS indicated that adult smoking prevalence was 18.3±0.3% in 1999.
• Despite relatively stable smoking prevalence since 1993, fewer California smokersare heavy daily smokers, and between 1990 and 1999, the prevalence of dailysmoking declined by a factor of 18.6%. These findings explain the decline in percapita cigarette consumption. In 1999, only 13.0±0.3% of Californians were dailysmokers. Only 6.4±0.4% of California college graduates were daily smokers.
• Over the decade, the percent of California smokers making a quit attempt lasting aday or longer in the last year increased by a factor of 25.9% to 60.1±1.5% in 1999.Quitters in 1999 appeared to be as successful as those earlier in the decade.
• In California, the cigar fad appears to be dissipating, mostly among adults who havenever smoked cigarettes. In 1999, most current California cigar smokers smoke onlya few cigars a month (83.2±3.7% smoked <5/month). Cigar smokers who wereformer cigarette smokers showed the highest level of monthly cigar consumption.
Adolescent Smoking Behavior
• Although California adolescents showed an alarming increase in smoking prevalence(any smoking in the past 30 days) between 1993 and 1996, by 1999 current smokingprevalence had fallen to 7.7±0.8%, significantly lower than prevalence in 1990.
• Among young adolescents 12-13 years of age, the percentage of committed neversmokers rose by a factor of 17.7% between 1996 and 1999 to 65.7±1.9%.

Executive Summary and Key Findings
I-iii
• In 1999, 79.8±6.4 of current adolescent established smokers reported they had triedto quit sometime in the past.
• Adolescent use of other tobacco products is highly related to cigarette smoking. In1999, rates of adolescent ever experimentation with cigars (15.0±1.2%) and bidis(7.0±0.8) were much higher than for chewing tobacco or snuff (3.1±0.5%).
Protection of Nonsmokers from Secondhand Tobacco Smoke
• In 1999, 93.4±0.8% of California indoor workers reported that smoking was notallowed in their workplace, up from 35.0+1.3% in 1990.
• In 1999, the percentage of nonsmokers exposed to someone smoking in their workarea in the past two weeks increased significantly from 11.8±1.5% in 1996 to15.6±1.4% in 1999. Over the decade, however, exposure to secondhand smoke inthe workplace decreased by a factor of 46.2%
• In 1999, 73.3±1.1% of Californians lived in smokefree homes, up by a factor of 30%since 1993. Further, nearly half (47.2±1.8%) of current California smokers live insmokefree homes, a factor increase of 135% since 1993.
• Accordingly, the percentage of California children and adolescents protected fromsecondhand smoke at home increased by a factor of 15.1% since 1993, to 88.6±1.1%in 1999.
Other Important Findings
• While adult California smokers were more concerned about the price of cigarettesafter the $0.50/pack excise tax increase in January 1999, about 70% buy theircigarettes at the most expensive outlets, only a few (5.4 ±0.8%) bothered to seek outuntaxed sources, and 58.2±1.1.39% supported a further tax increase of $0.50 ormore.
• In 1999, less than half (48.0±1.5%) of California’s adolescent never smokersbelieved that it is easy to get cigarettes, down by a factor of 16% since 1996.
• Perceived compliance with smokefree school policies increased by a factor of 64%from 1996 to 1999, when 66.6±1.5% of adolescents reported that most of thestudents who smoke obey the no-smoking rule on school property.
• In 1999, 9.0±0.9% of adolescents had a tobacco promotional item, a factor decreaseof 34.5% since 1996. However, 14.9±1.1% of adolescents said they would bewilling to use a promotional item. Few adults (1.2±0.2%) reported ever giving suchan item to a child or adolescent, but 7.6±0.6% said they were willing to do so.

Executive Summary and Key Findings
I-iv
KEY FINDINGS
Chapter 1 - Comparison of California to the Rest of the United States
1. During the decade of the California Tobacco Control Program, a statistical modelof adult (18+ years) per capita cigarette consumption indicates that consumptionhas decreased in California from 9.5 packs/month in December 1989 to 4.1packs/month in December of 1999, a decline by a factor of 57%.
2. In the rest of the United States, a comparable statistical model indicates per capitacigarette consumption decreased from 12.4 packs/month in December 1989 to 9.1packs/month in December of 1999, a decline by a factor of 27%. Thus,consumption declined in California by twice as much as it did in the rest of theUnited States.
3. Over the period of the California Tobacco Control Program, a statistical modelindicates that adult smoking prevalence declined by a factor of 24%, compared to17% in the rest of the United States. In December of 1999, prevalence estimatedfrom the model was 17.5% in California and 21.5% in the rest of the United States.
4. Over the 10-year period, adult smoking prevalence declined more in Californiathan in the rest of the United States. However, most of the decline in Californiaoccurred during the early years of the Tobacco Control Program, while the smallerdecline in the rest of the country occurred relatively evenly over the period.
5. In recent years, continued declines in per capita cigarette consumption were notaccompanied by a change in smoking prevalence. This suggests that Californiasmokers are reducing the number of cigarettes they smoke rather than quittingaltogether.
Chapter 2 – Smoking Prevalence in California: Results of the California TobaccoSurveys (CTS)
1. Smoking patterns are changing among current California adult smokers. An eversmaller fraction of current adult smokers are heavy daily smokers (smoke 15+cigarettes/day), less than 30% of current smokers in 1999. Further, in 1999 over20% of current smokers did not smoke every day.
2. Over the decade from 1990 to 1999, the prevalence of daily smoking(standardized) declined by a factor of 18.6%. In 1999, the snapshot estimate ofadult prevalence of daily smoking was 13.0±0.3%. Among college graduates, theprevalence of daily smoking was only 6.4±0.4% in 1999.

Executive Summary and Key Findings
I-v
3. In contrast to adult California females, there are demographic groups of males thatshow no indication of further reduced smoking prevalence. These include Asiansand those with less than a high school education. Young males 18-24 years of ageshowed an increased smoking prevalence beginning in 1993.
4. There was considerable variability in adjusted smoking prevalence rates amongregions. Some regions changed little, and others showed important declines forboth adults and adolescents.
5. Adolescent smoking prevalence, any smoking in the past 30 days, was constantbetween 1990 and 1993, jumped higher by a factor of 29.5% between 1993 and1996, and then fell by a factor of 33.1% between 1996 and 1999. Overall, thestandardized adolescent smoking prevalence was significantly lower in 1999 thanat the beginning of the decade. The snap shot estimate of adolescent smokingprevalence in 1999 was 7.7±0.8%.
Chapter 3 – Protection of Nonsmokers
1. In 1999, 93.4±0.8% of California indoor workers reported that smoking was notallowed in their workplace, up from 35.0±1.3% in 1990, a factor increase of 167%.
2. Nonsmoking indoor workers were less exposed to secondhand smoke in theirworkplace in 1999 (15.6±1.4%) compared to 1990 (29.0±1.8%). Even so, between1996 and 1999 there was an upturn in such reports.
3. In 1999, indoor workers in plants/factories, stores/warehouses and restaurants/barsreported more exposure to secondhand smoke than workers in classrooms,hospitals or offices. While exposure was lower in workplaces with more than 50employees, the size of smaller workplaces was not related to reported exposure.
4. More and more California homes are smokefree; in 1999, 73.2±1.1% ofCalifornia homes had a smokefree policy, compared to 50.9±0.9% in 1993, a factorincrease of 43.8%. In 1999, 47.2±1.8% of smokers lived in smokefree homes, upby a factor of 135% from 20.1±1.7% in 1993.
5. With the increase in smokefree homes, children and adolescents are increasinglyprotected from exposure to secondhand smoke in the home. In 1999, 88.6±1.1%of children and adolescents lived in smokefree homes, up from 77.0±1.4% in 1993,a factor increase of 15.1%.

Executive Summary and Key Findings
I-vi
6. In 1999, 37.1±1.4% of nonsmoking Californians not only lived and/or worked insmokefree environments, but also could not report an instance of exposure tosomeone smoking in the past 6 months. Among those who did report an instanceoutside the workplace or home, exposure in restaurants was the most frequentindoor setting mentioned.
7. In 1999, 94.0±0.5% of California adults agreed that secondhand smoke harms thehealth of babies and children and 83.3±0.7% agreed that it causes cancer innonsmokers. Older smokers were much less likely to agree that secondhandsmoke causes cancer in nonsmokers.
8. In 1999, 35.1±1.3% of nonsmokers reported asking a smoker not to smoke, andthis nonsmoker activism was more prevalent among demographic groups with arelatively high smoking prevalence, younger, less educated, lower income persons.Nonsmokers were most likely to ask relatives or friends and acquaintances not tosmoke, but the propensity to ask strangers increased with the age of thenonsmoker.
Chapter 4 – Adolescent and Young Adult Smoking
1. By 1999, the percent of California adolescents 12-17 years of age who werecommitted never smokers was 53.3±1.4%, which, despite a decrease in 1996, wassignificantly higher than the rate of committed never smokers in 1993, 48.6±1.9%.
2. The percent of adolescents 15-17 years of age who had become establishedsmokers was only 8.0±1.1% in 1999, a factor decrease of 33.9% since 1996.
3. In 1999, 79.8±7.2% of current adolescent established smokers reported they hadtried to quit in the past. Some of these quitters (4.2±3.1%) had used nicotinereplacement, and this rate of use may not be much different than among adult lightsmokers.
4. The relation between the timing of the Joe Camel campaign and patterns in youthsmoking prevalence since 1990 together with the recent declines in youth smokingprevalence suggests that the increase in young adult smoking in 1999 reflects thematuring of the youth cohort previously influenced by the Joe Camel campaign,rather than more recent tobacco industry campaigns targeting young adults.
5. In 1999, a high proportion of young adult established smokers (approximately 45%of 18-20 year olds) have never smoked daily. About 25% of young adult smokersover 20 years of age have reverted to occasional smoking after a period of dailysmoking for at least 6 months.

Executive Summary and Key Findings
I-vii
Chapter 5 – Parental Influences on Adolescent Smoking
1. Parental reinforcement of strong expectations against smoking for their adolescentis strongly associated with low rates (11.7±1.6% overall) of adolescent eversmoking and is likely a key parenting practice to deter adolescent smokingthroughout adolescence and into adulthood, when the risk for smoking uptakedrops considerably.
2. The majority of parents who smoke attributed the addictive power of nicotine asthe reason they smoke (64.9±5.3%) or relapsed (54.8±10.6%) when they discusstheir smoking with their adolescent. According to adolescent reports, manyadolescents (40.2±9.7%) appear to accept this explanation.
3. Most parents (78.6±2.0%) reported that parents should discuss the risks ofsmoking with their children, and two-thirds of adolescents (67.9±2.9%) report thattheir parents had discussed the risks of smoking with them at some time.
4. The vast majority of parents (90.7±1.7%) reported that parents should ask theiradolescents about smoking that occurs among friends at least every now and then,and 47.4±3.0% reported that parents should ask regularly.
5. While most parents (88.7±2.4%) of adolescent committed never smokers reportedthat their adolescent was not at risk to smoke, many (65.6±3.3%) parents ofadolescents who were at risk to start or experiment further with smoking did notperceive their adolescents as being at risk to smoke.
Chapter 6 – Smoking Cessation: California Smokers are Trying to Quit
1. In 1999, 59.4±1.7% of adult smokers were either occasional smokers or smokedless than 15 cigarettes/day.
2. Quit attempts of a day or longer increased by a factor of 25% from 1990 when48.9±1.5% of smokers made a quit attempt to 61.5±1.5% in 1999.
3. Despite the increased quitting incidence by 1999, smokers were successful(abstinent at least 90 days) at about the same rate as earlier in the decade.
4. In 1999, the group of smokers (>25 years of age) with no quit attempts in the pastyear and absolutely no intention to quit in the future comprised 9.1±1.2% of allsmokers, unchanged since 1996. Some of these smokers are light smokers whomay believe that they don’t need to quit.
5. Smokers both living and working in smokefree environments (23.7±1.2% in 1999)were significantly more likely to have made a recent quit attempt and to be lightsmokers than those with either or neither of these constraints on smoking.
Executive Summary and Key Findings
I-viii
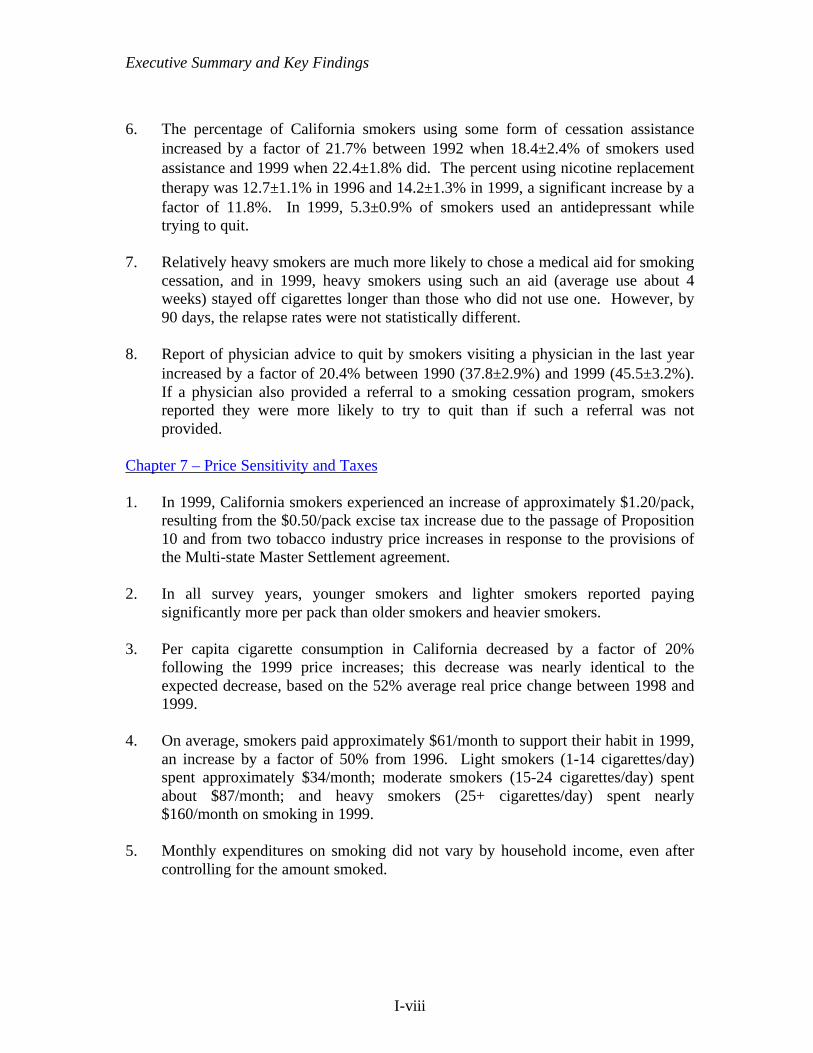
6. The percentage of California smokers using some form of cessation assistanceincreased by a factor of 21.7% between 1992 when 18.4±2.4% of smokers usedassistance and 1999 when 22.4±1.8% did. The percent using nicotine replacementtherapy was 12.7±1.1% in 1996 and 14.2±1.3% in 1999, a significant increase by afactor of 11.8%. In 1999, 5.3±0.9% of smokers used an antidepressant whiletrying to quit.
7. Relatively heavy smokers are much more likely to chose a medical aid for smokingcessation, and in 1999, heavy smokers using such an aid (average use about 4weeks) stayed off cigarettes longer than those who did not use one. However, by90 days, the relapse rates were not statistically different.
8. Report of physician advice to quit by smokers visiting a physician in the last yearincreased by a factor of 20.4% between 1990 (37.8±2.9%) and 1999 (45.5±3.2%).If a physician also provided a referral to a smoking cessation program, smokersreported they were more likely to try to quit than if such a referral was notprovided.
Chapter 7 – Price Sensitivity and Taxes
1. In 1999, California smokers experienced an increase of approximately $1.20/pack,resulting from the $0.50/pack excise tax increase due to the passage of Proposition10 and from two tobacco industry price increases in response to the provisions ofthe Multi-state Master Settlement agreement.
2. In all survey years, younger smokers and lighter smokers reported payingsignificantly more per pack than older smokers and heavier smokers.
3. Per capita cigarette consumption in California decreased by a factor of 20%following the 1999 price increases; this decrease was nearly identical to theexpected decrease, based on the 52% average real price change between 1998 and1999.
4. On average, smokers paid approximately $61/month to support their habit in 1999,an increase by a factor of 50% from 1996. Light smokers (1-14 cigarettes/day)spent approximately $34/month; moderate smokers (15-24 cigarettes/day) spentabout $87/month; and heavy smokers (25+ cigarettes/day) spent nearly$160/month on smoking in 1999.
5. Monthly expenditures on smoking did not vary by household income, even aftercontrolling for the amount smoked.
Executive Summary and Key Findings
I-ix
6. Only 5.4±0.8% of California smokers avoided the new excise tax by usuallypurchasing cigarettes over the Internet (0.4±0.3%), at military commissaries(1.9±0.5%), on Indian reservations (0.3±0.3%), or out of state (3.0±0.5%).
7. Nearly 70% of California smoker reported that they usually buy their cigarettesfrom the most expensive sources—convenience stores, liquor/drug stores, andsupermarkets.
8. Overall, over half (52.5±1.9%) of California smokers in 1999 reported that theywere worried about how much money they spend on cigarettes, an increase ofnearly 50% from 1996 (35.1±1.3%).
9. Even after the Proposition 10 $0.50/pack excise tax increase, approximately 70%of all respondents in 1999 supported an excise tax increase of at least $0.25/pack—and nearly 60% (58.2±1.3%) supported an increase of another $0.50/pack.
10. Based on the price change alone, it was expected that adolescent smokingprevalence would decrease by a factor of 38% between 1996 and 1999; the actualdecrease was 36%.
11. Despite the substantial increase in cigarette prices, the majority of adolescentcigarette buyers neither hesitated nor refused to give away cigarettes because of thecost.
12. Adolescent established smokers spent approximately $8/week on cigarettes in1999, which amounted to approximately 16% of their discretionary income.
13. Nearly all adolescent ever-smokers smoked premium brand cigarettes.
Chapter 8 – Media Influence on Smoking
1. Exposure to tobacco advertising, in the form of seeing logos on televised sportingevents, decreased significantly among both adolescents (by a factor of 36.5%) andadults (by a factor of 27.2%) between 1996 and 1999.
2. The percentage of adolescent committed never smokers that named Camel as thebrand of their favorite advertisement decreased significantly between 1996 and1999. However, the percent that named Marlboro as the brand of their favorite adincreased significantly.
3. Among all respondents, having a favorite brand of cigarette advertisements wasinversely related to age: around 60% of respondents under age 25 had a favoritead, while less than half of adults between 25 and 64 years old, and fewer than 30%of those 65 years and older had a favorite ad.

Executive Summary and Key Findings
I-x
4. Fewer adolescents (by a factor of 34.5%) and adults (by a factor of 18.8%)received tobacco promotional items in 1999, compared to 1996. In 1999,9.0±0.9% of adolescents received a promotional item.
5. Significantly fewer adolescents (14.9±1.1%) were willing to use a tobacco brandpromotional item in 1999, compared to 1996 (23.7±1.2%).
6. In both 1996 and 1999, significantly more adolescents were willing to use atobacco brand promotional item than actually had such an item, suggesting thatthere may be some unsatisfied demand for these items across all levels of smokingexperience.
7. In 1999, significantly more young adults (18-24 years old) than adolescents werewilling to use a tobacco brand promotional item.
8. Overall, only 1.2±0.2% of adults reported that they had ever given a tobaccopromotional item to a child or teenager. Significantly more—but still very few—adults (7.6±0.6%) reported that they would be willing to give a child or teenagersuch an item if they wanted it.
9. In 1999, considerably more Californians between 12-64 years old reported thatthey were exposed to lots of anti-tobacco messages over the TV, radio, or onbillboards, compared to 1996. Some of this increase may reflect the volume ofnews coverage of the tobacco industry litigation and regulation during 1997-1999.
10. In 1999, 68.9±1.0% of adults reported that they thought schools should prohibitstudents from wearing clothes with tobacco logos or bringing gear with tobaccologos to school. Nearly as many reported that they thought the industry should notbe permitted to offer items in exchange for coupons on cigarette packs(58.0±1.0%) and that the advertising of tobacco products should be completelybanned (63.2±0.9%).
Chapter 9 – Access to and Ease of Purchase of Cigarettes
1. For the first time since the CTS began in 1990, never smokers’ perceptions that itis easy to get cigarettes decreased significantly (by a factor of 16.1%) from57.2±1.5% in 1996 to 48.0±1.5% in 1999.
2. Overall, the percent of adolescents who thought it was easy to buy a pack ofcigarettes decreased significantly (by a factor of 48.2%) from 51.5±1.4% in 1996to 26.7±1.3% in 1999.
3. Overall, the percent of adolescents who thought it was easy to get a few cigarettesdecreased significantly (by a factor of 31.4%) from 69.1±1.2 in 1996 to 47.4±1.3%in 1999.

Executive Summary and Key Findings
I-xi
4. Consistently, from 1990 to 1999, approximately 40% of never smokers reportedthat they had been offered cigarettes.
5. The majority of adolescents reported that they usually get their cigarettes fromothers—61.3±3.4% were given these cigarettes and 21.9±2.5% had others buycigarettes for them in 1999.
6. Significantly fewer adolescent ever smokers reported that they usually bought theirown cigarettes in 1999 (9.3±2.1%) than in 1996 (16.1±2.2%).
7. Over 70% of adolescents who are given cigarettes get them from other underageadolescents, and another 22% get them from friends under the age of 21 years.
8. Most adolescents who buy cigarettes usually get them from gas stations, liquorstores, or small grocery stores—a pattern that has remained consistent since 1996.
9. Social sources of cigarettes are an important factor in adolescents’ access tocigarettes.
10. In 1999, approximately one-third (34.3±1.2%) of adults believed that minimumpurchase age laws are adequately enforced; this level is over twice as high as in1990, when only 15.2±0.8% of adults believed that these laws were adequatelyenforced.
Chapter 10 – School Smoking: Policies and Compliance
1. Adolescents report that compliance with school no-smoking rules has increaseddramatically since 1996. At that time 40.7±1.4% of students reported that most orall students who smoke obeyed the rule, and by 1999 66.7±1.5% gave this report,an increase by a factor of 63.9%.
2. Consequently, in 1999 the percentage of students who reported seeing someonesmoking on school property within the last two weeks (36.0±1.5%) was lower bya factor of 26.9% compared to 1996 (26.3±1.7%).
3. By 1999, 89.2±0.8% of all students expressed a preference that smoking be bannedon school grounds for everyone. Even 64.4±5.1% of current smokers expressedthis preference, up from 55.8±4.6% in 1996, a factor increase of 15.4%.
4. The percentage of students who reported that any teachers smoked continued todecline. In 1990, 81.0±1.7% of students perceived that any teachers smoked,which declined to 70.7±1.2% in 1996 and further to 66.9±1.8% by 1999, a factordecrease of 17.4% since 1990.

Executive Summary and Key Findings
I-xii
5. By 1999, all students should have been exposed to smoking prevention curriculumin school, and 77.8±1.4% reported that they had been, up from 73.2±1.8% in 1990,a factor increase of 6.3%.
6. Of students who reported having a class on the health effects of smoking, thepercentage who thought that the course was ineffective in making kids moreagainst smoking decreased from 56.9±4.6% in 1996 to 47.7±1.8% in 1999, a factordecrease of 16.2%. This trend was present even in students who had ever smokedor puffed on a cigarette.
Chapter 11 – Other Tobacco Use
1. The use of pipes and smokeless tobacco in adult males continues to decrease. In1999, only 1.5±0.4% of adult males currently used pipes and only 2.4±0.4% usedsmokeless tobacco.
2. The cigar smoking fad appears to have peaked. In 1999, adult current cigar usewas 4.4±0.3% compared to 4.9±0.5% in 1996. Importantly, current cigar usedeclined significantly among adults who had never smoked cigarettes, in men from7.5±1.4% in 1996 to 5.0±0.9% in 1999.
3. Regarding cigar smoking intensity, the 1999 CTS showed that:
a. Most current cigar smokers only smoke a few cigars a month: 83.2±3.7%smoked fewer than 5 cigars in the last month, and 43.3±5.5% smoked none inthe last month.
b. Current cigar smokers who are former cigarette smokers smoke more cigarsthan either never smokers or current smokers. Of former cigarette smokers,10.4±5.4% were daily cigar smokers and 19.0±7.5% smoked more than 10cigars/month. For never cigarette smokers these rates were 1.5±1.9% and6.3±4.0%, respectively, and for current cigarette smokers the rates are3.6±1.8% and 11.6±3.2%.
c. Current cigarette smokers are more likely to inhale the cigars they smoke(45.7±5.0%), compared to former cigarette smokers (20.5±8.6) or nevercigarette smokers (10.8±6.6%).
4. Smokeless tobacco use has continued to decline among adolescent boys. In 1999,the percentage of boys who had used smokeless tobacco in the past 30 days was0.6±0.2%, compared to 1.7±0.5% in 1993. The percentage of ever use(experimentation) was 3.1±0.5% in 1999, down from 8.7±0.7% in 1993.
Executive Summary and Key Findings
I-xiii
5. Adolescents of both genders are experimenting with cigars and a tobacco productnew to the United States, bidis, a flavored cigarette imported from Asian countries.In 1999, 11.9±1.1% of adolescents had experimented with cigars, downsignificantly from 15.0±1.2% in 1996. In 1999, 7.0±0.8% of adolescents reportedexperimenting with bidis.
6. Adolescent experimentation with other tobacco products is highly associated withtheir experience with cigarettes. Almost none of the adolescents committed tonever smoking cigarettes had used any other tobacco product. Since this portion ofthe adolescent population is increasing (Chapter 4), there should be declines in theuse of other tobacco products over time.

1-1
Chapter 1
COMPARISON OF CALIFORNIA TO THE RESTOF THE UNITED STATES

Comparison of California to the Rest of the United States
1-2
CHAPTER 1: COMPARISON OF CALIFORNIA TO THE REST OFTHE UNITED STATES
Introduction
In 1990, the goals outlined for the California Tobacco Control Program includedreducing tobacco use in California by 75% by the year 2000 (TEOC, 1991). It wasestimated that the rate of decline in per capita cigarette consumption would need todouble in California during the 1990’s decade to reach the goal. Both per capita cigaretteconsumption and adult smoking prevalence have been declining in California and the restof the United States ever since the health consequences of smoking became widelyknown (USDHS, 1989). This chapter compares the trends in per capita cigaretteconsumption and adult (18+ years) smoking prevalence in California and the rest of theUnited States.
To determine whether any decline in tobacco use in California can be attributed to theCalifornia Tobacco Control Program (TCP), such a decline should be at a rate faster thanbefore the TCP began, and during the program be faster than any decline observed in therest of the United States during the same time. The latter comparison is becoming lessmeaningful as more and more states adopt their own tobacco control programs. Recently,money from the state attorney generals’ settlement with the tobacco industry hasmotivated a number of states to mount serious tobacco control programs. Also, a numberof states have followed California’s lead and increased the amount of excise tax they levyon a package of cigarettes to support tobacco control programs.
Previously (Pierce et al., 1998a,b), the period of the California Tobacco Control Programwas divided into two parts, corresponding to a change in the level of resources devoted tothe Program (Balbach et al., 1997) and a decrease in the price of premium brands ofcigarettes by the tobacco industry in 1993 (Shapiro, 1993). Funding for the CaliforniaTobacco Control Program was reinstated to levels specified by Proposition 99 beginningwith fiscal year 1995-96. In January 1999, another large excise tax increase of$0.50/pack occurred following voter approval of Proposition 10 in the Fall of 1998. Also,around the same time, the tobacco industry raised the prices on cigarettes nationally byaround the same amount as the recent California excise tax increase to pay for theirsettlement with the state attorney generals.
Section 1 of this chapter focuses on trends in per capita cigarette consumption. Section 2is devoted to trends in adult smoking prevalence, and Section 3 summarizes the findingsof the chapter.
1. Per Capita Cigarette Consumption
Until late 1998 when it was disbanded, the Tobacco Institute compiled cigarette salesdata on a monthly basis in each state for federal tax reporting purposes (The Tobacco

Comparison of California to the Rest of the United States
1-3
Institute, 1997). Since then, the same group responsible for compilation of the earlierdata has been producing it as part of the economic consulting firm, Orzechowski andWalker, with support from the tobacco industry (Orzechowski & Walker, 2000). Theboard of equalization in each state compiles comparable data. For each pack of cigarettessold in California, excise tax stamps are required. A careful comparison of data fromthese two sources for California indicated that they are essentially equivalent. For thisreport, the data published by the consulting firm Orzechowski and Walker will be used,since it is gathered in a comparable way in each state and will enable a comparison ofCalifornia with the rest of the United States.
As these data are from wholesale warehouse removals, there is considerable variationfrom one month to the next; in particular, the levels of removals in the last month of anyquarter is strongly correlated with the removals in the first month of the next quarter.This variation has little to do with actual consumption and likely reflects businesspractice. In order to remove this source of variability, data were combined into 2-monthintervals with December/January, February/March, etc., treated as single intervals. Toconvert the sales data to per capita cigarette consumption, the mean number of packsremoved from warehouses in a given interval was divided by the total population ofadults aged 18 and older in California (or the rest of the United States) at that time.Annual population totals are available from the US Bureau of the Census (US Bureau ofthe Census, 1990, 1996, 1999), and these were interpolated to obtain the population atgiven times (interval midpoints) during the year. Finally, to better visualize the trends inthe computed per capita cigarette consumption, a special statistical procedure was appliedto smooth the data (Gilpin et al., 2001).
Figure 1.1 presents the trends in per capita cigarette consumption as packs/month fromJanuary-February 1983 through December 1999-January 2000 for persons aged 18 yearsand older for California and the remainder of the United States. Over the entire period,Californians consumed fewer cigarettes per capita than did people in the rest of theUnited States. In California, around the time the TCP began, the rate of decline in percapita cigarette consumption appeared to change. This increase in the rate of declineoccurred several months before the passage of Proposition 99 and almost 18 monthsbefore the start of the first TCP intervention. However, the faster rate of decline iscoincident with the start of the $24 million media campaign mounted by the tobaccoindustry to convince voters to defeat Proposition 99.
Beginning in 1994, the rate of decline in per capita consumption slowed in California,perhaps because of lower levels of resources devoted to TCP. Although resources wereincreased again in fiscal year 1995-1996, the disruption in funding necessitated the hiringand training of new staff at all program levels, so that considerable time elapsed beforethe TCP was back on track. There was no noticeable increase in the rate of decline in percapita consumption until at least late 1996. There appears to be another change in therate of decline in per capita cigarette consumption in the last two years, corresponding tothe unprecedented increase in the price of cigarettes because of the tobacco industrysettlement and because of the $0.50/pack excise tax increase in January of 1999.

Comparison of California to the Rest of the United States
1-4
In the rest of the United States, the decline in per capita cigarette consumption observedduring the 1980s halted beginning in 1993, around the time the tobacco industry reducedprices on premium brands of cigarettes, and the per capita consumption level hasremained fairly steady, except a recent downturn following the tobacco industry priceincrease.
Because there did not appear to be a change in the rate of decline in per capitaconsumption in California when funding was restored in fiscal year 1995-1996, theanalysis presented below uses the period from the beginning of 1989 through the end of1993 as the early period, the period from the beginning of 1994 through Fall 1998 as amid period (Pierce et al., 1998b), and then includes a new more recent period, beginningaround the time the tobacco industry began raising prices to compensate for thesettlement with the states in the fall of 1998. More precisely, the date demarking thepreprogram and early program periods was December 31, 1988, the date demarking theearly and mid program periods was December 31, 1993, and the date demarking the mostrecent period was October 31, 1998. Because there are only 7 bimonthly data points inthe most recent period, the results must be interpreted with caution. Figure 1.2 plots theregression lines fitted to deseasonalized bimonthly consumption data before thebeginning of the TCP and for each period during the Program. The regression modelemployed (Gilpin et al., 2001) can evaluate whether the change in the slope of theregression line from one period to the next is statistically significant.
0
2
4
6
8
10
12
14
16
1983 1985 1987 1989 1991 1993 1995 1997 1999 2001
Year
Pac
ks p
er M
on
th
California
California TrendUS minus CaliforniaUS Trend
Source: Tobacco Institute; Orzechowski & Walker; U.S. Bureau of Census Figure 1.1
Seasonally Adjusted Trend of Per Capita Consumptionfor Cigarettes, California vs. U.S.

Comparison of California to the Rest of the United States
1-5
The computed slopes and the estimates of per capita cigarette consumption obtained fromthe models are presented in Table 1.1.
Before the excise tax increase in California in January 1989, monthly consumption hadbeen declining at an annual rate of 0.46 packs/person so that in December 1988,Californians were consuming an average of 9.5 packs/person. After the start of the TCP,the annual rate of decline in monthly consumption increased significantly from 0.46 to0.58 packs/person, so that in June 1993, Californians were consuming an average of 6.6packs/person. Thus, the early period in the TCP was associated with an increase by afactor of 31% in the annual rate of decline in per capita cigarette consumption in thestate.
In the mid period of the TCP, the annual rate of decline in monthly consumptiondecreased to 0.16 packs/person. This reduction in the rate of decline represented a
Table 1.1Summary of Decreases in Per Capita Cigarette Consumption
California Rest of US
PeriodRate ofDecline
Per CapitaPacks/Month1
Rate ofDecline
Per CapitaPacks/Month1
Pre-Program (1/83-12/88) -0.46 9.5 -0.35 12.4Early Program (1/89-12/93) -0.58 6.6 -0.40 10.3Mid Program (1/94-10/98) -0.16 5.8 -0.07 10.0Recent Program (10/98-12/99) -1.56 4.1 -0.78 9.1
1Packs/person: December 1988, December 1993, October 1998, December 1999Source: Tobacco Institute; Orzechowski and Walker; U.S. Bureau of Census
0
2
4
68
10
12
14
16
1983 1985 1987 1989 1991 1993 1995 1997 1999 2001
Year
Pac
ks/M
on
th
California
US minus California
Per Capita Consumption Trends, California vs. U.S.
Source: Tobacco Institute; Orzechow ski & Walker; U.S. Bureau of the Census Figure 1.2

Comparison of California to the Rest of the United States
1-6
statistically significant change from the rate of decline in the early period. The modelindicated that in October of 1998, monthly per capita consumption was 5.8 packs/person.Further, the model indicated that the rate of decline seen in the most recent period issignificantly greater than in the mid period, and estimated that Californians wereconsuming 4.1 packs/person in December of 1999.
Before the start of the TCP, monthly cigarette consumption had also been declining in therest of the United States at an annual rate of 0.35 packs/person. By December 1988,residents in the rest of the United States were consuming an average of 12.4packs/person; this was higher than the per capita consumption in California by a factor of31%. During the early period of the TCP (through 1993), the annual rate of decline inmonthly consumption in the rest of the United States increased slightly but notsignificantly from 0.35 to 0.40 packs/person to a consumption level of 10.3 packs/monthin December 1993. At this time, the level of consumption in the rest of the United Stateswas higher than in California by a factor of 46%. During the mid period of the TCP, theannual rate of decline in monthly cigarette consumption in the rest of the United Stateswas only 0.07 packs/person, and, as in California, this was a significant decrease from theearly program years. Just as in California, the rate of decline increased significantly in themost recent period, so that the model estimates that in December of 1999 per capitaconsumption in the rest of the US was 9.1 packs/person, higher than that in California bya factor of 55%.
The increase in the rate of decline in per capita consumption seen both in California andthe rest of the United States in the most recent period corresponding to major increases inthe price of cigarettes may or may not be sustained. It may only represent a shock thatwill return to a more modest level of decline after a few more months. This may havealso been the situation following the initial $0.25/pack excise tax from Proposition 99(Figure 1.1).
Over the entire period from the beginning of the TCP through December 1999, per capitacigarette consumption declined by a factor of 57% in California and by a factor of 27% inthe rest of the United States. Thus, over this period, California cut per capita cigaretteconsumption twice as much as the rest of the United States.
Per Capita Cigarette Consumption from Sales Data and Smoker Reported Consumption
Per capita cigarette consumption for California can also be estimated from the CaliforniaTobacco Surveys, since each current smoker responding to the surveys is asked about hisor her level of cigarette consumption. In all the CTS, smokers were asked the followingquestions:
Daily smokers• On average how many cigarettes do you smoke each day?Occasional smokers• How many days did you smoke in the past month?• On the days you did smoke, about how many cigarettes did you smoke?

Comparison of California to the Rest of the United States
1-7
For daily smokers, packs/month was computed by multiplying reported daily cigaretteconsumption by 30 days and dividing the result by 20 cigarettes per pack. For occasionalsmokers, the number of days the smoker smoked was multiplied by the number ofcigarettes usually smoked those days and the result divided by 20 cigarettes per pack.
Figure 1.3 shows the same sales data shown in Figure 1.1 and the self-reportedconsumption from the 1990 through 1999 CTS. The 1993 survey is not included,because it did not query occasional smoking. The data plotted in the figure aresummarized in Table 1.2, along with the difference between the self-reportedconsumption from the survey and the value from the model (Figure 1.2).
In California, the self-reported consumption data consistently underestimated the salesdata compared to the model estimate; this phenomenon has been identified previously innational surveys (USDHHS, 1989). This difference has been attributed to rounding down
Comparison of Consumption Estimates from Wholesale Removal Data and Self-Report
0
2
4
6
8
10
12
1990 1992 1994 1996 1998 2000
Pac
ks/M
on
th/C
apit
a
Wholesale Removals (Deseasonalized)
Self-Report
Fitted Line
Source: CTS 1990, 1992, 1996, 1999; Figures 1.1 and 1.2 Figure 1.3
Table 1.2Smokers’ Self-Reported Cigarette Consumption
Self-ReportedConsumption(packs/month)
Estimate from Modelof Cigarette Sales Data
(packs/month)
FactorLower
%1990 CTS,10-11/1990 5.2 (±0.2) 8.4 (8.3-8.5) -38.21992 CTS, 4-5/1992 4.7 (±0.4) 7.4 (7.3-7.5) -36.51996 CTS, 10-11/1996 3.8 (±0.1) 6.1 (6.0-6.3) -37.71999 CTS,10-11/1999 3.4 (±0.1) 4.2 (3.9-4.5) -19.6
Mean consumption is shown with 95% confidence intervals.Source: CTS 1990, 1992, 1996, 1999; Figures 1.1 and 1.2

Comparison of California to the Rest of the United States
1-8
to the nearest half pack when smokers, particularly heavy smokers, report their averagedaily consumption and to the fact that not all cigarettes purchased are consumed.However, in 1999 the CTS estimate of per capita consumption shows less of adifferential. It is possible that with considerably reduced consumption, smokers estimatetheir average daily consumption more accurately with less rounding. While heavysmokers may still round down to the nearest half pack, light smokers may be giving anaccurate estimate of how many cigarettes they smoke a day.
2. Adult Smoking Prevalence
A number of surveys conducted nationally and within California ask respondents abouttheir smoking status. Data from all methodologically sound population surveysconducted since 1974 were considered for the analysis of smoking trends in Californiacompared to the rest of the United States. With the exception of the 1985 CurrentPopulation Survey (CPS), the only large-scale national population surveys conducted ona regular basis prior to 1988 in the United States were the National Health InterviewSurveys (NHIS). Subsequently, in addition to the NHIS (1990, 1992, 1993, 1994, 1997,1998), there have been multiple CPS (1989, 1992, 1993, 1995, 1996, 1998, 1999). TheNHIS and CPS are large enough, and California is a large enough fraction of the sample,that prevalence estimates for California can be computed. Since the beginning of theCalifornia Tobacco Control Program, there have also been statewide surveys for tobaccouse surveillance: These are the California Tobacco Surveys (CTS) (1990, 1992, 1993,1996, 1999) and the California Adult Tobacco Surveys (CATS) (1993, 1994, 1995, 1996,1997, 1998, 1999). The CATS are supplements to the Behavioral Risk Factor Surveys(BRFS) conducted each year in California. Data from the BRFS (1991, 1992) areconsidered as well. All of these surveys are described in detail elsewhere (Pierce et al.,1998a). There are differences in survey methodology (e.g., sample selection, surveymode, sample size, question format and how a current smoker is defined) that will lead todifferences in prevalence estimates between surveys in the same year.
Having considered all of these surveys, some were excluded from the analysis for severalreasons. Two surveys, the 1976 and 1977 NHIS did not interview persons as young as 18years of age. The 1974 NHIS and the 1985 and 1989 CPS had unacceptably high rates(>2%) of missing data for smoking status. Finally, due to budget cuts, the 1992 NHISwas terminated prematurely, with consequences regarding sample size, response rate, andrepresentativeness.
In comparing smoking prevalence rates over time, changes in the composition of thepopulation need to be taken into consideration. Also, the demographic profile ofCalifornia differs from the rest of the United States. Accordingly, the prevalenceestimates from each survey were standardized to the same 1999 California populationtotals used for weighting the 1999 CTS. This assures that the prevalence estimates forCalifornia from the 1999 CTS screener survey will be the same, standardized or not. As

Comparison of California to the Rest of the United States
1-9
Smoking Prevalence Among California Adults Aged 18 or Older
15
20
25
30
35
1975 1980 1985 1990 1995 2000
%
NHISCATS/BRFSCPSCTSPredicted95% CI
a result, however, prevalence estimates for previous years will differ from those reportedpreviously. The standardization variables were gender, age, race and educational level.1
Figure 1.4 shows all the prevalence estimates for California and Figure 1.5 plots all theestimates for the rest of the US. Each figure also shows a regression fit to the data usingthe same basic model used to describe the per capita cigarette consumption data.
However, the mid and recent periods were not broken out because in the most recentperiod there were not enough prevalence points for valid modeling. In the regressionanalysis the standardized estimates were weighted by the inverse of the sample size sothat small surveys were not given undue emphasis.
1 The data from each survey were standardized to the January 1999 California population distribution forgender, age (18-29,30-39,40-49,50-59,60+), race (White, Non-White) and educational level (college, nocollege) (Gilpin et al., 2001).
Source: NHIS, 1978, 1979, 1980, 1983, 1985, 1987, 1988, 1990, 1991, 1993,1994, 1997, 1998; CTS 1990, 1992,1993, 1996, 1999; BRFS/CATS 1991-1999;CPS 1992-1993, 1995-1996, 1998-1999
Figure 1.4

Comparison of California to the Rest of the United States
1-10
Before summarizing the results of the regression analysis, the data points deserve somecomment. The screener survey as used for the 1999 CTS California prevalence estimate,despite the change in question used to query smoking status. The NHIS also changed itsquestion in the same way beginning in 1992. Further, the estimates from the CTS and allof the other surveys include the criterion that smokers must report smoking at least 100cigarettes in their lifetime to be considered a current smoker. The January 1999 CPSprevalence estimate for California was much lower than the November 1998 estimate orthe May 1999 estimate (Figure 1.4), whereas the estimates for January and May of 1999for the rest of the Unites States (Figure 1.5) were very close. The California result couldbe because of a rash of quitting in January 1999 following the $0.50/pack excise taxincrease. Survey respondents in January 1999 may have been in the middle of a quitattempt when surveyed, but when the May 1999 survey was being conducted, manysmokers who quit earlier in the year had relapsed and were counted as current smokers.Because of this, the prevalence for California is probably better estimated from theSeptember 1998 and May 1999 survey results, which closely agree with the 1999 CTSestimate.
Smoking Prevalence Among Adults in the Rest of the United States, Aged 18 and Older
15
20
25
30
35
1975 1980 1985 1990 1995 2000
%
NHISCPSPredicted95% CI
Source: NHIS, 1978, 1979, 1980, 1983, 1985, 1987, 1988, 1990, 1991, 1993,1994, 1997, 1998; CTS 1990, 1992,1993, 1996, 1999; BRFS/CATS 1991-1999;CPS 1992-1993, 1995-1996, 1998-1999
Figure 1.5

1-11
The results from the regression analysis including model estimates of smokingprevalence and slopes (rate of decline) are presented in Table 1.3
The introduction of the TCP in California was associated with an increase by a factor of31% in the rate of decline in smoking prevalence (from 0.77 to 1.01%/year) so thatestimated smoking prevalence was 17.8% in December 1993. The early years of the TCPcoincided with a reduction in smoking prevalence in California by a factor of 22%.During the later period of the TCP, the decline in prevalence in California halted, astatistically significant change from the early period. By December 1999, the modelestimates smoking prevalence in California to be 17.5%, which represents a decline by afactor of 24% from the pre-program level.
The rate of decline in prevalence in the rest of the United States slowed slightly duringthe early period of the TCP, and it slowed again (significantly) during the later period.Over the entire period, the model estimate of smoking prevalence in the rest of the UnitedStates indicates a decline by a factor of 17%.
Figure 1.6 shows the regression models for both California and the rest of the UnitedStates. Despite the slowing of the decline in prevalence in California during the laterperiod of the TCP, the prevalence differential between California and the rest of theUnited States at the end of 1999 is still greater than before the TCP began. In Decemberof 1988, smoking prevalence in California was lower than that in the rest of the UnitedStates by a factor of 12%, and by the end of 1999, it was lower by a factor of 19%. If therest of the United States and California maintain their present rates of decline, smokingprevalence will be at comparable levels in the year 2015.
Table 1.3Summary of Decreases in Smoking Prevalence
California Rest of the US
PeriodRate ofDecline
ModelPrevalenceEstimate1
Rate ofDecline
ModelPrevalenceEstimate1
Pre-Program (1/83-12/88) -0.77 22.9 -0.78 26.0Early Program (1/89-12/93) -1.01 17.8 -0.51 23.5Mid/Recent Program (1/94-12/99) -0.05 17.5 -0.32 21.5
1Prevalence in December 1988, December 1993, December 1999.Source: NHIS 1978, 1979, 1980, 1983, 1985, 1987, 1988, 1990, 1991, 1993, 1994, 1997, 1998; CTS 1990, 1992, 1993,1996,1999; BRFS/CATS 1991-1999; CPS 1992-1993, 1995-1996, 1998-1999

Comparison of California to the Rest of the United States
1-12
Source: NHIS, 1978, 1979, 1980, 1983, 1985, 1987, 1988, 1990, 1991, 1993, 1994,1997, 1998; CPS 1992-1993, 1995-1996, 1998-1999 Figure 1.6
3. Summary
While the goal of reducing tobacco use by 75% was not achieved by the year 2000,important progress was achieved during the decade. Despite a slowing in the rate ofdecline in smoking during the mid period of the California Tobacco Control Program(TCP), California has shown a greater reduction in both per capita cigarette consumptionand smoking prevalence between December 1988 and December 1999 than occurred inthe rest of the United States. Over the period of the TCP, California reduced its per capitacigarette consumption by a factor of 57% compared to 27% in the rest of the UnitedStates. It reduced adult (18+ years) smoking prevalence by a factor of 24% compared to17% in the rest of the United States. However, if California is to maintain thisdifferential in smoking prevalence, increased efforts are required to spur its rate ofdecline in smoking prevalence.
The decline in per capita cigarette consumption has been much larger than the decline insmoking prevalence in California. From the beginning of the TCP until December of1999, per capita cigarette consumption declined by a factor of 57%, while smoking
Smoking Prevalence among Adults Aged 18and Older, California vs. US
15
20
25
30
35
1975 1980 1985 1990 1995 2000
%
CaliforniaRest of US

Comparison of California to the Rest of the United States
1-13
prevalence only declined by a factor of 24%. This is consistent with the self-reportedconsumption data (Table 1.2), and data presented in Chapters 2 and 6 which show thatfewer Californians are daily smokers and an ever increasing percentage of Californiasmokers have joined the ranks of light smokers, those who smoke fewer than 15cigarettes/day. It is possible that in response to the increased price of cigarettes,including the major excise tax increase, many more California smokers are choosing tocut consumption in the short term rather than to quit altogether.
Reducing daily cigarette consumption may or may not lead to a lower level of nicotineaddiction. Some smokers may be getting more nicotine from each cigarette they smoke.For smokers who do manage to reduce their level of nicotine intake, successful quittingmay be more likely to occur in the long term (Pierce et al., 1998c).

Comparison of California to the Rest of the United States
1-14
CHAPTER 1: KEY FINDINGS
1. During the decade of the California Tobacco Control Program, a statistical model ofadult (18+ years) per capita cigarette consumption indicates that consumption hasdecreased in California from 9.5 packs/month in December 1989 to 4.1packs/month in December of 1999, a decline by a factor of 57%.
2. In the rest of the United States, a comparable statistical model indicates per capitacigarette consumption decreased from 12.4 packs/month in December 1989 to 9.1packs/month in December of 1999, a decline by a factor of 27%. Thus,consumption declined in California by twice as much as it did in the rest of theUnited States.
3. Over the period of the California Tobacco Control Program, a statistical modelindicates that adult smoking prevalence declined by a factor of 24%, compared to17% in the rest of the United States. In December of 1999, prevalence estimatedfrom the model was 17.5% in California and 21.5% in the rest of the United States.
4. Over the 10-year period, adult smoking prevalence declined more in California thanin the rest of the United States. However, most of the decline in California occurredduring the early years of the Tobacco Control Program, while the smaller decline inthe rest of the country occurred relatively evenly over the period.
5. In recent years, continued declines in per capita cigarette consumption were notaccompanied by a change in smoking prevalence. This suggests that Californiasmokers are reducing the number of cigarettes they smoke rather than quittingaltogether.
Comparison of California to the Rest of the United States
1-15
CHAPTER 1: GLOSSARY
Adults
Current smoker – has smoked at least 100 cigarettes in his or her lifetime and smokesnow (old question) or now either everyday or some days (new question) at the time ofthe survey.
Daily smoker – a current smoker who has smoked on every day of the past month (oldquestion sequence) or who now smokes everyday (new question).
Occasional smoker – a current smoker who smoked on at least 1 day in the past month(old question sequence) or who says he or she now smokes some days (new question).

Comparison of California to the Rest of the United States
1-16
CHAPTER 1: REFERENCES
Balbach ED, Monardi FM, Fox BJ, Glantz SA. Holding Government Accountable:Tobacco Policy making in California, 1955-1997. San Francisco, CA: Institute forHealth Policy Studies, School of Medicine, University of California, San Francisco;1997.
Gilpin EA, Emery SL, Berry CC. Technical Report on Analytic Methods andApproaches Used in the 1996 California Tobacco Survey Analysis. Vol 3: MethodsUsed for Final Report-The California Tobacco Control Program: A Decade of Progress,1989-1999. La Jolla, CA: University of California, San Diego; 2001.
Orzechowski & Walker. The Tax Burden on Tobacco. Volume 34, 1999. Monthly StateCigarette Tax Reports. February 1983 though January 2000. Washington, DC; 2000.
Pierce JP, Gilpin EA, Emery SL, Farkas AJ, Shu SH, Choi WS, Berry CC, Distefan JM,White MM, Soroko S, Navarro A. Tobacco Control in California: Who’s Winning theWar? An Evaluation of the Tobacco control Program, 1989-1996. La Jolla, CA:University of California, San Diego; 1998a. World Wide Web: http://ssdc.ucsd.edu/tobacco
Pierce JP, Gilpin EA, Emery SL, White MM, Farkas AJ, Rosbrook B, Berry CC. Has theCalifornia Tobacco Control Program reduced smoking? Journal of the AmericanMedical Association. 1998b:208:893-899.
Pierce JP, Farkas AJ, Gilpin EA. Beyond stages of change: the quitting continuummeasures progress towards successful smoking cessation. Addiction. 1998c;93(2):277-286.
Shapiro E. Price cut on Marlboro upsets rosy notions about tobacco profits. Wall StreetJournal. 1993(April 10);221(65).
Tobacco Education Oversight Committee. Toward a Tobacco-Free California: A MasterPlan to Reduce Californian’s Use of Tobacco, January 1, 1991.
The Tobacco Institute. The Tax Burden on Tobacco. Volume 32, 1997. Monthly StateCigarette Tax Reports. February 1983 through June 1997. 1875 I Street, N.W.Washington, DC 20006; 1997.
US Bureau of Census. Resident Population for Selected Age Groups: 1980-1989. USBureau of the Census, Population Distribution Branch; 1990.
US Bureau of Census. Resident Population for Selected Age Groups: 1990-1996. USBureau of the Census, Population Distribution Branch; 1996.

Comparison of California to the Rest of the United States
1-17
US Bureau of Census. Resident Population for Selected Age Groups: 1990-1999. USBureau of the Census, Population Distribution Branch; 1999.
US Department of Health and Human Services. Reducing The Health Consequences ofSmoking: 25 Years of Progress. A Report of the Surgeon General. USDHHS, Centersfor Disease Control and Prevention, National Center for Chronic Disease Prevention andHealth Promotion, Office on Smoking and Health. DHHS Pub. No. (CDC) 89-8411;1989.

2-1
Chapter 2
SMOKING PREVALENCE IN CALIFORNIA:RESULTS OF THE CALIFORNIA TOBACCOSURVEYS (CTS)

Smoking Prevalence in California: Results of the California Tobacco Surveys (CTS)
2-2
CHAPTER 2: SMOKING PREVALENCE IN CALIFORNIA:RESULTS OF THE CALIFORNIA TOBACCO SURVEYS (CTS)
Introduction
A decrease in population smoking prevalence is generally the main goal and measure ofsuccess of a tobacco control program. However, focusing only on population smokingprevalence can mask important changes in smoking behavior that may have resulted froma tobacco control program. For instance, smokers may cut down on the amount theysmoke, even to the extent of not smoking every day, thereby reducing their chances of asmoking-related health outcome. The present chapter begins with an examination of thesmoking patterns of current smokers, and then describes trends in the prevalence of dailysmoking, still a serious health threat, in more detail.
While Chapter 1 presented overall trends in current smoking prevalence in California andthe rest of the US over the decade of the California Tobacco Control Program, thischapter features trends within demographic subgroups in California. All the analyses inthis chapter are restricted to data from the California Tobacco Surveys (CTS). The CTSwere mandated by the State Legislature for surveillance of smoking behavior in theCalifornia population (LRC, 1995), and the first survey was fielded in late 1990, just asthe TCP was getting underway. Additional surveys were conducted in 1992, 1993, 1996and 1999. Complete descriptions of these surveys are presented elsewhere (Pierce et al.,1998, Gilpin et al., 2001).
The CTS are random-digit-dialed telephone surveys. When a selected telephone numberis answered, the interviewer establishes that the number is for a residence and asks tospeak to an available household adult (18+ years of age) about the household, who livesthere and whether or not each resident is a smoker. In the various survey years, between14,736 and 91,174 households were enumerated. Once the household is enumerated inthis fashion, some adults and adolescents are selected for an extended interviewconcerning smoking behavior and attitudes/opinions on smoking-related issues. Theinitial household “screening” interview takes about 5 minutes to complete, and theextended interviews about 20-25 minutes.
The 1996 CTS was a transitional survey; it introduced a new question to define smokingprevalence on the adult interview with the previous question from earlier CTS retained onthe screener interview. Then, in 1999, the new question was utilized on both the screenerand adult interviews. Because of the change in question, the trends in prevalence overtime need to be interpreted within two time frames: (1) from 1990 to 1996 using thescreener survey for a large sample size with a consistent smoking status question, and (2)from 1996 to 1999 using the adult interview with a consistent smoking status question.Details about the changes in the smoking status question and definition of a currentsmoker are explained in the Appendix to this chapter.

Smoking Prevalence in California: Results of the California Tobacco Surveys (CTS)
2-3
Also, when comparing trends in smoking prevalence over time it is essential to take intoaccount any changes in the demographic composition of the California population(largely from migration). For this reason, the results presented in the main body of thischapter are standardized estimates. The unstandardized or snap-shot estimates ofsmoking prevalence are presented in the Appendix. These are the best estimates to usewhen the question is: What was the prevalence rate in a given year?
Section 1 of this chapter presents the changing patterns of smoking behavior amongcurrent California adult smokers over the decade. Section 2 presents trends in theprevalence of adult daily smoking. Section 3 describes the trends in total or overall adultcurrent smoking prevalence by demographic subgroups. Similar trends for the 18 regionsin California are shown in Section 4. Section 5 reports on adolescent smokingprevalence, and section 6 summarizes the results of this chapter.
1. The Changing California Adult Smoker
As pointed out in Chapter 1, since 1994 per capita cigarette consumption has declined bymore than a third in California but concurrently there was little decline in adult smokingprevalence. To better understand this apparent contradiction, this section looks moreclosely at the behavior of smokers and presents evidence that current smokers aremodifying their smoking patterns. Current smokers are broken out as daily or occasionalsmokers, and the daily smokers are further described according to their level of dailycigarette consumption. For the method of determining whether a smoker is a daily or anoccasional smoker, see the Appendix at the end of this chapter.
Table 2.1 shows the profile of current smokers for two age groups. The percentages arestandardized within age group by race/ethnicity and education. Details of the rationalefor this standardization are in the technical documentations (Gilpin et al., 2001).
Table 2.1Percentage of Current Smokers Who Are Daily and Occasional Smokers
Estimated from Adult Survey WITH 100 Cigarette Criterion1990
%1992
%1996
%1999
%Age 18-44 Daily 76.3 (±2.5) 74.1 (±3.3) 67.9 (±2.1) 63.6 (±2.1) >15cigs/day 44.4 (±1.8) 44.0 (±3.2) 33.9 (±1.6) 30.2 (±1.7) <15cigs/day 31.9 (±2.2) 30.2 (±3.6) 34.0 (±2.1) 33.4 (±2.0) Occasional 23.7 (±2.5) 25.9 (±3.3) 32.1 (±2.1) 36.4 (±2.1)Age 45+ Daily 86.3 (±2.7) 87.9 (±1.7) 83.1 (±2.2) 79.5 (±3.0) >15cigs/day 60.9 (±3.4) 61.2 (±3.6) 56.4 (±2.7) 52.7 (±3.2) <15cigs/day 25.4 (±3.0) 26.7 (±3.2) 26.7 (±2.4) 26.8 (±3.0) Occasional 13.7 (±2.7) 12.1 (±1.7) 16.9 (±2.2) 20.5 (±3.0)
Table entries are standardized (1999) percentages and 95% confidence limitsSource: CTS 1990, 1992, 1996, 1999

Smoking Prevalence in California: Results of the California Tobacco Surveys (CTS)
2-4
The percent of occasional smokers of all current smokers for the 1990 and 1992 adultCTS remained fairly constant, but there was an increase between 1992 and 1996. Whilesome of this increase may be from smokers switching from daily to occasional smoking,some of the increase is because of the change in the question used to determine smokingstatus (see Appendix to this chapter). However, the fraction of occasional smokersfurther increased between 1996 and 1999, when the survey question was the same.
The percent of current smokers that are heavy daily smokers (15+ cigarettes/day) hasdeclined considerably in the younger age group, by a factor of 32.0%. The shift in theolder age group was not as marked, a factor of 13.5%. In both age groups, while heavydaily smoking has decreased and occasional smoking has increased, light daily smokersmake up just about the same percent of current smokers in all years. With these data, itcannot be determined whether heavy daily smokers are becoming light daily smokerswho in turn are becoming occasional smokers or whether heavy daily smokers areconverting to occasional smoking. Nevertheless, in both age groups, it is apparent thatcurrent smokers are smoking less in 1999 than they were in 1990.
The decline in daily smoking, particularly heavy daily smoking, over the decade mayreflect a success of the California Tobacco Control Program in reducing the harm to thepopulation from cigarette smoking. While total current smoking prevalence has notdeclined as much as would be desired, at least smokers are smoking less. Since the harmfrom cigarette smoking is dose dependent, a reduced prevalence of daily smoking shouldyield public health benefits in the long term.
2. Daily Smoking Among California Adults
Since nondaily (or occasional) smoking does notpresent the same level of health risk as daily smoking,it is more important to track trends in the prevalence ofdaily smoking. The standardized prevalence of dailysmoking computed from the adult survey (screenerdoes not distinguish daily from occasional smokers)was compared for the 1990, 1992, 1996 and 1999
surveys. The 1993 survey did not differentiate daily smoking. The unstandardized ratesfor daily smoking are also shown in Figure 2.1 for comparison. From the standardizedrates, it can be seen that the population prevalence of daily smoking declinedsignificantly over the decade by a factor of 18.6%. Unstandardized daily smokingprevalence rates for demographic subgroups of the population are presented in theAppendix to this chapter.
In 1999, only 13.0+0.3% ofCalifornia adults were dailysmokers, and the prevalenceof daily smoking has declinedconsistently throughout the1990s, by a factor of 18.6%.

Smoking Prevalence in California: Results of the California Tobacco Surveys (CTS)
2-5
Table 2.2 shows the standardized prevalence of daily smoking by demographic subgroup.
Table 2.2Standardized California Adult Daily Smoking Prevalence
WITH the 100-Cigarette Criterion1990%
1992%
1996%
1999%
FactorDecrease
1990-1999%
Overall 15.9 (±0.4) 14.7(±0.7) 13.9(±0.3) 13.0(±0.3) 18.6Gender Male 18.2 (±0.8) 17.0 (±1.1) 16.0 (±0.4) 15.4 (±0.5) 15.4 Female 13.8 (±0.5) 12.3 (±0.7) 11.9 (±0.3) 10.8 (±0.5) 21.5Age 18-24 13.7 (±1.4) 12.9 (±2.0) 13.8 (±0.9) 13.0 (±0.8) 5.2 25-44 17.1 (±0.6) 15.9 (±1.3) 15.0 (±0.4) 14.1 (±0.5) 17.9 45-64 17.4 (±1.2) 16.8 (±2.0) 14.9 (±0.7) 14.0 (±0.8) 20.0 65+ 10.5 (±1.4) 9.0 (±1.9) 8.0 (±0.8) 7.5 (±1.1) 28.4Race/Ethnicity African-American 22.9 (±3.0) 17.7 (±3.6) 17.6 (±1.5) 13.6 (±1.5) 40.5 Asian/PI 11.7 (±2.4) 9.8 (±2.4) 9.9 (±1.1) 9.2 (±1.4) 21.7 Hispanic 10.8 (±1.4) 9.9 (±3.2) 9.0 (±0.7) 8.7 (±0.7) 20.0 Non Hispanic White 18.3 (±0.7) 17.3 (±1.7) 16.4 (±0.3) 15.3 (±0.4) 16.4Education <12 18.3 (±1.7) 15.9 (±3.1) 14.8 (±0.7) 14.9 (±1.0) 18.6 12 19.3 (±0.9) 19.2 (±1.7) 19.0 (±0.5) 17.6 (±0.7) 8.9 13-15 16.6 (±1.1) 14.8 (±1.1) 14.8 (±0.7) 13.9 (±0.6) 16.5 16+ 9.6 (±0.9) 8.3 (±0.8) 7.3 (±0.5) 6.4 (±0.4) 33.3
Table entries are standardized (1999) percentages and 95% confidence limitsSource: CTS 1990, 1992, 1996, 1999
Adult Daily Smoking, Standardized and Unstandardized
13.013.0
17.5
14.1
16.4
13.9
15.9
14.7
12
14
16
18
20
22
1988 1990 1992 1994 1996 1998 2000
%
Unstandardized
Standardized (1999)
Source: CTS 1990, 1992, 1996, 1999 Figure 2.1

Smoking Prevalence in California: Results of the California Tobacco Surveys (CTS)
2-6
Adult women showed lower rates of daily smoking ineach year. Daily smoking prevalence was less in adultsage ≥65 years, and by 1999 only 7.5±1.1% of adults inthis age group smoked daily, a decrease by a factor of28.4% since 1990. The only age group that did not
show a substantial decline in daily smoking was young adults 18-24 years of age.
African American adults started with the highest prevalence of daily smoking in 1990,and showed a large factor decrease of 40.5%, bringing their prevalence of daily smokinglower than Non-Hispanic Whites by 1999. Hispanics and Asians also showed a largefactor decrease in daily smoking over the decade (about 20%), so that daily smokingprevalence was only 8.7±0.7% in 1999 for Hispanics and 9.2±1.4% for Asians.
Compared to the less educated, Californians whograduated college showed the largest factor decreasebetween 1990 and 1999 (33.3%), bringing dailysmoking prevalence in this group to a very low rateof 6.4±0.4% in 1999. However, even adults whonever graduated high school showed a decline in
daily smoking prevalence over the decade by a factor of 18.6%.
3. Demographics of Total Adult Current Smoking
In the subsections below, standardized current smoking prevalence is presented fordifferent demographic subgroups of the adult population. The results presented in thefigures and tables of this section show standardized prevalence estimates from the 1990,1993, and 1996 screener surveys that had a consistent question to determine smokingstatus. Data are also shown from the 1996 and 1999 adult extended interviews with thenew smoking status question so that recent trends can be discerned. Figure 2.2 illustratesthe effect of the question change, and indicates that overall standardized adult smokingprevalence has not changed between 1996 (18.7±0.5%) and 1999 (18.6±0.7%).
When current smoking prevalence is shown by demographic subgroups, the sample sizeis diminished and differences must be much larger to be considered statisticallysignificant. Nevertheless, it is important to identify subgroups of the population thatappear to have failed to change much over the decade so that tobacco control efforts canbe focused on these groups in the future. The Appendix in this chapter givesunstandardized prevalence estimates.
Gender
Figure 2.2 shows the current smoking prevalence for men and women, standardized forrace/ethnicity and educational level. The decline from 1990 to 1996 occurred in a fairlyuniform manner for both men and women. Neither men nor women showed astatistically significant change in prevalence from 1996 to 1999.
The prevalence of dailysmoking was very low amongthose with a collegeeducation (6.4±±0.4%).
Over the decade, reductions indaily smoking by a factorapproaching 30% or more wereobserved for those 65 years andolder, African-Americans, andthose with a college education.

Smoking Prevalence in California: Results of the California Tobacco Surveys (CTS)
2-7
Age
In contrast to gender, the trends in prevalence for age groups, standardized forrace/ethnicity and educational level, are not nearly as uniform (Figure 2.3). The olderage group (65+ years), with the lowest smoking prevalence throughout the period, maybe slowly but steadily smoking less. In contrast to earlier in the decade, by 1999 the 18-24 year age group showed the highest prevalence of all age groups, statistically higher
19.6
17.7 17.018.7 18.6
23.3
21.220.0
21.6 22.0
16.714.9 14.3
15.5 14.8
0
5
10
15
20
25
30%
OverallMaleFemale
Screener Survey Adult Survey
1989 19941991 19921990 1993 1995 1996 1996 1997 1998 1999
Source: CTS 1990, 1993, 1996, 1999 Figure 2.2
Standardized (1999) Prevalence Overall and by Gender
Standardized (1999) Prevalence by Age
17.515.7
17.6
21.5 21.821.9
19.7
20.6 20.419.021.8
19.7 17.7
17.8 17.5
11.4
9.511.0
9.99.3
0
5
10
15
20
25
%
18-24 25-44 45-64 65+
Screener Survey Adult Survey
1989 1990 1991 1992 1993 1994 1995 1996 1996 1997 1998 1999
Figure 2.3Source: CTS 1990, 1993, 1996, 1999
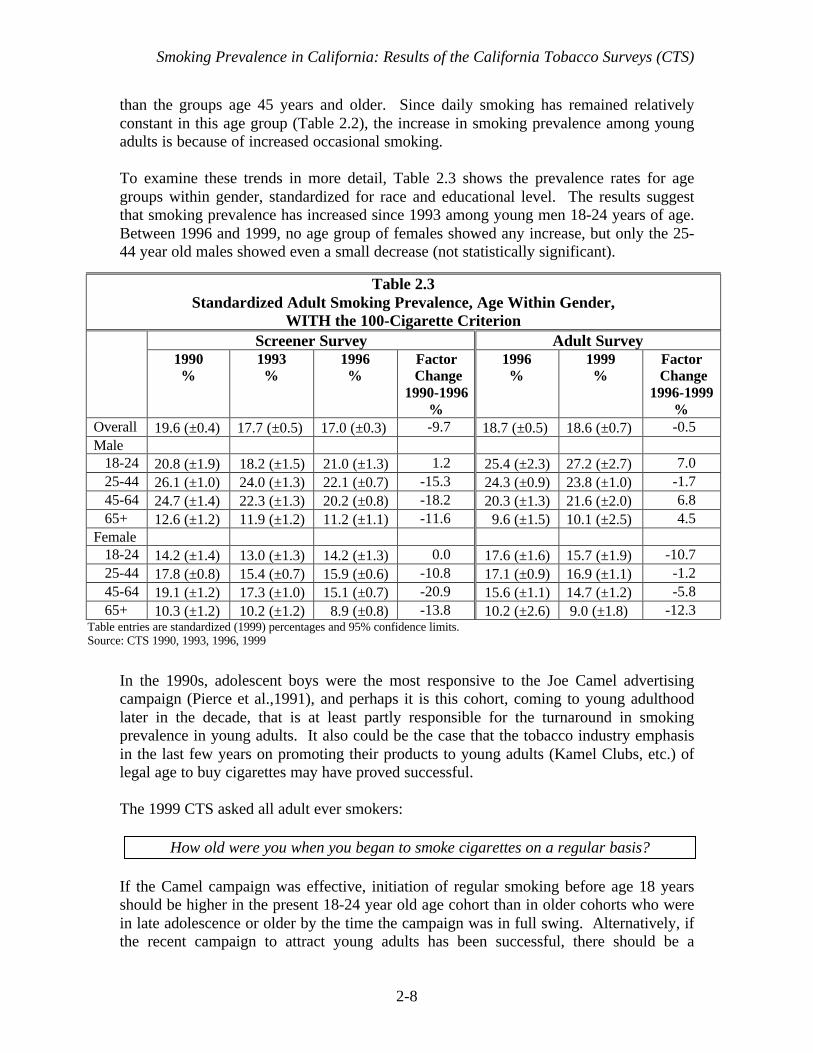
Smoking Prevalence in California: Results of the California Tobacco Surveys (CTS)
2-8
than the groups age 45 years and older. Since daily smoking has remained relativelyconstant in this age group (Table 2.2), the increase in smoking prevalence among youngadults is because of increased occasional smoking.
To examine these trends in more detail, Table 2.3 shows the prevalence rates for agegroups within gender, standardized for race and educational level. The results suggestthat smoking prevalence has increased since 1993 among young men 18-24 years of age.Between 1996 and 1999, no age group of females showed any increase, but only the 25-44 year old males showed even a small decrease (not statistically significant).
In the 1990s, adolescent boys were the most responsive to the Joe Camel advertisingcampaign (Pierce et al.,1991), and perhaps it is this cohort, coming to young adulthoodlater in the decade, that is at least partly responsible for the turnaround in smokingprevalence in young adults. It also could be the case that the tobacco industry emphasisin the last few years on promoting their products to young adults (Kamel Clubs, etc.) oflegal age to buy cigarettes may have proved successful.
The 1999 CTS asked all adult ever smokers:
How old were you when you began to smoke cigarettes on a regular basis?
If the Camel campaign was effective, initiation of regular smoking before age 18 yearsshould be higher in the present 18-24 year old age cohort than in older cohorts who werein late adolescence or older by the time the campaign was in full swing. Alternatively, ifthe recent campaign to attract young adults has been successful, there should be a
Table 2.3Standardized Adult Smoking Prevalence, Age Within Gender,
WITH the 100-Cigarette CriterionScreener Survey Adult Survey
1990%
1993%
1996%
Factor Change
1990-1996%
1996%
1999%
Factor Change
1996-1999%
Overall 19.6 (±0.4) 17.7 (±0.5) 17.0 (±0.3) -9.7 18.7 (±0.5) 18.6 (±0.7) -0.5Male 18-24 20.8 (±1.9) 18.2 (±1.5) 21.0 (±1.3) 1.2 25.4 (±2.3) 27.2 (±2.7) 7.0 25-44 26.1 (±1.0) 24.0 (±1.3) 22.1 (±0.7) -15.3 24.3 (±0.9) 23.8 (±1.0) -1.7 45-64 24.7 (±1.4) 22.3 (±1.3) 20.2 (±0.8) -18.2 20.3 (±1.3) 21.6 (±2.0) 6.8 65+ 12.6 (±1.2) 11.9 (±1.2) 11.2 (±1.1) -11.6 9.6 (±1.5) 10.1 (±2.5) 4.5Female 18-24 14.2 (±1.4) 13.0 (±1.3) 14.2 (±1.3) 0.0 17.6 (±1.6) 15.7 (±1.9) -10.7 25-44 17.8 (±0.8) 15.4 (±0.7) 15.9 (±0.6) -10.8 17.1 (±0.9) 16.9 (±1.1) -1.2 45-64 19.1 (±1.2) 17.3 (±1.0) 15.1 (±0.7) -20.9 15.6 (±1.1) 14.7 (±1.2) -5.8 65+ 10.3 (±1.2) 10.2 (±1.2) 8.9 (±0.8) -13.8 10.2 (±2.6) 9.0 (±1.8) -12.3
Table entries are standardized (1999) percentages and 95% confidence limits.Source: CTS 1990, 1993, 1996, 1999

Smoking Prevalence in California: Results of the California Tobacco Surveys (CTS)
2-9
tendency for the present 18-24 year old cohort to show relatively high rates of initiationof regular smoking at 18 years or older, even though some in this cohort may still nothave progressed to regular smoking.
Figure 2.4 shows the percentage of the population smoking regularly before age 18 and at18 years of age and older by gender and age cohort. The cohort 32-38 years of age isshown in the figure to discern any differences between it and the next younger cohort.
The figure shows that in the older cohorts, the rate ofregular smoking before age 18 years or at 18 years orolder was about the same within gender. Comparedto the older cohorts, for the 18-24 year olds, initiationof regular smoking occurred much more frequently
under the age of 18 years, particularly in males. Further, compared to the 32-38 year oldcohort, there was no upsurge in transition to regular smoking in either the 18-24 year oldcohort or the 25-31 year old cohort, who might be most prone to exposure (frequentbars/clubs) to the more recent tobacco industry campaigns aimed at young adults. Theyounger cohort, particularly males, clearly showed increased initiation at younger ages,rather than as young adults.
The cohort of 18-24 year oldstook up regular smoking athigher than expected ratesduring adolescence ratherthan as young adults.
0
5
10
15
20
25
30
35
Male Female Male Female
% In
itia
tio
n R
egu
lar
Sm
oki
ng
18-24 25-31 32-38
< 18 years > 18 years
Age of Initiation of Regular Smoking by Age, Sex, and Birth Cohort
Cohort
Figure 2.4Source: CTS 1999
<18 years >18 years
Cohort Male Female Male Female
18-24 26.3 18.4 11.4 9.5
25-31 18.0 15.4 19.7 12.5
32-38 20.9 16.8 21.6 14.5

Smoking Prevalence in California: Results of the California Tobacco Surveys (CTS)
2-10
Race/ethnicity
Figure 2.5 shows the smoking prevalence for different racial/ethnic groups standardizedfor educational level. In all surveys, Asians show the lowest rates of smokingprevalence, and African American the highest rates, although in some years these groupsare not statistically different from the others. Because of small sample sizes it is difficultto comment on the trends for these groups, but it appears that while Hispanics and Non-Hispanic whites showed significant declines from 1990 to 1996, Asians and AfricanAmericans did not. Because of the large 95% confidence intervals for the prevalenceestimates for African Americans from the 1996 and 1999 adult surveys, the apparentdecline from 1996 to 1999 must be discounted. Conclusions must await evidence fromfuture surveys that show the decline continues.
Standardized (1999) Prevalence by Race/Ethnicity
21.8
23.5
20.2
15.0
16.4
18.819.3
20.7
25.6
13.312.5 13.5
11.7
15.015.7
13.9
17.520.2
20.021.2
0
5
10
15
20
25
30
%
African-AmericanAsian/PIHispanicNon-Hispanic White
Screener Survey Adult Survey
1989 1990 1991 1992 1993 1994 1995 1996 1996 1997 1998 1999
Source: CTS 1990, 1993, 1996, 1999 Figure 2.5

Smoking Prevalence in California: Results of the California Tobacco Surveys (CTS)
2-11
Table 2.4 looks at trends within gender for the different racial/ethnic groups, standardizedfor educational level. Females in all racial/ethnic groups have lower smoking prevalencerates than males, but the difference is much more marked among Asians and Hispanicsthan among African Americans or Non-Hispanic Whites.
It appears from the table above that African American and Asian males are responsiblefor the lack of a continued decline in smoking prevalence in these racial groups between1993 and 1996 observed in Figure 2.5. In contrast, it appears that African Americanfemales are responsible for the overall decline in African American smoking prevalenceseen from 1996 to 1999. Hispanics and Non-Hispanic whites of both genders shownearly the same trends. Asian men and women showed opposite changes between 1996and 1999, but since more Asian men smoke, the slight increase in overall prevalenceamong Asians is from the increase in men. Again, because of small sample sizes, theseobservations must be interpreted with caution. It is possible that the changes in smokingprevalence for African Americans and Asians are due to sampling variability and do notreflect real trends.
Education
Figure 2.6 shows the standardized (for race/ethnicity) prevalence rates by level ofeducational attainment. College graduates have the lowest smoking prevalence in allsurveys, and like the older age group, tend to show a steady decline over time. Whilethose with a high school education have the highest smoking prevalence rates, they, too,appear to be showing fairly steady declines over time. All groups showed an
Table 2.4Standardized California Adult Smoking Prevalence, Race/Ethnicity
within Gender, WITH the 100-Cigarette CriterionScreener Survey Adult Survey
1990%
1993%
1996%
FactorDecrease
1990-1996%
1996%
1999%
FactorChange1996-1999%
Overall 19.6 (±0.4) 17.7 (±0.5) 17.0 (±0.3) -9.7 18.7 (±0.5) 18.6 (±0.7) -0.5Male African American 27.6 (±3.0) 23.8 (±2.9) 23.8 (±2.2) -13.7 25.3 (±3.8) 25.0 (±3.5) -1.4 Asian 22.2 (±1.6) 17.9 (±1.9) 17.8 (±1.4) -19.7 18.4 (±2.3) 21.6 (±3.3) 17.3 Hispanic 23.3 (±1.4) 21.0 (±1.7) 19.2 (±1.2) -17.5 22.1 (±1.6) 22.9 (±1.8) 3.5 Non-Hispanic White 22.8 (±0.6) 21.4 (±0.9) 20.3 (±0.4) -11.0 21.5 (±0.7) 20.6 (±0.8) -4.0Female African American 23.9 (±3.1) 18.2 (±2.7) 20.1 (±2.1) -15.6 21.8 (±2.6) 16.5 (±2.3) -24.3 Asian 8.2 (±1.4) 5.8 (±1.4) 7.5 (±1.2) -8.6 8.7 (±2.2) 6.9 (±1.7) -20.7 Hispanic 11.6 (±1.2) 8.9 (±1.0) 8.8 (±0.8) -24.0 9.7 (±0.9) 9.5 (±1.3) -2.0 Non-Hispanic White 19.8 (±0.7) 19.0 (±0.7) 17.4 (±0.5) -12.2 18.6 (±0.5) 18.2 (±0.8) -2.3
Table entries are standardized (1999) percentages and 95% confidence limits.Source: CTS 1990, 1993, 1996, 1999
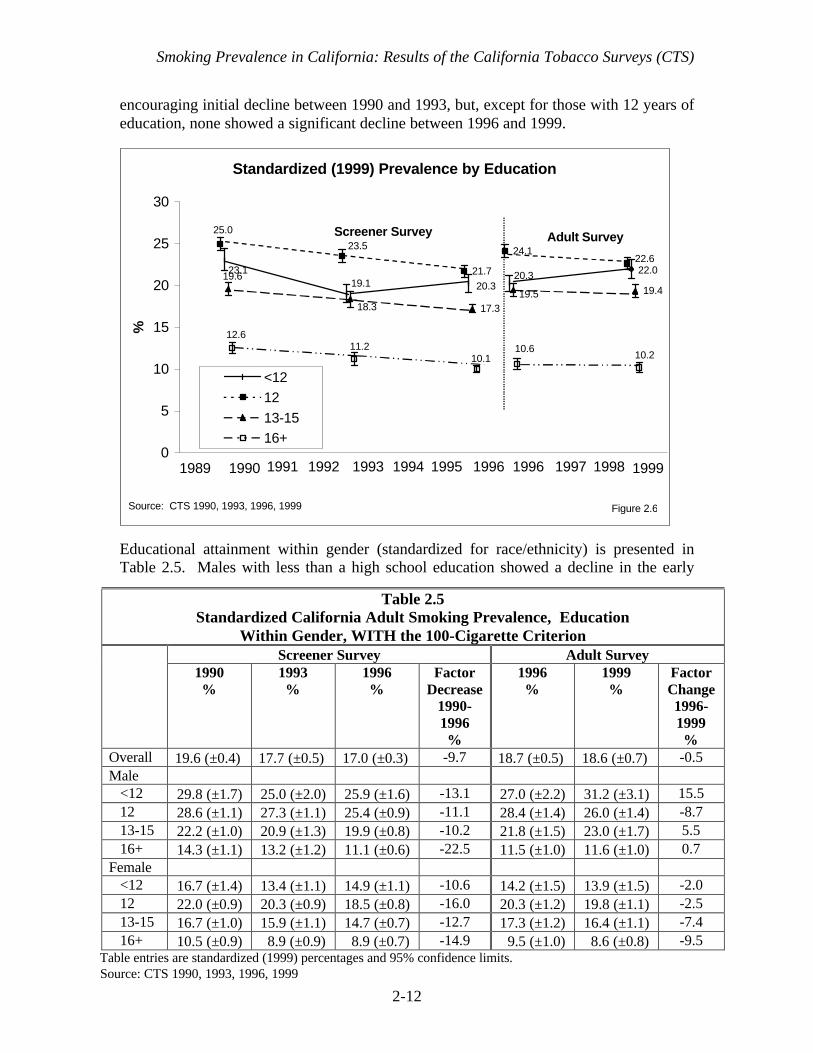
Smoking Prevalence in California: Results of the California Tobacco Surveys (CTS)
2-12
encouraging initial decline between 1990 and 1993, but, except for those with 12 years ofeducation, none showed a significant decline between 1996 and 1999.
Educational attainment within gender (standardized for race/ethnicity) is presented inTable 2.5. Males with less than a high school education showed a decline in the early
Table 2.5Standardized California Adult Smoking Prevalence, Education
Within Gender, WITH the 100-Cigarette CriterionScreener Survey Adult Survey
1990%
1993%
1996%
FactorDecrease
1990-1996%
1996%
1999%
FactorChange1996-1999%
Overall 19.6 (±0.4) 17.7 (±0.5) 17.0 (±0.3) -9.7 18.7 (±0.5) 18.6 (±0.7) -0.5Male <12 29.8 (±1.7) 25.0 (±2.0) 25.9 (±1.6) -13.1 27.0 (±2.2) 31.2 (±3.1) 15.5 12 28.6 (±1.1) 27.3 (±1.1) 25.4 (±0.9) -11.1 28.4 (±1.4) 26.0 (±1.4) -8.7 13-15 22.2 (±1.0) 20.9 (±1.3) 19.9 (±0.8) -10.2 21.8 (±1.5) 23.0 (±1.7) 5.5 16+ 14.3 (±1.1) 13.2 (±1.2) 11.1 (±0.6) -22.5 11.5 (±1.0) 11.6 (±1.0) 0.7Female <12 16.7 (±1.4) 13.4 (±1.1) 14.9 (±1.1) -10.6 14.2 (±1.5) 13.9 (±1.5) -2.0 12 22.0 (±0.9) 20.3 (±0.9) 18.5 (±0.8) -16.0 20.3 (±1.2) 19.8 (±1.1) -2.5 13-15 16.7 (±1.0) 15.9 (±1.1) 14.7 (±0.7) -12.7 17.3 (±1.2) 16.4 (±1.1) -7.4 16+ 10.5 (±0.9) 8.9 (±0.9) 8.9 (±0.7) -14.9 9.5 (±1.0) 8.6 (±0.8) -9.5
Table entries are standardized (1999) percentages and 95% confidence limits. Source: CTS 1990, 1993, 1996, 1999
Standardized (1999) Prevalence by Education
21.7
24.1
17.3
19.419.1
23.1 22.020.320.3
25.0
22.623.5
19.518.3
19.6
12.610.611.2
10.1 10.2
0
5
10
15
20
25
30
%
<1212
13-1516+
Screener Survey Adult Survey
1989 1990 1991 1992 1993 1994 1995 1996 1996 1997 1998 1999
Source: CTS 1990, 1993, 1996, 1999 Figure 2.6

Smoking Prevalence in California: Results of the California Tobacco Surveys (CTS)
2-13
years, but an increase in recent years. While college educated males showed a largedecrease in prevalence between 1990 and 1993, they showed no change between 1996and 1999. College educated women showed less of a decline early on, but showed noevidence of an increase in recent years. As for the other tables shown by gender, cautionshould be used in interpreting these results.
The demographic trends presented in this section of the chapter indicate that there areseveral groups that have shown recent increases in smoking prevalence (a factor of 10%or more). While some of these increases were not significant, they imply that thesegroups are not on the path to lower smoking prevalence. They include subgroups of adultmales, those without at least a high school education, Asians, and those between 18-24years of age. Importantly, there is no indication that young males 18-24 years of age haveshown any real decrease at all over the decade. Since 1999, the Tobacco Control Programhas aggressively targeted youth 18-24 years of age.
4. Adult Smoking Prevalence by Region
Figure 2.7 shows the grouping of the various counties into regions. The numbers in thelegend to the figure correspond to the list of the regions in Tables 2.6 and 2.8. The 10largest counties in the population are each a separate region. Except for region 18(Imperial, Inyo, Kern, Kings, Mono, and Tulare counties), the regions are all comprisedof contiguous counties.
Because the sample within some regions is small and some demographic subgroups arenot represented at all in some regions, the usual standardization procedure cannot becarried out. Instead, another more complex method (Gilpin et al., 2001) is used to create“adjusted” prevalence estimates that force each region to conform to a standarddistribution of demographics that reflect the state as a whole. These estimates are not thetrue prevalence in a region at a given time, but rather are adjusted so that changes in thedemographic composition in a region over time, or the differences in the demographiccomposition between regions at a particular point in time are factored out. The adjustedestimates can thus be used to discern trends within regions over time, compare changesamong regions or to compare relative prevalence for different regions at a given point intime.
Table 2.6 shows the adjusted smoking prevalence rates from the screener survey for1990, 1993 and 1996 and from the adult survey in 1996 and 1999 because of the changein the survey smoking status question.

Smoking Prevalence in California: Results of the California Tobacco Surveys (CTS)
2-14
Figure 2.7
Regions
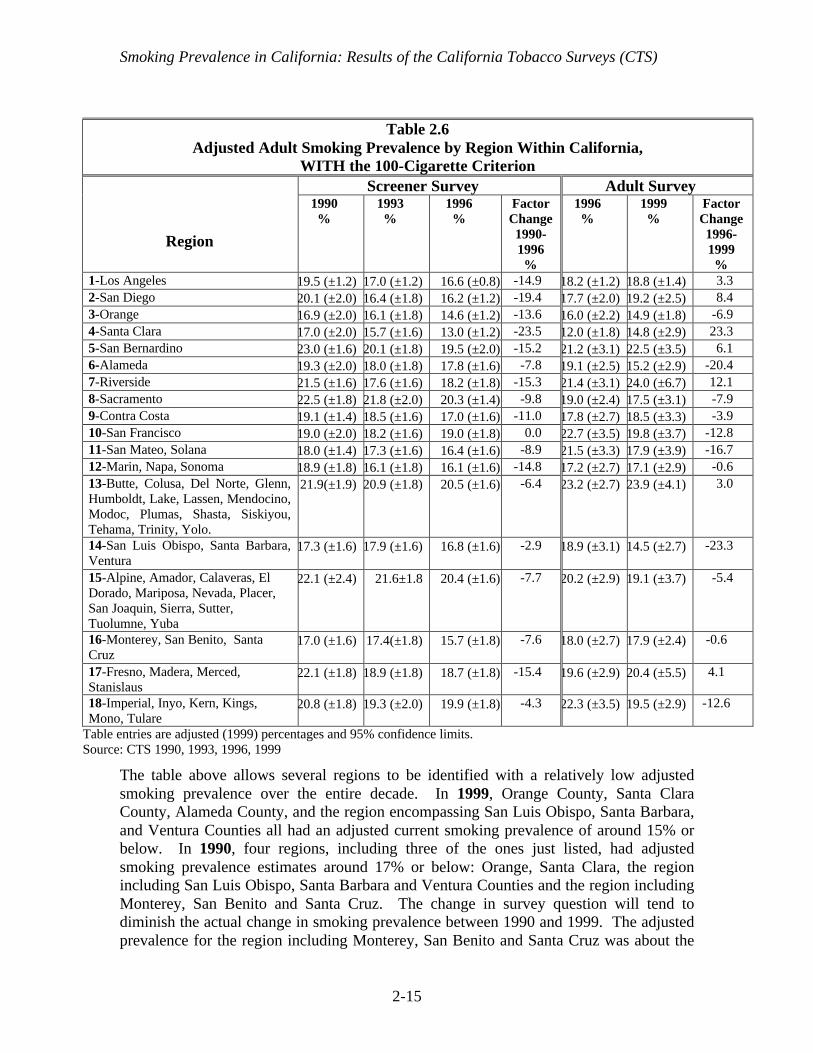
Smoking Prevalence in California: Results of the California Tobacco Surveys (CTS)
2-15
The table above allows several regions to be identified with a relatively low adjustedsmoking prevalence over the entire decade. In 1999, Orange County, Santa ClaraCounty, Alameda County, and the region encompassing San Luis Obispo, Santa Barbara,and Ventura Counties all had an adjusted current smoking prevalence of around 15% orbelow. In 1990, four regions, including three of the ones just listed, had adjustedsmoking prevalence estimates around 17% or below: Orange, Santa Clara, the regionincluding San Luis Obispo, Santa Barbara and Ventura Counties and the region includingMonterey, San Benito and Santa Cruz. The change in survey question will tend todiminish the actual change in smoking prevalence between 1990 and 1999. The adjustedprevalence for the region including Monterey, San Benito and Santa Cruz was about the
Table 2.6Adjusted Adult Smoking Prevalence by Region Within California,
WITH the 100-Cigarette CriterionScreener Survey Adult Survey
Region
1990%
1993%
1996%
FactorChange1990-1996%
1996%
1999%
FactorChange1996-1999%
1-Los Angeles 19.5 (±1.2) 17.0 (±1.2) 16.6 (±0.8) -14.9 18.2 (±1.2) 18.8 (±1.4) 3.32-San Diego 20.1 (±2.0) 16.4 (±1.8) 16.2 (±1.2) -19.4 17.7 (±2.0) 19.2 (±2.5) 8.43-Orange 16.9 (±2.0) 16.1 (±1.8) 14.6 (±1.2) -13.6 16.0 (±2.2) 14.9 (±1.8) -6.94-Santa Clara 17.0 (±2.0) 15.7 (±1.6) 13.0 (±1.2) -23.5 12.0 (±1.8) 14.8 (±2.9) 23.35-San Bernardino 23.0 (±1.6) 20.1 (±1.8) 19.5 (±2.0) -15.2 21.2 (±3.1) 22.5 (±3.5) 6.16-Alameda 19.3 (±2.0) 18.0 (±1.8) 17.8 (±1.6) -7.8 19.1 (±2.5) 15.2 (±2.9) -20.47-Riverside 21.5 (±1.6) 17.6 (±1.6) 18.2 (±1.8) -15.3 21.4 (±3.1) 24.0 (±6.7) 12.18-Sacramento 22.5 (±1.8) 21.8 (±2.0) 20.3 (±1.4) -9.8 19.0 (±2.4) 17.5 (±3.1) -7.99-Contra Costa 19.1 (±1.4) 18.5 (±1.6) 17.0 (±1.6) -11.0 17.8 (±2.7) 18.5 (±3.3) -3.910-San Francisco 19.0 (±2.0) 18.2 (±1.6) 19.0 (±1.8) 0.0 22.7 (±3.5) 19.8 (±3.7) -12.811-San Mateo, Solana 18.0 (±1.4) 17.3 (±1.6) 16.4 (±1.6) -8.9 21.5 (±3.3) 17.9 (±3.9) -16.712-Marin, Napa, Sonoma 18.9 (±1.8) 16.1 (±1.8) 16.1 (±1.6) -14.8 17.2 (±2.7) 17.1 (±2.9) -0.613-Butte, Colusa, Del Norte, Glenn,Humboldt, Lake, Lassen, Mendocino,Modoc, Plumas, Shasta, Siskiyou,Tehama, Trinity, Yolo.
21.9(±1.9) 20.9 (±1.8) 20.5 (±1.6) -6.4 23.2 (±2.7) 23.9 (±4.1) 3.0
14-San Luis Obispo, Santa Barbara,Ventura
17.3 (±1.6) 17.9 (±1.6) 16.8 (±1.6) -2.9 18.9 (±3.1) 14.5 (±2.7) -23.3
15-Alpine, Amador, Calaveras, ElDorado, Mariposa, Nevada, Placer,San Joaquin, Sierra, Sutter,Tuolumne, Yuba
22.1 (±2.4) 21.6±1.8 20.4 (±1.6) -7.7 20.2 (±2.9) 19.1 (±3.7) -5.4
16-Monterey, San Benito, SantaCruz
17.0 (±1.6) 17.4(±1.8) 15.7 (±1.8) -7.6 18.0 (±2.7) 17.9 (±2.4) -0.6
17-Fresno, Madera, Merced,Stanislaus
22.1 (±1.8) 18.9 (±1.8) 18.7 (±1.8) -15.4 19.6 (±2.9) 20.4 (±5.5) 4.1
18-Imperial, Inyo, Kern, Kings,Mono, Tulare
20.8 (±1.8) 19.3 (±2.0) 19.9 (±1.8) -4.3 22.3 (±3.5) 19.5 (±2.9) -12.6
Table entries are adjusted (1999) percentages and 95% confidence limits.Source: CTS 1990, 1993, 1996, 1999

Smoking Prevalence in California: Results of the California Tobacco Surveys (CTS)
2-16
same at the end of the decade as in the beginning, around 17%. Thus, while the otherregions with relatively low prevalence in 1990 managed to further reduce smokingprevalence over the decade, this one did not.
In 1990, there were 4 regions with an adjusted smoking prevalence of 22% or higher.These were San Bernardino, Sacramento, the region including 12 counties in the Northmost part of the state ( Alpine, Amador, etc.), and the 4-county region of Fresno, Madera,Merced and Stanislaus. Only two of these regions showed an adjusted prevalence under20% by 1999 (Sacramento and the 12-county northern region).
Of the 8 regions with an adjusted smoking prevalence lower by a factor of around 15%between 1990 and 1996, only Orange County showed a further decline (not significant)between 1996 and 1999. Conversely, a few of the regions with only modest declines(between a factor of 5-15%) between 1990 and 1996, continued to show some decline(over a factor of 5%, but not significant) between 1996 and 1999. These includedAlameda County, Sacramento County, the region including San Mateo and Solanacounties, and the 12-county region in northern California (Alpine, Amador, etc.).
Examining the adjusted smoking prevalence ratesamong regions in 1999 revealed a wide variation from14.5±2.7% in the 3-county region of San Luis Obispo,Santa Barbara, and Ventura, to a high of 24.0±6.7% inRiverside County so that the highest prevalence wasgreater than the lowest by a factor of about 40%. In1990, the range from highest to lowest varied by a
factor of 26%, suggesting that the California Tobacco Control Program has been moreeffective in some regions of the state than others.
5. Prevalence, Quitting and Changes in Population
The lack of a significant decline in overall adult smoking prevalence since 1994 masksimportant changes that are occurring within subgroups of the smoking population.Chapter 6 shows that over the past decade ever more of California’s smokers are trying toquit, and that they appear to be succeeding at rates comparable to quitters earlier in thedecade. If this was the only change going on in the population, adult smoking prevalenceshould show a decline. A constant prevalence in the face of increased quitting suggeststhat decreases in the numbers of smokers through cessation in some demographic groupshave been balanced by increases in the numbers of smokers in other. As examples:
• In the youngest age group, an adolescent cohort with high smoking prevalence mayhave entered adulthood, or
• In older age groups, immigrants into California may have a higher smokingprevalence than long-time California residents.
Adjusted prevalenceestimates indicate that in1999, 3 regions have asmoking prevalence under15%, but 2 regions have aprevalence over 23%, higherby about a factor of 40%.

Smoking Prevalence in California: Results of the California Tobacco Surveys (CTS)
2-17
Table 2.7 shows the change in California’s population between 1996 and 1999 for eachage group.1 The population of persons 18 years of age and older has grown by over900,000 between 1996 and 1999 (Columns 1 and 2); the changes in population for eachage group are shown in Column 3. Applying the prevalence rates for each year (Columns4 and 5, taken from Table A2.1) to the population in each year, and taking the differencein the resultant numbers of smokers (Columns 6 and 7), yields the number of additionalsmokers in California between 1996 and 1999 (Column 8). Dividing the change in thenumber of smokers by the change in the number of people in each age group yields a netprevalence rate for the new arrivals or departees (Column 9).
Table 2.7Recent Demographic Changes in California and Resultant Numbers of Smokers
PopulationChange inPopulation Prevalence Number of Smokers
AdditionalSmokers
PrevalenceAmongEmigrants/Immigrants
Age 1996 1999 1996 1999 1996 1999 1999-199618-24 3,029,936 3,305,372 275, 436 .211 .219 639,317 723,876 84,559 .307
25-44 10,688,511 10,497,008 -191, 503 .208 .204 2,223,210 2,141,390 -81,820 .427
45-64 6,039,397 6,672,020 632, 623 .186 .177 1,123,328 1,180,948 57,620 .091
65+ 3,121,057 3,313,805 192, 748 .096 .092 302,943 304,870 2,127 .011
Total 22,878,901 23,788,205 909,304 .187 .183 4,288,598 4,351,084 +62,486
Examining the numbers in the above table for each age group leads to the followingpossible interpretations:
• There were 84,559 new smokers in the 18-24 year-old age group, which wouldrepresent a net prevalence of 30.7% for the people new to this age group. Since thisis much higher than for the group as a whole, it suggests an influx into this age groupof a cohort with a higher smoking prevalence possibly coupled with new arrivalsfrom out of state, also with a high smoking prevalence. (e.g., As documented inSection 3 of this chapter, the Joe Camel cohort of adolescents has come of age.)
• Among those aged 25-44 years, there was a decline in the population between 1996and 1999. Accordingly, there was also a decline in the number of smokers, but theseemigrants had an apparent net prevalence of 42.7% compared to 20.4% for the agegroup as a whole in 1999. The larger decline in the number of smokers relative to thenumber of persons leaving the state in this age group suggests that substantial quitting
1 These numbers are from the sum of the CTS survey weights in each year for each age group. Thepoststratification procedure adjusts the survey weights to make the sample representative of the statepopulation (Gilpin et al., 2000), and these totals are, therefore, close to the actual census totals).

Smoking Prevalence in California: Results of the California Tobacco Surveys (CTS)
2-18
took place among the smokers in this age group as a whole, or that smokers weremore likely to leave the state than nonsmokers. (e.g., People leaving the state mayhave done so for economic reasons. The cost of living, particularly for housing, ishigh in California, and prevalence tends to be higher in lower socioeconomic groupsleast able to afford it.)
• In the older two age groups, the population increased between 1996 and 1999, whichnaturally would produce additional smokers in these groups. However, the netprevalence rates among these age groups of immigrants (9.1% and 1.1%) are muchlower than the prevalence rates for the groups overall. This again suggests thatsignificant quitting occurred in these age groups as a whole, and that perhaps theimmigrants to these age groups had relatively low levels of smoking prevalence.(e.g., Higher educated people with higher incomes, able to afford the cost of livingand with lower smoking prevalence, may be the ones moving to California.)
6. Adolescent Smoking Prevalence
Most surveys, including the CTS, determine adolescent smoking prevalence from theanswers to the following questions:
• Have you ever smoked a cigarette?• Think about the last 30 days. On how many of these days did you smoke?
Adolescents answering yes to the first question are asked the second one and anyone whoindicates that the answer is other than zero is considered a current adolescent smoker. Allothers are counted as nonsmokers in the prevalence computation.
Figure 2.8 shows the prevalence of currentadolescent (12-17 years) smoking in Californiacomputed from the 1990, 1993, 1996 and 1999CTS adolescent surveys. The dashed line in thefigure connects the snap shot estimates, and the
other line connects the standardized estimates of adolescent smoking prevalence. Bothsets of estimates are quite close and indicate that adolescent smoking prevalenceincreased significantly from 1990/1993 levels by 1996, but that by 1999, prevalence haddeclined to a level even below the 1990 level; this decline was just statisticallysignificant.
While standardized adolescentsmoking prevalence increasedmarkedly between 1993 and 1996,it fell below 1990 levels by 1999.
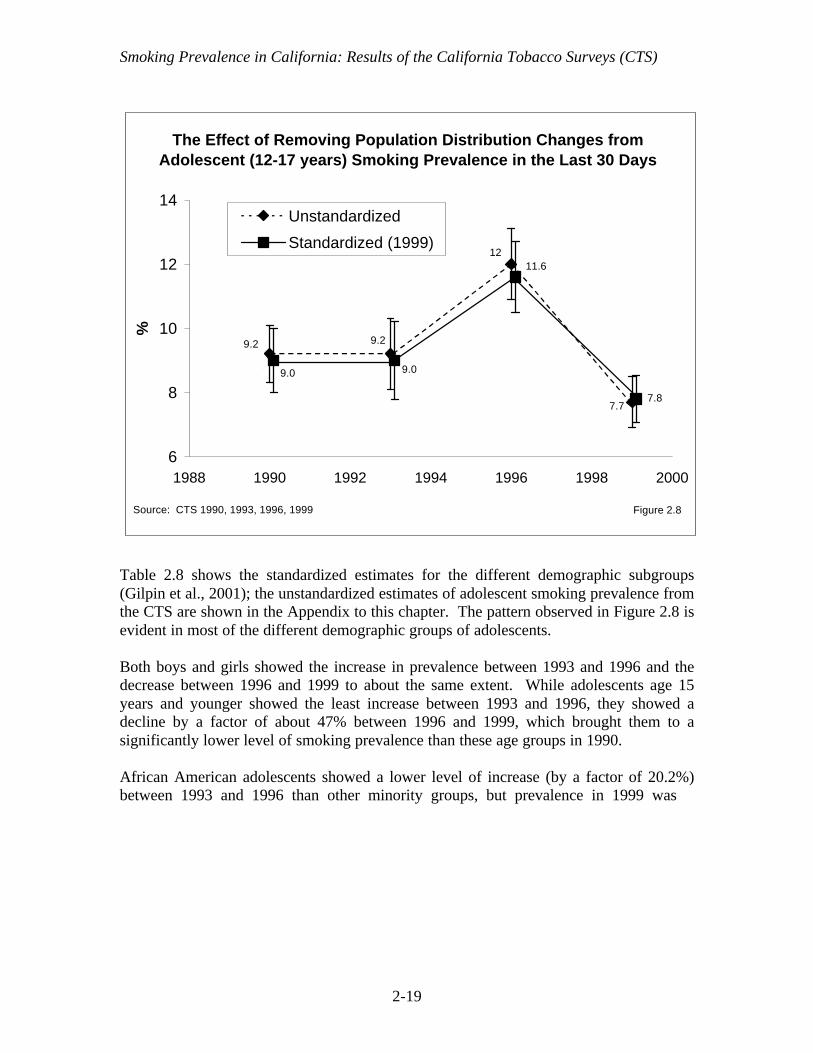
Smoking Prevalence in California: Results of the California Tobacco Surveys (CTS)
2-19
Table 2.8 shows the standardized estimates for the different demographic subgroups(Gilpin et al., 2001); the unstandardized estimates of adolescent smoking prevalence fromthe CTS are shown in the Appendix to this chapter. The pattern observed in Figure 2.8 isevident in most of the different demographic groups of adolescents.
Both boys and girls showed the increase in prevalence between 1993 and 1996 and thedecrease between 1996 and 1999 to about the same extent. While adolescents age 15years and younger showed the least increase between 1993 and 1996, they showed adecline by a factor of about 47% between 1996 and 1999, which brought them to asignificantly lower level of smoking prevalence than these age groups in 1990.
African American adolescents showed a lower level of increase (by a factor of 20.2%)between 1993 and 1996 than other minority groups, but prevalence in 1999 was
9.2 9.2
12
7.7
9.0
11.6
9.0
7.8
6
8
10
12
14
1988 1990 1992 1994 1996 1998 2000
%
Unstandardized
Standardized (1999)
Source: CTS 1990, 1993, 1996, 1999 Figure 2.8
The Effect of Removing Population Distribution Changes from Adolescent (12-17 years) Smoking Prevalence in the Last 30 Days

Smoking Prevalence in California: Results of the California Tobacco Surveys (CTS)
2-20
nearly identical to that in 1996. However, because of the small number of AfricanAmericans in the sample, the changes observed in this group over the decade may be dueto sampling variability. The same applies to Asian adolescents, but this group at leastshowed the same general trend as the adolescent population as a whole. In 1999, smokingprevalence for Asian adolescents was significantly lower than that of Hispanics and Non-Hispanic Whites. Non-Hispanic White adolescents showed enough of a decreasebetween 1996 and 1999 (by a factor of 37.8%) that their smoking prevalence level issignificantly lower than it was in 1990.
Adolescents with better than average schoolperformance have lower rates of current smokingprevalence than those with average or below schoolperformance in all years. This group showed arelatively greater increase between 1993 and 1996,and prevalence in 1999 appears to be higher than it
Younger adolescents, Non-Hispanic Whites and Asiansshowed the greatestdecreases in smokingprevalence between 1996 and1999.
Table 2.8Standardized Adolescent (12-17 Years) Smoking Prevalence
(in Last 30 Days) in California
1990%
1993%
1996%
1999%
FactorIncrease
1993-1996%
FactorChange
1996-1999%
Overall 9.0 (±1.0) 9.0 (±1.2) 11.6 (±1.1) 7.8 (±0.7) 29.5 -33.1Gender Boys 9.5 (±1.6) 9.6 (±1.8) 12.3 (±1.5) 8.0 (±1.0) 28.3 -35.4 Girls 8.5 (±1.5) 8.2 (±1.7) 10.8 (±1.4) 7.5 (±1.0) 30.9 -30.2Age 12-13 3.6 (±1.6) 3.0 (±1.0) 3.3 (±0.9) 1.7 (±0.8) 11.3 -47.2 14-15 7.7 (±1.4) 9.2 (±2.0) 10.6 (±1.5) 5.6 (±1.0) 14.7 -46.9 16-17 16.1 (±2.3) 15.0 (±3.0) 21.4 (±2.4) 16.3 (±2.1) 42.3 -24.0Race/Ethnicity African-American 6.0 (±3.6) 4.7 (±3.6) 5.6 (±2.4) 5.7± (2.3) 20.2 1.2 Asian/PI 5.2 (±2.8) 6.3 (±4.7) 8.4 (±2.5) 4.9± (2.0) 33.7 -42.2 Hispanic 9.1 (±2.0) 7.3 (±1.8) 11.0 (±1.9) 8.0± (1.4) 51.6 -27.9 Non Hispanic White 10.8 (±1.3) 11.7 (±1.3) 14.0 (±1.2) 8.7 (±1.1) 19.3 -37.8School Performance Better/Much Better
Than Average 5.3 (±1.0) 5.1± (1.2) 8.3 (±1.1) 5.6 (±1.1) 63.0 -32.3 Average or Below 13.2 (±2.0) 12.8 (±1.8) 16.3 (±1.8) 10.2 (±1.0) 27.4 -37.2
Table entries are standardized (1999) percentages and 95% confidence limits.Source: CTS 1990, 1993, 1996, 1999

Smoking Prevalence in California: Results of the California Tobacco Surveys (CTS)
2-21
was in 1990, although the difference is not statistically significant. In 1999, it was thestudents with average or below average school performance that showed a significantlylower rate of current smoking prevalence than such adolescents did in 1990.
Chapter 4 of this report presents a more complete description of California adolescentsmoking, focusing on the level of smoking experience, rather than smoking in the last 30days, and how this has changed in recent years.
7. Adolescent Smoking Prevalence by Region
Just as adult smoking prevalence needed to be adjusted in order to compare regions at agiven point in time or to examine trends over time within region, the adolescent data forcurrent smoking prevalence required similar adjustment (Gilpin et al., 2001). Table 2.9presents the adjusted data together with their 95% confidence intervals, which are fairlywide because of the relatively small sample sizes within region.
Table 2.9Adjusted Current Adolescent Smoking Prevalence by Region
(in Last 30 Days) in California
Region1990
%1993
%1996
%1999
%
FactorChange
1990-1999
FactorChange
1996-19991-Los Angeles 7.0 (±2.5) 7.4 (±2.7) 10.0 (±1.9) 6.4 (±1.6) -8.7 -36.22-San Diego 7.3 (±3.2) 9.2 (±6.8) 8.5 (±3.3) 9.2 (±3.1) 26.4 8.63-Orange 10.1(±4.1) 8.9 (±3.8) 14.8 (±4.2) 8.9 (±4.0) -11.6 -39.84-Santa Clara 8.4 (±2.8) 8.8 (±7.3) 11.6 (±4.7) 6.4 (±2.8) -24.2 -45.05-San Bernardino 12.7 (±4.9) 10.3 (±5.0) 11.0 (±3.8) 5.7 (±2.0) -54.8 -48.16-Alameda 12.9 (±5.0) 7.1 (±8.6) 11.8 (±4.6) 8.4 (±3.8) -34.9 -28.57-Riverside 10.2 (±3.2) 7.3 (±3.9) 12.6 (±4.2) 4.9 (±2.3) -52.3 -61.38-Sacramento 6.3 (±3.3) 8.4 (±4.7) 14.6 (±4.4) 9.0 (±4.2) 43.3 -38.19-Contra Costa 8.7 (±4.0) 8.8 (±3.9) 10.7 (±4.0) 8.2 (±3.7) -6.5 -23.810-San Francisco 8.5 (±5.8) 7.8 (±6.7) 10.7 (±7.2) 15.3 (±7.6) 80.3 42.811-San Mateo, Solano 11.6(±5.5) 13.1 (±13.3) 12.5 (±4.7) 11.1 (±5.8) -4.6 -11.312-Marin, Napa, Sonoma 14.5 (±9.7) 18.7 (±11.0) 20.5 (±6.6) 6.0 (±2.9) -58.9 -70.913-Butte, Colusa, DelNorte, Glenn, etc.
15.0 (±4.5) 12.2 (±6.9) 17.3 (±4.6) 11.8 (±5.6) -21.2 -31.4
14-San Luis Obispo,Santa Barbara, Ventura
11.7 (±4.0) 13.0 (±6.2) 10.2 (±3.4) 5.0 (±2.8) -57.5 -51.3
15-Amador, Alpine,Calaveras El Dorado, etc.
11.6 (±5.1) 8.9 (±6.5) 13.9 (±4.1) 10.4 (±4.9) -10.2 -25.1
16-Monterey, SanBenito, Santa Cruz
11.2 (±5.5) 10.9 (±17.1) 6.9 (±2.7) 7.6 (±3.8) -32.0 10.2
17-Fresno, Madera,Merced, Stanislaus
7.6 (±3.2) 10.5 (±6.4) 15.5 (±4.1) 9.3 (±2.5) 22.5 -40.2
18-Imperial, Inyo, Kern,Kings, Mono, Tulare
7.7 (±3.8) 9.9 (±9.8) 9.2 (±3.5) 7.4 (±2.5) -4.7 -19.5
Table entries are adjusted (1999) percentages and 95% confidence limits.Source: CTS 1990, 1993, 1996, 1999

Smoking Prevalence in California: Results of the California Tobacco Surveys (CTS)
2-22
Except for the major decrease in adolescent smoking prevalence between 1996 and 1999seen in the state as a whole, and present to at least a factor of 25% in 12 of the 18 regions(significant for 6 regions), it is difficult to discern clear trends over the decade for mostregions. Both the apparent large increase since 1990 in San Francisco, and the largedecrease in the 3-county region including Marin, Napa, and Sonoma may be artifacts ofstatistical fluctuation. However, the declines from relatively high levels in SanBernadino, Riverside, and the 3-county region—including San Luis Obispo, SantaBarbara, and Ventura in 1990—to relatively low levels in 1999, are significant and mostlikely real.
Five regions showed an adolescent prevalence of current smoking below 8% in 1990(Los Angeles, San Diego, Sacramento, the 4-county region including Fresno, Madera,Merced, and Stanislaus and the 6-county region including Imperial, Inyo, Kern, Kings,Mono, and Tulare). While the number of counties with low prevalence increased to 8 in1999, only 2 of the original 5 were among them (Los Angeles and the 6-county regionincluding Imperial, Inyo, Kern, Kings, Mono, and Tulare). While 10 regions had aprevalence rate exceeding 10% in 1990, only 4 did in 1999, and all but one of these (SanFrancisco) also had a high prevalence in 1990.
8. Summary
The lack of a significant decline in adult smoking prevalence in recent years fails tocapture important positive developments regarding changing patterns of cigarette use inthe smoking population. The prevalence of daily smoking has continued to decreasethroughout the decade. Further, rather than quit, it appears that many smokers arechoosing to cut down on the amount they smoke. The fraction of smokers who are heavydaily smokers has declined markedly, and many daily smokers appear to be converting tooccasional smoking. Since the likelihood of a smoking-related disease is related to howmuch a smoker smokes, these cuts in consumption may have future public healthbenefits.
Despite the early decrease in California adult smoking prevalence, there are somedemographic groups of adults that have not changed or have even shown signs of anincrease in the last few years. These groups are male, either young (18-24 years), Asians,or with less than a high school education.
In 1999, comparing adjusted adult smoking prevalence among regions revealed a widerange. Three regions had an adjusted smoking prevalence under 15% (Orange County,Santa Clara County, and the 3-county region including San Luis Obispo, Santa Barbara,and Ventura), but two regions still had a prevalence that exceeded 23%, RiversideCounty, and a 12-county region in the northern part of the state. Another two regions,Alameda County, and the 4-county region of Fresno, Madera, Merced and Stanislaus, stillhad an adjusted smoking prevalence exceeding 20%.
Adolescent smoking prevalence, any smoking in the past 30 days, was constant between1990 and 1993, jumped higher by a factor of 29.5% between 1993 and 1996, and then fell

Smoking Prevalence in California: Results of the California Tobacco Surveys (CTS)
2-23
by a factor of 33.1% between 1996 and 1999. Overall, the standardized adolescentsmoking prevalence was significantly lower in 1999 than at the beginning of the decade.The youngest adolescents (12-15 years) showed the greatest recent declines. As thiscohort reaches adulthood, assuming they don’t take up smoking later and that youngerchildren follow suit, the long-term result would be reduced adult smoking prevalence.

Smoking Prevalence in California: Results of the California Tobacco Surveys (CTS)
2-24
CHAPTER 2: KEY FINDINGS
1. Smoking patterns are changing among current California adult smokers. An ever-smaller fraction of current adult smokers are heavy daily smokers (smoke 15+cigarettes/day), less than 30% of current smokers in 1999. Further, in 1999 over20% of current smokers did not smoke every day.
2. Over the decade from 1990 to 1999, the prevalence of daily smoking (standardized)declined by a factor of 18.6%. In 1999, the snap shot estimate of adult prevalenceof daily smoking was 13.0±0.3%. Among college graduates, the prevalence ofdaily smoking was only 6.4±0.4% in 1999.
3. In contrast to adult California females, there are demographic groups of males thatshow no indication of further reduced smoking prevalence. These include Asiansand those with less than a high school education. Young males 18-24 years of ageshowed an increased smoking prevalence beginning in 1993.
4. There was considerable variability in adjusted smoking prevalence rates for bothadults and adolescents among regions. Some regions changed little, and othersshowed important declines for both adults and adolescents.
5. Adolescent smoking prevalence, any smoking in the past 30 days, was constantbetween 1990 and 1993, jumped higher by a factor of 29.5% between 1993 and1996, and then fell by a factor of 33.1% between 1996 and 1999. Overall, thestandardized adolescent smoking prevalence was significantly lower in 1999 than atthe beginning of the decade. The snap shot estimate of adolescent smokingprevalence in 1999 was 7.7±0.8%.

Smoking Prevalence in California: Results of the California Tobacco Surveys (CTS)
2-25
CHAPTER 2: APPENDIX
Change in Definition of a Current Smoker
In the previous reports describing the results from the CTS (Pierce et al., 1998), which isavailable on the web (http://ssdc.ucsd.edu/tobacco/), a current smoker was defined assomeone who answered yes to the following question:
Do you {or does person} smoke cigarettes now?
On the screener survey, the adult enumerating the household answers the question for allhousehold adults. On the adult extended survey, the respondent answers the question forhim/herself. Despite the proxy reports on the screener survey, the prevalence estimatesfrom this survey instrument have been shown to give good estimates of populationsmoking prevalence (Gilpin et al., 1994).
Other national and state surveys typically skip the above question if respondents firstanswer no to the following question:
{As far as you know} {have you/has person} smoked at least 100 cigarettes during{your/his or her} lifetime?
The CTS ask both questions. In past reports describing the results from the CTS, only thefirst question was considered when defining a current smoker. However, to be consistentwith other national and state surveys, prevalence estimates presented in Tables A2.1andA2.3 below are for current smokers defined as someone who answers yes to bothquestions.
As a point of reference, the prevalence estimates are also reported in Tables A2.2 andA2.4 according to the previous definition that omits the 100-cigarette criterion. Theprevalence estimates in the tables without the 100-cigarette criterion correspond to theresults presented in previous reports describing the CTS results (Pierce et al, 1998).Without the 100-cigarette criterion, the prevalence estimates will be slightly higher,especially for young adults who may still be in the smoking uptake process.
Change in Question Used to Determine Smoking Status
In 1996, the question on the adult extended survey about current smoking was changedto:
Do you smoke cigarettes everyday, some days or not at all?
The old smoke-now question was retained on the screener survey for 1996. Then in1999, both the screener and the adult extended interview used the new question. For thisreason all the tables presented below show two sets of columns, the left most set for

Smoking Prevalence in California: Results of the California Tobacco Surveys (CTS)
2-26
estimates from the screener surveys from 1990 to 1996, and the right most set forestimates from the adult extended interviews for 1996 and 1999. The new surveyquestion captures more smokers for the estimate of smoking prevalence: Some peoplewho are willing to admit to smoking “some days” do not report themselves as “smokingnow.”
Occasional Smoking
In the main body of this chapter, Table 2.1 showed current smokers according to whetherthey smoked daily or occasionally. To determine whether a smoker was a daily oroccasional smoker, the 1990 and 1992 CTS asked all persons who answered yes to thesmoke-now question:
Do you now smoke cigarettes everyday or some days?
Current smokers who responded “some days” are considered occasional smokers.
For the 1996 and 1999 CTS, the determination of whether someone was a daily oroccasional smoker was made directly from the new smoking status question which askedif the respondent smoked now everyday or some days. Figure A2.1 illustrates howsmoking status was defined for both time frames.
Snap shot Smoking Prevalence Estimates
The prevalence estimates presented below are the most appropriate estimates to considerif the question is simply what is the smoking prevalence in a given year, without anyconcern about whether the prevalence is different from another year. For this reason,these estimates are referred to as “snap shot” estimates.
For completeness and consistency with previous reports (Pierce et al., 1998), theprevalence estimates are presented WITH and WITHOUT the 100-cigarette criterion (seefirst section of this Appendix). Because of the change in the question used to querysmoking status, the tables below show data for the screener survey from 1990 to 1996with the “smoke now” question and large sample size, and from 1996 to 1999 using thenew “now everyday or some days” question from the smaller adult survey.
Table A2.1 shows snap shot adult smoking prevalence estimates from each of the CTSexcept 1992. The 1992 survey was relatively small and the much larger 1993 survey wasonly one year later. Comparison of Table A2.1 (WITH the 100-cigarette criterion) andA2.2 (WITHOUT the 100-cigarette criterion) indicates that the smoking prevalenceestimates are indeed slightly higher without the 100-cigarette criterion. As expected, thedifference is most pronounced among those in the 18 to 24 year age group.

Smoking Prevalence in California: Results of the California Tobacco Surveys (CTS)
2-27
Figure A2.1Determination of Daily and Occasional Smoking from Adult Surveys
1990, 1992 Adult Surveys
Never smoker Smoked 100 cigarettes in lifetime?
Smoke now?
Yes
Former smokerNo
Smoke everyday or some days?
Current daily smokerCurrent occasional smoker
Some days Everyday
Yes
No
Yes
Not at all
Current daily smokerCurrent occasional smoker
Some days Everyday
Smoke now everyday, some days, or not at all?Former smoker
Never smoker Smoked 100 cigarettes in lifetime?No
1996, 1999 Adult Surveys

Smoking Prevalence in California: Results of the California Tobacco Surveys (CTS)
2-28
Table A2.1Unstandardized California Adult Smoking Prevalence
WITH the 100-Cigarette Criterion.Screener Survey Adult Survey
1990%
1993%
1996%
1996%
1999%
Overall 21.5 (±0.5) 19.6 (±0.5) 17.3 (±0.3) 18.7 (±0.3) 18.3 (±0.3)Gender Male 24.5 (±0.7) 22.5 (±0.7) 20.1 (±0.5) 21.6 (±0.5) 21.8 (±0.6) Female 18.6 (±0.7) 16.9 (±0.5) 14.6 (±0.4) 15.9 (±0.4) 15.0 (±0.5)Age 18-24 20.0 (±1.4) 17.6 (±1.1) 17.0 (±1.0) 21.1 (±1.3) 21.9 (±1.4) 25-44 23.8 (±0.8) 21.6 (±0.8) 19.2 (±0.5) 20.8 (±0.5) 20.4 (±0.6) 45-64 23.4 (±1.0) 21.8 (±0.9) 18.0 (±0.6) 18.6 (±0.8) 17.7 (±0.8) 65+ 12.0 (±0.8) 11.5 (±0.9) 10.0 (±0.8) 9.6 (±1.0) 9.2 (±1.0)Race/Ethnicity African-American 26.9 (±2.8) 21.7 (±2.5) 22.0 (±1.7) 24.0 (±1.5) 20.3 (±1.5) Asian 15.6 (±1.6) 11.8 (±1.3) 12.5 (±0.9) 13.5 (±1.5) 12.9 (±1.5) Hispanic 17.9 (±1.1) 15.3 (±1.1) 14.0 (±0.8) 15.7 (±0.8) 16.5 (±1.1) Non HispanicWhite
22.8 (±0.5) 21.7 (±0.6) 18.8 (±0.4) 20.0 (±0.3) 19.4 (±0.3)
Education <12 24.7 (±1.2) 21.0 (±1.1) 20.8 (±1.1) 21.4 (±0.8) 22.0 (±1.2) 12 26.0 (±0.8) 24.6 (±0.8) 21.9 (±0.7) 24.3 (±0.8) 22.7 (±0.7) 13-15 20.0 (±0.8) 18.8 (±1.0) 17.4 (±0.5) 19.6 (±0.8) 19.4 (±0.8) 16+ 12.7 (±0.7) 11.3 (±0.8) 10.2 (±0.4) 10.8 (±0.7) 10.2 (±0.6)Income <$10,000 25.8 (±2.1) 21.8 (±1.6) 22.3 (±1.8) 23.7 (±2.8) $10,001-$20,000 23.6 (±1.8) 21.2 (±1.2) 22.4 (±1.8) 22.9 (±2.1) $20,001-$30,000 25.0 (±1.7) 20.7 (±0.8) 22.2 (±1.8) 19.9 (±2.1) $30,001-$50,000 22.1 (±1.3) 18.6 (±0.8) 20.2 (±1.6) 20.1 (±1.5) $50,001-$75,000 20.0 (±1.1) 15.9 (±0.7) 16.7 (±1.3) 17.2 (±1.2) >$75,000 17.0 (±1.2) 12.1 (±0.7) 13.0 (±1.0) 14.1 (±1.0) Unknown 18.2 (±1.5) 13.8 (±0.9) 15.7 (±1.7) 14.4 (±1.9)
Table entries are weighted percentages and 95% confidence limits.Source: CTS 1990, 1993, 1996, 1999

Smoking Prevalence in California: Results of the California Tobacco Surveys (CTS)
2-29
Table A2.2Unstandardized California Adult Smoking Prevalence
WITHOUT the 100-Cigarette Criterion.Screener Survey Adult Survey
1990%
1993%
1996%
1996%
1999%
Overall 22.2 (±0.5) 20.2 (±0.5) 18.6 (±0.4) 20.4 (±0.5) 19.6 (±0.4)Gender Male 25.5 (±0.5) 23.4 (±0.7) 21.0 (±0.5) 23.4 (±0.7) 23.4 (±0.7) Female 19.1 (±0.7) 17.2 (±0.5) 15.3 (±0.5) 17.5 (±0.7) 15.9 (±0.5)Age 18-24 21.4 (±1.4) 18.9 (±1.2) 19.2 (±1.1) 26.9 (±2.0) 27.0 (±1.8) 25-44 24.6 (±0.8) 22.3 (±0.8) 20.0 (±0.6) 22.3 (±0.7) 21.5 (±0.7) 45-64 23.8 (±1.0) 22.1 (±0.8) 18.3 (±0.6) 19.0 (±0.8) 17.9 (±0.8) 65+ 12.2 (±0.8) 11.8 (±1.0) 10.3 (±0.8) 10.4 (±1.7) 9.3 (±1.0)Race/Ethnicity African-American 27.7 (±2.7) 22.7 (±2.3) 23.1 (±1.7) 25.4 (±2.1) 22.1 (±1.7) Asian 16.8 (±1.6) 12.7 (±1.3) 13.7 (±1.0) 14.6 (±1.6) 14.0 (±1.7) Hispanic 19.4 (±1.1) 16.7 (±1.2) 15.4 (±0.9) 19.4 (±1.3) 18.9 (±1.3) Non HispanicWhite
23.1 (±0.5) 22.1 (±0.7) 19.1 (±0.3) 20.9 (±0.4) 20.2 (±0.4)
Education <12 26.0 (±1.3) 22.2 (±1.0) 22.1 (±1.1) 24.0±1.6) 24.7 (±1.6) 12 26.5 (±0.8) 25.2 (±0.8) 22.8 (±0.6) 25.7 (±1.0) 23.8 (±0.6) 13-15 20.7 (±0.7) 19.3 (±1.0) 18.0 (±0.5) 21.3 (±1.0) 20.6 (±0.9) 16+ 12.9 (±0.7) 11.6 (±0.7) 10.5 (±0.4) 11.9 (±0.9) 10.8 (±0.8)Income <$10,000 27.5 (±2.2) 23.5 (±1.7) 26.3 (±3.1) 27.1 (±3.4) $10,001-$20,000 24.3 (±1.8) 22.3 (±1.2) 24.4 (±1.9) 24.8 (±2.4) $20,001-$30,000 25.6 (±1.7) 21.4 (±0.9) 23.6 (±2.0) 20.4 (±2.1) $30,001-$50,000 22.4 (±1.3) 19.1 (±0.8) 21.5 (±1.8) 21.3 (±1.7) $50,001-$75,000 20.2 (±1.1) 16.4 (±0.7) 18.0 (±1.4) 18.2 (±1.4) >$75,000 17.1 (±1.2) 12.5 (±0.7) 14.0 (±1.2) 15.0 (±1.1) Unknown 19.3 (±1.6) 14.7 (±0.9) 17.5 (±2.0) 15.7 (±2.0)
Table entries are weighted percentages and 95% confidence limits.Source: CTS 1990, 1993, 1996, 1999
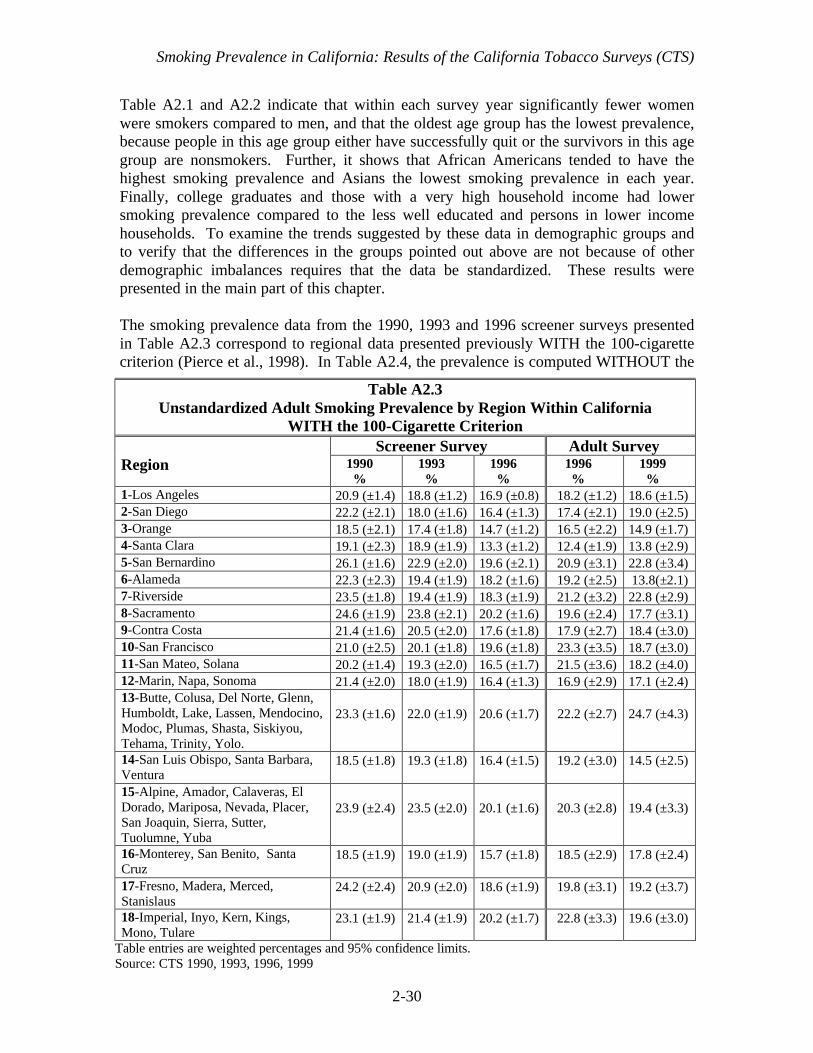
Smoking Prevalence in California: Results of the California Tobacco Surveys (CTS)
2-30
Table A2.1 and A2.2 indicate that within each survey year significantly fewer womenwere smokers compared to men, and that the oldest age group has the lowest prevalence,because people in this age group either have successfully quit or the survivors in this agegroup are nonsmokers. Further, it shows that African Americans tended to have thehighest smoking prevalence and Asians the lowest smoking prevalence in each year.Finally, college graduates and those with a very high household income had lowersmoking prevalence compared to the less well educated and persons in lower incomehouseholds. To examine the trends suggested by these data in demographic groups andto verify that the differences in the groups pointed out above are not because of otherdemographic imbalances requires that the data be standardized. These results werepresented in the main part of this chapter.
The smoking prevalence data from the 1990, 1993 and 1996 screener surveys presentedin Table A2.3 correspond to regional data presented previously WITH the 100-cigarettecriterion (Pierce et al., 1998). In Table A2.4, the prevalence is computed WITHOUT the
Table A2.3Unstandardized Adult Smoking Prevalence by Region Within California
WITH the 100-Cigarette CriterionScreener Survey Adult Survey
Region 1990%
1993%
1996%
1996%
1999%
1-Los Angeles 20.9 (±1.4) 18.8 (±1.2) 16.9 (±0.8) 18.2 (±1.2) 18.6 (±1.5)2-San Diego 22.2 (±2.1) 18.0 (±1.6) 16.4 (±1.3) 17.4 (±2.1) 19.0 (±2.5)3-Orange 18.5 (±2.1) 17.4 (±1.8) 14.7 (±1.2) 16.5 (±2.2) 14.9 (±1.7)4-Santa Clara 19.1 (±2.3) 18.9 (±1.9) 13.3 (±1.2) 12.4 (±1.9) 13.8 (±2.9)5-San Bernardino 26.1 (±1.6) 22.9 (±2.0) 19.6 (±2.1) 20.9 (±3.1) 22.8 (±3.4)6-Alameda 22.3 (±2.3) 19.4 (±1.9) 18.2 (±1.6) 19.2 (±2.5) 13.8(±2.1)7-Riverside 23.5 (±1.8) 19.4 (±1.9) 18.3 (±1.9) 21.2 (±3.2) 22.8 (±2.9)8-Sacramento 24.6 (±1.9) 23.8 (±2.1) 20.2 (±1.6) 19.6 (±2.4) 17.7 (±3.1)9-Contra Costa 21.4 (±1.6) 20.5 (±2.0) 17.6 (±1.8) 17.9 (±2.7) 18.4 (±3.0)10-San Francisco 21.0 (±2.5) 20.1 (±1.8) 19.6 (±1.8) 23.3 (±3.5) 18.7 (±3.0)11-San Mateo, Solana 20.2 (±1.4) 19.3 (±2.0) 16.5 (±1.7) 21.5 (±3.6) 18.2 (±4.0)12-Marin, Napa, Sonoma 21.4 (±2.0) 18.0 (±1.9) 16.4 (±1.3) 16.9 (±2.9) 17.1 (±2.4)13-Butte, Colusa, Del Norte, Glenn,Humboldt, Lake, Lassen, Mendocino,Modoc, Plumas, Shasta, Siskiyou,Tehama, Trinity, Yolo.
23.3 (±1.6) 22.0 (±1.9) 20.6 (±1.7) 22.2 (±2.7) 24.7 (±4.3)
14-San Luis Obispo, Santa Barbara,Ventura
18.5 (±1.8) 19.3 (±1.8) 16.4 (±1.5) 19.2 (±3.0) 14.5 (±2.5)
15-Alpine, Amador, Calaveras, ElDorado, Mariposa, Nevada, Placer,San Joaquin, Sierra, Sutter,Tuolumne, Yuba
23.9 (±2.4) 23.5 (±2.0) 20.1 (±1.6) 20.3 (±2.8) 19.4 (±3.3)
16-Monterey, San Benito, SantaCruz
18.5 (±1.9) 19.0 (±1.9) 15.7 (±1.8) 18.5 (±2.9) 17.8 (±2.4)
17-Fresno, Madera, Merced,Stanislaus
24.2 (±2.4) 20.9 (±2.0) 18.6 (±1.9) 19.8 (±3.1) 19.2 (±3.7)
18-Imperial, Inyo, Kern, Kings,Mono, Tulare
23.1 (±1.9) 21.4 (±1.9) 20.2 (±1.7) 22.8 (±3.3) 19.6 (±3.0)
Table entries are weighted percentages and 95% confidence limits.Source: CTS 1990, 1993, 1996, 1999

Smoking Prevalence in California: Results of the California Tobacco Surveys (CTS)
2-31
100-cigarette criterion. These prevalence figures show the snap shot of prevalence ineach region each year. Again, for comparing regions or for comparing trends withinregion, see the main body of this chapter.
Adult Daily Smoking
The unstandardized prevalence for adult daily smoking is presented in Table A2.5.Women consistently have lower rates of daily smoking than men, and daily smoking ishighest among the middle aged. African Americans and Non-Hispanic Whites havehigher rates of daily smoking than other race/ethnicity groups. People with higher levelsof education are less likely to be daily smokers, and this trend holds for increasinghousehold income as well.
Table A2.4Unstandardized Adult Smoking Prevalence by Region Within California
WITHOUT the 100-Cigarette Criterion
Screener Survey Adult Survey
Region 1990%
1993%
1996%
1996%
1999%
1-Los Angeles 21.8 (±1.5) 19.7 (±1.3) 18.0 (±0.8) 21.3 (±1.6) 20.4 (±1.6)2-San Diego 23.1 (±2.2) 18.7 (±1.7) 17.0 (±1.4) 18.8 (±2.4) 20.0 (±2.6)3-Orange 19.3 (±2.1) 18.1 (±1.8) 15.3 (±1.2) 17.8 (±2.4) 15.6 (±1.9)4-Santa Clara 19.7 (±2.3) 19.5 (±2.0) 13.9 (±1.3) 13.4 (±2.1) 14.5 (±3.1)5-San Bernardino 26.6 (± 1.7) 23.4 (±2.0) 20.0 (±2.1) 21.7 (±3.2) 24.8 (±3.4)6-Alameda 22.8 (±2.3) 19.9 (±1.8) 18.9 (±1.9) 19.6 (±2.6) 14.8 (±2.3)7-Riverside 23.9 (± 1.8) 20.0 (±1.9) 18.9 (±1.9) 23.2 (±3.6) 23.1 (±2.9)8-Sacramento 25.2 (±2.0) 24.1 (±2.1) 20.9 (±1.6) 20.3 (±2.6) 18.0 (±3.2)9-Contra Costa 21.9 (±1.6) 21.3 (±2.0) 18.1 (±1.8) 18.9 (±2.8) 19.7 (±3.5)10-San Francisco 21.9 (±2.4) 20.7 (±1.8) 20.8 (±1.8) 24.9 (±3.8) 19.8 (±3.2)11-San Mateo, Solana 20.8 (±1.4) 19.6 ±2.0) 17.1 (±1.7) 21.8 (±3.9) 19.6 (±4.0)12-Marin, Napa, Sonoma 21.7 (±2.0) 18.5 (±1.9) 17.0 (±1.3) 17.7 (±2.9) 18.3 (±2.8)13-Butte, Colusa, Del Norte, Glenn,Humboldt, Lake, Lassen, Mendocino,Modoc, Plumas, Shasta, Siskiyou,Tehama, Trinity, Yolo.
23.7 (±1.6) 22.3 (±1.9) 21.1 (±1.7) 23.7 (±2.6) 25.9 (±4.3)
14-San Luis Obispo, Santa Barbara,Ventura
18.8 (±1.7) 19.8 (±1.8) 17.0 (±1.5) 19.9 (±3.1) 15.5 (±2.7)
15-Alpine, Amador, Calaveras, ElDorado, Mariposa, Nevada, Placer, SanJoaquin, Sierra, Sutter, Tuolumne,Yuba
24.1 (±2.4) 23.7 (±2.1) 20.5 (±1.6) 22.5 (±3.3) 20.2 (±3.3)
16-Monterey, San Benito, Santa Cruz 20.0 (±1.9) 19.6 (±2.0) 16.5 (±1.8) 19.0 (±2.9) 19.6 (±2.6)17-Fresno, Madera, Merced, Stanislaus 25.1 (± 2.4) 21.5 (±1.9) 19.4 (±1.8) 21.1 (±3.4) 21.0 (±4.0)18-Imperial, Inyo, Kern, Kings, Mono,Tulare
23.9 (± 2.0) 22.0 (±1.8) 21.5 (±1.7) 23.2 (±3.3) 21.8 (±3.3)
Table entries are weighted percentages and 95% confidence limitsSource: CTS 1990, 1993, 1996, 1999

Smoking Prevalence in California: Results of the California Tobacco Surveys (CTS)
2-32
Adolescent Smoking Prevalence
Table A2.6 shows the unstandardized results for adolescent smoking prevalence (anysmoking in the last 30 days) from the 1990, 1993, 1996 and 1999 CTS. To comparetrends over time either overall or within demographic groups, refer to the adolescentsmoking section in the main body of this chapter.
Table A2.5Unstandardized California Adult Daily Smoking Prevalence
WITH the 100-Cigarette Criterion1990
%1992
%1996
%1999
%Overall 17.5(±0.5) 16.4(±0.9) 14.1(±0.3) 13.0(±0.3)Gender Male 19.5 (±0.9) 18.5 (±1.4) 16.0 (±0.4) 15.1 (±0.4) Female 15.5 (±0.7) 14.3 (±0.9) 12.2 (±0.3) 10.9 (±0.4)Age 18-24 15.8 (±1.5) 15.7 (±2.5) 13.3 (±0.9) 12.9 (±0.8) 25-44 19.2 (±0.7) 18.1 (±1.9) 15.2 (±0.4) 14.0 (±0.5) 45-64 18.8 (±1.2) 17.5 (±1.9) 15.6 (±0.7) 14.0 (±0.6) 65+ 10.9 (± 1.5) 9.4 (±1.8) 8.2 (±0.9) 7.5 (±0.9)Race/Ethnicity African-American 21.3 (±3.3) 18.7 (±4.2) 17.7 (±1.5) 13.6 (±1.5) Asian 12.2 (±2.8) 10.0 (±2.7) 9.8 (±1.0) 8.8 (±1.2) Hispanic 11.1 (±1.5) 10.2 (±3.5) 9.0 (±0.7) 8.7 (±0.7) Non Hispanic White 19.7 (±0.8) 18.9 (±2.2) 16.3 (±0.3) 15.3 (±0.4)Education <12 20.7 (±1.8) 19.0 (±3.9) 15.8 (±0.7) 14.8 (±0.9) 12 20.4 (±0.9) 20.3 (±1.2) 19.1 (±0.5) 17.5 (±0.7) 13-15 17.2 (±1.1) 15.4 (±1.1) 14.8 (±0.7) 13.8 (±0.6) 16+ 9.8 (±0.9) 8.5 (±0.8) 7.5 (±0.5) 6.4 (±0.4)Household Income <$10,000 20.1 (±2.6) 17.4 (±1.8) 17.2 (±2.1) $10,001 to $20,000 19.7 (±1.8) 16.4 (±1.3) 15.8 (±1.6) $20,001 to $30,000 19.9 (±2.0) 16.6 (±1.3) 14.1 (±1.6) $30,001 to $50,000 17.9 (±1.7) 15.3 (±1.3) 14.6 (±1.3) $50,001 to $75,000 16.7 (±1.8) 12.9 (±1.2) 13.0 (±1.1) >$75,000 12.5 (±1.5) 9.3 (±0.9) 9.2 (±0.8) Unknown 15.5 (±1.7) 11.9 (±1.3) 9.9 (±1.5)
Table entries are weighted percentages and 95% confidence limitsSource: CTS 1990, 1992, 1996, 1999

Smoking Prevalence in California: Results of the California Tobacco Surveys (CTS)
2-33
While girls had slightly lower levels of current smoking prevalence than boys through1996, the gender difference had disappeared by 1999. In each year, smokingprevalence increased with age. Also, Non-Hispanic White adolescents had a highersmoking prevalence in each year compared to minorities. Finally, in each year,adolescents with average or below self-reported school performance had the highestsmoking prevalence. While there was a difference in prevalence between those withbetter than average and much better than average school performance, it was muchless and not significant in every year.
Adolescent Smoking Prevalence by Region
The unstandardized estimates of adolescent smoking prevalence by region are shown inTable A2.7. Again, to compare trends over time within region or to compare ratesbetween regions, refer to the main body of the chapter. The snap shot estimates in TableA2.7 are the best estimates for each region at each point in time, given the composition ofthe adolescent population in the region.
Table A2.6Unstandardized Adolescent (12-17 years) Smoking Prevalence
(in Last 30 days) in California1990
%1993
%1996
%1999
%Overall 9.2 (±0.9) 9.2 (±1.1) 12.0 (±1.1) 7.7 (±0.8)Gender Boys 9.8 (±1.6) 10.1 (±1.8) 12.6 (±1.4) 7.9 (±1.0) Girls 8.7 (±1.5) 8.3 (±1.5) 11.3 (±1.4) 7.5 (±1.1)Age 12-13 3.6 (±1.6) 3.1 (±1.0) 3.3 (±0.9) 1.8 (±0.8) 14-15 8.0 (±1.5) 9.6 (±1.9) 10.9 (±1.4) 5.6 (±1.0) 16-17 16.6 (±2.2) 15.9 (±2.6) 22.2 (±2.3) 16.3 (±2.2)Race/Ethnicity African American 5.6 (±3.2) 4.8 (±3.5) 6.3 (±2.8) 5.5 (±2.3) Asian 4.8 (±2.6) 5.4 (±3.8) 8.8 (±2.5) 4.8 (±2.0) Hispanic 8.9 (±1.9) 7.1 (±1.7) 10.8 (±1.9) 7.8 (±1.4) Non-Hispanic White 11.0 (±1.3) 11.8 (±1.3) 14.3 (±1.2) 8.7 (±1.2)School Performance Much Better Than Ave 4.5 (±1.7) 3.9 (±1.4) 5.8 (±1.5) 4.9 (±2.0) Better Than Average 6.5 (±1.4) 6.9 (±1.6) 10.8 (±1.5) 6.7 (±1.1) Average or Below 13.4 (±2.0) 13.2 (±1.9) 16.7 (±1.7) 10.0 (±1.2)
Table entries are weighted percentages and 95% confidence limits.Source: CTS 1990, 1993, 1996, 1999

Smoking Prevalence in California: Results of the California Tobacco Surveys (CTS)
2-34
Table A2.7Unstandardized Adolescent Smoking Prevalence (in Last 30 Days)
by RegionWithin California
Screener Survey
Region1990
%1993
%1996
%1999
%1-Los Angeles 7.3 (±2.4) 7.3 (±2.4) 10.3 (±2.0) 6.6 (±1.8)2-San Diego 7.7 (±3.6) 9.8 (±4.6) 8.6 (±3.4) 9.3 (±3.3)3-Orange 10.8 (±4.1) 8.9 (±3.7) 16.2 (±4.3) 8.0 (±2.8)4-Santa Clara 8.7 (±2.8) 9.7 (±3.7) 11.3 (±4.6) 5.8 (±2.5)5-San Bernardino 12.8 (±4.1) 10.4 (4.3) 12.8 (±4.6) 5.7 (±2.1)6-Alameda 12.0 (±5.1) 8.1 (±4.3) 11.7 (±4.4) 8.6 (±3.7)7-Riverside 10.4 (±3.5) 7.5 (±3.4) 13.3 (±3.6) 4.9 (±2.1)8-Sacramento 7.3 (±4.1) 8.4 (±4.4) 15.1 (±4.4) 9.1 (±4.4)9-Contra Costa 8.2 (±3.7) 8.7 (±3.4) 12.0 (±4.3) 7.9 (±3.6)10-San Francisco 5.5 (±3.8) 7.3 (±5.2) 9.3 (±6.0) 14.7 (±8.0)11-San Mateo, Solano 9.5 (±4.2) 11.8 (±5.3) 11.7 (±4.4) 11.9 (±6.0)12-Marin, Napa, Sonoma 10.9 (±4.6) 17.5 (±5.3) 17.6 (±5.1) 5.9 (±2.9)13-Butte, Colusa, DelNorte, Glenn, etc.
14.7 (±4.3) 11.6 (±4.1) 16.5 (±4.1) 11.7 (±6.0)
14-San Luis Obispo,Santa Barbara, Ventura
12.0 (±4.2) 13.5 (±4.3) 10.9 (±3.6) 5.0 (±2.6)
15-Amador, Alpine,Calaveras El Dorado,etc.
13.0 (±5.8) 8.2 (±2.9) 14.6 (±4. 4) 10.8 (±4.7)
16-Santa Cruz 12.5 (±5.4) 12.8 (±4.7) 8.9 (±3.8) 7.6 (±3.9)17-Fresno, Madera,Merced, Stanislaus
8.0 (±3.5) 11.0 (±3.6) 16.2 (±4.1) 9.3 (±2.6))
18-Imperial, Inyo, Kern,Kings, Mono, Tulare
7.7 (±3.5) 8.9 (±3.9) 8.7 (±3.2) 7.4 (±2.5)
State 9.2 (±1.0) 9.2 (±1.1) 12.0 (±1.1) 7.7 (±0.8)

Smoking Prevalence in California: Results of the California Tobacco Surveys (CTS)
2-35
CHAPTER 2: GLOSSARY
Adolescents
Current smoker – has smoked a cigarette on at least one day in the past month.
Never smoker – has never smoked or even puffed on a cigarette.
Non-current smoker – has not smoked a cigarette on any days in the past month.
Nonsmoker – never smoker or non-current smoker.
Adults
Current smoker – has smoked at least 100 cigarettes in his or her lifetime and smokesnow (old question) or now either everyday or some days (new question) at the time ofthe survey.
Daily smoker – a current smoker who has smoked on every day of the past month (oldquestion sequence) or who now smokes everyday (new question).
Former smoker – has smoked at least 100 cigarettes in lifetime, but does not smoke now(old question) or now smokes not at all (new question).
Heavy smoker – a current smoker who smokes 15 or more cigarettes a day.
Light smoker – a current smoker who smokes fewer than 15 cigarettes a day.
Never smoker – has smoked fewer than 100 cigarettes in his or her lifetime.
Occasional smoker – a current smoker who smoked on at least 1 day in the past month(old question sequence) or who says he or she now smokes some days (new question).

Smoking Prevalence in California: Results of the California Tobacco Surveys (CTS)
2-36
CHAPTER 2: REFERENCES
Gilpin EA, Pierce JP, Cavin SW, Berry CC, Evans NJ, Johnson M, Bal DG. Estimates ofpopulation smoking prevalence: Self vs. proxy reports of smoking status. Am J PubHealth 1994;84:1576-1579.
Gilpin EA, Pierce JP, Berry, CC, White, MM, Maklan, DM, Croos, J, Aiken, M.Technical Report on Analytic Methods and Approaches Used in the 1996 CaliforniaTobacco Survey Analysis. Vol. 2: Statistical Methodology, Public Use Data FileDocumentation, Individual Item Responses. La Jolla, CA: University of California, SanDiego: 2000.
Gilpin EA, Emery SL, Berry CC. Technical Report on Analytic Methods andApproaches Used in the 1996 California Tobacco Survey Analysis. Vol 3: MethodsUsed for Final Report-The California Tobacco Control Program: A Decade of Progress,1989-1999. La Jolla, CA: University of California, San Diego; 2001.
Law Review Commentaries (LRC). Review of selected 1994 California legislation. L.J.202; 1995.
Pierce JP, Gilpin E, Burns DM, Whalen E, Rosbrook B, Shopland D, Johnson M.Does tobacco advertising target young people to start smoking? Evidence fromCalifornia. JAMA 1991;266(22):3154-3158.
Pierce JP, Gilpin EA, Emery SL, Farkas AJ, Zhu SH, Choi WS, Berry CC, Distefan JM,White MM, Soroko S, Navarro A. Tobacco Control in California: Who’s Winning theWar? An Evaluation of the Tobacco Control Program, 1989-1996. La Jolla, CA:University of California, San Diego; 1998. World Wide Web: http://ssdc.ucsd.edu/tobacco/

3-1
Chapter 3
PROTECTION OF NONSMOKERS

Protection of Nonsmokers
3-2
CHAPTER 3: PROTECTION OF NONSMOKERS
Introduction
The well-documented health hazards of secondhand smoke (US EPA, 1992; CalEPA,1997; NCI, 1999) make protection of nonsmokers from secondhand smoke one of themajor goals of the California Tobacco Program (Pierce et al., 1994; TEROC, 2000).Reduction or elimination of exposure to secondhand tobacco smoke in places wherepeople spend a considerable amount of time, particularly in the workplace and at home,is central to this objective. This chapter shows the progress in California toward theelimination of exposure of nonsmokers to secondhand tobacco smoke.
Section 1 of this chapter shows the increase in the percentage of indoor Californiaworkers with smokefree workplaces, as well as the decrease in exposure to secondhandsmoke in the workplace. It also examines workplace settings where workers saysmoking is allowed and the types of workplaces where exposure to secondhand smoke isstill relatively high. Section 2 examines home smoking policies, addressing suchquestions as who is implementing them, why they were implemented and who isbenefiting, and Section 3 explores the extent of secondhand smoke exposure across thepopulation in places other than home or work. Section 4 looks at population beliefsabout the harmfulness of secondhand smoke. Section 5 describes nonsmoker activism inCalifornia. Section 6 summarizes the chapter results, highlighting progress as well asareas where further policy initiatives may be needed.
1. Smokefree Workplaces
The initiation of the California Tobacco Control program was associated with anincrease in the number of local ordinances restricting smoking in the workplaces (Pattenet al., 1995). A great deal of the impetus for the campaign to pass these ordinancescame from volunteers with essential support from local lead agencies funded by theCalifornia Tobacco Control Program. These local efforts were likely enhanced when theU.S. Environmental Protection Agency released its 1992 report declaring secondhandsmoke a known human carcinogen (US EPA, 1992). The proliferation of these localordinances throughout the early 1990s culminated in the passage of California AssemblyBill 13 (AB-13), which was enacted in January of 1994 and took effect in 1995. AB-13prohibits smoking in all enclosed places of employment, and supersedes many of thelocal ordinances enacted earlier. It does not preclude local jurisdictions from enactingstronger ordinances (MacDonald & Glantz, 1997). As enacted initially, AB-13 coveredall workplaces except for bars, taverns and gaming clubs, and it was expanded to coverthese venues as of January 1, 1998.
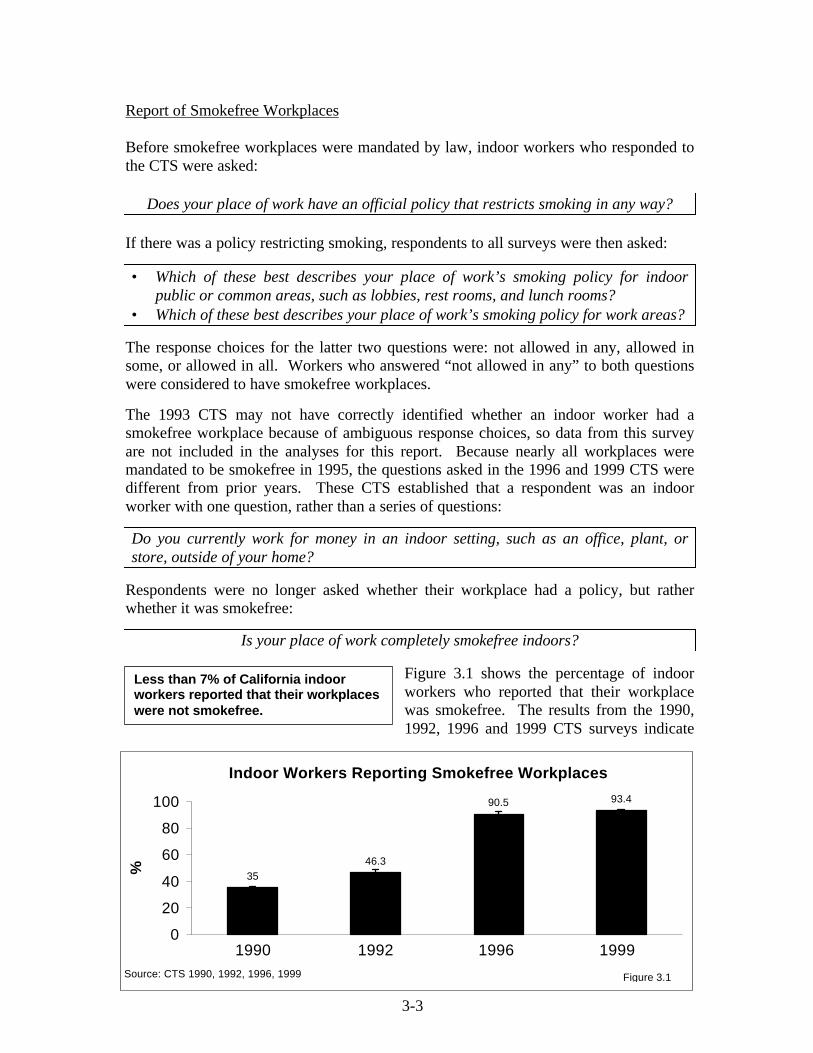
3-3
Report of Smokefree Workplaces
Before smokefree workplaces were mandated by law, indoor workers who responded tothe CTS were asked:
Does your place of work have an official policy that restricts smoking in any way?
If there was a policy restricting smoking, respondents to all surveys were then asked:
• Which of these best describes your place of work’s smoking policy for indoorpublic or common areas, such as lobbies, rest rooms, and lunch rooms?
• Which of these best describes your place of work’s smoking policy for work areas?
The response choices for the latter two questions were: not allowed in any, allowed insome, or allowed in all. Workers who answered “not allowed in any” to both questionswere considered to have smokefree workplaces.
The 1993 CTS may not have correctly identified whether an indoor worker had asmokefree workplace because of ambiguous response choices, so data from this surveyare not included in the analyses for this report. Because nearly all workplaces weremandated to be smokefree in 1995, the questions asked in the 1996 and 1999 CTS weredifferent from prior years. These CTS established that a respondent was an indoorworker with one question, rather than a series of questions:
Do you currently work for money in an indoor setting, such as an office, plant, orstore, outside of your home?
Respondents were no longer asked whether their workplace had a policy, but ratherwhether it was smokefree:
Is your place of work completely smokefree indoors?
Figure 3.1 shows the percentage of indoorworkers who reported that their workplacewas smokefree. The results from the 1990,1992, 1996 and 1999 CTS surveys indicate
3546.3
90.5 93.4
0
20
40
60
80
100
1 2 3 4
%
Source: CTS 1990, 1992, 1996, 1999 Figure 3.1
Indoor Workers Reporting Smokefree Workplaces
1990 1992 1996 1999
Less than 7% of California indoorworkers reported that their workplaceswere not smokefree.

Protection of Nonsmokers
3-4
that the percentage of workers who enjoy a smokefree workplace has increasedsignificantly from its level in 1990, 35.0±1.3% to 93.4±0.8% in 1999, a factor increaseof 167%. Table A3.1 at the end of this chapter shows the detailed breakout of report ofsmokefree workplaces in 1999 by demographics.
If the workplace was reported to allow smoking indoors (<7% of total), the 1999 CTSsought more detailed information with the following question:
For each of the following indoor areas in your building, is smoking allowed in…a) any indoor work areas b) a special smoking room or lounge
c) a break room or cafeteria d) a hallway or lobby ?
Respondents could answer yes, no or not applicable with respect to each of the 4 areas.Only 2.4±0.5% perceived that their employer’s smoking policy allowed smoking inindoor work areas, 1.5±0.4% perceived that smoking was allowed in special smokingrooms or lounges, 0.9±0.2% said it was allowed in a break room or cafeteria, and1.1±0.3% said it was allowed in a hall or lobby. Thus, more of these indoor workersthought smoking was allowed in work areas than in other areas. Regardless of whetherthis represents confusion on the part of the employer or the employee or noncompliance,there is still room for additional efforts to inform both employees and employers aboutthe provisions of AB-13.
Another two questions asked in 1999 assessed all indoor workers’ perceptions ofworkplace smoking policy out of doors:
Is smoking allowed outside the building…a) adjacent to entrances b) in a special area on the property?
Combining the responses to this question with the smokefree-indoor question shows that69.9±1.7% of indoor workers reported that while smoking was banned indoors, it wasallowed adjacent to entrances. Another 12.9±1.7% thought it was banned both indoorsand adjacent to entrances, and 10.6±1.0% thought it was not allowed anywhere on theproperty.
Exposure of Nonsmokers to Secondhand Tobacco Smoke at Work
As explained above, in 1999 93.4±0.8% of indoor workers reported smokefreeworkplaces. In 1999, all indoor workplaces should by law be smokefree. In order toaccurately assess workplace protection from secondhand tobacco smoke, each CTSasked all nonsmokers who worked indoors:
During the past two weeks, has anyone smoked in the area in which you work?
Figure 3.2 shows that the percentage ofnonsmoking indoor workers reporting thatthey had been exposed to secondhand smokein the last 2 weeks decreased significantly
The percentage of nonsmoking indoorworkers exposed to secondhandsmoke at work is approximately halfthe rate observed in 1990.

Protection of Nonsmokers
3-5
between 1990 and 1996. However, despite the now comprehensive provisions of AB-13, between 1996 and 1999, this percentage increased significantly by a factor of 32.2%to 15.6±1.4%. Nonetheless, over the decade, exposure to secondhand smoke in theworkplace decreased by a factor of 46.2%.
For comparison, Table 3.1 presents work area exposure to secondhand smoke in the past2 weeks for demographic groups of indoor workers for 1990, 1993, 1996 and 1999.While workplace exposure to secondhand smoke diminished significantly across allcategories of workers between 1990 and 1999, the reduction in exposure did not removethe inequities in rates of exposure that existed in 1990. In general, males, youngernonsmokers, minorities (especially Hispanics and Asians), and the less well-educatedhave higher rates of work area exposure to secondhand smoke.
Between 1996 and 1999, there were several demographic groups of nonsmoking indoorworkers that showed marked and significant increases in exposure to secondhand smokein the workplace. Women’s reported exposure increased by a factor of 87.1%, youngadults’ by a factor of 68.4%, those with some college by a factor of 65.6%, and collegegraduates by 102%. The increase for Non-Hispanic Whites was significant, andalthough the increases were greater percentage wise for minorities (except Hispanics),they were not statistically significant.
It is not clear whether the increase in reported exposure to secondhand smoke in theworkplace indicates actual increases in noncompliance with the state smokefree indoorworkplace law or simply reflects a heightened awareness of exposure. The possibility ofslippage in compliance with the state law deserves serious consideration by the TobaccoControl Program.
15.6
11.8
22.4
29
0
5
10
15
20
25
30
35
1 2 3 4
%
Source: CTS 1990, 1993, 1996, 1999 Figure 3.2
Exposure of Nonsmoking Indoor Workers to Secondhand Smoke
1990 1993 1996 1999

Protection of Nonsmokers
3-6
Compliance With AB-13
To gain some understanding about the work settings in which exposure to secondhandsmoke was most likely to occur, in 1999, we asked all indoor workers about their type ofwork area:
What best describes where you work outside the home for money?
The response categories were as shown in Figure 3.3. Exposure to secondhand smokewas least likely to occur among workers in classrooms and hospitals. Offices (andplants or factories) also had relatively low rates of exposure. Exposure was much higherfor workers in stores/warehouses or restaurants/bars. Workers whose workplace was avehicle had an even higher exposure rate. These findings suggest that enforcement ofsmokefree workplaces is still inadequate in restaurants/bars.
Table 3.1Exposure of Nonsmokers to Secondhand Smoke in the Past Two Weeks
in Indoor Work Areas by Demographic Characteristics
1990%
1993%
1996%
1999%
FactorChange
1996-1999%
Overall 29.0 (±1.8) 22.4 (±1.3) 11.8 (±1.5) 15.6 (±1.4) 32.2Sex Male 35.6 (±2.9) 27.6 (±1.8) 16.4 (±2.4) 18.2 (±1.9) 11.0 Female 22.8 (±2.0) 17.1 (±1.6) 7.0 (±1.5) 13.1 (±2.2) 87.1Age (years) 18-24 41.7 (±4.7) 31.1 (±3.7) 17.4 (±4.7) 29.3 (±4.8) 68.4 25-44 27.9 (±2.4) 22.7 (±1.6) 12.3 (±1.9) 15.5 (±2.1) 18.4 45-64 23.3 (±2.7) 16.3 (±2.1) 8.6 (±2.6) 10.2 (±3.1) 18.6 65+ 16.7 (±9.4) 17.9 (±5.8) 9.8 (±6.7) 12.3 (±7.1) 25.5Race/ethnicity African American 22.9 (±7.5) 19.5 (±4.4) 7.9 (±5.2) 15.3 (±5.8) 93.7 Asian/PI 27.8 (±5.6) 26.4 (±5.3) 11.6 (±4.0) 19.7 (±7.4) 69.8 Hispanic 39.8 (±4.9) 32.2 (±3.8) 19.6 (±3.8) 20.4 (±3.1) 4.1 Non-Hispanic White 25.9 (±1.8) 19.0 (±1.4) 9.0 (±1.6) 12.4 (±1.4) 37.8 Education Less than 12 years 42.1 (±8.6) 35.6 (±5.2) 28.7 (±7.2) 27.3 (±7.3) -4.9 High school graduate 33.7 (±3.5) 28.0 (±2.3) 17.1 (±3.4) 19.5 (±3.0) 14.0 Some college 30.0 (±3.2) 21.6 (±1.9) 9.3 (±2.1) 15.4 (±2.4) 65.6 College graduate 18.5 (±1.8) 13.6 (±1.3) 5.0 (±1.8) 10.1 (±2.0) 102.0
Table entries are weighted percentages and 95% confidence limits.Source: CTS 1990,1993,1996,1999

Protection of Nonsmokers
3-7
Whether or not AB-13 is applicable to vehicles such as delivery trucks and taxis, whichcould be considered indoor work areas, needs further clarification.
In past CTS, exposure to secondhand smoke was analyzed by size of workplace under orover 50 employees. In 1999, the under 50-employee category was further broken out:
What is the total number of employees in the building where you work? Is it…less than 5, at least 5 but less than 25, between 25 and 50, or over 50?
Figure 3.4 shows the level of work area exposure for indoor workers in these varioussized workplaces. While larger workplaces were clearly more compliant, there was no
7.1 7.911.7
17.724.5
31.9
50.2
010203040
50607080
1 2 3 4 5 6 7
%
Source: CTS 1999 Figure 3.3
Exposure of Nonsmoking Indoor Workers by Type of Workplace in 1999
Classroom Hospital Plant/Factory
Office Store/Warehouse
Restaurant/Bar
Vehicle
12.1
20.6
18.117.8
0
5
10
15
20
25
30
1 2 3 4
Number of Employees at Workplace
%
Source: CTS 1999 Figure 3.4
<5 5-24 25-50 >50
Exposure of Nonsmoking Indoor Workersby Size of Workplace in 1999

Protection of Nonsmokers
3-8
tendency for the smallest workplaces (<5 employees) to be less compliant than otherworkplaces with fewer than 50 employees.
California has made significant progress in protecting nonsmokers from the hazards ofsecondhand smoke in the workplace. While gains were achieved in the early 1990sthrough mass media and local community activity, the passage of a statewide law (AB-13) was associated with the largest change. However, compliance appears to haverelaxed somewhat in recent years.
2. Exposure to Involuntary Smoking at Home
Increased smoking restrictions in the workplace may have contributed to the shiftingattitude in the population that smokers should not smoke indoors at home either (Farkaset al, 1999). Growing concerns about the health dangers of secondhand smoke, and theemphasis placed on this issue by the California Tobacco Control Program mediacampaign, may also have led to the adoption of home smoking restrictions. While homesmoking restrictions play a vital role in protecting nonsmokers, particularly children,from secondhand smoke, there is considerable evidence that they have a much widereffect. Smokefree homes may decrease cigarette consumption, promote quitting, andhelp prevent relapse in former smokers (Gilpin et al., 1999; Farkas et al., 1999). Inaddition, recent data also suggest that smokefree homes are associated with lowersmoking initiation rates in adolescents, even in homes where parents smoke (Farkas etal., 2000).
Respondents to CTS after 1990 were asked to describe their home rules on smoking bychoosing from the following options:
(1) Smokefree Smoking is completely banned in the home(2) Some Restrictions Smoking is permitted in certain rooms or at certain times(3) Unrestricted Smoking is allowed anywhere in the home
Figure 3.5 shows a continued increase in the percentage of smokefree homes, so thatnearly three-quarters of California homes in 1999 were reported to be smokefree. Table
0
20
40
60
80
Smokefree Some Restrictions No RestrictionsHome Smoking Policy
%
1993 1996 1999
Home Smoking Restrictions AmongAll Californians (Smokers and Nonsmokers)
Source: CTS 1993, 1996, 1999 Figure 3.5
1993 1996 1999Smokefree 50.9 64.5 72.8 ± 1.1
Some Restrictions 20.0 16.6 12.5 ± 0.7
No Restrictions 29.1 18.9 14.7 ± 0.8

Protection of Nonsmokers
3-9
A3.2 in the back of this chapter shows report of home smoking restrictions bydemographics.
Since many homes do not have residentsmokers, it is important to examine these trendsas reported by smokers (see Figure 3.6).Between 1993 and 1996, the percentage of
California smokers that reported smokefree homes increased from 20.1±1.7% to38.1±1.5%, and further increased to 47.2±1.8% in 1999, an overall factor increase of135%.
Corresponding to the rise in smokefree homes with adult smokers, there was asignificant decrease in the percentage of homes with no restrictions between 1993 and1999. These data represent an encouraging signal that the health norms promoted by theTCP have been incorporated into the social norms of a large segment of the population..
0
10
20
30
40
50
60
Smokefree Some Restrictions No Restrictions
Home Smoking Policy
%
1993
1996
1999
Source: CTS 1993, 1996, 1999
Home Smoking Restrictions Reported by California Smokers
Figure 3.6
In 1999, nearly 50% of all smokerslived in smokefree homes, a 2.4fold increase in 10 years.
1993 1996 1999
Smokefree 20.1 38.1 47.2
Some Restrictions 26.1 26.3 21.8
No Restrictions 53.9 35.6 31.0
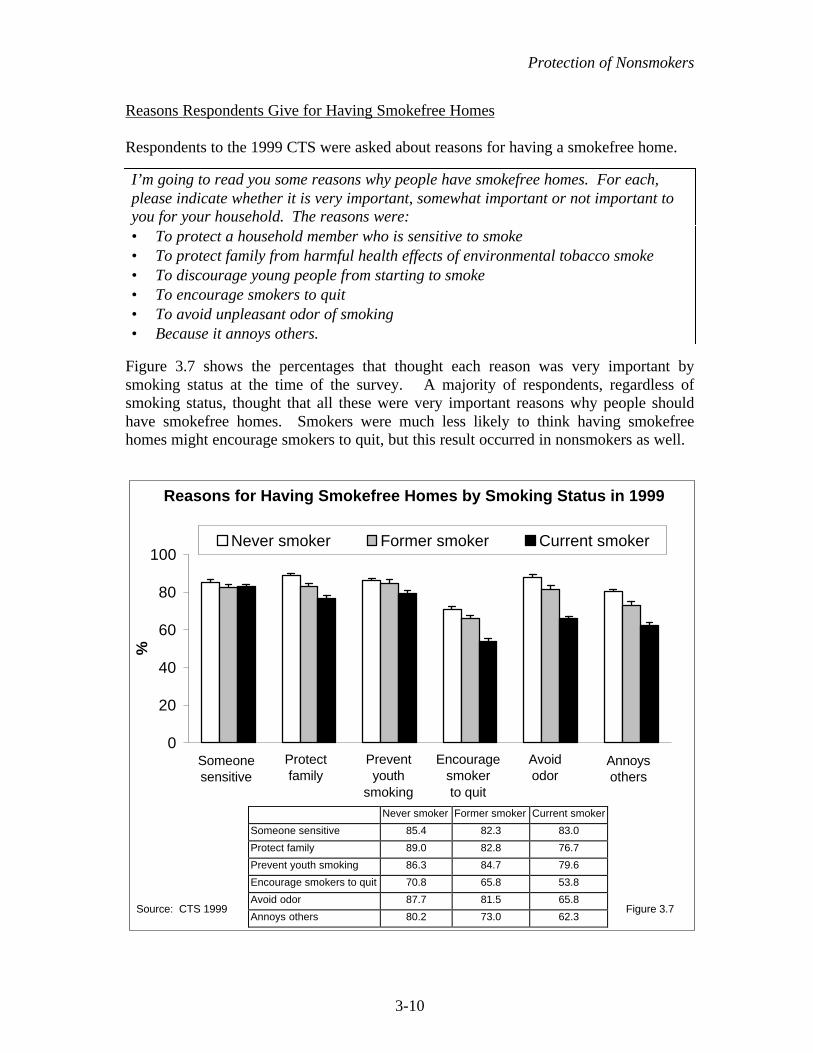
Protection of Nonsmokers
3-10
Reasons Respondents Give for Having Smokefree Homes
Respondents to the 1999 CTS were asked about reasons for having a smokefree home.
I’m going to read you some reasons why people have smokefree homes. For each,please indicate whether it is very important, somewhat important or not important toyou for your household. The reasons were:• To protect a household member who is sensitive to smoke• To protect family from harmful health effects of environmental tobacco smoke• To discourage young people from starting to smoke• To encourage smokers to quit• To avoid unpleasant odor of smoking• Because it annoys others.
Figure 3.7 shows the percentages that thought each reason was very important bysmoking status at the time of the survey. A majority of respondents, regardless ofsmoking status, thought that all these were very important reasons why people shouldhave smokefree homes. Smokers were much less likely to think having smokefreehomes might encourage smokers to quit, but this result occurred in nonsmokers as well.
0
20
40
60
80
100
1 2 3 4 5 6
%
Never smoker Former smoker Current smoker
Source: CTS 1999 Figure 3.7
Reasons for Having Smokefree Homes by Smoking Status in 1999
Someonesensitive
Annoys others
Avoid odor
Encouragesmokerto quit
Preventyouth
smoking
Protect family
Never smoker Former smoker Current smoker
Someone sensitive 85.4 82.3 83.0
Protect family 89.0 82.8 76.7
Prevent youth smoking 86.3 84.7 79.6
Encourage smokers to quit 70.8 65.8 53.8
Avoid odor 87.7 81.5 65.8
Annoys others 80.2 73.0 62.3

Protection of Nonsmokers
3-11
Protection of Children and Youth from Secondhand Tobacco Smoke in the Home
The California Environmental Protection Agencyhas clearly documented the risks of secondhandsmoke to children (CalEPA, 1997). Children andadolescents are increasingly protected fromsecondhand tobacco smoke in the home either
because they do not live with a smoker, or they live in a smokefree home. Amongchildren under 6 years old, 91.0±1.3% were protected from ETS in the home in 1999. Inhomes with children age 5 years or less (Figure 3.8) where all adults smoke, thepercentage with smokefree homes rose from 19.3±6.4% in 1993 to 56.7±5.5% in 1999, afactor increase of 194%. In homes with young children where only some adults smoke,44.8±4.2% were smokefree in 1993, and this figure jumped to 73.1±4.6% by 1999, afactor increase of 63.2%.
In 1999, 88.6±1.1% of California children and adolescents (0 to 17 years of age) wereprotected from secondhand smoke at home, about the same as in 1996 (87.0±1.0%) andsignificantly increased from 1993 (77.0±1.4%). Figure 3.9 shows that the protection ofchildren and adolescents appears to have increased in all racial and ethnic groups. Someminority children and adolescents had particularly high rates of protection frominvoluntary smoking in the home in 1999: Hispanic, Non-Hispanic White, and Asianchildren and adolescents all had protection rates over the 85.0±4.9% seen in AfricanAmericans. However, the gap between African Americans and other groups is much lessin 1999 than previously.
0
20
40
60
80
100
1993 1996 1999
% P
rote
cted
All adults smoke At least 1 adult smokes
Source: CTS 1993, 1996, 1999 Figure 3.8
Protection of Young Children (0-5 Years)in Households Where Adults Smoke
By 1999, there was almost a 3-foldincrease in protection of youngchildren in households where alladults smoke.
All adults smoke At least 1 adult smokes
1993 19.3 44.8
1996 41.6 62.4
1999 56.7 73.1

Protection of Nonsmokers
3-12
3. Exposure to Secondhand Tobacco Smoke in Places Other Than Work or Home
The rapid increase in protection of nonsmokers from exposure to secondhand smokesuggests that some California nonsmokers may no longer be exposed to tobacco smokeat all. To estimate the percentage of such California nonsmokers, the 1999 CTS asked:
In California, in the past 6 months, have you had to put up with someone smoking nearyou at any other place besides your home or your workplace?
The percentage of nonsmokers who answered noto the above question, and who reported smokefreehomes, and, if indoor workers, had smokefreeworkplaces with no exposure to smokers in theirwork area in the past two weeks, was 37.1±1.4%.
Nonsmokers who answered yes to the above question were asked:
The last time this happened, in California, where were you?
0
20
40
60
80
100
1993 1996 1999
% P
rote
cted
African American Asian Hispanic Non-Hispanic White
Source: CTS 1993, 1996, 1999 Figure 3.9
Protection From Secondhand Smoke at Homefor Children and Adolescents by Race/Ethnicity
In 1999, over a third of Californianonsmokers led lives free ofexposure to secondhand smoke.
1993 1996 1999
African American 71.2 77.3 85.0
Asian 83.3 90.7 87.8
Hispanic 83.1 91.0 92.0
Non-Hispanic White 73.2 84.4 86.6

Protection of Nonsmokers
3-13
Figure 3.10 presents the percentage of nonsmokers who reported some exposure tosecondhand tobacco smoke in places other than work or home during the past 6 months.
The most frequently identified indoor location of exposure to someone smoking wasrestaurants. However, some of this exposure may have occurred in outdoor eating areasor patios. Restaurant bars or bars/taverns were mentioned less often than restaurantsprobably because more Californians go out to eat than go to bars. The most frequentplace identified was public parks and other outdoor areas. Shopping malls,community/sports events, and game rooms/casinos/bingo hall venues were notfrequently mentioned, again likely a reflection of how people spend their time.Exposure to smoke in other peoples’ homes was more frequent, but report of exposure inother’s automobiles was relatively low.
The relatively high level of exposure to smokers in restaurants is consistent with thepercentage of nonsmoking restaurant workers who reported that someone had smoked intheir work area within the past 2 weeks. Restaurants frequently employ younger andperhaps minority workers which may partly account for the greater exposure tosecondhand smoke in these demographic groups of indoor workers.
4. Perception that Secondhand Smoke is Harmful
In contrast to restrictions on smoking in the workplace, which are mandated by law inCalifornia, a motivating factor for voluntarily restricting smoking in the home isacceptance of the idea that secondhand smoke is harmful to the health of nonsmokers.A major focus of the California Tobacco Program has been to disseminate knowledge tothe general population about the dangers of secondhand smoke. Much of the focus ofthe early California Tobacco Control Program media campaign addressed this issue.
3.8
12.5
3.25.34.1
31.7
8.2
2.1
13.2
0
5
10
15
20
25
30
35
40
Place Most Recently Exposed
% N
on
smo
kers
Source: CTS 1999Figure 3.10
Place of Exposure to Someone Smoking in Last 6 MonthsOther Than Own Home or Work in 1999
Restaurant Bar/Tavern
Park/Outdoors
ShoppingMall
CommunitySportsEvent
GamblingVenue
Others’Homes
Others’Cars
Bar/Restaurant

Protection of Nonsmokers
3-14
The increase in smokefree homes in California documented earlier in this chapter islikely a direct result of these efforts. Both the 1996 and 1999 CTS asked respondents toagree or disagree with the following two statements about secondhand smoke:
• Inhaling smoke from someone else’s cigarette causes lung cancer in nonsmokers.• Inhaling smoke from someone else’s cigarette harms the health of babies and
children.
Agreement with the statement that secondhand smoke causes cancer was high and nearlyidentical in both 1996 (82.2±0.9%) and 1999 (83.3±0.7%), as was the idea that it harmsthe health of babies and children in 1996 (93.2±0.6) and in 1999 (94.0±0.5). Thereporting of these beliefs is related to CTS respondents’ reporting of the presence ofhome smoking restrictions (Figure 3.11). As expected, those with no restrictions onsmoking in the home showed significantly lower levels of agreement with thesestatements.
0
20
40
60
80
100
%
1996 1999
Home Smoking Restrictions and AgreementThat Secondhand Smoke is Harmful
Source: CTS 1996, 1999 Figure 3.11
Causes Cancer Harms Health ofBabies and Children
NoRestrictions
SomeRestrictions
Smokefree NoRestrictions
SomeRestrictions
Smokefree
Causes Cancer Harms Health ofBabies and Children
Norestrictions
Somerestrictions
Smokefree Norestrictions
Somerestrictions
Smokefree
1996 66.4 79.2 87.6 85.1 93.0 95.6
1999 65.7 78.6 87.8 84.9 94.9 95.8

Protection of Nonsmokers
3-15
Because Figure 3.11 indicates that there is little difference between 1996 and 1999 in thelevels of acceptance that secondhand smoke harms the health of nonsmokers, Table 3.2highlights the demographic breakdown of agreement with the two statements in the 1999CTS.
Table 3.2Agreement that Secondhand SmokeHarms the Health of Nonsmokers
DemographicSubgroups
Causes Cancerin Nonsmokers
%
Harms the Health ofBabies and Children
%Overall 83.3 (±0.7) 94.0 (±0.5)Sex
Male 80.9 (±1.0) 92.8 (±0.8)Female 85.6 (±1.0) 95.2 (±0.8)
Age18-24 91.7 (±1.5) 97.5 (±1.0)25-44 87.1 (±1.1) 95.9 (±0.6)45-64 78.7 (±1.4) 92.2 (±1.0)65+ 72.1 (±2.4) 88.1 (±2.1)
Race/EthnicityAfrican American 83.7 (±3.3) 95.4 (±2.1)Asian/PI 84.9 (±2.9) 94.3 (±2.4)Hispanic 90.7 (±1.4) 95.5 (±1.1)Non-Hispanic White 79.4 (±0.9) 93.2 (±0.7)
EducationLess than 12 years 86.1 (±2.3) 92.9 (±2.0)High School Graduate 81.8 (±1.4) 93.8 (±1.1)Some College 82.7 (±1.4) 94.8 (±0.8)College Graduate 83.2 (±1.5) 94.4 (±0.9)
Household Income<$10,000 84.2 (±2.6) 92.4 (±2.6)$10,001-$20,000 82.5 (±3.0) 93.5 (±2.3)$20,001-$30,000 85.6 (±2.0) 94.0 (±1.6)$30,001-$50,000 82.4 (±1.8) 95.0 (±1.0)$50,001-$75,000 83.6 (±2.1) 95.3 (±1.0)>$75,000 83.9 (±1.6) 94.8 (±1.0)
Smoking StatusNever 90.1 (±1.1) 96.1 (±0.6)Former 78.3 (±1.9) 92.1 (±1.5)Current 68.9 (±1.5) 90.1 (±1.0)
Table entries are weighted percentages and 95% confidence limits.Source: CTS 1999

Protection of Nonsmokers
3-16
Agreement that secondhand smoke harms the health of children and babies is at veryhigh levels in all demographic groups. California women are significantly more likelythan men to agree with both statements, and younger Californians are more likely toaccept these beliefs than older Californians. Since younger people tend to pay moreattention to advertising in general, younger Californians may have been more receptiveto the mass-media anti-tobacco advertisements of the California Tobacco Program thatfocused on the health dangers of secondhand smoke or question these messages less.Hispanics showed the highest rate of agreement, significantly higher than other ethnicgroups with respect to secondhand smoke causing cancer in nonsmokers. There is littlerelationship between level of education or income and agreement with these healthconcerns. Current and former smokers were significantly less likely to agree thatsecondhand smoke causes adverse health problems than nonsmokers.
Figure 3.12 highlights the relationship between age and smoking status to the belief thatsecondhand smoke causes cancer in nonsmokers. Although smoking status issignificantly related to level of agreement in younger age groups (<45 years), agreementeven among smokers is high. However, in those 45 years of age and older, thedifferential with smoking status is large. Older current smokers were much less likelythan other groups to agree that secondhand smoke causes cancer in nonsmokers.
Agreement that Secondhand Smoke Causes Cancerin Nonsmokers by Smoking Status and Age
0102030405060708090
100
18-24 25-44 45-64 65+Age
% A
gre
e
Never Former Current
Source: CTS 1999 Figure 3.12
18-24 25-44 45-64 65+
Never 94.3 90.7 88.3 84.9
Former 88.8 86.1 77.8 67.3
Current 84.5 76.9 54.8 30.5

Protection of Nonsmokers
3-17
5. Nonsmoker Activism
A nonsmoker asking a smoker not to smoke is a form of nonsmoker activism.Nonsmokers may make this request for several reasons, including concern for thesmoker’s health, concern for their own health or the health of other nonsmokers(including children) or because of simple annoyance.
The 1990 CTS asked all nonsmokers and the 1996 CTS asked a subgroup of nonsmokersif they had asked someone not to smoke in the past 12 months. When the analysis wasrestricted to a comparable group of nonsmokers asked the question in both years, thepercentage of nonsmoker activists appeared to decline from 57.0±2.7% in 1990 to43.6±1.9% in 1996. This decline was attributed to less exposure of nonsmokers tosomeone smoking in their presence because of increased workplace and home smokingrestrictions. The question as it was asked in previous CTS was interpreted by somenonsmokers as asking a family member or friend who was a smoker to quit smoking.
Because of the problems outlined above, the 1999 CTS asked new, more precisequestions of both nonsmokers and smokers:
Nonsmokers• In the past 12 months, have you asked someone to put out a cigarette or not light up
when they were about to do so?• On the most recent occasion you asked someone not to smoke, who was that person?• On that same occasion, what was the primary reason you asked that person not to
smoke?Smokers• About how many times in the past 12 months has anyone asked you not to smoke
when you were smoking or were about to smoke?
It might be expected that nonsmokers would be more likely to become activists if theyhad reason to do so, that is, if they had been exposed to someone smoking in the recentpast. Figure 3.13 groups nonsmokers in the same manner as reported in Section 3 of thischapter. The 37.1±1.4% of nonsmokers with no recent exposure are contrasted with allothers. Among nonsmokers under 65 years of age, those exposed were indeed morelikely to be activists.
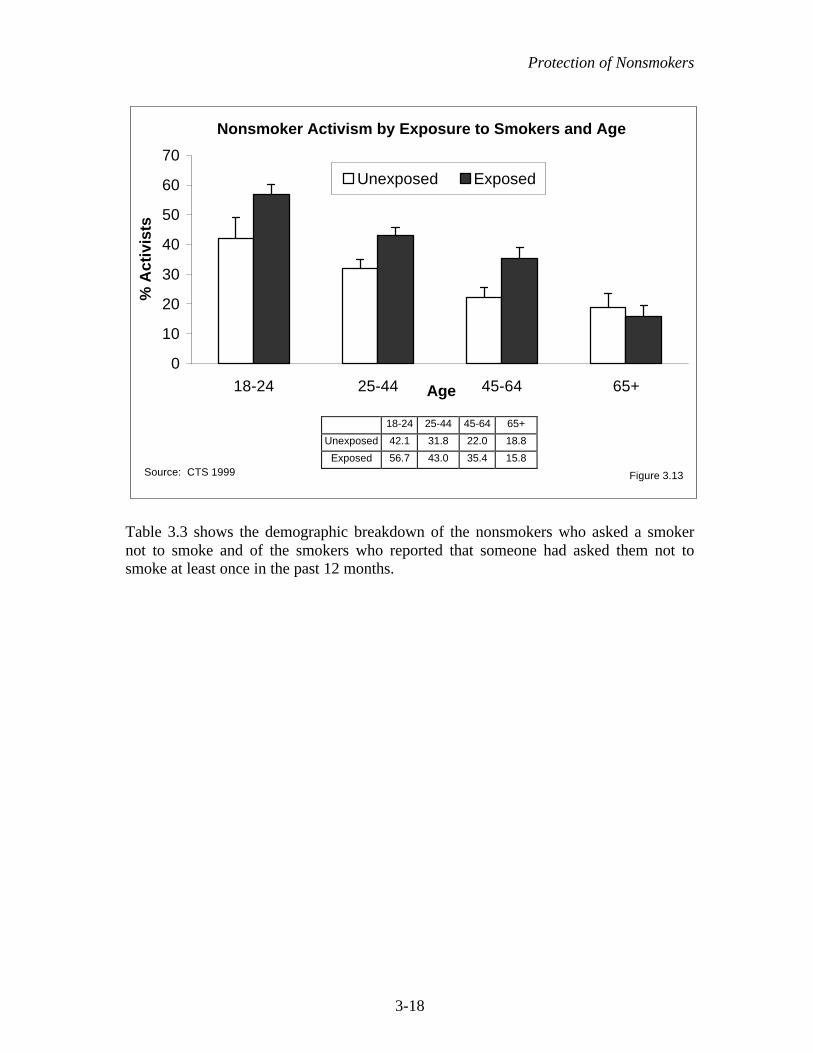
Protection of Nonsmokers
3-18
Table 3.3 shows the demographic breakdown of the nonsmokers who asked a smokernot to smoke and of the smokers who reported that someone had asked them not tosmoke at least once in the past 12 months.
Nonsmoker Activism by Exposure to Smokers and Age
0
10
20
30
40
50
60
70
18-24 25-44 45-64 65+Age
% A
ctiv
ists
Unexposed Exposed
Source: CTS 1999 Figure 3.13
18-24 25-44 45-64 65+
Unexposed 42.1 31.8 22.0 18.8
Exposed 56.7 43.0 35.4 15.8

Protection of Nonsmokers
3-19
Table 3.3Nonsmoker Activism in 1999
Nonsmokers Asking aSmoker Not to Smoke
%
Smokers AskedNot to Smoke
%Overall 35.1 (±1.3) 53.3 (±1.9)Gender Male 34.7 (±1.7) 57.9 (±2.6) Female 35.4 (±1.9) 46.9 (±2.6)Age 18-24 53.8 (±3.4) 72.0 (±4.2) 25-44 38.9 (±2.2) 54.5 (±2.3) 45-64 30.3 (±2.5) 45.5 (±3.2) 65+ 17.0 (±3.5) 31.4 (±6.0)Race/Ethnicity African American 48.4 (±6.6) 59.5 (±5.5) Asian/PI 37.5 (±6.1) 59.5 (±8.5) Hispanic 42.0 (±2.8) 63.5 (±3.8) Non-Hispanic Whites 29.4 (±1.5) 47.5 (±2.0)Education Less than High School 43.0 (±4.4) 62.8 (±5.2) High School Graduate 34.4 (±2.4) 52.9 (±2.2) Some College 38.1 (±2.1) 49.0 (±2.1) College Graduate 27.9 (±1.8) 47.2 (±4.1)Income <$10,000 45.3 (±6.5) 60.5 (±6.4) $10,001-$20,000 40.1 (±4.5) 57.4 (±4.4) $20,001-$30,000 39.7 (±4.5) 52.3 (±5.0) $30,001-$50,000 36.2 (±2.5) 52.1 (±3.6) $50,001-$75,000 31.0 (±2.6) 51.7 (±3.5) >$75,000 31.1 (±2.5) 49.8 (±3.8)Location of Residence Urban 35.2 (±1.4) 53.9 (±2.0) Rural 34.4 (±4.4) 48.7 (±6.2)
Table entries are weighted percentages and 95% confidence limitsSource: CTS 1999
Because nonsmokers outnumber smokers by at least 5 to 1, and because a nonsmokerwho becomes an activist is likely to ask repeatedly, more smokers report being asked notto smoke than there are activists. Further, both activists and smokers asked not to smoketend to be more concentrated in demographic groups with relatively higher smokingprevalence.

Protection of Nonsmokers
3-20
As emphasized in Figure 3.13, younger adults were more likely to be activists. Therewas no gender difference. Non-Hispanic Whites, however, were less likely to beactivists than minorities, even though prevalence is relatively high in this group. Veryfew college graduates were activists and activism decreased with increased householdincome, mirroring smoking prevalence patterns.
Smokers asked not to smoke were significantly more likely to be male than female, andthey were significantly more likely to be younger than older. Non-Hispanic Whiteswere significantly less likely to be asked not to smoke than minorities. Finally, thelikelihood of being asked decreased significantly with both education level andhousehold income. Some groups of smokers may not be asked as much because they aremore careful about not lighting up around nonsmokers.
Figure 3.14 shows that younger smokers were particularly likely to ask friends andacquaintances (including co-workers) not to smoke, and least likely to ask strangers.The likelihood of asking a stranger increased significantly with age. In all, 31.0±2.1%of smokers asked not to smoke were relatives, 50.3±2.4% were friends andacquaintances, and only 18.6±1.3% were strangers.
In 1999, the reason most cited by activists for why they asked someone not to smokewas annoyance (42.7±2.2%), which was cited almost twice as often as concerns with
0
10
20
30
40
50
60
70
18-24 25-44 45-64 65+Activists Age
% A
ctiv
ists
Relative Friend/Acquaintance Stranger
Source: CTS 1999 Figure 3.14
Who Nonsmoker Activists Asked Not to Smoke
Relative Friend/Acquaintance Stranger
18-24 26.5 60.7 12.8
25-44 31.9 50.6 17.5
45-64 32.2 45.3 22.6
65+ 33.9 37.1 29.0

Protection of Nonsmokers
3-21
secondhand smoke (23.1±2.0%) and the health of the smoker (20.1±2.0%). As shown inFigure 3.15, compared to men, women were significantly more likely to ask a smokernot to smoke because of their concern with the harmfulness of secondhand smoke tononsmokers.
6. Summary
This chapter showed that well over 90% of indoor workers reported smokefreeworkplace policies by 1999, an increase of over 166% since 1990. This finding is strongevidence of the effectiveness of California’s Assembly Bill (AB-13), which took partialeffect in 1995 and applied to all indoor workplaces as of January 1, 1998. Despite thishigh rate of reporting smokefree workplaces, exposure of nonsmokers to secondhandsmoke in the workplace has increased since 1996. This increase in exposure wasparticularly marked for some demographic groups, and there remain inequities in therates of exposure to secondhand smoke in the workplace, with minorities and youthexperiencing significantly more exposure than Non-Hispanic White and older workers.Restaurants appear to be settings where increased efforts at enforcement of AB-13 mightbenefit both nonsmoking indoor workers and patrons.
This chapter also showed that between 1993 and 1999 there were large and statisticallysignificant increases in the percent of Californians who lived in homes with smokingrestrictions. By 1999, about 85% of all Californians—including smokers—reportedhaving some type of smoking restriction in effect in their home, and nearly three-quarters lived in smokefree homes. Over 70% of smokers lived with some type of
0
10
20
30
40
50
60
Annoying ETS Concerns Health of Smoker Other
% A
ctiv
ists
Male
Female
Reasons Nonsmoker Activists Givefor Asking Smokers Not to Smoke
Source: CTS 1999 Figure 3.15
Annoying ETSConcerns
Healthof Smoker
Other
Annoying ETS Concerns Health of Smoker Other
Male 45.0 17.8 21.4 15.8
Female 40.7 27.8 18.9 12.4

Protection of Nonsmokers
3-22
smoking restriction in their homes, and nearly 50% of smokers lived in smokefreehomes. As a result of these significantly increased levels of protection from involuntarysmoking at home, the percentage of children exposed decreased significantly between1993 and 1999. African American children and adolescents, while less protected thanothers from involuntary smoking at home, made important gains in protection by 1999.
In 1999, 37% of California nonsmokers experienced no exposure to secondhand tobaccosmoke in their daily lives. For these people, smoking has become a nonissue. The othertwo-thirds of nonsmoking Californians were most likely to report exposure tosecondhand tobacco smoke indoors in restaurants, and exposure outdoors is stillcommon.
A high proportion of Californians of all educational levels and ethnic backgrounds agreethat secondhand smoke causes cancer and harms the health of babies and children, animportant success of the California Tobacco Program. Nonsmokers are more likely tohave these views than smokers; compliance with smoking restrictions might increase ifmore smokers could be convinced of the harm their cigarette smoke causes.
The profile of the nonsmoker activist who asks smokers not to smoke and the smokerwho is asked not to smoke reflects their social environments and likelihood of exposureto secondhand smoke. Nonsmoker activism is highest among the groups of thepopulation with the highest smoking prevalence, younger, lower educated and lowerincome groups. All nonsmokers should be encouraged to voice their objection tosecondhand smoke where ever and whenever they are exposed to it.

Protection of Nonsmokers
3-23
CHAPTER 3: KEY FINDINGS
1. In 1999, 93.4±0.8% of California indoor workers reported that smoking was notallowed in their workplace, up from 35.0±1.3% in 1990, a factor increase of 167%.
2. Nonsmoking indoor workers were less exposed to secondhand smoke in theirworkplace in 1999 (15.6±1.4%) compared to 1990 (29.0±1.8%). Even so, between1996 and 1999 there was an upturn in such reports.
3. In 1999, indoor workers in plants/factories, stores/warehouses and restaurants/barsreported more exposure to secondhand smoke than workers in classrooms,hospitals or offices. While exposure was lower in workplaces with more than 50employees, the size of smaller workplaces was not related to reported exposure.
4. More and more California homes are smokefree; in 1999, 73.2±1.1% ofCalifornia homes had a smokefree policy, compared to 50.9±0.9% in 1993, a factorincrease of 43.8%. In 1999, 47.2±1.8% of smokers lived in smokefree homes, upby a factor of 135% from 20.1±1.7% in 1993.
5. With the increase in smokefree homes, children and adolescents are increasinglyprotected from exposure to secondhand smoke in the home. In 1999, 88.6±1.1%of children and adolescents lived in smokefree homes, up from 77.0±1.4% in 1993,a factor increase of 15.1%.
6. In 1999, 37.1±1.4% of nonsmoking Californians not only lived and/or worked insmokefree environments, but also could not report an instance of exposure tosomeone smoking in the past 6 months. Among those who did report an instanceoutside the workplace or home, exposure in restaurants was the most frequentindoor setting mentioned.
7. In 1999, 94.0±0.5% of California adults agreed that secondhand smoke harms thehealth of babies and children and 83.3±0.7% agreed that it causes cancer innonsmokers. Older smokers were much less likely to agree that secondhandsmoke causes cancer in nonsmokers.
8. In 1999, 35.1±1.3% of nonsmokers reported asking a smoker not to smoke, andthis nonsmoker activism was more prevalent among demographic groups with arelatively high smoking prevalence, younger, less educated, lower income persons.Nonsmokers were most likely to ask relatives or friends and acquaintances not tosmoke, but the propensity to ask strangers increased with the age of thenonsmoker.

Protection of Nonsmokers
3-24
Table A3.1 Workplace Smoking Policy (1999 Adult CTS)Size of Workplace
<50 50+
Extent of Ban Extent of Ban
OVERALL Total Ban WorkArea Ban
Less/NoRestrictions
PopulationSize
SampleSize
TotalBan
WorkAreaBan
Less/NoRestrictions
PopulationSize
Sample Size
(%) (%) (%) (n) (n) (%) (%) (%) (n) (n)TOTAL 91.2 4.2 4.6 6,744,063 4,387 96.3 2.5 1.2 5,825,159 3,537SEXMale 88.1 5.6 6.3 3,432,487 2,162 96.6 2.2 1.2 2,967,952 1,754Female 94.3 2.9 2.8 3,311,576 2,225 96.0 2.9 1.1 2,857,207 1,783AGE18-24 90.8 6.2 3.1 1,187,710 830 95.8 3.8 0.4 640,549 43925-44 91.4 4.1 4.5 3,326,117 2,113 96.2 2.5 1.4 3,373,663 1,93745-64 91.7 3.1 5.1 2,027,855 1,325 96.5 2.3 1.2 1,719,548 1,10665+ 83.8 6.1 10.1 202,381 119 99.4 0.4 0.2 91,399 55RACE/ETHNICITYHispanic 88.9 6.4 4.7 2,041,159 1,063 95.0 3.1 1.9 1,335,294 707Non-hispanic White 92.5 2.6 5.0 3,613,552 2,757 96.8 2.2 1.0 3,141,789 2,183African-American 91.0 5.8 3.2 340,254 182 96.9 1.7 1.4 473,302 234Asian/PI 91.6 5.6 2.8 685,545 330 96.1 3.7 0.1 797,125 371Other 86.4 6.9 6.7 63,553 55 95.5 0.8 3.8 77,649 42EDUCATION<12 87.0 7.7 5.4 1,155,311 418 90.1 5.7 4.2 528,526 19812 88.3 4.7 7.0 1,718,297 1,269 94.6 3.7 1.7 1,131,767 76013-15 93.8 2.5 3.6 1,989,871 1,528 97.4 2.0 0.6 1,570,623 1,14716+ 93.5 3.5 3.0 1,880,584 1,172 97.6 1.7 0.7 2,594,243 1,432HOUSEHOLD INCOMEMissing 92.5 4.1 3.4 588,620 370 96.9 1.9 1.2 470,614 243$10,000 or less 86.7 7.7 5.5 433,432 231 89.7 10.0 0.4 176,442 107$10,001 to $20,000 88.4 6.1 5.4 737,085 441 97.0 2.4 0.7 393,558 214$20,001 to $30,000 88.4 5.9 5.7 932,650 559 95.0 2.5 2.5 554,538 310$30,001 to $50,000 90.2 5.0 4.8 1,313,963 899 93.7 4.0 2.3 1,019,673 677$50,001 to $75,000 92.3 2.6 5.1 1,247,639 849 95.7 2.9 1.3 1,183,523 752over $75,000 94.9 2.1 3.1 1,490,674 1,038 98.6 1.1 0.3 2,026,811 1,234URBAN/RURALUrban 91.1 4.3 4.6 6,143,837 3,871 96.6 2.5 0.9 5,521,845 3,286Rural 91.7 3.3 5.0 600,226 516 90.7 3.6 5.7 303,314 251
REGIONLos Angeles 88.7 5.6 5.7 1,950,635 917 96.3 2.5 1.2 1,880,100 881San Diego 95.0 2.9 2.1 560,658 262 97.7 1.1 1.3 497,189 236Orange 87.3 6.5 6.2 552,305 386 95.7 4.1 0.2 527,588 312Santa Clara 96.5 2.5 0.9 371,549 220 98.5 1.2 0.3 408,597 266San Bernadino 88.6 4.8 6.6 340,112 244 97.2 2.4 0.5 212,254 142Alameda 88.2 5.7 6.1 261,712 163 98.4 1.6 . 360,142 191Riverside 87.8 4.0 8.1 248,171 180 97.1 2.0 0.8 164,435 117Sacramento 91.3 3.4 5.3 203,036 154 96.9 1.2 1.9 219,436 155Contra Costa 96.3 2.5 1.1 160,059 133 97.6 . 2.4 187,055 131San Francisco 92.7 4.8 2.5 228,343 161 93.6 6.0 0.4 195,707 172San Mateo, Solano 96.1 1.4 2.6 248,403 160 94.4 3.4 2.2 207,634 158Marin, Napa, Sonoma 93.4 2.1 4.5 191,990 165 98.6 0.2 1.2 110,502 101Butte, Colusa, Del Norte,Glenn, etc.
92.6 3.9 3.5 240,490 182 82.3 7.0 10.7 111,652 77
San Luis Obispo, SantaBarbara, Ventura
95.7 3.5 0.8 304,362 210 99.8 0.2 . 191,376 126
Amador, Alpine,Calaveras,ElDorado,etc.
92.3 3.8 3.9 229,635 187 97.3 1.0 1.7 152,008 115
Santa Cruz 89.2 3.2 7.6 148,879 192 97.9 1.9 0.2 105,166 112Fresno, Madera,Merced, Stanislaus
91.7 2.1 6.2 259,911 202 88.5 10.6 0.9 176,754 116
Imperial, Inyo, Kern,Kings, Mono, Tulare
93.3 2.2 4.5 243,813 269 95.1 3.0 1.9 117,564 129
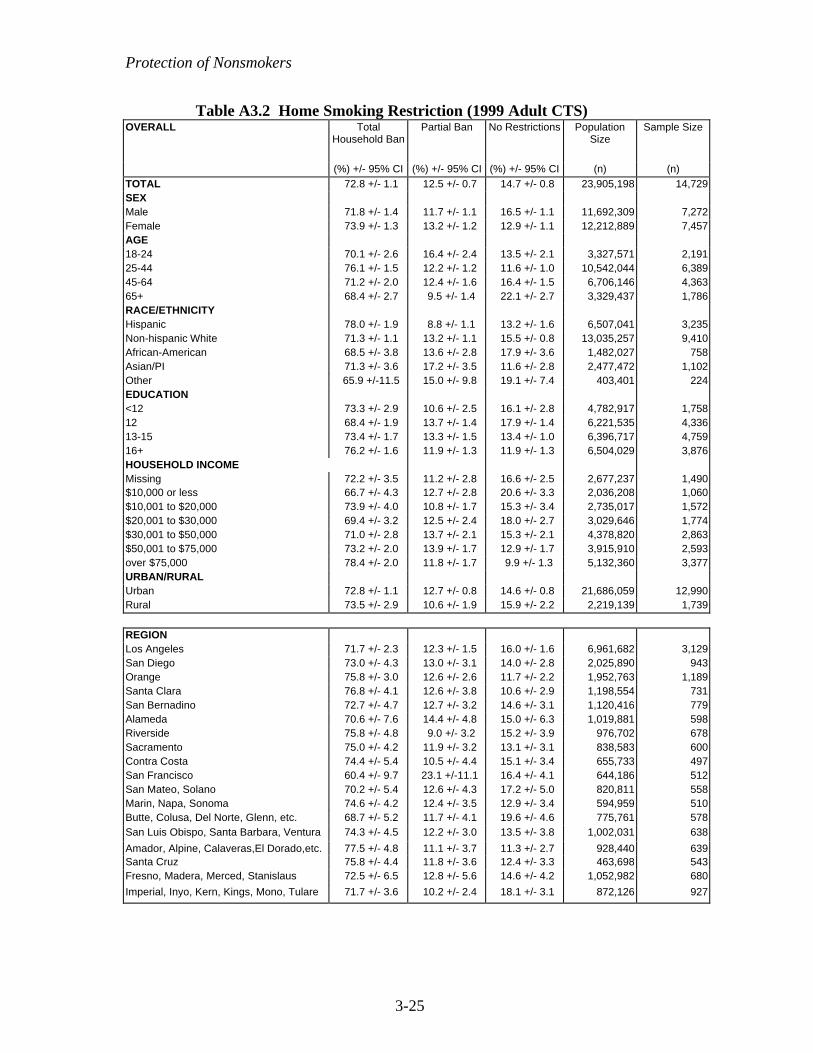
Protection of Nonsmokers
3-25
Table A3.2 Home Smoking Restriction (1999 Adult CTS)OVERALL Total
Household BanPartial Ban No Restrictions Population
SizeSample Size
(%) +/- 95% CI (%) +/- 95% CI (%) +/- 95% CI (n) (n)TOTAL 72.8 +/- 1.1 12.5 +/- 0.7 14.7 +/- 0.8 23,905,198 14,729SEXMale 71.8 +/- 1.4 11.7 +/- 1.1 16.5 +/- 1.1 11,692,309 7,272Female 73.9 +/- 1.3 13.2 +/- 1.2 12.9 +/- 1.1 12,212,889 7,457AGE18-24 70.1 +/- 2.6 16.4 +/- 2.4 13.5 +/- 2.1 3,327,571 2,19125-44 76.1 +/- 1.5 12.2 +/- 1.2 11.6 +/- 1.0 10,542,044 6,38945-64 71.2 +/- 2.0 12.4 +/- 1.6 16.4 +/- 1.5 6,706,146 4,36365+ 68.4 +/- 2.7 9.5 +/- 1.4 22.1 +/- 2.7 3,329,437 1,786RACE/ETHNICITYHispanic 78.0 +/- 1.9 8.8 +/- 1.1 13.2 +/- 1.6 6,507,041 3,235Non-hispanic White 71.3 +/- 1.1 13.2 +/- 1.1 15.5 +/- 0.8 13,035,257 9,410African-American 68.5 +/- 3.8 13.6 +/- 2.8 17.9 +/- 3.6 1,482,027 758Asian/PI 71.3 +/- 3.6 17.2 +/- 3.5 11.6 +/- 2.8 2,477,472 1,102Other 65.9 +/-11.5 15.0 +/- 9.8 19.1 +/- 7.4 403,401 224EDUCATION<12 73.3 +/- 2.9 10.6 +/- 2.5 16.1 +/- 2.8 4,782,917 1,75812 68.4 +/- 1.9 13.7 +/- 1.4 17.9 +/- 1.4 6,221,535 4,33613-15 73.4 +/- 1.7 13.3 +/- 1.5 13.4 +/- 1.0 6,396,717 4,75916+ 76.2 +/- 1.6 11.9 +/- 1.3 11.9 +/- 1.3 6,504,029 3,876HOUSEHOLD INCOMEMissing 72.2 +/- 3.5 11.2 +/- 2.8 16.6 +/- 2.5 2,677,237 1,490$10,000 or less 66.7 +/- 4.3 12.7 +/- 2.8 20.6 +/- 3.3 2,036,208 1,060$10,001 to $20,000 73.9 +/- 4.0 10.8 +/- 1.7 15.3 +/- 3.4 2,735,017 1,572$20,001 to $30,000 69.4 +/- 3.2 12.5 +/- 2.4 18.0 +/- 2.7 3,029,646 1,774$30,001 to $50,000 71.0 +/- 2.8 13.7 +/- 2.1 15.3 +/- 2.1 4,378,820 2,863$50,001 to $75,000 73.2 +/- 2.0 13.9 +/- 1.7 12.9 +/- 1.7 3,915,910 2,593over $75,000 78.4 +/- 2.0 11.8 +/- 1.7 9.9 +/- 1.3 5,132,360 3,377URBAN/RURALUrban 72.8 +/- 1.1 12.7 +/- 0.8 14.6 +/- 0.8 21,686,059 12,990Rural 73.5 +/- 2.9 10.6 +/- 1.9 15.9 +/- 2.2 2,219,139 1,739
REGIONLos Angeles 71.7 +/- 2.3 12.3 +/- 1.5 16.0 +/- 1.6 6,961,682 3,129San Diego 73.0 +/- 4.3 13.0 +/- 3.1 14.0 +/- 2.8 2,025,890 943Orange 75.8 +/- 3.0 12.6 +/- 2.6 11.7 +/- 2.2 1,952,763 1,189Santa Clara 76.8 +/- 4.1 12.6 +/- 3.8 10.6 +/- 2.9 1,198,554 731San Bernadino 72.7 +/- 4.7 12.7 +/- 3.2 14.6 +/- 3.1 1,120,416 779Alameda 70.6 +/- 7.6 14.4 +/- 4.8 15.0 +/- 6.3 1,019,881 598Riverside 75.8 +/- 4.8 9.0 +/- 3.2 15.2 +/- 3.9 976,702 678Sacramento 75.0 +/- 4.2 11.9 +/- 3.2 13.1 +/- 3.1 838,583 600Contra Costa 74.4 +/- 5.4 10.5 +/- 4.4 15.1 +/- 3.4 655,733 497San Francisco 60.4 +/- 9.7 23.1 +/-11.1 16.4 +/- 4.1 644,186 512San Mateo, Solano 70.2 +/- 5.4 12.6 +/- 4.3 17.2 +/- 5.0 820,811 558Marin, Napa, Sonoma 74.6 +/- 4.2 12.4 +/- 3.5 12.9 +/- 3.4 594,959 510Butte, Colusa, Del Norte, Glenn, etc. 68.7 +/- 5.2 11.7 +/- 4.1 19.6 +/- 4.6 775,761 578San Luis Obispo, Santa Barbara, Ventura 74.3 +/- 4.5 12.2 +/- 3.0 13.5 +/- 3.8 1,002,031 638
Amador, Alpine, Calaveras,El Dorado,etc. 77.5 +/- 4.8 11.1 +/- 3.7 11.3 +/- 2.7 928,440 639Santa Cruz 75.8 +/- 4.4 11.8 +/- 3.6 12.4 +/- 3.3 463,698 543Fresno, Madera, Merced, Stanislaus 72.5 +/- 6.5 12.8 +/- 5.6 14.6 +/- 4.2 1,052,982 680
Imperial, Inyo, Kern, Kings, Mono, Tulare 71.7 +/- 3.6 10.2 +/- 2.4 18.1 +/- 3.1 872,126 927

Protection of Nonsmokers
3-26
CHAPTER 3: GLOSSARY
Adults
Current smoker – has smoked at least 100 cigarettes in his or her lifetime and smokesnow (old question) or now either everyday or some days (new question) at the time ofthe survey.
Ever smoker – has smoked at least 100 cigarettes in lifetime.
Former smoker – has smoked at least 100 cigarettes in lifetime, but does not smoke now(old question) or now smokes not at all (new question).
Never smoker – has smoked fewer than 100 cigarettes in his or her lifetime.
Nonsmoker – a never smoker or a former smoker

Protection of Nonsmokers
3-27
CHAPTER 3: REFERENCES
California Environmental Protection Agency (CalEPA). Health Effects of Exposure toEnvironmental Tobacco Smoke. Final Report. Office of Environmental Health HazardAssessment; 1997.
Farkas AJ, Gilpin EA, Distefan JM, Pierce JP. The effects of household and workplacesmoking restrictions on quitting behaviors. Tob Control. 1999;8:261-218.
Farkas AJ, Gilpin EA, White MM, Pierce JP. Association between household andworkplace smoking restrictions and adolescent smoking. JAMA. 2000;284:717-722.
Gilpin EA, White MM, Farkas AJ, Pierce JP. Home smoking restrictions: Whichsmokers have them and how they are associated with smoking behavior. Nicotine TobRes. 1999;1:153-162.
MacDonald HR & Glantz S. Political realities of statewide smoking legislation: thepassage of California’s Assembly Bill 13. Tob Control. 1997;6(1): 41-54.
National Cancer Institute. Health Effects of Exposure to Environmental TobaccoSmoke. The Report of the California Environmental Protection Agency. Smoking andTobacco Control Monograph 10. Bethesda, MD: U. S. Department of Health andHuman Services, National Institutes of Health, National Cancer Institute, NIH Pub. No.99-4645; 1999.
Patten CA, Pierce JP, Cavin SW, Berry CC, Kaplan RW. Progress in protectingnonsmokers from environmental tobacco smoke in California workplaces. Tob Control.1995;4:139-144.
Pierce JP, Evans N, Farkas AJ, Cavin SW, Berry C, Kramer M, Kealey S, Rosbrook B,Choi W, Kaplan RM. Tobacco Use in California. An Evaluation of the Tobacco ControlProgram, 1989-1993. La Jolla, Calif: University of California, San Diego; 1994.
Tobacco Education and Research Oversight Committee. Toward a Tobacco-freeCalifornia: Strategies for the 21st Century 2000-2003; January 2000.
US Environmental Protection Agency. Respiratory Health Effects of Passive Smoking:Lung Cancer and Other Disorders. Washington, DC: Office of Research andDevelopment and Office of Air and Radiation. Publication No. EPA/600/6-90-006F;1992.

4-1
Chapter 4
ADOLESCENT AND YOUNG ADULT SMOKING

Adolescent and Young Adult Smoking
4-2
CHAPTER 4: ADOLESCENT AND YOUNG ADULT SMOKING
Introduction
For many people who smoke a first cigarette as an adolescent, a period ofexperimentation can lead to decades of addicted smoking (Pierce & Gilpin, 1996), so thatsuccessful, long-term cessation is difficult to achieve (USDHS, 1988). For these reasons,prevention of adolescent experimentation with tobacco is one of the major goals of theCalifornia Tobacco Control Program (TEOC, 1991).
The process of smoking uptake can take many years. For most, it begins in childhoodand does not end until early adulthood. Almost all children are adamant that they willnever become smokers. In the preadolescent years, individuals begin the process ofbecoming smokers by first changing their attitudes toward smoking. As theircommitment to never smoke weakens, some will eventually make the transition fromnever smoker to experimenter by puffing or smoking their first cigarette. Of those whomake this transition, some never smoke another cigarette.
After of a period of experimentation that may last for several years, about half ofexperimenters will make the transition to established smoking (Choi et al., 1997).Someone is considered an established smoker if they report smoking at least 100cigarettes in their lifetime. Even then the uptake process is not complete; many of theexperimenters who become established smokers are still very light smokers and may noteven smoke every day. During early adulthood many of these established smokers willmake the transition from occasional or non-daily to daily smoking, and some willeventually transition from light daily smoking to heavy daily smoking. Some establishedsmokers never make the transition from occasional to daily smoking. Also, some dailysmokers never become really heavy smokers.
This chapter focuses on several of the key transitions in the smoking uptake processdescribed above. Each of these transitions may present important opportunities forintervention. Section 1 defines levels of adolescent smoking experience and presentstrends in adolescent smoking behavior in recent years. Section 2 describes trends insome important correlates of adolescent smoking initiation. Section 3 focuses on the latersteps of the smoking uptake process in adolescents and young adults, addressing the issueof increased smoking among young adults. Section 4 summarizes the results of thechapter.
1. Trends in Adolescent Smoking Behavior
Defining Levels of Experience with Smoking
In this report, various questions from the California Tobacco Surveys (CTS) of 1993,1996 and 1999 are used to classify California adolescents into 7 groups based on theirexperience with smoking and their risk of future smoking (Choi et al., 2001). For acomplete list of the survey questions used to make these distinctions, see the Appendix at

Adolescent and Young Adult Smoking
4-3
the end of this chapter. Table 4.1 summarizes this categorization of adolescent smokingexperience.
Table 4.1Levels of Adolescent Smoking Experience
Category DefinitionCommitted Never Smoker Has never smoked a cigarette, even a few puffs, and
expresses a strong commitment not to smokeSusceptible Never Smoker Has never smoked a cigarette, even a few puffs, but lacks
a strong commitment not to smokePuffer Has puffed on a cigarette, but denies having smoked a
whole cigaretteNon-Current Experimenter Reports smoking fewer than 100 cigarettes in lifetime,
but has not smoked during the last 30 daysCurrent Experimenter Reports smoking fewer than 100 cigarettes in lifetime,
and has smoked during the last 30 daysNon-Current EstablishedSmoker
Reports smoking at least 100 cigarettes in lifetime, buthas not smoked during the last 30 days
Current EstablishedSmoker
Reports smoking at least 100 cigarettes in lifetime, andhas smoked during the last 30 days
Figure 4.1 shows the distribution of 12-17 year old California adolescents according tothese categories in 1993, 1996 and 1999. The trends for some of these groups aredescribed in detail in the following sections.
0
10
20
30
40
50
60
Level of Experience
%
1993 1996 1999
Source:CTS 1993,1996,1999 Figure 4.1
Experience With Smoking Among 12-17 Year Old Adolescents
CommittedNever
Smokers
SusceptibleNever
Smokers
Puffers Non-CurrentExperimenters
CurrentExperimenter
s
Non-CurrentEstablished
Smokers
CurrentEstablished
Smokers
CommittedNever
Smokers
SusceptibleNever
SmokersPuffers
Non-CurrentExperimenters
CurrentExperimenters
Non-Current
EstablishedSmokers
CurrentEstablished
Smokers
1993 48.6 16.5 10.9 13.9 4.9 0.9 4.3
1996 44.0 21.8 9.0 12.1 6.2 1.1 5.8
1999 52.3 20.5 8.1 10.4 4.3 0.9 3.4

Adolescent and Young Adult Smoking
4-4
Never Smokers
Keeping as many adolescents as possible never smokers is a primary aim of tobaccocontrol efforts, and having a large percentage remain committed never smokers is ameasure of the success of these efforts. In 1993, 48.6±1.9% of adolescents 12-17 yearsof age were classified as committed never smokers (Figure 4.1). Between 1993 and 1996the percent of adolescents who were committed never smokers showed a significant 9.5%factor decline to 44.0±1.4%. Since 1996, this percentage showed a significant 18.9%factor increase to 52.3±1.4%. A significantly higher percent of adolescents werecommitted never smokers in 1999 (by a factor of 7.6%) than in 1993.
Figure 4.2 shows the percentages of committed never smokers by age group. In 1999,65.7±1.9% of the 12-13 year olds but only 41.3±2.6% of the 16-17 year olds werecommitted never smokers. These percentages indicate that in all age groups, there isconsiderable room for increasing the percentage of committed never smokers.
The decline in committed never smokers from abouttwo-thirds of the 12-13 year olds to about 40% of the16-17 year olds suggests that during the next 3 to 5years around 40% of the younger group will progresstoward smoking. Thus, prevention efforts should start
In 1999, 52.3±±1.4% ofadolescents 12-17 years ofage were committed neversmokers, an increase by afactor of 18.9% since 1996.
01020304050607080
12 to 13 14 to 15 16 to 17
Age Group
%
1993 1996 1999
Source: CTS 1993,1996,1999Figure 4.2
12-17 Year Old Committed Never Smokers
Age Group (years)
12-13 14-15 16-17
1993 62.2 43.9 38.0
1996 55.8 40.9 35.5
1999 65.7 49.0 41.3

Adolescent and Young Adult Smoking
4-5
well before adolescence. The fact that more older teens were committed never smokersin 1999 than in earlier years suggests that a higher percentage of committed neversmokers should make it to adulthood without becoming smokers.
Table 4.2 shows that from 1993 to 1996 both boys and girls showed decreases in thepercentages that were committed never smokers, but the decrease was significant only forgirls. Then between 1996 and 1999 the percentages for both sexes increasedsignificantly.
Table 4.2Committed Never Smokers in Demographic Subgroups of
Adolescents 12-17 Years of Age
1993%
1996%
1999%
FactorDecrease
1993-1996
%
FactorIncrease
1996-1999
%Overall 48.6 (±1.9) 44.0 (±1.4) 52.3 (±1.4) -9.5 18.9Gender Boys 45.1 (±2.8) 42.5 (±2.1) 50.2 (±2.0) -5.8 18.1 Girls 52.0 (±2.6) 45.7 (±2.0) 54.4 (±2.3) -12.1 19.0Race/Ethnicity African American 59.4 (±6.1) 50.3 (±4.8) 61.8 (±4.6) -15.3 22.9 Asian/PI 60.0 (±6.7) 48.2 (±4.7) 55.4 (±5.3) -19.7 14.9 Hispanic 44.4 (±4.2) 39.4 (±2.7) 48.4 (±2.6) -11.3 22.8 Non-Hispanic White 48.1 (±2.2) 45.5 (±1.9) 53.1 (±1.9) -5.4 16.7School Performance Much Above Average 63.7 (±4.6) 58.5 (±3.1) 63.9 (±3.0) -8.2 9.2 Above Average 52.4 (±3.7) 45.6 (±2.1) 56.2 (±2.6) -13.0 23.2 Average or Below 39.4 (±2.8) 34.4 (±1.9) 43.1(±2.2) -12.7 25.3
Table entries are weighted percentages and 95% confidence limits.Source: CTS 1993,1996,1999
This same general pattern was present in all race/ethnicity groups. From 1996 to 1999 allrace/ethnic groups except Asians showed a significant increase in the percentage ofcommitted never smokers. And in all groups except Asians, the rate was higher in 1999than it was in 1993, but was significantly higher only for Non-Hispanic Whites. Thepercentage of committed never smokers among teens who rated their own schoolperformance as much better than average returned to its 1993 level in 1999, while thepercentages observed for the remaining teens in 1999 significantly exceeded their 1993levels.
Experimenters
Experimenters have smoked at least one cigarette, but not yet reached at least 100 in theirlifetime. Since 1993 there has been a steady decrease in the rates of non-current

Adolescent and Young Adult Smoking
4-6
experimentation among California adolescents (Figure 4.1). While in 1993, 13.9±1.6%of California adolescents were non-current experimenters, in 1999 only 10.4±0.9% fellinto this category, a reduction by a factor of 25.2%. The status of current experimenter isprobably fairly unstable. Some will shortly progress to established smoking, others maycontinue to experiment only very intermittently, and some will decide not to continueexperimenting at all. Only a relatively small fraction of California adolescents arecurrently experimenting with cigarettes (Figure 4.1).
Non-Current Experimenters
Since smoking is very intermittent during the early phases of experimentation (Chassin etal., 1985), it is likely that some of the non-current experimenters will experiment again,while others will not. This raises the question of who is at risk to experiment again, andhow long it needs to be since they last experimented before the risk of future smoking islow.
All ever smokers (see Appendix or Glossary) were asked whether they would smoke acigarette in the next year. Experimenters who answered definitely not were considered tobe at low risk for further experimentation. Also, the CTS asks all non-current smokers,including experimenters but not puffers:
How long ago did you smoke your last cigarette?
Using the answers to this question for the 1999CTS, non-current experimenters were dividedinto groups according to the time since their lastcigarette. As expected, Figure 4.3 shows that thelonger non-current experimenters have avoided
Not until non-current experimentershad been abstinent for a year wasthe majority at low risk for futuresmoking.
25.332.2
38.2
57.465.8
76.2
0
10
20
30
40
50
60
70
80
90
1-<3 Months 3-<6 Months 6-<12 Months 1-<2 Years 2-<3 Years 3+ Years
Time Since Last Cigarette
%
Source: CTS 1999 Figure 4.3
Non-Current Experimenters at Risk of Future SmokingAmong 12-17 Year Olds

Adolescent and Young Adult Smoking
4-7
smoking a cigarette, the lower is their risk of future smoking. However, it took at least ayear of cigarette avoidance before a majority (61.8±8.7%) of non-current experimentersruled out future smoking.
Table 4.3 shows the percentage of ever experimenters who have been abstinent threemonths or longer when surveyed in 1993, 1996 and 1999. The three month cut-offencompassed just under half of all experimenters.
Table 4.3Non-Current Adolescent Experimenters (Last Cigarette >3 Months Ago) Among
Demographic Groups of Adolescents Ever Experimenters 12-17 Years of Age1993%
1996%
1999%
Overall 47.4 (±4.7) 41.4 (±3.0) 47.8 (±3.0)Sex Male 46.7 (±5.6) 39.5 (±4.1) 47.9 (±4.9) Female 48.1 (±6.0) 43.6 (±5.2) 47.8 (±5.0)Age 12-13 34.4 (±9.8) 37.2 (±8.6) 46.3 (±11.2) 14-15 43.1 (±6.0) 42.2 (±5.0) 54.0 (±5.8) 16-17 55.1 (±6.6) 41.7 (±4.8) 43.8 (±4.9)Race/ethnicity African American 50.3 (±20.9) 44.8 (±12.6) 41.7 (±13.7) Asian/PI 46.2 (±17.1) 48.1 (±13.3) 44.9 (±14.4) Hispanic 41.0 (±8.9) 36.6 (±5.9) 45.7 (±5.5) Non-Hispanic White 50.8 (±5.0) 42.3 (±3.8) 50.9 (±5.0)School Performance Much better than average 54.8 (±13.9) 47.7 (±8.0) 51.8 (±12.2) Better than average 54.4 (±6.8) 43.1 (±5.4) 49.0 (±5.8) Average or below 41.5 (±5.6) 38.1 (±4.6) 45.8 (±5.3)
Table entries are weighted percentages and 95% confidence limits.Source: CTS 1993,1996,1999
Because of the small sample sizes, only a few of the differences shown in Table 4.3 areinterpretable. Overall, in 1996 when adolescent smoking prevalence was high, thepercent of experimenters who had not smoked in at least 3 months was lower than in1993 or 1999. In 1993, a much higher percentage of 16-17 year old experimenters wereformer experimenters than 12-13 year olds, but in 1999 these percentages were about thesame. The 16-17 year olds showed the biggest decrease between 1993 and 1996(significant), and the percentage of non-current experimenters in this age group had notrebounded much by 1999. This result may indicate that by 1999 experimentation wasdelayed for older adolescents, and not as many have decided to stop experimenting yet.
Non-Hispanic Whites showed a significant decrease between 1993 and 1996, but theyrebounded by 1999. While Hispanics also showed this pattern, the changes were notsignificant, and the other minorities may not have rebounded at all. The percent of non-

Adolescent and Young Adult Smoking
4-8
current experimenters among those reporting average or below school performance iscloser to the other groups in 1999 than in the previous years.
Other than the few differences noted above, no demographic group showed anexceptionally high rate of being non-current experimenters. However, besidesdemographics, there are likely psycho-social or environmental predictors of smokinguptake that may be inversely associated with likelihood of cessation of experimentation.
Established Smokers
Adolescents who report smoking at least 100 cigarettes in their lifetime are consideredestablished smokers, and most who report reaching this level were current smokers whensurveyed (Figure 4.1). This finding underscores the addictive nature of nicotine; onceadolescents have smoked a considerable amount they are unlikely to quit.
Because very few adolescents under 15 years of agehave progressed to established smoking (0.7±0.3% in1999), Table 4.4 shows the percentage of establishedsmokers (current and non-current) in demographicgroups of 15-17 year olds. Between 1993 and 1996,
the percent of established smokers in this age group grew from 9.9±1.5% to 12.1±1.4%, afactor increase of 22.2%. Then, between 1996 and 1999, the rate of established smokingfell to 8.0±1.1%, a factor decrease of 33.9%.
Table 4.4Established Smoking Among Demographic Subgroups of
Adolescents 15-17 Years of Age
1993%
1996%
1999%
FactorIncrease
1993-1996%
FactorDecrease
1996-1999%
Overall 9.9 (±1.5) 12.1 (±1.4) 8.0 (±1.1) 22.2 -33.9Gender Boys 10.5 (±2.2) 12.5 (±2.0) 8.5 (±1.3) 19.0 -32.0 Girls 9.2 (±2.0) 11.7 (±1.8) 7.5 (±1.4) 27.2 -35.9Race/Ethnicity African American 2.5 (±2.7) 5.7 (±3.5) 4.0 (±3.0) 128.0 -29.8 Asian/PI 6.9 (±7.6) 8.3 (±3.4) 5.4 (±3.0) 20.3 -34.9 Hispanic 6.1 (±1.8) 8.1 (±2.0) 6.0 (±1.3) 32.8 -25.9 Non-Hispanic White 13.7 (±2.0) 16.2 (±1.9) 11.1 (±1.8) 18.2 -31.5School Performance Much Above Average 5.2 (±2.6) 5.6 (±1.9) 4.2 (±1.8) 7.7 -25.0 Above Average 9.0 (±2.4) 10.2 (±2.2) 6.8 (±1.8) 13.3 -33.3 Average or Below 12.2 (±2.2) 17.4 (±2.1) 11.1 (±1.7) 42.6 -36.2
Table entries are weighted percentages and 95% confidence limits.Source: CTS 1993,1996,1999
In 1999, only 8.0±±1.1% ofadolescents 15-17 years ofage were establishedsmokers, a decrease by afactor of 33.9% since 1996.

Adolescent and Young Adult Smoking
4-9
The trends in established smoking for boys and girls were about the same. While AfricanAmericans appeared to show the largest increase between 1993 and 1996, it was notstatistically significant, and established smoking appears to be down in all race/ethnicgroups in 1999, although only the decrease in Non-Hispanic Whites was significant. Thedecline among adolescents with average or below average school performance was alsosignificant.
Figure 4.4 shows the percent of adolescents of each age who had progressed toestablished smoking in 1993, 1996 and 1999. It shows that the overall pattern of anincrease between 1993 and 1996 and decrease from 1996 to 1999 was present in all threeages. Because of the significant decline from 1996 to 1999, both 15 and 17 year oldsexperienced a significant net decrease in established smoking in 1999 as compared to1993.
Unless something happens to spur adolescent smoking in the future, the low rates ofestablished smoking among 15-17 year old adolescents should herald a decline in adultsmoking prevalence in the future.
Adolescent Quitting
A number of studies have indicated that adolescent smokers think about quitting andintentionally try to quit (Ershler et al., 1989; Zhu et al., 1999). In 1999, Californiaadolescent current smokers (n=509) were no exception.
0
5
10
15
20
25
15 16 17Age (years)
%
1993 1996 1999
Source: CTS 1993,1996,1999 Figure 4.4
15-17 Year Olds Who Have Become Established Smokers
Age (years)
15 16 17
1993 5.8 10.2 13.8
1996 7.0 12.8 17.3
1999 3.8 9.9 10.7

Adolescent and Young Adult Smoking
4-10
The 1999 CTS asked all current adolescent smokers:
• Have you ever seriously thought about quitting smoking?• When was your most recent quit attempt?• When you tried to quit, did you use… a nicotine patch or nicotine gum, an
antidepressant like Zyban, a smoking cessation program, self-help materials?
If an adolescent answered the second question by giving a date or an approximate date,rather than saying that they never tried to quit, they were credited with a quit attempt.Only those so credited were asked the third question and they could answer yes or no toeach type of cessation assistance mentioned.
Table 4.5 shows the responses current smokers gave to these questions about quittingaccording to whether the current smoker was an experimenter or an established smoker.
Table 4.5Quitting Behavior Among Current Adolescent Smokers
Experimenters%
Established Smokers%
Thought about quitting 56.5 (±8.0) 84.2 (±6.4)Attempted to quit 57.5 (±7.9) 79.8 (±7.2)Quitters using assistance Self-help materials 6.0 (±2.8) 13.0 (±5.7) Counseling program 0.3 (±0.5) 2.2 (±2.1) Nicotine replacement none 4.2 (±3.1) Antidepressant none 0.9 (±1.2)
Table entries are weighted percentages and 95% confidence limits.Source: CTS 1999
The previous sections of this chapter showed that fewadolescents under 15 years of age are established smokers, andmany of the current experimenters are under 15 years of age.Thus, it would be expected that a higher percentage of currentestablished smokers had seriously thought about quittingsometime in the past compared to current experimenters, whoare younger and have not been smoking as long. However,
over half of current experimenters had considered the wisdom of continuing toexperiment. About the same fraction had actually made a quit attempt. Similarly, nearlyas many of the established smokers who had thought about quitting had also made a quitattempt.
Some quitters had even used a form of cessation assistance. Twice as many establishedsmokers used self-help materials as did experimenters. While none of the experimentersused a medical aid, about 4% of established smokers used nicotine replacement andnearly 1% used an antidepressant. Although the percentage using nicotine replacementmight seem low, only about 14% of adult current or recent former smokers used nicotine
Nearly 80% ofadolescent currentestablished smokersin 1999 reportedtrying to quitsometime in the past.

Adolescent and Young Adult Smoking
4-11
replacement for their most recent quit attempt (see Chapter 6), and the rate of use amongadult smokers who smoked less than a pack of cigarettes a day was only 9.3±1.5%.Taken together, and considering that typical adolescent cigarette consumption is wellunder a pack a day, these findings indicate that adolescent smokers may be using nicotinereplacement as much as comparable adult smokers are.
2. Trends in Correlates of Adolescent Smoking
Research indicates that peer attitudes or perceived peer attitudes about smoking arerelated to adolescent smoking uptake. Adolescents who report that their peers expressstrong anti-smoking views are less likely to smoke (Collins et al., 1987; Hahn et al.,1990). On the other hand, adolescents with more positive views of smoking, who seecigarettes as having some social or personal benefit and view it as a harmless activity, aremore likely to smoke (Bauman et al., 1984; Swan et al., 1990). Further, adolescents whohave favorable reactions to cigarette advertising and promotions are also more likely tosmoke (Evans et al., 1995; Gilpin et al., 1997; Pierce et al., 1998). While these factorsmay influence individuals to smoke, they may also be the result of adolescent smoking,so that changes in these perceptions follow changes in adolescent smoking rather thanvise versa.
Table 4.6 shows the changes in several important correlates of smoking between 1993and 1999. Details on the survey items and scales used to measure these constructs areincluded in the Appendix to this chapter.
Table 4.6Changes in Correlates of Adolescent Smoking Prevalence
Correlate 1993%
1996%
1999%
FactorChange1993-1996%
FactorChange1996-1999%
Peer NormsPeople your age care about staying off cigarettes
51.3 (±1.7) 41.0 (±1.2) 54.5 (±1.3) -20.1 32.9
Best friends disapprove of your smoking on a daily basis
72.4 (±1.7) 64.3 (±1.3) 71.7 (±1.1) -11.2 11.5
Attitudes toward smokingAgree smoking cigarettes has some benefit
65.2 (±1.9) 64.3 (±1.3) 58.3 (±1.6) -1.4 -9.3
Agree that it is safe to smoke cigarettes
45.1 (±1.5) 47.9 (±1.6) 41.1 (±1.5) 6.2 -14.2
Reactions to Advertising and PromotionHave a favorite cigarette advertisement
65.4 (±2.0) 64.5 (±1.2) 56.4 (±1.3) -1.4 -12.6
Willing to use a promotional item from a tobacco company
25.0 (±1.7) 24.8 (±1.2) 15.7 (±1.1) -0.8 -36.7
Have a promotional item from a tobacco company
8.9 (±0.9) 13.7 (±1.1) 8.9 (±0.9) 53.9 -35.0
Table entries are weighted percentages and 95% confidence limits.Source: CTS 1993,1996,1999

Adolescent and Young Adult Smoking
4-12
In 1993, smoking prevalence for 12-17 year-old California adolescents was 9.2±1.1%.This rate increased to 12.0±1.1% in 1996 and then declined to 7.7±0.8% in 1999 (seeAppendix to Chapter 2). The correlates listed in Table 4.6 tended to track these changesin prevalence. They took a turn in the direction of promoting smoking when prevalencewas higher in 1996 but returned to more benign levels by 1999 when prevalence fell.
As prevalence increased between 1993 and 1996, adolescents reported a drop by a factorof 20.1% in the number of people their age who cared about staying off cigarettes. Theyalso showed a factor drop of 11.2% in the percentage of their best friends who woulddisapprove of their smoking on a daily basis. As prevalence decreased between 1996 and1999, adolescents reported an increase by a factor of 32.9% in the number of people theirage who cared about staying off cigarettes. They also report a rise by a factor of 11.5% inthe percentage of their best friends who would disapprove of their smoking on a dailybasis.
The percentage of adolescents who reported that it was safe to smoke cigarettes increasedby a factor of 6.2% between 1993 and 1996 as prevalence increased. But during the sameperiod, the percentage of adolescents who saw some benefit to smoking stayed about thesame. As prevalence decreased between 1996 and 1999, the percentage of adolescentswho saw some benefit to smoking dropped by a factor of 9.3% and the percentage whosaw cigarette smoking as safe dropped by a factor of 14.2%. The rates for these attitudeswere significantly lower in 1999 than in 1993.
The percentage of adolescents who reported that they possessed a tobacco industrypromotional item increased by a factor of 53.9% between 1993 and 1996, but thepercentage of adolescents who had a favorite cigarette advertisement or who were willingto use a tobacco industry promotional item stayed about the same. When prevalence fellbetween 1996 and 1999, the percentage of adolescents who possessed a tobacco industrypromotional item or who would be willing to use one dropped by a factor of about 35%.During the same time, the percent of adolescents with a favorite cigarette advertisementalso dropped by a factor of 12.6%. Except for possession of a promotional item, therates in 1999 were significantly lower than in 1993.
Whether or not the level of these correlates are predictive of future smoking in theindividual or are the result of higher or lower levels of adolescent smoking cannot bedetermined from the present data.
3. Has the Smoking Uptake Window Widened to Include Young Adults?
In recent years, the tobacco industry has intensified its promotional efforts aimed atyoung adults. It has sponsored concerts and special events including Kamel-Club nightsat bars and clubs. These events usually feature cigarette giveaways. Whether theseindustry promotional activities have widened the window for smoking uptake by enticingyoung adult nonsmokers to take up smoking is unknown. Chapter 2 showed that smokingprevalence appears to have increased in recent years among young adults 18-24 years of

Adolescent and Young Adult Smoking
4-13
age, but data presented in that chapter suggested that a substantial fraction of this grouphad become regular smokers before they reached young adulthood.
The 1992 and 1999 CTS asked adult never smokers 2 of the 3 questions (questions 5 and7, see Appendix to this chapter) that were used in the adolescent survey to distinguishcommitted from susceptible never smokers. For consistency, only the 2 questionsanswered by both adolescents and young adults were used in this section to identifyindividuals at risk of smoking initiation in the near future.
In addition, young adult established smokers from the 1992 and 1999 CTS werecategorized as daily smokers with the following questions:
• 1992: On how many of the past 30 days did you smoke cigarettes?• 1999: Do you smoke cigarettes every day, some days or not at all?
Current adult smokers in the 1992 CTS were considered daily smokers if they answeredeveryday or 30 days, and respondents to the 1999 CTS who answered everyday to thesecond question were classified as current daily smokers.
Current adolescent daily smokers from both the 1992 and 1999 CTS were identified fromtheir responses to the question used to determine current smoking status.
Think about the last 30 days. On how many of these days did you smoke?
Those who answered “all of them” were classified as current daily smokers.
The first column of Table 4.7 shows the percentage of never smokers who are at risk tosmoke. The second column indicates the percent of ever smokers (at least a wholecigarette) who transitioned to established smokers (report smoking at least 100 cigarettesin lifetime), and the third column shows the percentage of ever smokers who are currentdaily smokers by age group for both surveys.
Table 4.7Transitions in the Smoking Uptake Process Among
Adolescents and Adults in 1992 and 1999Never Smokers at
Risk to SmokeEver Smokers WhoBecame Established
Smokers
Current Daily SmokersAmong Ever Smokers
AgeGroup
1992%
1999%
1992%
1999%
1992%
1999%
12-14 22.6 (±3.3) 23.6 (±2.1) 5.2 (±3.4) 4.7 (±2.1)15-17 18.5 (±4.1) 21.7 (±2.2) 16.3 (±4.8) 20.1 (±2.6) 48.8 (±14.8) 34.3 (±6.7)18-20 9.2 (±8.2) 7.5 (±3.2) 49.0 (±8.9) 44.3 (±5.9) 48.4 (±11.1) 44.6 (±7.0)21-25 2.2 (±2.7) 3.9 (±2.4) 53.3 (±7.6) 54.8 (±4.0) 48.1 (±14.6) 45.2 (±4.1)26-30 3.8 (±3.9) 4.4 (±3.0) 57.7 (±6.0) 52.4 (±3.5) 47.8 (±6.7) 38.0 (±3.9)31-35 5.6 (±6.7) 3.5 (±2.7) 60.2 (±5.4) 52.9 (±4.3) 47.0 (±8.1) 37.8 (±4.4)
Table entries are weighted percentages and 95% confidence limits.Source: CTS 1992,1999

Adolescent and Young Adult Smoking
4-14
In 1992, there was a large drop in the percentage of never smokers who were at riskbetween 18-20 and 21-25 years of age, but in 1999 the drop appeared to occur earlier,between 15-17 and 18-20 years of age. At 21-25 years of age or beyond, neither surveyshowed any change, and the rates from each were very similar. The remaining risk isprobably because of a few individuals who are unwilling to definitely rule out anything.
The conversion of ever smokers to established smokers appears to occur in the late teens(15-17 and 18-20 year age groups), and to a lesser extent into the twenties. In 1992, thisprocess tended to go on longer than in 1999. In 1999, there was no further accrual afterage 21-25 years. Thus, conversion rates for 31-35 year olds were significantly differentbetween surveys. Data for 12-14 year olds were unstable due to small sample sizes andare not presented.
Finally, the conversion of ever smokers to current daily smokers also appeared to occurslightly later in 1999 than in 1992, but the confidence intervals make this unclear. Thelower levels of current daily smoking among ever smokers in 1999 suggest that more ofthem are still occasional smokers.
In sum, young adults in 1999 do not appear to be at higher risk, or to be converting toestablished smoking at higher levels than seen in comparable age groups earlier in thedecade. They may, however, be delaying becoming daily smokers. This delay may ormay not represent an extension of the smoking uptake window. Nevertheless, it is notwhat would be expected from the tobacco industry targeting of young adults. If thetargeting were successful, there would be a more sustained increase in conversion ratesthat ends at higher rates of conversion in 1999 than earlier in the decade.
Occasional Smokers Who Have and Have Not Smoked Daily in the Past
The possible delay in conversion to daily smoking among young adults in 1999 notedabove warrants further investigation.
The 1999 CTS asked all current occasional smokers questions to determine if they hadever been daily smokers:
• Adults: Have you ever smoked daily for a period of 6 months or more?• Adolescents: Have you ever smoked a cigarette every day for at least a month?
If respondents answered yes to the appropriate question, they were considered to be ever-daily occasional smokers, and if they responded no they were considered to be never-daily occasional smokers.
Figure 4.5 depicts current smoking status among the same age groups as in Table 4.7.The top curve in the figure indicates the overall current smoking prevalence (in last 30days for both adults and adolescents), the middle curve the prevalence of occasionalsmoking, and the bottom curve the prevalence of daily smoking. Thus, the distancebetween the top two curves represents the fraction of occasional smokers who have never

Adolescent and Young Adult Smoking
4-15
smoked daily, and the area between the bottom two curves the fraction of occasionalsmokers who were former daily smokers.
Among 12-14 year old current smokers, the distance between the top two curves indicatesthat nearly 80% were never-daily occasional smokers. This percentage drops to less than60% among the 15-17 year olds and to less than 45% among the 18-20 year olds. Thefraction of never-daily occasional smokers peaked at 11.6±2.7% among the 18-20 yearolds and then declined steadily to 3.5±0.8% among the 31-35 year olds.
The fractions of daily smokers (below the bottom curve) and ever-daily occasionalsmokers (between bottom two curves) peaked at 15.0±1.0% and 4.9±1.0%, respectively,for 21-25 year olds. Between 18-20 and 21-25 years of age, the percentage of never-daily occasional smokers declined by a factor of nearly 45%, from 11.6±2.7% to6.5±1.8% for a percentage point difference of 5.1. Between 18-20 and 21-25 years ofage, the percentage of daily smokers increased from 12.2±0.9% to 15.0±1.0%, adifference of 2.8 percentage points, and the rates for ever-daily occasional smoking
0
5
10
15
20
25
30
Age Group (years)
%
Daily Ever-Daily Occasional Never Daily Occasional
Source: CTS 1999Figure 4.5
Daily and Occasional Smoking in Adolescents and Young Adults
12-14 15-17 18-20 21-25 26-30 31-35
Age Group (years)
12-14 15-17 18-20 21-25 26-30 31-35
Daily 0.3 2.8 12.2 15.0 12.5 12.9
Ever-DailyOccasional
0.3 2.8 2.9 4.9 4.6 3.2
Never-DailyOccasional
2.2 7.3 11.6 6.5 6.0 3.5

Adolescent and Young Adult Smoking
4-16
increased from 2.9±0.9% to 4.9±1.0%, a difference of 2.0 percentage points. Thecombined increases in daily and ever-daily current occasional smoking of 4.8 percentagepoints observed between these age groups is very close to the 5.1 percentage pointdecrease in never-daily occasional smoking observed during the same period of time.
These results suggest that about half of the never-daily occasional smokers 18-20 years of age willprogress to daily smoking in the next 5 years. Theseresults also show that nearly 25% of the 21-35 yearolds who have ever smoked on a daily basis were
currently occasional smokers. Why such a significant fraction of these young adultsmokers switched from daily to occasional smoking is unknown. There may be moreyoung adult smokers in recent years who believe that if they confine their smoking to afew social occasions they will not harm their health and will avoid addiction. The switchfrom daily to occasional smoking, assuming that it was not present to the same extent inearlier years, may be responsible for the somewhat lower rates of current daily smokingamong current established smokers seen in Table 4.7.
Cigarette Consumption in Daily and Occasional Established Smokers
The final stages of the smoking uptake process encompass the transitions amongestablished smokers that relate to increases in cigarette consumption. As occasionalsmokers become daily smokers their consumption will increase. Occasional smokerswho have never smoked daily may have a different level of consumption than those whohave smoked daily in the past.
The 1999 CTS asked all current occasional smokers the following question:
• Adults: During the past 30 days, on the days that you did smoke, about how manycigarettes did you usually smoke per day?
• Adolescents: On the days that you did smoke, what was the average number ofcigarettes that you smoked?
Using this information, the mean daily cigarette consumption was computed as theproduct of the number of days smoked per month and the number of cigarettes smokedon the days when smoking took place divided by 30 days.
For adolescent daily smokers, daily cigarette consumption was determined from theabove adolescent question, but adult daily smokers were asked:
How many cigarettes on average do you smoke per day?
Figure 4.6 shows the mean numbers of cigarettes smoked per day for different age groupsof current established smokers.
About half of 18-20 year oldoccasional smokers willconvert to daily smokingbefore age 25.

Adolescent and Young Adult Smoking
4-17
Figure 4.6 indicates that cigarette consumption among daily smokers increasessignificantly from late adolescence to young adulthood, and then remains constant untilthe early thirties. Although the results are not plotted, the increase in consumptioncontinues until about age 50 years. The increase beginning in the early thirties isprobably because some of the lighter daily smokers are starting to quit, leaving behind agroup that are heavier smokers. In the same vein, although consumption among dailysmokers seems constant during the twenties, occasional smokers converting to light dailysmokers may obscure increases in daily consumption related to building up toleranceamong the already daily smokers.
Figure 4.6 also shows that ever-daily occasional smokers on average smoked morecigarettes per day than never-daily smokers, but in some age groups these differenceswere not significant. There was a significant increase in the mean daily consumptionamong the never-daily occasional smokers 15-17 years of age and those 18-20 years of
0
5
10
15
20
Age Group (years)
Mea
n C
igar
ette
s S
mo
ked
per
Day
Ever-Daily Occasionals
Never-Daily Occasional
Daily Smokers
Mean Daily Cigarette Consumption Among Daily Smokers,Ever-Daily Occasional Smokers, and Never-Daily Occasional Smokers
15-17 18-20 21-25 26-30 31-35
Source: CTS 1999 Figure 4.6
Age (years)15-17 18-20 21-25 26-30 31-35
Ever-DailyOccasional Smokers
3.1 2.8 2.0 2.5 3.3
Never-DailyOccasional Smokers
0.6 1.3 0.7 1.2 1.8
Daily Smokers 10.2 13.4 13.3 13.3 15.0

Adolescent and Young Adult Smoking
4-18
age. After that, the trends are difficult to interpret, because some never-daily smokersmay be converting to daily smoking, or to daily smoking and back to occasional smokingonce again. Regardless, the main changes in consumption appear to be occurringbetween ages 15-17 and 18-20 years as adolescents transition to established smoking.
4. Summary
Between 1993 and 1996, California experienced a significant increase in adolescentsmoking. Fortunately, between 1996 and 1999 this disturbing trend was reversed. Evenmore encouraging, 1999 saw a significant increase in the percentage of committed neversmokers. These changes were most noticeable among older adolescents, non-HispanicWhites, and among students who reported lower levels of school performance. Continuedprogress toward increasing the percentage of adolescent committed never smokers willeventually result in lower adult rates of smoking prevalence.
The spike in adolescent smoking observed in 1996 may be due to the “Joe Camel”advertising campaign that was targeted toward children and adolescents beginning in thelate 1980s (Pierce et al., 1999). The adolescent cohort exposed to the “Joe Camel”campaign has now become young adults. The higher rate of smoking among the membersof this cohort may partially account for the slowing in the rate of decline recentlyobserved in California adult smoking prevalence (see Chapters 1 and 2).
Only about half of adolescent experimenters will become established smokers. However,it may take several years after experimentation ceases before the risk of future smoking isminimal; it was not until after a year of abstinence that the majority were at low risk.Current adolescent established smokers are interested in quitting, and nearly 80% havetried.
There was no evidence that tobacco industry promotional campaigns aimed at youngadults are making young adult never smokers more at risk to smoke, or encouraging thosewho had experimented during adolescence to begin again and convert to establishedsmoking.
Since many young adults are still completing the smoking uptake process, tobaccocontrol efforts should be targeted at this age group in an attempt to reduce the rate ofconversion to established smoking in the late teens and to daily smoking in the twenties.
Adolescent and Young Adult Smoking
4-19
CHAPTER 4: KEY FINDINGS
1. By 1999, the percent of California adolescents 12-17 years of age who werecommitted never smokers was 53.3±1.4%, which, despite a decrease in 1996, wassignificantly higher than the rate of committed never smokers in 1993, 48.6±1.9%.
2. The percent of adolescents 15-17 years of age who had become established smokerswas only 8.0±1.1% in 1999, a factor decrease of 33.9% since 1996.
3. In 1999, 79.8±7.2% of current adolescent established smokers reported they hadtried to quit in the past. Some of these quitters (4.2±3.1%) had used nicotinereplacement, and this rate of use may not be much different than among adult lightsmokers.
4. The relation between the timing of the Joe Camel campaign and patterns in youthsmoking prevalence since 1990 together with the recent declines in youth smokingprevalence suggests that the increase in young adult smoking in 1999 reflects thematuring of the youth cohort previously influenced by the Joe Camel campaign,rather than more recent tobacco industry campaigns targeting young adults.
5. In 1999, a high proportion of young adult established smokers (approximately 45%of 18-20 year olds) have never smoked daily. About 25% of young adult smokersover 20 years of age have reverted to occasional smoking after a period of dailysmoking for at least 6 months.

Adolescent and Young Adult Smoking
4-20
CHAPTER 4: APPENDIX
Definitions of Categories Used to Describe Adolescent Smoking Experience
Four survey questions were used to assess an adolescent’s experience with smoking. Alladolescents were asked:
1. Have you ever smoked a cigarette?
Those who answered in the affirmative were then asked:
2. Have you smoked at least 100 cigarettes in your life?3. Think about the last 30 days. On how many of these days did you smoke?
Those who denied ever smoking a cigarette (question 1) were asked:
4. Have you ever tried or experimented with smoking, even a few puffs?
Those answering no to questions 1 and 4 were considered never smokers; if the answer toquestion 1 was yes, they were considered ever smokers. Three additional questions wereused to divide the never smokers into two groups, those with a strong commitment toremain a never smoker, and those who appeared to be at risk to begin smoking in the nearfuture. The never smokers were asked:
5. Do you think you will try a cigarette soon?6. If one of your best friends were to offer you a cigarette, would you smoke it?7. At any time during the next year do you think you will smoke a cigarette?
Only adolescents who answered no question 5 and “definitely not” to questions 6 and 7were categorized as committed never smokers. The rest of the never smokers were calledsusceptible never smokers.
A puffer is someone who has never smoked a cigarette (no to question 1) but who lateradmits to puffing by answering yes to question 4. An experimenter has smoked acigarette (yes to question 1), but not as many as 100 cigarettes (no to question 2).
Anyone who had smoked a cigarette (adolescent ever smoker) was also asked:
8. On how many of the past 30 days did you smoke cigarettes?
If the answer to the above question was none, then the ever smoker was considered anon-current smoker and if the respondent replied with a number between 1 and 30, he orshe was considered a current smoker.

Adolescent and Young Adult Smoking
4-21
Questions Used to Define Adolescent Norms and Attitudes
This section of the Appendix explains the correlates of adolescent smoking summarizedin section 2 of this chapter, which survey questions were involved, and how the responseswere coded for analysis.
To assess peer norms, all adolescents were asked:
• Do you think people your age care about staying off cigarettes?• How do you think your best friends would feel about you smoking on a daily basis?
Adolescents who answered yes to the first question and disapprove to the second questionwere considered to be recipients of peer pressure not to smoke.
To determine whether adolescents saw some benefit to smoking, they were asked to givetheir opinion (yes or no), not what they think others believe, to each of the followingstatements:
• Smoking can help people when they are bored.• Cigarette smoking helps people relax.• Cigarette smoking helps reduce stress.• Smoking helps people feel more comfortable at parties and in other social situations.• Smoking help people keep their weight down.
Adolescents who answered yes to any of these questions saw some benefit to smoking.
Similarly, to determine whether adolescents saw smoking as a safe activity, they wereasked to agree or disagree with the first 2 of the following statements and answer yes orno to the third:
• It’s safe to smoke for only a year or two.• If I started to smoke regularly, I could stop smoking anytime I wanted.• Do you believe there is any harm in having an occasional cigarette?
Adolescents who agreed with either of the first 2 questions or answered no to the lastquestion were considered to view smoking as a safe activity.
To determine adolescent reaction to tobacco advertising and promotion, they were askedthe following 2 questions:
• What is the name of the cigarette brand of your favorite cigarette advertisement?• Do you think you would ever use a tobacco industry promotional item such as a tee
shirt?

Adolescent and Young Adult Smoking
4-22
Adolescents who provided the name of a cigarette brand to the first question wereconsidered to have a favorite cigarette advertisement. Those who answered yes to thesecond question were considered willing to use a tobacco industry promotional item.
To determine whether these adolescents possessed a promotional item from a tobaccocompany they were asked whether, in the last 12 months, they had:
• Exchanged coupons for an item with a tobacco brand name or logo on it?• Received as a gift or for free, any item with a tobacco brand name or logo on it?• Purchased any item with a tobacco brand name or logo on it?
Adolescents who answered yes to any of these 3 questions possessed a tobacco industrypromotional item.

Adolescent and Young Adult Smoking
4-23
CHAPTER 4: GLOSSARY
Adolescents
Committed never smoker – a never smoker who does not expect to try a cigarette soonand who answers definitely not to whether he or she would accept a cigarette offered by afriend and to a question about whether he or she will smoke in the next year.
Current established smoker – has smoked a cigarette on at least one day in the past monthand has smoked at least 100 cigarettes in his or her lifetime.
Current experimenter – has smoked a cigarette on at least one day in the past month, buthas not yet smoked 100 cigarettes in his or her lifetime.
Current smoker – has smoked a cigarette on at least one day in the past month.
Daily smoker – answers 25 or more days to the question about how many days in the lastmonth he or she smoked.
Established smoker – has smoked at least 100 cigarettes in his or her lifetime.
Ever smoker – has smoked a cigarette (excludes puffers).
Experimenter – has smoked a cigarette (excludes puffers), but has not smoked at least100 cigarettes in his or her lifetime.
Former established smoker – an established smoker who has not smoked a cigarette onany days of the past month.
Never smoker – has never smoked or even puffed on a cigarette.
Never smoker at risk – see susceptible never smoker.
Non-current established smoker – see former established smoker.
Non-current experimenter – has not smoked a cigarette on any days in the past month,and has not smoked at least 100 cigarettes in his or her lifetime.
Non-current smoker – has not smoked a cigarette on any days in the past month.
Nonsmoker – never smoker or non-current smoker.

Adolescent and Young Adult Smoking
4-24
Occasional smoker1 – answers less than 25 days to the question about how many days inthe last month he or she smoked.
Puffer – someone who has not smoked a cigarette, but admits to puffing on one.
Susceptible never smoker – a never smoker who either expects to try a cigarette soon orwho does not answer definitely not to whether he or she would accept a cigarette offeredby a friend or to a question about whether he or she will smoke in the next year.
Adults
Current smoker – has smoked at least 100 cigarettes in his or her lifetime and smokesnow (old question) or now either everyday or some days (new question) at the time ofthe survey.
Daily smoker – a current smoker who has smoked on every day of the past month (oldquestion sequence) or who now smokes everyday (new question).
Ever-daily occasional smoker – current smoker who has not smoked on everyday of thepast month, but has smoked everyday for a period of at least 6 months in the past.
Never-daily occasional smoker – current smoker who has not smoked on every day of thepast month and has never smoked everyday for a period of 6 months or longer.
Occasional smoker1 – a current smoker who smoked on at least 1 day in the past month(old question sequence) or who says he or she now smokes some days (new question).
1 For this chapter, the adult definition is used since comparisons are made across age groups of adolescentsand young adults.

Adolescent and Young Adult Smoking
4-25
CHAPTER 4: REFERENCES
Bauman KE, Fisher LA, Bryan ES, Chenoweth RL. Antecedents, subjective expectedutility, and behavior: a panel study of adolescent cigarette smoking. Addict Behav. 1984;9:121-136.
Chassin LA, Presson CC, Sherman SJ. Stepping backward in order to step forward: anacquisition-oriented approach to primary prevention. J Consult Clin Psychol.1985;53:612-622.
Choi WS, Pierce JP, Gilpin EA, Farkas AJ, Berry CC. Which adolescent experimentersprogress to established smoking in the United States? Am J Prev Med. 1997;13:385-391.
Choi WS, Gilpin EA, Pierce JP. Determining the probability of future smoking amongadolescents. Addiction. 2001 (in press).
Collins LM, Sussman S, Rauch JM, Dent CW, Johnson CA, Hansen WB et al.Psychosocial predictors of young adolescent cigarette smoking: a sixteen-month three-wave longitudinal study. J Appl Soc Psychol. 1987;17:554-73.
Ershler J, Leventhal H, Flemming R, Glynn K. The quitting experience for smokers insixth through twelfth grade. Addict Behav. 1989;14:365-378.
Evans N, Farkas A, Gilpin E, Berry C, Pierce JP. Influence of tobacco marketing andexposure to smokers on adolescent susceptibility to smoking. J Natl Cancer Inst.1995;87:1538-1545.
Gilpin EA, Pierce JP, Rosbrook B. Are adolescents receptive to current sales promotionpractices of the tobacco industry? Prev Med. 1997;26:14-21.
Hahn G, Charlin VL, Sussman S, Dent CW, Manzi J, Stacy AW, et al. Adolescent’s firstand most recent use situations of smokeless tobacco and cigarettes: similarities anddifferences. Addict Behav. 1990;15:439-448.
Pierce JP, Choi WS, Gilpin EA, Farkas AJ, Berry CC. Tobacco industry promotion ofcigarettes and adolescent. JAMA. 1998;279:511-515.
Pierce JP, Gilpin E. How long will today's new adolescent smoker be addicted tocigarettes? Am J Pub Health. 1996;86:253-256.
Pierce JP, Gilpin EA, Choi WS. Sharing the blame: Smoking experimentation andfuture smoking-related mortality due to Joe Camel and Marlboro advertising andpromotions. Tobacco Control. 1999;8:37-44.

Adolescent and Young Adult Smoking
4-26
Swan AV, Creeser R, Murray M. When and why children first start to smoke.International J Epidemiol. 1990;19:323-230.
Tobacco Education Oversight Committee (TEOC). Toward a Tobacco-Free California:A Master Plan to Reduce Californians’ Use of Tobacco. January 1, 1991.
US Department of Health and Human Services (USDHS). The Health Consequences ofSmoking, Nicotine Addiction. A Report of the Surgeon General. Rockville, MD: USDepartment of Health and Human Services, Public Health Service, Centers for DiseaseControl, Center for Health Promotion and Education, Office on Smoking and Health;1988.
Zhu SH, Sun J, Billings SC, Choi WS, Malarcher A. Predictors of smoking cessation inU.S. adolescents. Am J Prev Med. 1999;16:202-207

5-1
Chapter 5
PARENTAL INFLUENCES ON ADOLESCENT SMOKING

Parental Influences on Adolescent Smoking
5-2
CHAPTER 5: PARENTAL INFLUENCES ON ADOLESCENT SMOKING
Introduction
Becoming a smoker is a social process that appears to begin in Californians around age10 years and continues throughout adolescence (Choi et al., 2000; Pierce et al., 1998).During these years, young people typically live at home, encountering a number ofparental influences that could be associated with whether or not they become smokers. Anumber of studies on smoking initiation have highlighted the correlation betweenparental smoking behavior and the likelihood that children would become smokers(CDC, 1994). Parents who smoke provide models of the behavior as well as theopportunity to obtain cigarettes.
Studies have also suggested that aspects of parenting other than parental smokinginfluence the probability of adolescent smoking. These include associations ofadolescent smoking with parental education level (Ary & Biglan, 1988; Murray et al.,1984; Waldron & Lye, 1990) as well as single parent status in the home (Elder & Caspi,1988; Goddard, 1992). Further, the likelihood of an adolescent smoking appears to berelated to the adolescent’s expectations of how parents might react upon learning that theadolescent had smoked a cigarette (Hansen et al., 1987; Eiser et al., 1989). Parentalcontrol over adolescents has also been associated with adolescent smoking (Chassin etal., 1986) and with other problem behaviors (Pandina & Schuele, 1983). Other correlatesof smoking behavior include family conflict and lack of parent involvement with lifeinterests of the adolescents (Biglan et al., 1995). These results are consistent with theinfluence of parenting practices on the development of problem behavior in general(Metzler et al., 1994; Brown et al., 1993; Chilcoat & Anthony, 1996).
In any study of the relationship of parent behavior and practices to adolescent smoking,it is very important to account for other important influences on smoking behavior. Aprimary question is whether good parenting practices are sufficient to overcomeinfluences to smoke, such as those from tobacco marketing. While this chapter does notaddress this question, it describes some current parenting practices in California relatedto the issue of adolescent smoking.
This chapter presents preliminary data on parent behaviors and practices that mightinfluence children against smoking. Section 1 reports on the distribution of adults whosmoke and who live with adolescents, thereby providing models for smoking behavior.Section 2 describes expectations parents have for their adolescents regarding smoking asreported by the adolescent. Section 3 describes how parents who smoke and those whohave tried to quit smoking explain their behavior to their adolescents, as these messagesmay communicate benefits and consequences of smoking to adolescents. Section 4concerns other parenting practices related to smoking, such as discussing the risks of

Parental Influences on Adolescent Smoking
5-3
smoking, asking adolescents about smoking that occurs among friends, and parentperceptions of their adolescent’s smoking and risk to smoke. Section 5 summarizes thefindings of the chapter.
Two sets of data are discussed in this chapter. Sections 1 and 2 report on 6,090adolescents from the 1999 California Tobacco Survey (CTS). Sections 3 and 4 report ondata collected in 1999 on a sample of 2,504 adolescents and parents. In this survey,interviews were attempted for 1 parent, usually the mother, of each adolescent.Adolescents were first interviewed at ages 12 through 15 years as part of the 1996 CTS,and were re-interviewed in 1999 about their smoking behavior and attitudes and that oftheir parents. Funded by the Robert Wood Johnson (RWJ) Foundation, this survey datais referred to in this chapter as the 1996-1999 Cohort Survey. Details of themethodology of the surveys are presented in the technical documentation for this report(Gilpin et al., 2001).
1. Adult Smoking in Adolescent Homes
Adults who smoke at home provide adolescents with opportunities to observe firsthandboth smoking behavior and its consequences. By observation and in conversation, theadolescent will obtain information about the benefits and the risks associated withsmoking as well as the difficulties of quitting. A smoker in the home also means thatcigarettes will be available in the home, providing a number of opportunities for theadolescent to obtain a cigarette for experimentation.
Table 5.1 presents data on exposure ofCalifornia adolescents to smoking in thehousehold in 1999. Just over a quarter currentlylive with a smoker (20.0±1.2% lived with 1current smoker and 6.6±1.6% lived with 2 or
more current smokers). Another 10.1±0.9% of adolescents lived with a smoker who hadquit sometime during the last 5 years and who may be at risk to return to smoking. Ratesof exposure to smoking at home did not differ by gender of the adolescent, but youngeradolescents (age 12-13 years) were more likely to live with nonsmokers than olderadolescents. Notably, one-third of African American adolescents lived with currentsmokers, and Asian youth had the lowest exposure to smokers at home (22.5%)compared to other ethnic groups. Exposure to smoking at home was markedly lower(16.8%) for adolescents whose parents were college graduates compared to adolescentswhose parents had lower levels of education.
In 1999, just over a quarter ofCalifornia adolescents lived inhouseholds with at least one adultsmoker.

Parental Influences on Adolescent Smoking
5-4
2. Parental Expectations Regarding Adolescent Smoking
When adolescents expect a strong negative reaction from parents relating to theirpotential smoking, they may be less willing to experiment and continue with smoking,although the nature and strength of the parent-child relationship probably influence this.In the 1999 CTS, adolescents were asked about the expected reactions of their parents totheir smoking:
If you lit up a cigarette tomorrow in front of your parents, how do you think theywould react?
Possible responses were: tell you to stop and be very upset, tell you to stop and not beupset, not tell you to stop but disapprove, and have no reaction. Respondents who gavethe first response were categorized as having parents who were strongly against theadolescent smoking now.
Table 5.1Exposure to Smoking in Households of California Adolescents
by Adult Smoking Status and Adolescent Demographic Group, 1999Smoking Status of Adults in Household
AdolescentDemographic Group 2+ Current
Smokers%
1 CurrentSmoker
%
Quit in Last5 Years
%
No Smokers inLast 5 Years
% Overall 6.6 (±0.8) 20.0 (±1.2) 10.1 (±0.9) 63.3 (±1.6) Gender Female 7.0 (±1.3) 20.7 (±1.6) 10.4 (±1.4) 61.9 (±2.0) Male 6.3 (±0.9) 19.3 (±1.8) 9.8 (±1.0) 64.6 (±2.3) Age 12-13 5.1 (±1.0) 18.4 (±2.0) 10.0 (±1.4) 66.5 (±2.3) 14-15 6.8 (±1.1) 21.7 (±2.5) 10.7 (±1.6) 60.8 (±3.0) 16-17 8.1 (±1.8) 19.9 (±1.8) 9.5 (±1.7) 62.5 (±2.7) Race/Ethnicity African American 4.9 (±2.8) 27.5 (±4.7) 9.4 (±3.1) 58.2 (±4.3) Asian/PI 5.9 (±2.9) 16.6 (±6.2) 8.3 (±2.5) 69.3 (±7.1) Hispanic 6.3 (±1.3) 19.8 (±1.8) 11.0 (±1.5) 62.9 (±2.4) Non-Hispanic White 7.4 (±1.1) 19.3 (±2.0) 9.8 (±1.3) 63.5 (±2.1)Education-Head of Household <12 7.9 (±1.9) 22.4 (±2.7) 10.3 (±2.2) 59.4 (±3.7) 12 10.6 (±2.3) 23.6 (±2.2) 12.5 (±2.7) 53.3 (±2.8) 13-15 6.0 (±1.7) 22.0 (±2.8) 10.9 (±1.7) 61.1 (±3.3) 16+ 3.1 (±1.1) 13.7 (±2.2) 7.2 (±1.3) 76.0 (±2.4)Table entries are weighted percentages and 95% confidence limits.Source: CTS 1999

Parental Influences on Adolescent Smoking
5-5
Perceived parental disapproval, however, may change as the adolescent approachesadulthood and becomes more independent. Therefore, adolescents were also asked toeither agree or disagree with the statement:
When I’m older my parents won’t mind if I smoke.
Respondents who disagreed with this statement were categorized as having parents whowere against future smoking by the adolescent. These 2 questions were combined into 3categories of perceived parental expectations for adolescent smoking, as shown in Table5.2. Adolescents who responded that they perceived their parents would be against themsmoking now and in the future were classified as having strong perceived parentalexpectations regarding smoking. Adolescents who perceived their parents would beagainst them smoking now, but wouldn’t mind them smoking in the future wereclassified as having moderate perceived parental expectations regarding smoking.Finally, adolescents who perceived that their parents would not be against them smokingnow were classified as having weak perceived parental expectations regarding smoking.
Overall, 78.7±1.0% of adolescentrespondents to the 1999 CTS reported thattheir parents had strong expectationsagainst their smoking, 12.9±1.0%
reported that their parents had moderate expectations, and 8.8±1.3% reported that theirparents had weak expectations. Parental reinforcement of strong expectations againstsmoking for their adolescent is strongly associated with low rates of adolescent smokingand is likely a key parenting practice to deter adolescent smoking throughoutadolescence and into adulthood, when the risk for smoking uptake drops considerably.Rates of ever smoking among adolescents were low (11.7±1.6% overall) for those whoperceived strong expectations even if parents smoked (9.9±2.0% for adolescents ofnever-smoking parents, 12.6±5.3% for adolescents of parents who had not smoked for atleast 3 years, and 16.5±3.4% for parents who were current smokers). This is in contrastto adolescents who perceived moderate (31.6±6.7%) or weak expectations(30.5±10.3%).
Table 5.2Perceived Parental Expectations for Adolescent Smoking
Now and in the Future According to Adolescent ResponsesAdolescent ResponsesPerceived Parental
Expectation CategoryNow When Older
Strong Tell you to stop and be very upset DisagreeModerate Tell you to stop and be very upset AgreeWeak Tell you to stop and not be upset
Not tell you to stop but disapproveHave no reaction
Any
Over three-quarters of adolescents in1999 reported that their parents didn’twant them to smoke now or in the future.

Parental Influences on Adolescent Smoking
5-6
Figure 5.1 shows the rate of adolescent ever smokers among 12-14 year olds by level oftheir perceived parental expectations regarding smoking. Only 1.7±0.8% of adolescentswith strong parental expectations had ever smoked compared to 9.9±5.6% of those withmoderate and 12.3±8.7% of those with weak expectations.
Figure 5.2 shows the rate among 15-17 year old adolescents who had either smoked inthe last month before the survey, or who had smoked at least 100 cigarettes in their
1.7
12.3
9.9
0
5
10
15
20
25
Strong Moderate Weak
% A
do
lesc
ent
Eve
r S
mo
kers
Adolescent Smoking by Parental Smoking ExpectationsAmong 12-14 Year Olds
Source: CTS 1999 Figure 5.1
8.2
43.6
19.7
0
10
20
30
40
50
60
Strong Moderate Weak
% A
do
lesc
ent
Cu
rren
to
r 10
0+ S
mo
kers
Adolescent Smoking by Parental Smoking ExpectationsAmong 15-17 Year Olds
Source: CTS 1999 Figure 5.2

Parental Influences on Adolescent Smoking
5-7
lifetime by level of their perceived parental expectations regarding smoking. Only8.2±1.7% of those with strong parental expectations were current or established smokerscompared to approximately 19.7±7.3% of those with moderate expectations and43.6±8.4% of those with weak parental expectations. Strong perceived expectations areclearly associated with lower rates of smoking behavior and these results did not differsignificantly according to parental smoking status. Smoking rates significantly increasedwith weaker levels of parental expectations for both age groups.
Table 5.3 shows perceived parental expectations regarding adolescent smoking byadolescent demographic group. In general, the data suggest that parents have higherexpectations for girls than for boys and for younger adolescents compared to older ones.
The rate of strong expectations decreased with adolescent age for all ethnic groups,although this decrease was less evident for Hispanics (79.4±2.7% for 12-14 year oldsversus 73.4±3.6% for 15-17 year olds). For African Americans the rate of strongperceived parental expectations was lower (62.9±8.1% for 15-17 year olds vs.82.6±6.0% for 12-14 year olds) to a greater extent than all other ethnic groups,especially for males (56.2±11.7% vs. 81.3±10.3%). These results contradict previoushypotheses of strong parenting practices associated with low rates of smoking amongAfrican American adolescents.
Asian adolescents reported the highest rates (91.8±3.5% for 12-14 year olds and76.5±6.1% for 15-17 year olds) of strong perceived parental expectations against theirsmoking, but these rates also sharply declined for older adolescents, especially forfemales (96.0±2.9% for 12-14 year old females vs. 78.9±6.9% for 15-17 year oldfemales). These results suggest that smoking is perceived as more acceptable in theAsian culture as youth reach adulthood, and earlier for young males than females.
Table 5.3Strong Parental Expectations Regarding Adolescent Smoking
by Adolescent Demographic Group, 1999Adolescent
DemographicGroup
AfricanAmerican
Asian/Other
Hispanic Non-HispanicWhite
Overall 73.5 (±4.7) 83.7 (±3.2) 76.4 (±2.1) 80.0 (±1.9)Age 12-14 years 82.6 (±6.0) 91.8 (±3.5) 79.4 (±2.7) 85.8 (±2.5) Male 81.3 (±10.3) 87.8 (±6.3) 75.6 (±3.8) 83.9 (±3.3) Female 84.0 (±6.7) 96.0 (±2.9) 83.6 (±3.4) 87.8 (±3.3)Age 15-17 years 62.9 (±8.1) 76.5 (±6.1) 73.4 (±3.6) 73.9 (±2.9) Male 56.2 (±11.7) 74.7 (±7.7) 70.8 (±4.5) 72.4 (±4.2) Female 68.5 (±9.8) 78.9 (±6.9) 76.3 (±5.5) 75.4 (±3.8)Table entries are weighted percentages and 95% confidence limits.Source: CTS 1999

Parental Influences on Adolescent Smoking
5-8
3. Quitting and Relapsing Among Parents
How Parents Who Smoke Explain Their Smoking Behavior to Adolescents
In the 1996-1999 cohort sample of parents and children, the 307 parents who smokedwere asked:
What is the primary reason you give your adolescent for your smoking?
It appears that the majority of parents who smokeare telling their adolescents that nicotineaddiction is a problem for them. Almost half(44.1±8.3%) of the parents who smoked reportedthat they were addicted beyond control (i.e., theywere unable to quit; Figure 5.3). A further
20.8±6.3% indicated that they were addicted and that they were trying to quit. Another20% reported that they told their adolescents that smoking provided a benefit to them,with 12.6±5.7% indicating that smoking helped reduce stress or control weight and7.3±2.8% indicating that it was an activity that they enjoyed. Finally, 10.8±4.5% ofparents reported that they did not discuss their smoking with their adolescents.
Reasons Parents Who SmokeGave Their Adolescents for Their Smoking
Source: Cohort Survey, 1996-1999
Figure 5.3
Addictedbeyond control (44.1%)
Addicted, trying to quit (20.8%)
Don’t need to quit yet (2.8%)
Need to controlstress or weight (12.6%)
Enjoy (7.3%)
Don't discuss (10.8%)
Other (1.6%)
Parents more frequently tell theiradolescents that they smokebecause they are addicted tonicotine, rather than because of abenefit to smoking.

5-9
How Parents Who Attempt to Quit Explain Relapsing to Their Adolescents
In the 1996-1999 cohort study of parents (mostly mothers) and adolescents, 55.5±8.2%of the parents who smoked reported making a quit attempt of a day or longer in the lastyear, and 50.5±10.9% of these parents had relapsed at the time of interview. For a moredetailed description of demographic categories of smokers who attempted to quit andthose who relapsed from the 1999 CTS, see Chapter 6.
In the 1996-1999 cohort survey, parents were asked for the explanation they gave theiradolescents for their relapse to smoking after the parents’ attempt to quit in the last 12months:
When you relapsed to smoking, which of the following best describes how youexplained it to your adolescent?
Adolescents were also asked to give the main reason they thought their parent hadrelapsed with the following open-ended question:
What do you think is the main reason why he/she was unsuccessful?
To make the results more comparable, only data on mothers interviewed and motherswhom adolescents reported on were analyzed. Responses for mothers and adolescentswere categorized as presented in Figure 5.4.
Mother and Adolescent Reports on Reasons for Parent Relapse
Source: Cohort Survey, 1996-1999 Figure 5.4
Can’t quit(54.8%)
Don’t discuss/Other (21.4%)
Plan to quitlater (3.8%)
Need tocontrolmood/weight(20.0%)
Too addicted(40.2%)Other/don’t know
(30.2%)
Need to controlmood/weight (24.1%) Don’t need
to quit yet(5.5%)
Mothers Adolescents

Parental Influences on Adolescent Smoking
5-10
The most common response from mothers (can’t quit, 54.8±10.6%) and adolescents (tooaddicted, 40.2±9.7%) suggests that the majority of parents who smoke and attempt toquit but relapse convey the extremely addictive nature of smoking to their children.Another common explanation of relapse reported by adolescents was that their mothersneeded the benefit of cigarettes to help control their mood or their weight (24.1±7.8%),and 20.0±17.1% of mothers surveyed gave this as an explanation. A small percentage ofadolescents reported their mothers planned to quit later (5.5±3.2%), and a smallpercentage of mothers reported they didn’t need to quit yet (3.8±4.2%). A further 6% ofmothers responded that they didn’t discuss relapsing with their adolescents (6.5±7.6%),and about 30% of adolescents reported that either they didn’t know why their motherhad relapsed (20.7±9.5%) or reported some other reason (9.5±6.1%).
4. Other Parenting Practices Related to Adolescent Smoking
Discussing the Risks of Smoking
Periodically discussing with adolescents the dangers of smoking is another strategy thatparents may use to communicate consistent and continued concern about smoking totheir adolescents. To discern the importance to parents of discussing the risks ofsmoking with young children, they were asked the following hypothetical question:
If parents see children under 10 years pretending to smoke, what do you think theyshould do?
Response choices were: use the opportunity to talk about the risks of smoking, just tellthem not to smoke, let them see you are annoyed but don’t make an issue of it, oranother unspecified response. Figure 5.5 presents categories of parent responses to thisquestion. The majority (78.6±2.0%) of parents reported that they should use the
Source: Cohort Survey, 1996-1999 Figure 5.5
If Parents See Children Under 10 Years of Age Pretendingto Smoke, What Do You Think They Should Do?
Discuss the risksof smoking (78.6%)
Just tell themnot to smoke (7.2%)
Let them see you are annoyed, but don't make an issue of it (5.4%)
Other (8.8%)

Parental Influences on Adolescent Smoking
5-11
opportunity presented by a child less than 10 years of age pretending to smoke to talkabout the risks of smoking. Other possible responses for parents were just tell them notto smoke (7.2±1.5%), let them see you are annoyed, but don’t make an issue of it(5.4±1.0%), and a variety of other responses (8.8±1.3%).
Parents who were current smokers were less likely (68.1±8.4%) than parents who wereformer smokers for at least 3 years (76.3±4.9%) or parents who were long-term formersmokers or never smokers (81.1±2.3%) to report they should discuss the risks ofsmoking. There were no significant differences in the percentage of parents whoreported that they should discuss the risks of smoking by adolescent age, gender, orrace/ethnicity.
To assess adolescents’ perceptions of whether their parents had ever discussed the risksof smoking with them, adolescents were asked:
Have your parents ever talked to you about the risks of smoking?
Table 5.4 presents the results to this question by adolescent demographic group. Whilethe percentage of adolescents who reported that their parents had discussed the risks ofsmoking with them did not differ significantly by adolescent gender, it decreased forolder adolescents, which may be the result of adolescent recall bias. Older adolescentsmay have forgotten their parents had discussed the risks of smoking with them whenthey were younger. Alternatively, parents may see a decreased need for discussing therisks of smoking with their adolescents as they get older, or may decide over time thatdiscussing the risks of smoking has less impact or becomes ineffective as theiradolescent matures.
Results also suggest that there may be cultural differences related to parents discussingthe risks of smoking with their adolescents. African American and Non-Hispanic Whiteadolescents were the most likely and Asian adolescents were the least likely to reporttheir parents had discussed the risks of smoking with them.

Parental Influences on Adolescent Smoking
5-12
The percentage of adolescents who reported their parents had discussed the risks ofsmoking with them did not differ by parental smoking status. It was higher if theadolescent had already smoked at least 100 cigarettes (75.8±6.6%) compared tocommitted never smokers (68.0±4.4%), never smokers at risk (67.6±5.4%), andexperimenters (65.7±4.3%). Because only a few in the sample had smoked at least 100cigarettes (n=200), this finding was not significant, but it suggests that parents may bediscussing the risks of smoking after they became aware that the adolescent wassmoking.
Table 5.4Adolescent Responses Regarding Parents
Discussing the Risks of Smoking, 1996-1999 Cohort SurveyDemographic Group-Adolescent
& Parent Smoking StatusAdolescents Reporting Parents
Talked to Them About Risks of Smoking%
Overall 67.9 (±2.9)Age of Adolescent (years) 15 74.4 (±4.7) 16 68.0 (±4.5) 17 65.3 (±5.0) 18 64.1 (±4.9)Adolescent Gender Male 67.4 (±3.7) Female 68.4 (±4.1)Adolescent Race/Ethnicity African American 72.3 (±8.8) Asian/PI 55.9 (±7.7) Hispanic 65.3 (±6.0) Non-Hispanic White 72.0 (±2.9)Adolescent Smoking Status Committed Never Smokers 68.0 (±4.4) Experimenters 65.7 (±4.3) Never Smokers At Risk 67.6 (±5.4) Smoked 100+ Cigarettes 75.8 (±6.6)Parental Smoking Status Current Smokers 64.2 (±6.6) Former Smokers (in last 3 years) 72.8 (±7.5) Long-Term Former Smokers or Never Smokers
67.7 (±3.5)
Table entries are weighted percentages and 95% confidence limits.Source: Cohort Survey, 1996-1999

Parental Influences on Adolescent Smoking
5-13
Parental Inquiry About Smoking Among Adolescent Friends
Having friends who smoke is a consistent predictor of adolescent smoking (CDC, 1994).One way that parents can monitor their adolescents’ choice of friendship groups is to askadolescents about any smoking that may occur when they are with their friends.Regardless of whether the answer parents receive is truthful, concern about smoking willhave been expressed to the adolescent. In order to assess how likely a parent would be toask their adolescents about smoking, parents were asked:
How often do you think parents should ask their adolescents if any smoking occurswhen they are out with their friends?
Possible responses were regularly, everynow and then, and not at all. The vastmajority (90.7±1.7%) of parents respondedthat they thought parents should ask theiradolescents if any smoking occurs when the
adolescent is out with friends at least every now and then, with 47.4±3.0% reporting thatparents should ask regularly (Table 5.5).
Nearly half of parents think theyshould ask regularly about smokingthat occurs when their adolescents areout with friends.

Parental Influences on Adolescent Smoking
5-14
Compared to non-Hispanic whites, parents of adolescents from all other ethnic groupswere less likely to report that parents should ask their adolescents regularly aboutsmoking with friends, especially parents of Hispanic adolescents. Parents who werecurrent smokers or former smokers were less likely to report that parents should asktheir adolescents regularly about smoking with friends than parents who werenonsmokers. The percentage of parents who responded that parents should ask regularlydid not differ significantly by adolescent age, gender, or smoking status.
Table 5.5Parent Responses-Asking Adolescents About Smoking
When They Are With Friends, 1996-1999 Cohort SurveyDemographicGroup-Adolescent
& Parental Smoking StatusParents Reporting That Parents
Should Regularly Ask Their AdolescentsIf Smoking Occurs
Overall 47.4 (±3.0)Age of Adolescent (years) 15 49.5 (±4.2) 16 47.5 (±4.9) 17 45.6 (±5.4) 18 46.0 (±6.4)Gender Female 45.6 (±3.7) Male 49.1 (±4.1)Race/Ethnicity African American 54.8 (±11.4) Asian/PI 46.5 (± 7.1) Hispanic 36.7 (±3.2) Non-Hispanic White 62.2 (±5.3)Adolescent Smoking Status Committed Never Smokers 49.9 (±5.0) Never Smokers At Risk 51.6 (±6.9) Experimenters 44.3 (±4.2) Smoked 100+ Cigarettes 41.3 (±8.6)Parental Smoking Status Long-term Former Smokers or Never Smokers
51.4 (±3.6)
Former Smokers (in last 3 years) 36.9 (±5.7) Current Smokers 38.7 (±7.1)
Table entries are weighted percentages and 95% confidence limits.Source: Cohort Survey, 1996-1999
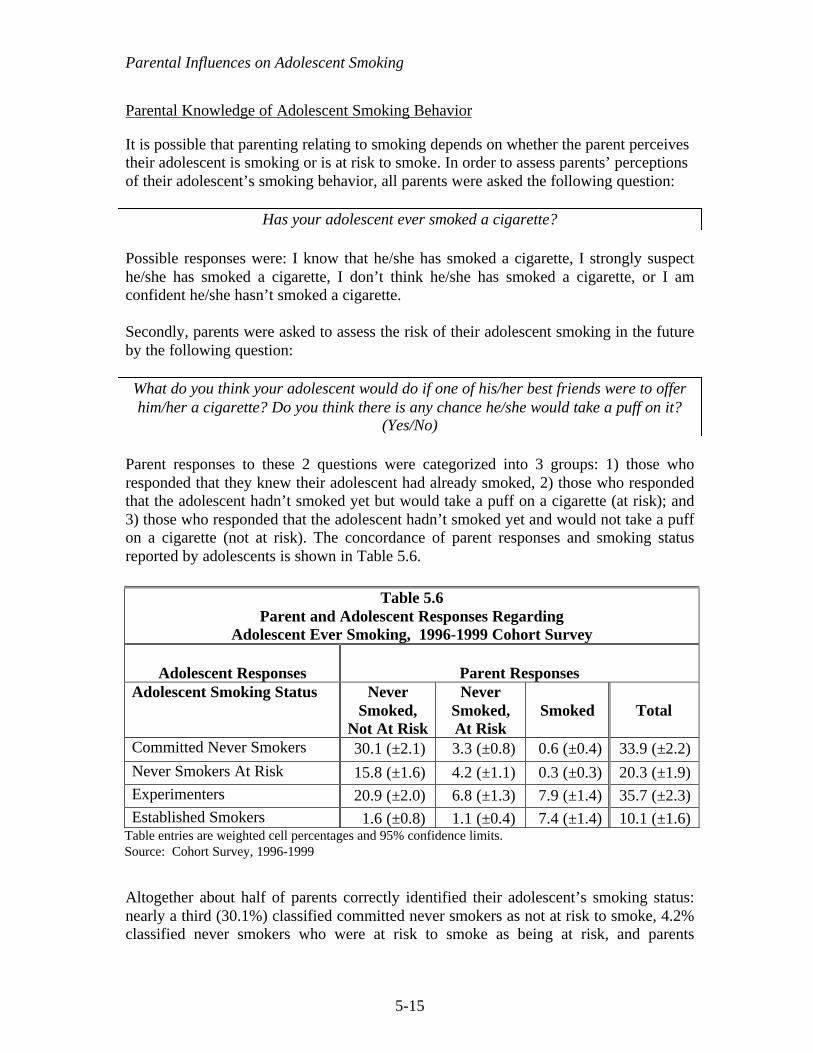
Parental Influences on Adolescent Smoking
5-15
Parental Knowledge of Adolescent Smoking Behavior
It is possible that parenting relating to smoking depends on whether the parent perceivestheir adolescent is smoking or is at risk to smoke. In order to assess parents’ perceptionsof their adolescent’s smoking behavior, all parents were asked the following question:
Has your adolescent ever smoked a cigarette?
Possible responses were: I know that he/she has smoked a cigarette, I strongly suspecthe/she has smoked a cigarette, I don’t think he/she has smoked a cigarette, or I amconfident he/she hasn’t smoked a cigarette.
Secondly, parents were asked to assess the risk of their adolescent smoking in the futureby the following question:
What do you think your adolescent would do if one of his/her best friends were to offerhim/her a cigarette? Do you think there is any chance he/she would take a puff on it?
(Yes/No)
Parent responses to these 2 questions were categorized into 3 groups: 1) those whoresponded that they knew their adolescent had already smoked, 2) those who respondedthat the adolescent hadn’t smoked yet but would take a puff on a cigarette (at risk); and3) those who responded that the adolescent hadn’t smoked yet and would not take a puffon a cigarette (not at risk). The concordance of parent responses and smoking statusreported by adolescents is shown in Table 5.6.
Altogether about half of parents correctly identified their adolescent’s smoking status:nearly a third (30.1%) classified committed never smokers as not at risk to smoke, 4.2%classified never smokers who were at risk to smoke as being at risk, and parents
Table 5.6Parent and Adolescent Responses Regarding
Adolescent Ever Smoking, 1996-1999 Cohort Survey
Adolescent Responses Parent ResponsesAdolescent Smoking Status Never
Smoked,Not At Risk
NeverSmoked,At Risk
Smoked Total
Committed Never Smokers 30.1 (±2.1) 3.3 (±0.8) 0.6 (±0.4) 33.9 (±2.2)
Never Smokers At Risk 15.8 (±1.6) 4.2 (±1.1) 0.3 (±0.3) 20.3 (±1.9)Experimenters 20.9 (±2.0) 6.8 (±1.3) 7.9 (±1.4) 35.7 (±2.3)Established Smokers 1.6 (±0.8) 1.1 (±0.4) 7.4 (±1.4) 10.1 (±1.6)
Table entries are weighted cell percentages and 95% confidence limits.Source: Cohort Survey, 1996-1999
Parental Influences on Adolescent Smoking
5-16
identified some experimenters (7.9%) and established smokers (7.4%) as havingsmoked. Most parents of committed never smokers (88.7±2.4%, or 30.1±2.1% of33.9±2.2%) correctly classified their adolescents as not at risk to smoke. Similarly,parents of adolescents who had already progressed to established smokers werereasonably accurate (73.7%, or 7.4±1.4% of 10.1±1.6%) in their perceptions of theseadolescents as having already smoked.
Nearly 40% of parents were inaccurate in their perceptions of their adolescents’ risk forsmoking. For adolescents who had never smoked but who were at risk to smoke, 77.8%(15.8±1.6% of 20.3±1.9%) of parents identified them as not being at risk to smoke. Foradolescents who had experimented, 58.5% (20.9±2.0% of 35.7±2.3%) of parentsperceived them as never smokers who were not at risk to smoke. Finally, for adolescentswho had already smoked 100 cigarettes, 15.8% (1.6±0.8% of 10.1±1.6%) of theirparents classified them as never smokers who were not at risk to smoke.
5. Summary
The 1996-1999 cohort survey results support a proactive approach for parents indiscouraging their adolescents from starting to smoke. Parents who smoke shouldexpress to their adolescents how difficult it is for them to quit smoking because of theaddictive power of nicotine. All parents, regardless of their smoking status, shouldconsistently express their expectations that the adolescent not smoke both now and in thefuture, monitor adolescent smoking behavior, and discuss the risks of smoking withthem.
These results are cross-sectional and do not prove causality of parenting practices withrespect to adolescent smoking behavior. There may be important limitations on howeffective parents can be in discouraging adolescent smoking compared to the strength ofenvironmental influences that glamorize smoking, such as tobacco advertising.Nevertheless, parents should continually try to ensure smoke-free environments for theiradolescents in their homes and clearly and frequently communicate their desire that theadolescent not smoke.
Although a majority of parents are taking steps to deter their adolescents from smoking,it must be emphasized that this process ideally begins before the adolescent becomessusceptible to smoking or experiments. Results suggest that some parents may not beengaging in parental activities to deter smoking, such as discussing the risks of smokingand asking about smoking that occurs with friends, before the adolescent experiments.With consistent, daily connection in a parent-child/adolescent relationship in which thereis open communication and emotional support, these types of interaction tend to occurautomatically. Encouraging participation of the child/adolescent in healthy activities thattake place in positive environments, such as organized clubs or sports is also a practicethat may discourage smoking.

Parental Influences on Adolescent Smoking
5-17
In many instances, there were important differences among racial/ethnic groups inparenting practices that may deter adolescent smoking. Proactively enlisting parents inculturally and ethnically sensitive programs that increase parents’ effectiveness indiscouraging adolescent smoking may be an important tobacco control strategy.

Parental Influences on Adolescent Smoking
5-18
CHAPTER 5: KEY FINDINGS
1. Parental reinforcement of strong expectations against smoking for their adolescentis strongly associated with low rates (11.7±1.6% overall) of adolescent eversmoking and is likely a key parenting practice to deter adolescent smokingthroughout adolescence and into adulthood, when the risk for smoking uptakedrops considerably.
2. The majority of parents who smoke attributed the addictive power of nicotine asthe reason they smoke (64.9±5.3%) or relapsed (54.8±10.6%) when they discusstheir smoking with their adolescent. According to adolescent reports, manyadolescents (40.2±9.7%) appear to accept this explanation.
3. Most parents (78.6±2.0%) reported that parents should discuss the risks ofsmoking with their children, and two-thirds of adolescents (67.9±2.9%) report thattheir parents had discussed the risks of smoking with them at some time.
4. The vast majority of parents (90.7±1.7%) reported that parents should ask theiradolescents about smoking that occurs among friends at least every now and then,and 47.4±3.0% reported that parents should ask regularly.
5. While most parents (88.7±2.4%) of adolescent committed never smokers reportedthat their adolescent was not at risk to smoke, many (65.6±3.3%) parents ofadolescents who were at risk to start or experiment further with smoking did notperceive their adolescents as being at risk to smoke.

Parental Influences on Adolescent Smoking
5-19
CHAPTER 5: GLOSSARY
Adolescents
Committed never smoker – a never smoker who does not expect to try a cigarette soonand who answers definitely not to whether he or she would accept a cigarette offered bya friend and to a question about whether he or she will smoke in the next year.
Current smoker – has smoked a cigarette on at least one day in the past month.
Established smoker – has smoked at least 100 cigarettes in his or her lifetime.
Experimenter – has smoked a cigarette (excludes puffers), but has not smoked at least100 cigarettes in his or her lifetime.
Never smoker – Has never smoked or even puffed on a cigarette.
Puffer - someone who has not smoked a cigarette, but admits to puffing on one.
Adults
Current smoker – has smoked at least 100 cigarettes in his or her lifetime and smokesnow (old question) or now either everyday or some days (new question) at the time ofthe survey.
Former smoker – has smoked at least 100 cigarettes in lifetime, but does not smoke now(old question) or now smokes not at all (new question).
Never smoker – has smoked fewer than 100 cigarettes in his or her lifetime.

Parental Influences on Adolescent Smoking
5-20
CHAPTER 5: REFERENCES
Ary DV, Biglan A. Longitudinal changes in adolescent cigarette smoking behavior:Onset and cessation. J Behav Med. 1988;11:361-382.
Biglan A, Duncan TE, Ary DV, Smolkowski K. Peer and parental influences onadolescent tobacco use. J Behav Med. 1995;18:315-330.
Brown JH, Cunningham G, Birkimer JC. A telephone home survey to identify parent-child problems and maintaining conditions. Child Fam Behav Therapy. 1993;5:85-92.
Centers for Disease Control and Prevention (CDC). Preventing Tobacco Use AmongYoung People: A Report of the Surgeon General. Atlanta, GA: US Department of Healthand Human Services; 1994.
Chassin L, Presson CC, Sherman SJ, McGrew J. Changes in peer and parent influenceduring adolescence: Longitudinal versus cross-sectional perspectives on smokinginitiation. Devel Psychol. 1986;22:327-334.
Chilcoat HD, Anthony JC. Impact of parent monitoring on initiation of drug use throughlate childhood. J Am Acad Child Adolesc Psychiatry. 1996;35:91–100.
Choi WS, Gilpin EA, Pierce JP. Determining the probability of future smoking amongadolescents. Addiction. 2000 (in press).
Eiser RJ, Morgan M, Gammage P, Gray E. Adolescent smoking: Attitudes, norms andparental influence. Br J Soc Psychol. 1989;28:193-202.
Elder GH, Caspi A. Economic stress in lives: Developmental perspectives. J Soc Issues.1988;44:25-45.
Gilpin EA, Emery SL, Berry CC. Technical Report on Analytic Methods andApproaches Used in the 1996 California Tobacco Survey Analysis. Vol 3: MethodsUsed for Final Report. The California Tobacco Control Program: A Decade ofProgress, 1989-1999. La Jolla, CA: University of California, San Diego; 2001.
Goddard E. Why children start smoking. Br J Addict. 1992;87:17-18.
Hansen WB, Graham JW, Sobel JL, Shelton DR, et al. The consistency of peer andparent influences on tobacco, alcohol, and marijuana use among young adolescents. JBehav Medicine. 1987;10:559-579.
Metzler CW, Noell J, Biglan A, Ary D et al. The social context for risky sexual behavioramong adolescents. J Behav Med. 1994;17:419-438.

Parental Influences on Adolescent Smoking
5-21
Murray DM, Luepker RV, Johnson CA, Mittelmark MB. The prevention of cigarettesmoking in children: A comparison of four strategies. J Applied Soc Psychol.1984;14:274-288.
Pandina RJ, Schuele JA. Psychosocial correlates of alcohol and drug use of adolescentstudents and adolescents in treatment. J Studies Alcohol. 1983;44:950-973.
Pierce JP, Gilpin EA, Emery SL, Farkas AJ, Zhu SH, Choi W, Berry CC, Distefan JM,White MM, Soroko S, Navarro A. Tobacco Control in California: Who’s Winning theWar? An Evaluation of the Tobacco Control Program, 1989-1996. La Jolla, CA:University of California, San Diego; 1998. World Wide Web: http://ssdc.ucsd.edu/tobacco
Waldron I, Lye D. Relationships of teenage smoking to educational aspirations andparents' education. J Substance Abuse. 1990;2:201-215.
6-1
Chapter 6
SMOKING CESSATION: CALIFORNIA SMOKERSARE TRYING TO QUIT
Smoking Cessation: California Smokers Are Trying To Quit
6-2
CHAPTER 6: SMOKING CESSATION: CALIFORNIA SMOKERS ARE TRYING TO QUIT
Introduction
The 1990 Report of the Surgeon General of the United States noted that smokingcessation is a primary preventive intervention, equally as important as preventingsmoking uptake in protecting the public health from smoking-related diseases (USDHHS,1990). Accordingly, encouraging smokers to quit is a major goal of the CaliforniaTobacco Control Program (TCP). While the maximum health benefit is from quittingaltogether, a significant reduction in cigarette consumption may serve to reduce the harmfrom cigarettes to the smoker’s health.
It may take up to 10 years from the time that smokers begin the quitting process with anexpressed intention to quit until they successfully quit smoking (Pierce, 1990).Therefore, in addition to assessing the rate of successful cessation in the Californiapopulation, it is important to monitor behaviors that improve smokers’ chances ofquitting in the long term. Progress toward successful quitting is advanced if the smokertapers down to less than 15 cigarettes/day or makes a significant quit attempt (Farkas,1999; Pierce et al., 1998). The duration of time before relapse is also an importantvariable in determining whether a smoker is increasing his or her chances for eventualsuccessful cessation (Pierce et al., 1998).
Statewide, the TCP has used the mass media to encourage smokers to quit, with somemedia messages tagged with the telephone number for the California Smokers’ Helpline.The TCP has also funded a myriad of smoking cessation programs on the local level.Another approach to promote cessation and reduce cigarette consumption was the effortsby the TCP to encourage implementation of smoking restrictions in public andworkplaces. Educating the public about the health dangers of secondhand smoke thoughmass media may have also led to the increase in the number of California homes,including those with smokers, that are now smokefree (see Chapter 3). Such restrictionshave been shown to be associated with quitting behavior and reductions in consumption(Farkas et al., 1999; Gilpin et al., 1999).
In addition to smoking restrictions, the use of cessation assistance also appears toincrease the chances of successful cessation (Pierce et al., 1998; Zhu et al., 2000). In themid 1990’s, the tobacco control climate was such that MediCal decided to cover the costof the nicotine patch, provided that smokers also have appropriate counseling assistance.Many calls to the California Smokers’ Helpline are from smokers using the service in thismanner. In addition to nicotine replacement therapy, more recently the use of specialantidepressants appears to increase a smoker’s chances of quitting (Jorenby et al., 1999).Finally, physician advice to quit and referral to cessation assistance programs are tobaccocontrol strategies that promote cessation (NCI, 1994); the TCP has actively promoted the

Smoking Cessation: California Smokers Are Trying To Quit
6-3
provision by of such advice and referral by health professionals as an effective way ofimproving their patients’ health.
Section 1 of this chapter describes the representation of adult light smokers (<15cigarettes/day) and those with a recent quitting history in demographic subgroups, and ithighlights how these distributions have changed in the last decade. Section 2 presentsdata from the 1996 and 1999 CTS that describe how successful each of the populationdemographic groups was in their most recent quit attempt. Section 3 describes thesmokers who never expect to quit. Section 4 focuses on the role of smoking restrictions inpromoting quitting behavior. Section 5 describes trends in smokers’ use of cessationassistance, and section 6 describes trends in physician advice to quit. Section 7summarizes the results of this chapter.
1. Trends in Important Predictors of Quitting
An important step toward quitting is a reduction in the number of cigarettes smoked perday. Light smokers are more successful in quitting than heavier smokers (Fiore et al.,1990; Farkas et al., 1996; Hymowitz et al., 1997). Farkas (1999) showed that smokerswho tapered to under 15 cigarettes per day had a higher rate of being successfully quittwo years later than other smokers; however, those who tapered but did not get below 15cigarettes a day did not show the higher levels of successful quitting (Farkas, 1999).
Smoking <15 Cigarettes/Day
As was shown in Chapter 2, Table 2.1, there has been an increase in the percent ofcurrent smokers who are occasional smokers in recent years, and even daily smokersappear to be smoking less. In each CTS, all current smokers were asked about theircigarette consumption:
Daily• How many cigarettes on average do you smoke per day?Occasional• On how many of the past 30 days did you smoke cigarettes?• On the past 30 days, on the days that you did smoke, about how many cigarettes did
you usually smoke?
For occasional smokers, daily consumption was computed as the number of days smokedtimes the number of cigarettes/day usually smoked, divided by 30 days. The result wasunder 15 cigarettes per day for all occasional smokers, so for the present analysis theywere included in the group of light smokers.
Figure 6.1 provides strong evidence of progress inreducing the addiction level of smokers. In 1990,43.6±1.7% of all current smokers were light smokers.This percentage only increased slightly in 1992, but
In 1996, nearly 60% ofsmokers smoked fewer than15 cigarettes/day.

Smoking Cessation: California Smokers Are Trying To Quit
6-4
between 1996 and 1999 it increased by a factor of 7.8%, from 55.1±1.4% in 1996 to59.4±1.7% in 1999. In 1999, about half of all light smokers were occasional smokers, anincrease by a factor of 36.2%since 1990.
Table 6.1 shows who are the light smokers in the California population of smokers.Significantly more women were light smokers than men in each year, but the gender gapis closing. Also, in each year, the majority of young adult smokers (18-24 year olds)were light smokers. However, the young adult group is the only group that did not showa significant increase in light smoking between 1996 and 1999. Further, minorities,particularly Hispanics, were significantly more likely than Non-Hispanic White smokersto be light smokers in each year. Light smokers are disproportionately representedamong those with less than a high school education and among college graduates, andthis difference was significant in 1999. The income groups showing the greatest relativeincreases in light smoking between 1996 and 1999 were those with household incomesbetween $10,000 and $20,000 and those with incomes over $75,000, but this trend wasnot statistically significant.
0
20
40
60
80
1990 1992 1996 1999
% C
urr
ent
Sm
oke
rs
Occasional Smokers All Light Smokers
Light Smoking (<15 Cigarettes/Day) Among Current Smokers
Source: CTS 1990, 1992, 1996, 1999 Figure 6.1
1990 1992 1996 1999
Occasional Smokers 16.8±1.4 17.7±1.8 24.6±1.5 29.0±1.8
All Light Smokers 43.6±1.7 44.1±3.7 55.1±1.4 59.4±1.7

Smoking Cessation: California Smokers Are Trying To Quit
6-5
Table 6.1Percentage of Current California Smokers Smoking <15 Cigarettes/Day
1990%
1992%
1996%
1999%
FactorChange1996-1999
%Overall 43.6 (±1.7) 44.1 (±3.7) 55.1 (±1.4) 59.4 (±1.7) 7.8Sex Male 39.8 (±2.0) 42.4 (±3.6) 53.1 (±1.9) 58.0 (±2.1) 9.2 Female 48.3 (±2.3) 46.2 (±5.1) 57.8 (±1.8) 61.3 (±2.5) 6.1Age (years) 18-24 59.5 (±4.4) 59.2 (±8.8) 75.4 (±3.2) 75.5 (±3.2) 0.1 25-44 44.7 (±1.9) 44.5 (±4.8) 58.2 (±1.8) 63.1 (±2.5) 8.4 45-64 33.9 (±3.2) 32.1 (±3.8) 41.5 (±2.6) 45.8 (±3.4) 10.4 65+ 36.9 (±4.4) 45.0 (±7.1) 40.6 (±4.3) 48.4 (±7.4) 19.2Race/ethnicity African American 64.7 (±6.4) 65.5 (±7.3) 69.6 (±4.0) 76.3 (±4.7) 9.6 Asian/PI 59.6 (±10.4) 60.6 (±12.2) 67.2 (±6.4) 71.9 (±6.6) 7.0 Hispanic 73.0 (±3.3) 70.7 (±6.0) 80.7 (±2.8) 81.5 (±2.6) 1.0 Non-Hispanic White 32.0 (±1.5) 34.0 (±3.2) 42.7 (±1.7) 46.8 (±2.3) 9.6Education Less than 12 years 46.3 (±4.2) 45.6 (±15.4) 59.5 (±3.5) 65.7 (±4.3) 10.4 High school graduate 41.7 (±2.5) 42.5 (±3.1) 50.5 (±2.0) 52.8 (±3.0) 4.6 Some college 42.6 (±2.5) 42.6 (±3.6) 54.5 (±2.8) 58.8 (±2.3) 7.9 College graduate 45.1 (±3.6) 48.5 (±4.9) 58.8 (±2.8) 64.6 (±3.7) 9.9Income <$10,000 52.7 (±5.9) 55.2 (±3.5) 54.7 (±5.1) -0.9 $10,001-$20,000 47.3 (±4.6) 58.5 (±3.3) 67.1 (±4.5) 14.7 $20,001-$30,000 43.2 (±4.0) 55.6 (±3.6) 58.8 (±4.5) 5.8 $30,001-$50,000 38.7 (±3.5) 53.7 (±3.0) 55.9 (±4.0) 4.1 $50,001-$75,000 38.1 (±3.4) 53.9 (±3.1) 54.6 (±3.0) 1.3 >$75,000 43.6 (±4.6) 54.4 (±4.4) 61.1 (±3.9) 12.3 Unknown 44.4 (±4.3) 54.8 (±4.7) 67.0 (±5.5) 22.3
Table entries are weighted percentages and 95% confidence limits.Source: CTS 1990, 1992, 1996, 1999

Smoking Cessation: California Smokers Are Trying To Quit
6-6
The differences in the rate of light smoking among racial/ethnic groups is partlyaccounted for by occasional smoking (Figure 6.2). Although there were no significantdifferences within racial/ethnic groups by gender in 1999, Hispanics show the highestrates of occasional smoking, and non-Hispanic whites show the lowest rates.
Recent Quitting History
To track the percentage of California smokers trying to quit, each CTS asked:
Were you smoking at all around this time 12 months ago?
Former smokers who answered yes were considered to have made a great attempt in thepast year. Current smokers were asked:
During the past 12 months, have you quit smoking intentionally for one day or longer?
To compute the percentage of smokers making a quit attempt in the past year, thedenominator included all current smokers and former smokers who were smoking 12months ago; and the numerator included these former smokers and the current smokerswho answered yes to the question about quitting for a day or longer. A more completedescription of exactly how this group is defined is given in the technical report (Gilpin etal., 2001).
Figure 6.3 shows the percentage of smokers in the last year who made a quit attempt thatlasted at least a day for each CTS. Quitting declined between 1990 and 1992, butincreased markedly by 1996, and again by 1999. Overall, the percentage of smokers inthe past year who made a quit attempt lasting a day or longer increased by a factor of
0
10
20
30
40
50
60
% O
ccas
ion
al
Male Female
Percent of Current Smokers Who Do Not Smoke Everyday
African American Asian/PI Hispanic Non-HispanicWhite
Source: CTS 1999 Figure 6.2
African American Asian/PI Hispanic Non-Hispanic White
Male 34.2 29.2 48.4 21.1
Female 31.2 37.8 44.5 20.6

Smoking Cessation: California Smokers Are Trying To Quit
6-7
25.9% from 1990 to 1999. The fact that over 60% of California smokers made a quitattempt in 1999 suggests that the TCP may be helping to motivate smokers to at least tryto quit.
The demographics of smokers trying to quit arepresented in Table 6.2. Before 1999, there was littledifference in the quit attempt rate for men andwomen, but the difference approached significance in1999. In all years, smokers under the age of 45 years
were more likely to try to quit than older smokers. Also, minorities had higher attemptrates than Non-Hispanic Whites. With one exception in 1996, when high schoolgraduates quit less than other educational groups, there were no significant differences inthe rates of quitting a day or longer among either education or household income groups.
Over the decade, attempts toquit among Californiasmokers increased by afactor of over 25%
61.5
56.0
38.1
48.9
-
10.0
20.0
30.0
40.0
50.0
60.0
70.0
1990 1992 1996 1999
%
Source: CTS 1990, 1992, 1996, 1999 Figure 6.3
Quit Attempts Among Smokers in the Last Year

Smoking Cessation: California Smokers Are Trying To Quit
6-8
2. Indication of Successful Quitting
The increase over the decade in the percentage of smokers in the last year making quitattempts is encouraging, but the important variable for the TCP is successful cessation. Inorder to accurately determine the percent of smokers who attempt a quit and go on toachieve longer-term success, an actuarial survival model was employed, using data fromthe 1990, 1996 and 1999 CTS. This analysis considered the length of the smokers’ mostrecent quit attempts in the last year. For more details, see the technical documentation(Gilpin et al., 2001).
Table 6.2Percent of Smokers in the Last Year
Who Made a Quit Attempt of One or More Days.
1990%
1992%
1996%
1999%
FactorIncrease
1990-1999%
Overall 48.9 (±1.5) 38.1 (±2.0) 56.0 (±1.1) 61.5 (±1.5) 25.9Sex Male 49.7 (±2.5) 38.9 (±2.8) 57.0 (±1.7) 62.9 (±2.2) 26.4
Female 47.8 (±1.9) 37.0 (±2.8) 54.7 (±1.7) 59.7 (±2.3) 24.8Age (years) 18-24 62.2 (±3.0) 45.8(±9.3) 75.2 (±3.1) 78.9 (±3.3) 26.8 25-44 49.6 (±2.2) 37.3 (±2.3) 57.2 (±1.9) 63.1 (±2.3) 27.4 45-64 42.0 (±2.8) 36.4 (±3.8) 45.7 (±1.7) 50.8 (±3.1) 20.9 65+ 39.0 (±5.0) 32.1 (±4.8) 44.1 (±4.1) 48.1 (±6.0) 23.2Race/Ethnicity African American 59.0 (±6.8) 45.6 (±7.8) 62.3 (±5.5) 70.6 (±5.5) 19.6 Asian/PI 51.1 (±8.6) 46.0 (±11.8) 59.3. (±5.1) 65.5 (±5.3) 28.2 Hispanic 57.7 (±4.7) 39.2 (±7.6) 66.4 (±2.7) 67.3(±3.5) 16.6 Non-Hispanic White 45.1 (±1.4) 36.1 (±3.1) 51.0 (±1.4) 58.0 (±1.8) 28.5 Education Less than 12 years 48.6 (±3.9) 35.7 (±4.7) 59.2 (±2.9) 63.0 (±4.4) 29.7 High school graduate 47.8 (±2.0) 37.0 (±3.6) 51.6 (±2.0) 60.6 (±2.5) 26.9 Some college 51.8 (±2.8) 41.7 (±2.8) 56.8 (±2.2) 61.8 (±2.3) 18.3 College graduate 47.3 (±3.1) 40.3 (±4.4) 58.4 (±3.0) 60.7 (±2.9) 28.3Income <$10,000 48.0 (±4.3) 54.3 (±3.6) 60.4 (±4.5) 25.8 $10,001-$20,000 50.2 (±4.0) 60.3 (±3.8) 64.5 (±3.8) 28.4 $20,001-$30,000 47.8 (±3.2) 55.5 (±3.7) 62.2 (±3.9) 30.1 $30,001-$50,000 49.9 (±3.5) 56.0 (±2.2) 59.2 (±3.9) 18.6 $50,001-$75,000 52.4 (±4.6) 54.9 (±3.8) 60.8 (±4.0) 16.1 >$75,000 46.3 (±4.7) 56.0 (±4.5) 62.9 (±3.2) 35.8 Unknown 45.9 (±5.1) 53.6 (±3.8) 60.8 (±5.8) 32.4
Table entries are weighted percentages and 95% confidence limits.Source: CTS 1990, 1992, 1996, 1999

Smoking Cessation: California Smokers Are Trying To Quit
6-9
Figure 6.4 shows that in 1999 smokers who tried to quit were indeed staying offcigarettes longer than smokers did in 1996 or 1990. While the difference in thepercentage still abstinent up to 120 days was significant, the curves clearly tended toconverge and thereafter the difference was no longer significant. At 180 days, thepercent still abstinent for 1996 and 1999 was slightly below the percent for 1990, and thisdifference persisted through the remainder of the year (results not shown). Thus, therewas no evidence that quitters in 1999 relapse at much higher rates later in the year thanquitters in 1990 or 1996.
These findings suggest that in 1999, California smokers were finding it easier to stay offcigarettes for a week or two than previously. However, there did not appear to be anydifference in the ultimate success rate. Since today’s smokers trying to quit appeared tobe about as successful as smokers trying to quit earlier in the decade, this is still animportant finding. In time, assuming that initiation does not increase, the increase insmokers trying to quit, with equivalent success, should lead to lower population smokingprevalence in California.
0102030405060708090
100
0 30 60 90 120 150 180
Time (days)
% A
bst
inen
t
1990 1996 1999
Relapse Following Most Recent Quit Attemptfor Smokers in Last Year
Source: CTS 1990, 1996, 1999 Figure 6.4
Time (days)0 1 7 15 30 60 90 120 150 180
1990 100 86.9. 50.7 41.3 33.1 27.7 23.9 22.2 21.8 20.61996 100 88.9 56.0 44.9 34.8 28.2 23.1 21.1 20.2 17.71999 100 89.7 58.2 47.4 35.3 29.0 23.7 21.0 19.8 17.5

Smoking Cessation: California Smokers Are Trying To Quit
6-10
An early measure of successful quitting is the percentage of quitters who are able tomaintain a quit attempt for at least 90 days (Gilpin et al, 1997). Using the same type ofactuarial analysis as for Figure 6.4, but restricted to demographic groups, yields the 90-day successful cessation rates presented in Table 6.3.
Table 6.3Successful Quitting (≥≥90 Days of Abstinence) for Most Recent Quit Attempt
Among Smokers in the Last Year
1990%
1996%
1999%
Factor Change1990-1999
%Overall 23.9 (±2.2) 23.1 (±1.7) 23.7 (±1.8) -0.8Sex
Male 20.5 (±2.3) 21.1 (±2.4) 22.9 (±2.6) 11.7Female 28.0 (±4.0) 25.8 (±2.2) 25.0 (±2.8) -10.7
Age (years)18-24 28.0 (±6.1) 23.0 (±4.7) 19.1 (±2.8) -31.825-44 20.9 (±2.1) 22.5 (±2.2) 24.4 (±2.6) 16.745-64 26.1 (±4.4) 22.6 (±2.8) 26.2 (±5.9) 0.465+ 28.3 (±7.4) 31.5 (±7.4) 25.6 (±6.1) -9.5
Race/EthnicityAfrican American 18.5 (±8.0) 17.5 (±5.0) 18.2 (±6.1) -1.6Asian/PI 23.3 (±7.9) 22.2 (±8.4) 27.1 (±11.2) 16.3Hispanic 28.0 (±6.8) 22.3 (±4.3) 23.7 (±3.9) -15.4Non-Hispanic White 24.1 (±2.3) 25.3 (±1.8) 24.5 (± 2.1) 1.7
EducationLess than 12 years 22.4 (±5.8) 20.5 (±3.6) 25.2 (±5.5) 12.5
High school graduate 23.6 (±3.8) 21.1 (±3.4) 21.8 (±2.6) -7.6Some college 23.6 (±3.0) 24.4 (±3.3) 24.6 (±2.5) 4.2College graduate 28.6 (±4.8) 28.1 (±3.7) 23.8 (±3.8) -16.8
Income<$10,000 25.5 (±9.5) 20.5 (±4.2) 26.5 (±7.9) 3.9
$10,001-$20,000 22.7 (±4.7) 19.2 (±4.3) 23.5 (±5.5) 3.5$20,001-$30,000 22.8 (±4.5) 21.8 (±4.0) 22.8 (±4.5) 0.0$30,001-$50,000 21.7 (±3.2) 24.1 (±3.8) 19.5 (±3.1) -10.1
$50,001-$75,000 25.8 (±6.1) 25.3 (±4.7) 23.4 (±4.5) -9.3>$75,000 32.3 (±7.8) 28.4 (±5.4) 27.3(±4.8) -15.5
Unknown 20.7 (±5.3) 23.3 (±5.9) 25.0 (±6.5) 20.8Table entries are weighted and 95% confidence limits.Source: CTS 1990, 1996, 1999
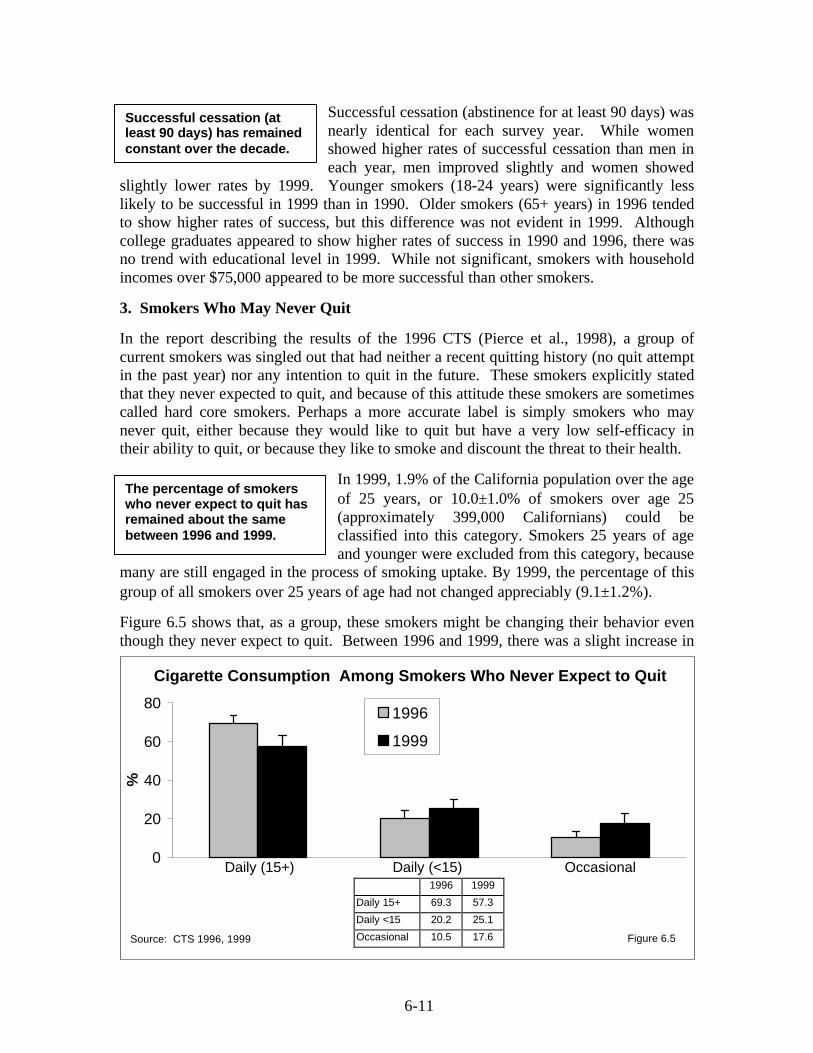
6-11
Successful cessation (abstinence for at least 90 days) wasnearly identical for each survey year. While womenshowed higher rates of successful cessation than men ineach year, men improved slightly and women showed
slightly lower rates by 1999. Younger smokers (18-24 years) were significantly lesslikely to be successful in 1999 than in 1990. Older smokers (65+ years) in 1996 tendedto show higher rates of success, but this difference was not evident in 1999. Althoughcollege graduates appeared to show higher rates of success in 1990 and 1996, there wasno trend with educational level in 1999. While not significant, smokers with householdincomes over $75,000 appeared to be more successful than other smokers.
3. Smokers Who May Never Quit
In the report describing the results of the 1996 CTS (Pierce et al., 1998), a group ofcurrent smokers was singled out that had neither a recent quitting history (no quit attemptin the past year) nor any intention to quit in the future. These smokers explicitly statedthat they never expected to quit, and because of this attitude these smokers are sometimescalled hard core smokers. Perhaps a more accurate label is simply smokers who maynever quit, either because they would like to quit but have a very low self-efficacy intheir ability to quit, or because they like to smoke and discount the threat to their health.
In 1999, 1.9% of the California population over the ageof 25 years, or 10.0±1.0% of smokers over age 25(approximately 399,000 Californians) could beclassified into this category. Smokers 25 years of ageand younger were excluded from this category, because
many are still engaged in the process of smoking uptake. By 1999, the percentage of thisgroup of all smokers over 25 years of age had not changed appreciably (9.1±1.2%).
Figure 6.5 shows that, as a group, these smokers might be changing their behavior eventhough they never expect to quit. Between 1996 and 1999, there was a slight increase in
0
20
40
60
80
%
1996
1999
Cigarette Consumption Among Smokers Who Never Expect to Quit
Source: CTS 1996, 1999 Figure 6.5
Daily (15+) Daily (<15) Occasional
The percentage of smokerswho never expect to quit hasremained about the samebetween 1996 and 1999.
Successful cessation (atleast 90 days) has remainedconstant over the decade.
1996 1999
Daily 15+ 69.3 57.3
Daily <15 20.2 25.1
Occasional 10.5 17.6

Smoking Cessation: California Smokers Are Trying To Quit
6-12
the percentage of daily smokers in the group that smoked fewer than 15 cigarettes a day,and there was also a significant increase in the percentage who were occasional smokers.Some smokers may feel that they have reduced their consumption sufficiently for healthor social reasons so that they don't need to quit. While occasional smokers may think thethreat to their health is minimal, recent data indicate that even occasional smokers havean increased rate of adverse health outcomes compared to never smokers (Luoto et al.,2000).
The demographics of the group who has not tried to quit in the past year and says it neverexpects to quit are shown in Table 6.4. In both 1996 and 1999, a significantly higherpercentage of men are in this group. Among smokers 65 years of age and older, the
Table 6.4Smokers > 25 Years of Age Who Never Expect to Quit
1996%
1999%
FactorChange
1996-1999%
Overall 10.0 (±1.0) 9.1 (±1.2) -9.0Sex Male 11.1 (±1.3) 9.9 (±1.7) -10.8 Female 8.7 (±1.2) 8.1 (±1.4) -6.9Age (years) 26-44 5.9 (±1.0) 5.1 (±1.0) -13.6 45-64 13.1 (±1.8) 12.7 (±2.3) -3.1 65+ 27.0 (±3.6) 22.0 (±5.5) -18.5Race/ethnicity African American 4.6 (±1.8) 3.0 (±2.2) -34.8 Asian/PI 7.3 (±3.2) 7.7 (±3.4) -5.5 Hispanic 7.1 (±1.7) 6.5 (±2.2) -8.5 Non-Hispanic White 11.8 (±1.2) 11.0 (±1.4) -6.8 Education Less than 12 years 11.1 (±2.8) 9.3 (±3.3) -16.2 High school graduate 10.8 (±1.7) 9.3 (±2.0) -13.9 Some college 8.1 (±1.1) 9.0 (±1.5) 11.1 College graduate 10.3 (±2.1) 8.9 (±2.1) -13.6Income <$10,000 13.8 (±3.9) 10.3 (±3.7) -25.4 $10,001-$20,000 8.8 (±1.6) 10.3 (±3.4) 17.0 $20,001-$30,000 10.4 (±2.4) 8.7 (±2.4) -16.3 $30,001-$50,000 9.7 (±1.8) 10.1 (±2.3) 4.1 $50,001-$75,000 6.4 (±1.7) 7.7 (±2.3) 20.3 >$75,000 9.7 (±2.5) 7.1 (±1.8) -26.8 Unknown 13.3 (±4.1) 10.9 (±5.4) -18.0
Table entries are weighted percentages and 95% confidence limits.Source: CTS 1996, 1999

Smoking Cessation: California Smokers Are Trying To Quit
6-13
percentage in this group was very high. Non-Hispanic Whites were more likely to neverexpect to quit than minorities. While in 1996, the very low household income group(<$10,000/year) had the highest rate of smokers in this group, the pattern was less clearin 1999.
4. The Role of Workplace and Home Smoking Bans
As mentioned in Chapter 3, there is evidence that smokers who work or live where thereis a ban on smoking may be more likely to be modifying their smoking behavior in waysthat will increase the probability of successful cessation in the future (Gilpin et al., 1999;Farkas et al., 1999). The inconvenience of not being able to smoke whenever they desiremay motivate smokers to try to quit. As they spend a significant portion of their day inan environment where they cannot smoke, some smokers will naturally consume fewercigarettes.
Data from the 1999 CTS that illustrate this association are included in Figure 6.6. Thefigure shows the percentage of smokers with the behavior according to whether theyneither live nor work under smoking bans, whether they live or work with smoking bans(one, but not both), or whether they both live and work with such bans. In this analysis,smokers who are not employed or who are not indoor workers are considered not to beworking under smoking bans. The likelihood a smoker (includes former smokers) madea quit attempt in the past year was significantly higher if the smoker either lived orworked where there were smoking bans, particularly if they experienced both types ofbans. This same pattern was observed for current smokers with respect to light cigarette
0
10
20
30
40
50
60
70
80
90
Any quit Light smoking Never expect to quit
% C
urr
ent
Sm
oke
rs
Neither Either Both
Smoking Bans at Work and at Home and Quitting Behavior in 1999
Source: CTS 1999 Figure 6.6
Neither Either Both
Any quit 53.3 61.4 71.2
Light smoking 41.8 62.8 75.5
Never expect to quit 47.5 44.3 8.2

Smoking Cessation: California Smokers Are Trying To Quit
6-14
smoking (<15 cigarettes/day). In contrast, very few of the smokers who never expect toquit (see Section 3) experienced both types of smoking bans.
Figure 6.7 shows that the percentage of Californiasmokers who experience smoking bans in theworkplace or the home has increased markedly from1992. In 1992, only 3.0±0.7% of California smokersboth worked and lived where they couldn’t smoke
indoors, and this percentage increased by a factor of 690% to 23.7±1.2% by 1999.
The demographics of smokers who both live and work under smoking bans are presentedin Table 6.5. In 1996, significantly fewer women experienced smoking bans both atwork and at home, but this difference disappeared by 1999. Younger smokers weresignificantly more likely to experience dual bans than older smokers, which may helpkeep them from building nicotine tolerance. Many smokers over the age of 65 are nolonger in the workforce, so they would only possibly be subject to smokefree homes. In1999, smokers aged 25 to 44 years are the most likely to have bans at home, perhaps toprotect the health of their young children (Farkas et al., 1999; Gilpin et al., 1999). Asianswere the most likely to have smoking bans both at work and at home, and the percentagewas also high among Hispanics; these ethnic differences were statistically significant.Both higher education and higher household income were associated with increasedlevels of dual smoking bans.
01020304050607080
Neither Either Both
% C
urr
ent
Sm
oke
rs 199219961999
Current Smokers and Smoking Bans at Home and in the Workplace
Source: CTS 1992, 1996, 1999 Figure 6.7
1992 1996 1999
Neither 67.0 35.6 30.6
Either 30.0 46.3 45.7
Both 3.0 18.0 23.7
In 1999, nearly a quarter ofCalifornia smokers bothworked and lived insmokefree environments.

Smoking Cessation: California Smokers Are Trying To Quit
6-15
5. Smoking Cessation Assistance
In the 1980s, only about 10% of smokers sought assistance when they tried to quit (Zhuet al., 1999), but by 1996 in California, the percentage seeking assistance approached20% (Pierce et al, 1998; Zhu et al, 2000). Assistance might be anything from obtainingself-help materials, participating in group counseling or a commercial or public-servicesmoking cessation program, having one-on-one counseling, or using medications such asnicotine replacement therapy or antidepressants.
Table 6.5Smokers Both Working and Living with Complete Bans on Smoking
1992%
1996%
1999%
Overall 3.0 (±0.7) 18.0 (±1.1) 23.7 (±1.2)Sex Male 3.6 (±1.0) 20.3 (±1.7) 24.0 (±1.9) Female 2.4 (±0.9) 15.0 (±1.4) 23.3 (±1.9)Age (years) 18-24 3.8 (±2.8) 23.8 (±3.6) 27.5 (±3.4) 25-44 3.7 (±1.0) 20.9 (±1.6) 28.3 (±1.7) 45-64 2.1 (±0.9) 13.4 (±2.1) 18.3 (±2.5) 65+ 0.0 (±0.0) 1.8 (±1.0) 3.7 (±2.5)Race/ethnicity African American 2.4 (±2.3) 12.4 (±4.3) 20.2 (±5.9) Asian/PI 6.4 (±4.4) 23.4 (±5.6) 33.4 (±7.4) Hispanic 3.1 (±1.7) 26.2 (±3.6) 30.4 (±2.9) Non-Hispanic White 2.9 (±0.9) 15.6 (±0.8) 20.9 (±1.4) Education Less than 12 years 1.6 (±1.6) 15.3 (±3.1) 20.6 (±4.3) High school graduate 2.0 (±1.0) 15.7 (±2.2) 20.7 (±2.0) Some college 4.1 (±1.4) 19.8 (±1.9) 24.6 (±1.9) College graduate 7.6 (±2.2) 24.0 (±2.5) 33.2 (±3.7)Income <$10,000 10.1 (±2.6) 13.1 (±3.8) $10,001-$20,000 15.2 (±2.8) 20.0 (±3.6) $20,001-$30,000 15.5 (±3.6) 23.1 (±3.7) $30,001-$50,000 18.6 (±2.3) 22.7 (±2.9) $50,001-$75,000 22.3 (±3.4) 24.1 (±2.5) >$75,000 28.1 (±4.0) 36.5 (±3.5) Unknown 17.4 (±4.3) 21.8 (±4.8)
Table entries are weighted percentages and 95% confidence intervals.Source: CTS 1992, 1996, 1999

Smoking Cessation: California Smokers Are Trying To Quit
6-16
Nicotine polyacrilex gum became available for use by prescription in the mid 1980s, andwas made available without a physician’s prescription beginning in 1996. The nicotinetransdermal delivery system, the “nicotine patch,” became available for use byprescription in January 1992 and “over the counter” in July 1996. In 1999, physicianscould prescribe a nicotine inhalant. In 1996, the Agency for Health Care Policy Researchreleased guidelines for smoking cessation, recommending that cessation interventionsinclude nicotine replacement therapies whenever appropriate (Fiore et al., 1996). In thelast few years, the use of Zyban, or bupropion, has been investigated for controllingmood and relieving withdrawal symptoms and was shown to increase the chance forsuccessful cessation (Jorenby et al., 1999).
The 1992, 1993, 1996 and 1999 CTS asked smokers who had tried to quit in the last yearthe following question concerning the use of cessation assistance with their most recentquit attempt:
• Did you use counseling advice or self-help materials to adjust to life withoutcigarettes? (all CTS)
• For this last quit attempt, did you use a nicotine substitute such as…? (1996 and1999 CTS)
• For this last quit attempt, did you use an antidepressant prescribed by yourphysician to help you to quit such as…? (1999 CTS)
For those who indicated they had assistance, further questions probed the use of groupcounseling, one-on-one counseling, self-help materials, nicotine gum or the patch, and, in1999, the use of a nicotine inhalant and of antidepressants such as Zyban.
In 1992, 18.4±2.4% of California smokers usedcessation assistance with their most recent quitattempt. This percentage increased slightly to19.2±1.3% in 1993, increased slightly again to19.8±1.4% by 1996, and increased again
significantly by 1999 to 22.4±1.8%, a factor increase of 21.7% from 1992 to 1999.
Figure 6.8 shows the use of nicotine replacement, with or without counseling or self-helpmaterials, for the most recent quit attempt in 1996 and 1999. For consistency, smokersusing antidepressants in 1999 are omitted from the analysis. The recommended practicewhen using nicotine replacement therapy is to combine it with counseling or self-help(Fiore et al., 1990; Orleans et al., 1994). While in 1996, smokers were significantly morelikely to adhere to this practice, in 1999, they were equally likely to opt for nicotinereplacement therapy alone as with counseling.
In 1999, 22.4±1.8% of smokerstrying to quit used some form ofcessation assistance, an increaseby a factor of 22% since 1992.

Smoking Cessation: California Smokers Are Trying To Quit
6-17
Smokers could name more than one cessation aid product, and in 1999, 5.6±1.0%reported the use of nicotine gum, 10.9±1.2% the use of a nicotine patch, and norespondent reported using a nicotine inhalant. Of those using nicotine replacementtherapy, 14.3±2.9% also reported using an antidepressant; 3.8±0.9% used anantidepressant without nicotine replacement, for an overall rate of antidepressant use of5.3±0.9% (Zyban [3.3±0.6%], Prozac [0.6±0.3%] and others [1.9±0.5%]).
Table 6.6 shows the use of nicotine replacementtherapy by demographic groups of smokers from the1996 and 1999 CTS, regardless of whether they alsoobtained counseling, used self-help materials or in1999 used antidepressants. Overall, the use of
nicotine replacement increased slightly but significantly between 1996 (12.7±1.1%) and1999 (14.2±1.3%). As a point of reference, 9.3±1.8% of quitters used nicotinereplacement in 1992, before it was available over the counter. While nicotinereplacement became more popular with younger smokers, it appears to have lost favorwith smokers age 65 years and older. Non-Hispanic Whites continued to showsignificantly higher rates of nicotine replacement therapy use than minorities. Use ofnicotine replacement therapy was significantly more prevalent as education levelincreased, and smokers with higher household incomes appeared more likely to opt fornicotine replacement, but this trend was not statistically significant.
0
2
4
6
8
10
%
1996 1999
Use of Smoking Cessation Assistance for Most Recent Quit Attempt
Source: CTS 1996, 1999 Figure 6.8
Counseling/self-help only
Nicotine replacement
only
Both
1996 1999
Counseling/self-help only 7.1 5.7
Nicotine replacement only 5.6 7.1
Both 7.1 7.2
In 1999, 14.2±1.3% of smokerstrying to quit used nicotinereplacement and 5.3±0.9%used antidepressants.

Smoking Cessation: California Smokers Are Trying To Quit
6-18
Table 6.6Use of Nicotine Replacement for Most Recent Quit Attempt
Among Smokers in the Last Year
1996%
1999%
Factor Change1996-1999
%Overall 12.7 (±1.1) 14.2 (±1.3) 11.8Sex Male 11.2 (±1.4) 13.4 (±1.8) 19.6 Female 14.7 (±1.8) 15.4 (±2.1) 4.8Age (years) 18-24 2.9 (±1.0) 5.7 (±1.7) 96.6 25-44 12.8 (±1.4) 14.7 (±1.9) 14.8 45-64 18.8 (±2.7) 20.5 (±3.8) 9.0 65+ 24.6 (±5.5) 19.3 (±5.9) -21.5Race/ethnicity African American 7.7 (±3.2) 8.7 (±3.6) 13.0 Asian/PI 11.0 (±6.1) 9.9 (±7.2) -10.9 Hispanic 5.6 (±2.1) 6.7 (±2.6) 19.6 Non-Hispanic White 17.1 (±1.4) 19.2 (±1.7) 12.3 Education Less than 12 years 9.1 (±2.7) 10.2 (±2.8) 12.0 High school graduate 12.8 (±1.8) 14.7 (±2.2) 14.8 Some college 13.0 (±2.1) 16.0 (±2.3) 23.1 College graduate 17.7 (±3.2) 16.1 (±2.4) -0.9Income <$10,000 8.8 (±2.4) 12.0 (±5.3) 36.4 $10,001-$20,000 11.5 (±2.9) 11.4 (±3.7) 0.1 $20,001-$30,000 9.0 (±2.2) 14.1 (±3.9) 56.7 $30,001-$50,000 14.4 (±2.9) 16.4 (±3.2) 13.9 $50,001-$75,000 14.9 (±3.1) 16.4 (±2.7) 10.0 >$75,000 18.0 (±3.8) 15.9 (±3.0) -11.7 Unknown 12.1 (±3.3) 10.0 (±3.1) -17.4
Table entries are weighted percentages and 95% confidence limits.Source: CTS 1996, 1999

Smoking Cessation: California Smokers Are Trying To Quit
6-19
The 1999 CTS asked all quitters more information about their use of nicotinereplacement and antidepressants.
• Who paid for your (nicotine replacement/antidepressant)?• Would you recommend (nicotine replacement/antidepressant) to a friend?• How long did you use (nicotine replacement/antidepressant)?
Table 6.7 shows the overall results for these questions.It also shows use of these aids by reported dailycigarette consumption one year before the survey. Useof nicotine replacement and antidepressants is muchmore prevalent among smokers who were smoking at
least a pack of cigarettes per day a year before being surveyed. This result is consistentwith previous studies that indicate that it is the more addicted smokers that seek smokingcessation assistance of all types (Fiore et al., 1996; Pierce et al., 1995; Zhu et al., 2000).
Most smokers are paying for nicotine replacement therapy completely by themselves, butbecause antidepressants must be obtained with a physician’s prescription, it appears thatsome smokers’ insurance plans cover these drugs. The vast majority of smokers whohave used nicotine replacement say they would recommend it to a friend, but smokerswere less enthusiastic about antidepressants. Not surprisingly, those who were stillabstinent at the time of the survey had a more favorable view of these smoking cessationaids than those who had relapsed. Finally, on average smokers are using these aids for
Table 6.7Details of Users of Cessation Aids in 1999
Nicotine Replacement%
Antidepressants%
Consumption a year ago <20 cigarettes/day 9.3 (±1.5) 3.2 (±1.1) >20 cigarettes/day 26.8 (±2.9) 10.4 (±1.8)Who paid for aid Smoker completely 55.9 (±4.0) 36.0 (±7.1) Insurance completely 5.7 (±2.9) 23.7 (±7.2) Both partially 5.3 (±2.0) 31.6 (±9.0) Unknown 33.2 (±4.9) 8.6 (±4.6)Would recommend aid to friend Overall 82.6 (±3.5) 61.0 (± 6.5) Former 93.6 (±4.4) 68.0 (±16.3) Current (relapsed) 79.3 (±4.1) 58.3 (±7.6)How long aid used Mean days 28.7 (±2.8) 25.0 (±4.5)
Table entries are weighted percentages and 95% confidence limits.Source: CTS 1999
In 1999, the use of a medicalaid for quitting was muchmore prevalent amongsmokers who smoked a packor more of cigarettes per day.
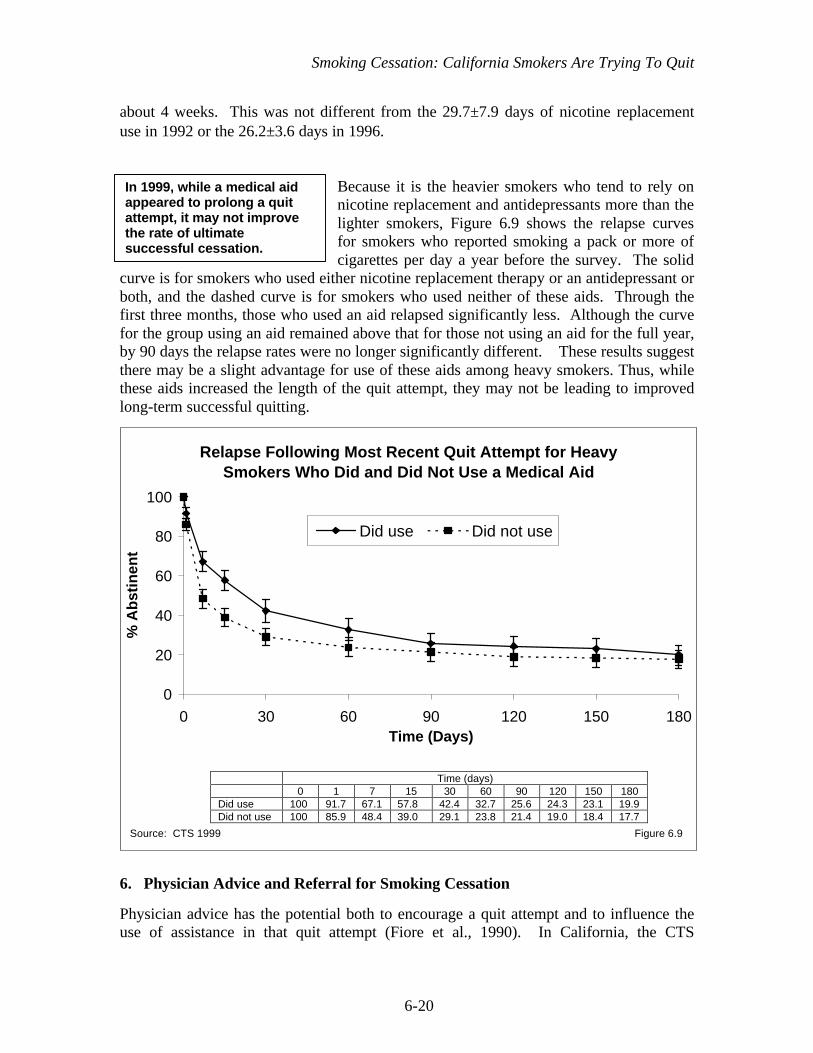
Smoking Cessation: California Smokers Are Trying To Quit
6-20
about 4 weeks. This was not different from the 29.7±7.9 days of nicotine replacementuse in 1992 or the 26.2±3.6 days in 1996.
Because it is the heavier smokers who tend to rely onnicotine replacement and antidepressants more than thelighter smokers, Figure 6.9 shows the relapse curvesfor smokers who reported smoking a pack or more ofcigarettes per day a year before the survey. The solid
curve is for smokers who used either nicotine replacement therapy or an antidepressant orboth, and the dashed curve is for smokers who used neither of these aids. Through thefirst three months, those who used an aid relapsed significantly less. Although the curvefor the group using an aid remained above that for those not using an aid for the full year,by 90 days the relapse rates were no longer significantly different. These results suggestthere may be a slight advantage for use of these aids among heavy smokers. Thus, whilethese aids increased the length of the quit attempt, they may not be leading to improvedlong-term successful quitting.
6. Physician Advice and Referral for Smoking Cessation
Physician advice has the potential both to encourage a quit attempt and to influence theuse of assistance in that quit attempt (Fiore et al., 1990). In California, the CTS
0
20
40
60
80
100
0 30 60 90 120 150 180Time (Days)
% A
bst
inen
t
Did use Did not use
Relapse Following Most Recent Quit Attempt for HeavySmokers Who Did and Did Not Use a Medical Aid
Source: CTS 1999 Figure 6.9
Time (days)0 1 7 15 30 60 90 120 150 180
Did use 100 91.7 67.1 57.8 42.4 32.7 25.6 24.3 23.1 19.9Did not use 100 85.9 48.4 39.0 29.1 23.8 21.4 19.0 18.4 17.7
In 1999, while a medical aidappeared to prolong a quitattempt, it may not improvethe rate of ultimatesuccessful cessation.

Smoking Cessation: California Smokers Are Trying To Quit
6-21
consistently indicate that about 70% of smokers visit their physician in any given year, sothere is a widespread opportunity for a brief physician intervention to encourage smokersto quit.
The 1990, 1992, 1996 and 1999 CTS asked all current and recent former smokers whohad visited a physician in the past year:
In the last 12 months did a doctor (in the last 12 months before you quit, did a doctor)advise you to stop smoking?
Further, in the 1996 and 1999 CTS, this group of smokers was also asked:
• In the last 12 months did a doctor (in the last 12 months before you quit, did adoctor) refer you to, or give you information on a smoking cessation program?
• Did you try to quit when your doctor advised you to stop smoking?
Figure 6.10 shows the percentage of Californiasmokers who reported they had received thisintervention from their physicians. Over the decade,physician advice to quit increased by a factor of 20.3%.The percentage who were also referred by their patientsto a cessation program increased from 27.8±3.6% in
1996 to 31.0±4.4% in 1999, a factor of 7.9%.
0
10
20
30
40
50
60
1990 1992 1996 1999
% A
dvi
sed
Advised Referred & advised
Smokers Advised by Their Physicians to Quit
Source: CTS 1990, 1992, 1996, 1999 Figure 6.10
1990 1992 1996 1999
Advised 37.8 39.4 43.3 45.5
Referred & advised 27.8 31.0
Over the decade, the percentof California smokers advisedto quit by their physiciansincreased by a factor of 20%.

Smoking Cessation: California Smokers Are Trying To Quit
6-22
The demographics of smokers reporting that they were advised to quit by their physiciansare shown in Table 6.8. In each year, slightly more women smokers than men smokerswere advised to quit, and advice increased significantly with age. Physicians appear to beadvising their smoking Hispanic patients to quit in ever-increasing numbers.
Table 6.8Physician Advice to Quit Among Smokers in the Last Year
With a Visit to a Physician in the Last Year
1990%
1992%
1996%
1999%
FactorIncrease
1990-1999%
Overall 37.8 (±2.9) 39.4 (±5.1) 43.3 (±2.3) 45.5 (±3.2) 20.4Sex Male 36.9 (±3.8) 37.7 (±6.3) 40.7 (±3.1) 44.5 (±4.3) 20.6 Female 38.8 (±4.1) 41.7 (±7.1) 46.8 (±3.5) 47.1 (±4.5) 21.4Age (years) 18-24 32.4 (±8.5) 32.4 (±21.1) 33.3 (±6.3) 39.4 (±6.5) 21.6 25-44 34.6 (±3.7) 35.9 (±7.1) 40.9 (±3.2) 41.8 (±4.7) 20.8 45-64 44.5 (±6.2) 49.6 (±11.4) 54.4 (±4.5) 54.8 (±5.5) 23.1 65+ 48.0 (±9.0) 54.6 (±15.5) 42.9 (±9.3) 53.6 (±12.2) 11.7Race/ethnicity African American 43.5 (±14.5) 28.7 (±16.0 47.9 (±9.9) 45.4 (±14.7) 4.4 Asian/PI 45.1 (±17.0) 41.2 (±18.9) 48.7 (±10.6) 52.1 (±13.5) 15.5 Hispanic 21.0 (±5.7) 29.4 (±16.6) 34.7 (±5.8) 37.0 (±7.4) 76.2 Non-Hispanic White 40.5 (±3.5) 42.1 (±5.3) 45.6 (±2.8) 47.2 (±3.0) 16.5 Education Less than 12 years 32.5 (±7.2) 32.6 (±18.2) 38.1 (±6.3) 49.1 (±9.9) 51.1 High school graduate 38.7 (±3.7) 39.8 (±9.3) 43.8 (±4.5) 45.0 (±5.1) 16.3 Some college 40.4 (±5.2) 45.6 (±6.3) 45.2 (±3.5) 46.8 (±4.7) 15.8 College graduate 39.7 (±7.9) 38.4 (±7.7) 45.4 (±4.8) 41.1 (±6.5) 5.4Income <$10,000 38.1 (±12.8) 31.2 (±7.7) 45.7 (±15.5) 19.9 $10,001-$20,000 31.2 (±7.9) 41.4 (±6.3) 42.9 (±8.6) 37.5 $20,001-$30,000 36.2 (±7.6) 36.7 (±5.7) 49.9 (±9.8) 37.8 $30,001-$50,000 38.9 (±5.2) 47.1 (±4.9) 45.9 (±6.2) 18.0 $50,001-$75,000 41.2 (±5.5) 46.8 (±6.4) 43.3 (±5.9) 5.1 >$75,000 32.5 (±9.0) 50.2 (±7.6) 45.5 (±7.3) 40.0 Unknown 43.7 (±8.4) 42.4 (±6.7) 46.3 (±9.4) 5.9Cigarette Consumption(current smokers) <20 cigarettes/day 30.0 (±3.8) 33.8 (±6.4) 40.6 (±2.8) 44.0 (±4.4) 46.7
≥20 cigarettes/day 47.9 (±4.6) 48.8 (±8.8) 50.9 (±4.7) 58.0 (±4.8) 21.1Table entries are weighted percentages and 95% confidence limits.Source: CTS 1990, 1992, 1996, 1999

Smoking Cessation: California Smokers Are Trying To Quit
6-23
While higher educated smokers were more likely to be advised in 1990, this trend hadlargely reversed by 1999. Studies have shown that smokers with high cigaretteconsumption tend to be advised more than other smokers (Frank et al., 1991; Gilpin et al.,1993). While this pattern was present in all the CTS, report of advice in 1999 wasincreased among smokers who smoke less, by a factor of 46.7%.
Physicians appear to be improving their approach, because in 1999 more smokers withadvice/referral stated that they tried to quit as a result. In 1996, 25.3±3.2% of smokersadvised to quit tried to quit, and this percentage increased to 33.4±4.3% in 1999.
Use of nicotine replacement therapy with the most recent quit attempt among smokersadvised to quit is higher than among smokers not advised to quit in the past year (Figure6.11). This is not surprising since it is the heavier smokers who tend to use nicotinereplacement therapy, and it is those smokers who are more likely to be advised to quit bytheir physicians. If the physician also referred the patient to a smoking cessationprogram, the use of nicotine replacement therapy with the most recent quit attempt waseven higher. Many smokers consider nicotine replacement to be a cessation program(Pierce et al., 1998). It should be noted that the most recent quit attempt may notcorrespond to the quit attempt prompted by the physician advice. These findings suggestthat smokers are discussing nicotine replacement therapy with their physicians. Whetherit was the physician or the patient that broached the subject is unknown.
22.9
17.5
10.4
34.3
15.2
8.2
0
10
20
30
40
50
% U
sed
Nic
oti
ne
Rep
lace
men
t T
her
apy
Use of Nicotine Replacement Therapy with Most RecentQuit Attempt and Physician Advice and Referral
Source: CTS 1996, 1999 Figure 6.11
Notadvised
Advised Advised& referred
Notadvised
Advised Advised& referred
1996 1999

Smoking Cessation: California Smokers Are Trying To Quit
6-24
7. Summary
The past decade of the California Tobacco Control Program (TCP) has producedimportant changes in smoking behavior. Current smokers are continuing to decrease theirdaily cigarette consumption. In 1999, 59.4±1.7% of current smokers smoked fewer than15 cigarettes/day, a 7.8% factor increase in light smoking since 1996. More and moreCalifornia smokers are trying to quit. The percentage of smokers with a quit attemptlasting a day or longer in the past year has increased by a factor of 25.9% between 1990and 1999.
With the increase in the number of smokers trying to quit, it might be expected that therewould be a smaller fraction of smokers actually successfully quitting, since an increasedfraction of the more addicted smokers would be trying and failing. However, there is noevidence to support this assumption. In 1999, while the short–term success rate actuallyappeared to be slightly better, the longer-term success rate of quitters was not differentfrom that of quitters in 1990 or 1996.
Nevertheless, there is a certain fraction of smokers that never intend to quit, and whohave not tried to quit in the recent past. There is no evidence that this fraction ofCalifornia smokers is increasing as smokers more able to quit successfully do so. In1996, this group comprised 10.0±1.0% of all current smokers, and in 1999, it comprised9.1±1.2% of all current smokers. Some of the smokers who never intend to quit may feelthat they don’t need to quit, because they have modified their smoking behavior bysmoking less or by smoking occasionally rather than daily.
More and more California smokers both work and live in places where they cannotsmoke indoors. In 1992, only 3.0±0.7% of California smokers fell into this category, butby 1999, 23.7±1.2% did. With a more limited opportunity to smoke, these smokers havereduced their daily cigarette consumption, and many more have made quit attempts in therecent past compared to smokers not constrained by smoking restrictions.
Use of smoking cessation assistance has increased by a factor of 21.7% from 1992 to1999. In 1992, 9.3±1.8% of smokers used nicotine replacement therapy; this percentageincreased to 12.7±1.1% in 1996 and to 14.2±1.3% by 1999. Smokers with relatively highdaily cigarette consumption (20+ cigarettes/day) are more likely to use a medical aid(nicotine replacement therapy or an antidepressant). Such an aid appears to prolongabstinence in this group, but it may not increase the rate of ultimate success in thepopulation of smokers trying to quit.
Physician advice to quit smoking is an intervention with the potential to reach about 70%of smokers in each year. While report of physician advice to quit has increased by afactor of 20.3% since 1990, in 1999 less than half (45.5±3.2%) of California smokerswho visited a physician reported receiving that advice. About 30% of smokers whoreported that their physician advised them to quit also reported the physician had toldthem about a smoking cessation program or made a referral to such a program. Smokersreporting this type of referral were more likely to say they quit in response to their

Smoking Cessation: California Smokers Are Trying To Quit
6-25
physicians’ advice. Physicians who do advise their patients to quit might be becomingmore skilled in their delivery of advice: The percentage of smokers who stated they quitbecause of physician advice increased between 1996 and 1999. Further, smokers wereparticularly likely to have used nicotine replacement therapy with their most recent quitattempt if they had been referred to a smoking cessation program by their physician,compared to those not referred.
The findings presented in this chapter point to considerable success for the TCP inmodifying smokers’ behavior in ways that should increase their likelihood of futuresuccessful smoking cessation. In 1999, over 60% of California smokers were motivatedto make a quit attempt. Disregarding those who never expect to quit, only about 30% ofsmokers who want to quit eventually did not attempt to quit in 1999. More research isrequired to determine what measures the TCP can undertake to encourage smokers tostay off cigarettes for the long term so that they become successful former smokers.
Smoking Cessation: California Smokers Are Trying To Quit
6-26
CHAPTER 6: KEY FINDINGS
1. In 1999, 59.4±1.7% of adult smokers were either occasional smokers or smokedless than 15 cigarettes/day.
2. Quit attempts of a day or longer increased by a factor of 25.9% from 1990 when48.9±1.5% of smokers made a quit attempt to 61.5±1.5% in 1999.
3. Despite the increased quitting incidence by 1999, smokers were successful(abstinent at least 90 days) at about the same rate as earlier in the decade.
4. In 1999, the group of smokers (>25 years of age) with no quit attempts in the pastyear and absolutely no intention to quit in the future comprised 9.1±1.2% of allsmokers, unchanged since 1996. Some of these smokers are light smokers whomay believe that they don’t need to quit.
5. Smokers both living and working in smokefree environments (23.7±1.2% in 1999)were significantly more likely to have made a recent quit attempt and to be lightsmokers than those with either or neither of these constraints on smoking.
6. The percentage of California smokers using some form of cessation assistanceincreased by a factor of 21.7% between 1992 when 18.4±2.4% of smokers usedassistance and 1999 when 22.4±1.8% did. The percent using nicotine replacementtherapy was 12.7±1.1% in 1996 and 14.2±1.3% in 1999, a significant increase by afactor of 11.8%. In 1999, 5.3±0.9% of smokers used an antidepressant while tryingto quit.
7. Relatively heavy smokers are much more likely to chose a medical aid for smokingcessation, and in 1999, heavy smokers using such an aid (average use about 4weeks) stayed off cigarettes longer than those who did not use one. However, by 90days, the relapse rates were not statistically different.
8. Report of physician advice to quit by smokers visiting a physician in the last yearincreased by a factor of 20.4% between 1990 (37.8±2.9%) and 1999 (45.5±3.2%).If a physician also provided a referral to a smoking cessation program, smokersreported they were more likely to try to quit than if such a referral was not provided.

Smoking Cessation: California Smokers Are Trying To Quit
6-27
CHAPTER 6: GLOSSARY
Adults
Current smoker – has smoked at least 100 cigarettes in his or her lifetime and smokesnow (old question) or now either everyday or some days (new question) at the time ofthe survey.
Daily smoker – a current smoker who has smoked on every day of the past month (oldquestion sequence) or who now smokes everyday (new question).
Former smoker – has smoked at least 100 cigarettes in lifetime, but does not smoke now(old question) or now smokes not at all (new question).
Light smoker – a current smoker who smokes fewer than 15 cigarettes a day.
Occasional smoker – a current smoker who smoked on at least 1 day in the past month(old question sequence) or who says he or she now smokes some days (new question).
Recent former smoker – someone who has smoked sometime in the past year, but was aformer smoker at the time of the survey.

Smoking Cessation: California Smokers Are Trying To Quit
6-28
CHAPTER 6: REFERENCES
Farkas AJ. When does cigarette fading increase the likelihood of future cessation? AnnBehav Med. 1999;21:71-76.
Farkas AJ, Gilpin EA, Distefan JM, Pierce JP. The effects of household and workplacesmoking restrictions on quitting behaviors. Tobacco Control. 1999;8: 261-265.
Farkas AJ, Pierce JP, Zhu SH, Rosbrook B, Gilpin EA, Berry C, Kaplan RM. Addictionversus stages of change models in predicting smoking cessation. Addiction. 1996;91:1271-1280.
Fiore MC, Novotny TE, Pierce JP, Giovino GA, Hatziandreu EJ, Newcomb PA,Surawicz TS, Davis RM. Methods used to quit smoking in the United States. Docessation programs help? JAMA. 1990;263:2760-2765.
Fiore MC, Baily WC, Cohen SJ, et al. Smoking Cessation: Clinical Practice GuidelineNo. 18 (Pub. No. 96-0692). Rockville, MD: Agency for Health Care Policy andResearch; 1996.
Frank E, Winkleby MA, Altman DG, Rockhill B, Fortmann SP. Predictors of physicians’smoking cessation advice. JAMA. 1991;266: 3139-3144.
Gilpin EA, Emery SL, Berry CC. Technical Report on Analytic Methods andApproaches Used in the 1996 California Tobacco Survey Analysis. Vol 3: MethodsUsed for Final Report. The California Tobacco Control Program: A Decade of Progress,1989-1999. La Jolla, CA: University of California, San Diego; 2001.
Gilpin EA, Pierce JP, Farkas AJ. Duration of smoking abstinence and success in quitting.J Natl Cancer Inst. 1997;89(8): 572-576.
Gilpin EA, Pierce JP, Johnson M, Bal D. Physician advice to quit smoking: results fromthe 1990 California Tobacco Survey. J Gen Intern Med. 1993;8:549-553.
Gilpin EA, White MM, Farkas AJ, Pierce JP. Home smoking restrictions: which smokershave them and how they are associated with smoking behavior. Nicotine and TobaccoResearch. 1999;1: 153-162.
Hymowitz N, Cummings KH, Hyland A, Lynn W, Pachacek TF, Hartwell TD.Predictors of smoking cessation in a cohort of adult smokers followed for five years.Tobacco Control. 1997;6:S57-S62.
Jorenby DE, Leischow SJ, Nides MA, Rennard SI, Johnston JA, Hughes AR, Smith SS,Muramoto ML, Daughton DM, Doan K, Fiore MC, Baker TB. A controlled trial ofsustained release bupropion, a nicotine patch, or both for smoking cessation. New Engl JMed. 1999;340:685-691.

Smoking Cessation: California Smokers Are Trying To Quit
6-29
Luoto R, Uutek A, Puska P. Occasional smoking increases total and cardiovascularmortality among men. Nicotine & Tobacco Res. 2000;2:133-139.
National Cancer Institute. Tobacco and the Clinician. Smoking and Tobacco ControlMonograph No 5. Bethesda, MD: National Institutes of Health, National CancerInstitute; NIH Pub. No. 94-3693;1994.
Orleans CT, Reach N, Noll E, et al. Use of transdermal nicotine in a state-levelprescription plan for the elderly. A first look at ‘real-world’ patch users. JAMA.1994;271:601-607.
Pierce JP, Gilpin E, Farkas AJ. Nicotine patch use in the general population: results fromthe 1993 California Tobacco Survey. JNCI. 1995;87: 87-93.
Pierce JP. The quitting process. In: Proceedings of the Conference on Health Insuranceand Smoking. The Smoking Behavior and Policy Conference Series at HarvardUniversity, Cambridge, Massachusetts, pp. 8-23; 1990.
Pierce JP, Gilpin EA, Emery SL, Farkas AJ, Zhu SH, Choi WS, Berry CC, Distefan JM,White MM, Soroko S, Navarro A. Tobacco Control in California: Who’s Winning theWar? An Evaluation of the Tobacco Control Program, 1989-1996. La Jolla, CA:University of California, San Diego; 1998. World Wide Web:http://ssdc.ucsd.edu/tobacco/
US Department of Health and Human Services. The Health Benefits of SmokingCessation. A Report of the Surgeon General. US Department of Health and HumanServices, Public Health Service. Centers for Disease Control, Center for Chronic DiseasePrevention and Health Promotion, Office on Smoking and Health. DHHS PublicationNo. (CDC) 90-8416;1990.
Zhu SH, Melca T, Sun J, Rosbrook B, Pierce JP. Smoking cessation with and withoutassistance: a population-based analysis. Am J Prev Med. 2000;18: 305-311.

7-1
Chapter 7
PRICE SENSITIVITY AND TAXES

Price Sensitivity and Taxes
7-2
CHAPTER 7: PRICE SENSITIVITY AND TAXES
Introduction
Although they are an addictive product, it is widely accepted that the market for cigarettes obeysthe fundamental economic principal in the Law of Demand—namely, as prices rise, demand willdecrease. Thus, in the 1990s, state and federal governments have used cigarette excise taxes as apolicy tool, which not only generates revenue, but which also may contribute to reductions insmoking. This policy tool, however, includes a caveat: raising cigarette prices above those fromout-of-state sources may create an incentive to purchase cigarettes from lower or non-taxedsources (Lewit and Coate, 1982; Saba, et al. 1995).
In 1999, California became a high-profile testing ground for these potentially conflicting effectswhen it implemented a $0.50/pack voter-approved cigarette tax increase. Estimates of reductionsin consumption subsequent to the new tax range from 20-30% (California Board of Equalizationand Fitz, 1999). However, tax evasion may account for part of this decline. California smokershad a number of options to avoid the state tax, including Internet cigarette vendors, numerousIndian reservations across the state, military commissaries, and neighboring states and Mexico,all of which offer lower-taxed or non-taxed American cigarettes.
In addition to the $0.50/pack Proposition 10 excise tax increase, in 1999 smokers in California(and across the US) experienced a further price increase of approximately $0.70/pack, which thetobacco industry imposed in response to the provisions of the Multi-state Master SettlementAgreement (Meier, 1998). Thus, in 1999, cigarette prices increased by an unprecedented$1.20/pack in California.
This chapter examines the extent to which price has played a role in changes in cigaretteconsumption in California over the past decade. Section 1 examines trends in cigarette pricessince 1989, explains the relationship between price and demand for cigarettes, and uses empiricalestimates of the price elasticity of demand for cigarettes to estimate expected changes in cigarettedemand over time. Section 2 examines where Californians bought their cigarettes and how muchthey paid, in order to analyze the potential impact of tax evasion. Section 3 uses the CaliforniaTobacco Surveys (CTS) to analyze smokers’ price sensitivity and trends in price sensitivity inCalifornia. Section 4 presents CTS data on support for excise taxes among smokers andnonsmokers in California. Section 5 presents analyses of price issues for adolescent smokers.Section 6 summarizes the analyses presented in this chapter.
1. The Economics of Cigarette Prices
Over the past decade in California, the real price of cigarettes (adjusted for inflation) remainedrelatively constant, and even decreased slightly, until the 1999 excise tax increase. Figure 7.1illustrates the changes in the real price/pack of cigarettes between 1989 and 1999 in California.
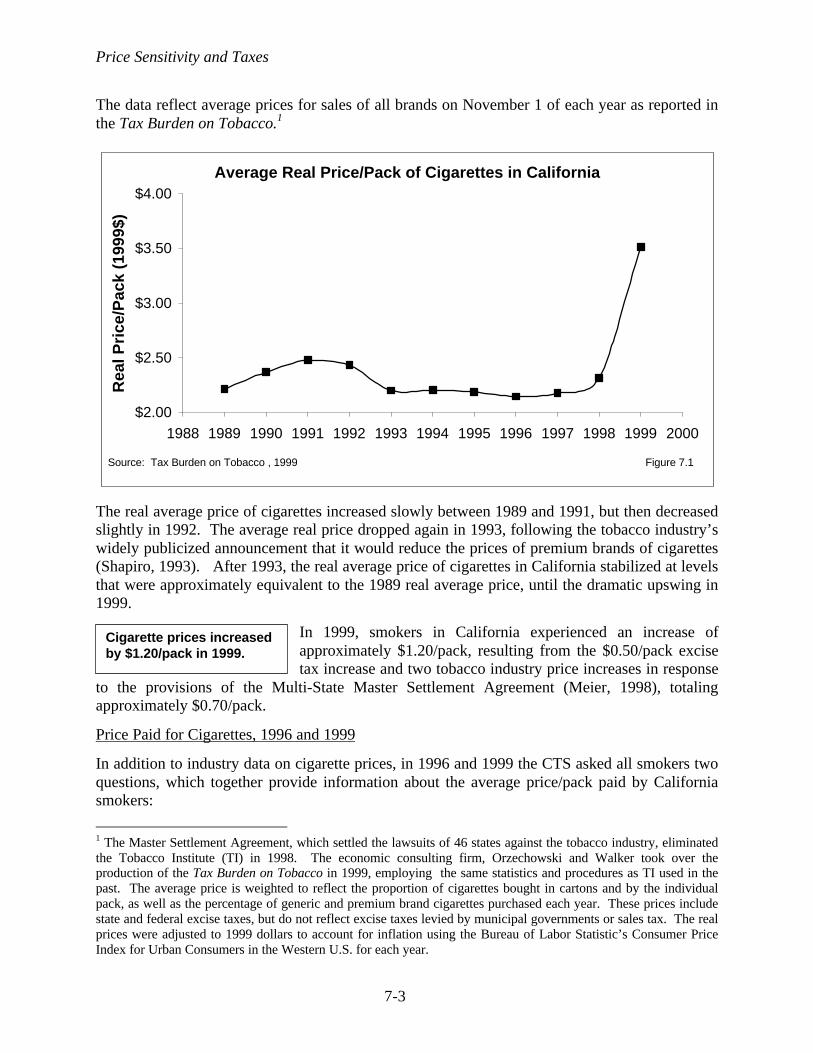
Price Sensitivity and Taxes
7-3
The data reflect average prices for sales of all brands on November 1 of each year as reported inthe Tax Burden on Tobacco.1
The real average price of cigarettes increased slowly between 1989 and 1991, but then decreasedslightly in 1992. The average real price dropped again in 1993, following the tobacco industry’swidely publicized announcement that it would reduce the prices of premium brands of cigarettes(Shapiro, 1993). After 1993, the real average price of cigarettes in California stabilized at levelsthat were approximately equivalent to the 1989 real average price, until the dramatic upswing in1999.
In 1999, smokers in California experienced an increase ofapproximately $1.20/pack, resulting from the $0.50/pack excisetax increase and two tobacco industry price increases in response
to the provisions of the Multi-State Master Settlement Agreement (Meier, 1998), totalingapproximately $0.70/pack.
Price Paid for Cigarettes, 1996 and 1999
In addition to industry data on cigarette prices, in 1996 and 1999 the CTS asked all smokers twoquestions, which together provide information about the average price/pack paid by Californiasmokers:
1 The Master Settlement Agreement, which settled the lawsuits of 46 states against the tobacco industry, eliminatedthe Tobacco Institute (TI) in 1998. The economic consulting firm, Orzechowski and Walker took over theproduction of the Tax Burden on Tobacco in 1999, employing the same statistics and procedures as TI used in thepast. The average price is weighted to reflect the proportion of cigarettes bought in cartons and by the individualpack, as well as the percentage of generic and premium brand cigarettes purchased each year. These prices includestate and federal excise taxes, but do not reflect excise taxes levied by municipal governments or sales tax. The realprices were adjusted to 1999 dollars to account for inflation using the Bureau of Labor Statistic’s Consumer PriceIndex for Urban Consumers in the Western U.S. for each year.
Cigarette prices increasedby $1.20/pack in 1999.
Average Real Price/Pack of Cigarettes in California
$2.00
$2.50
$3.00
$3.50
$4.00
1988 1989 1990 1991 1992 1993 1994 1995 1996 1997 1998 1999 2000
Rea
l Pri
ce/P
ack
(199
9$)
Figure 7.1Source: Tax Burden on Tobacco , 1999

Price Sensitivity and Taxes
7-4
• Do you usually buy cigarettes by the carton or by the pack, or do you roll your own?• How much do you usually pay for a pack {carton} of cigarettes?
Those who usually bought by the carton reported the price they usually paid for a carton, whichwas then converted to an average price/pack, and combined with the price/pack reported by thosewho usually bought by the pack to calculate a composite average price/pack. Table 7.1 presentsthe self-reported average price paid/pack of cigarettes, analyzed by demographic group, amountsmoked, quitting intentions, and household income.
Table 7.1Average Price/Pack Paid by California Smokers
(Adjusted for Carton Purchases; Adjusted for Inflation to 1999 $)
1996%
1999%
Factor Increase1996-1999
%Overall $2.06±0.02 $3.27±0.02 58.7Gender
Female 2.02±0.02 3.20±0.03 58.4Male 2.08±0.02 3.32±0.03 58.4
Age18-24 2.29±0.04 3.51±0.06 53.325-44 2.12±0.02 3.36±0.03 58.545-64 1.88±0.03 3.07±0.04 63.365+ 1.77±0.05 2.90±0.09 62.9
Race/EthnicityAfrican American 2.12±0.04 3.35±0.08 58.0Asian/PI 2.15±0.04 3.38±0.08 57.2Hispanic 2.20±0.04 3.40±0.06 54.5Non-Hispanic White 2.00±0.02 3.21±0.03 60.5
Amount Smoked1-14 cigs/day 2.16±0.02 3.39±0.03 57.715-24 cigs/day 1.96±0.03 3.16±0.02 61.225+ cigs/day 1.81±0.04 2.99±0.11 65.2
Quitting IntentionNever expect to quit 1.91±0.04 3.12±0.07 63.4Will quit in > 6 months 2.05±0.03 3.23±0.03 57.6Will quit in next 6 months 2.09±0.03 3.33±0.04 59.3Will quit in next month 2.18±0.05 3.38±0.07 55.0
Annual Household Income< $75,000 2.04±0.02 3.26±0.03 59.8
Over $75,000 2.16±0.04 3.34±0.04 54.6Table entries are weighted percentages and 95% confidence limits.Source: CTS 1996, 1999

Price Sensitivity and Taxes
7-5
Table 7.1 shows that California smokers reported paying slightly less on average than theindustry-reported average real price/pack, which was $2.15 in 1996 and $3.51 in 1999. Thedifference between self-reported and industry-reported prices is relatively small, but increasedfrom about 4% to about 7% between 1996 and 1999. These differences may simply reflect biasin memory or reporting, or may reflect a preference for individuals to report whole digits or toround down to the nearest $0.05 or $0.10 increment, which could be exacerbated as prices rise.In any case, in both years the differences between self-reported and industry-reported cigaretteprices are within an acceptable margin of error.
Table 7.1 shows that in both 1996 and 1999, there were significant differences between agegroups: younger smokers reported paying significantly more than older smokers. Also in eachyear, men reported paying significantly more than women, and minorities reported paying morethan non-Hispanic White smokers. Typically, younger smokers and minorities smoke less thanolder smokers and non-Hispanic White smokers. Therefore, it makes sense that these groupswould pay higher prices, since they are more likely to buy by the pack than by the carton.
Lighter smokers (<15 cigarettes/day) paid significantly more per pack than moderate smokers(15-24 cigarettes/day), who in turn paid significantly more than heavy smokers (25+cigarettes/day). This makes sense because heavier smokers are more likely to buy by the carton,and at discount stores. Additionally, the sooner the smoker intended to quit, the higher thereported price/pack.
The table shows that older smokers experienced greater increases in cigarette prices than didyounger smokers; non-Hispanic White smokers experienced greater increases than minoritysmokers; and heavy smokers experienced greater increases than lighter smokers.
Combining information on the average price paid/pack ofcigarettes with the average amount smoked, it is possible tocalculate how much smokers spent per month on average tosupport their smoking. Table 7.2 shows the changes between1996 and 1999 in monthly expenditures on cigarettes acrosslevels of household income and across light, moderate, andheavy smokers.
Table 7.2 shows that in 1996, moderate smokers spent about$54/month on smoking; by 1999, this group spent nearly$90/month on smoking—an increase by a factor of 61%. By
1999, the heaviest smokers spent nearly $160/month—over $5/day—on smoking.
In 1999, heavy smokers spent$160/month on smoking.
Monthly expenditures onsmoking did not vary byhousehold income. Smokerswith household incomes of<$10,000/year spent nearly10% of their net monthlyincome on smoking.

Price Sensitivity and Taxes
7-6
Figure 7.2 shows that, among the heaviest smokers, expenditures on cigarettes did not vary byincome level. Expenditures did not vary by income level among lighter smokers, either. Thus,the 1999 cigarette price increases disproportionately affected low-income smokers.
Monthly Expenditures by Income LevelAmong Those Who Smoke 25+ Cigarettes/Day
0
50
100
150
200
$20,000 or less $20,001 to $50,000 $50,001 to $75,000 over $75,000
$/M
on
th
1996 1999
Figure 7.2Source: CTS 1996, 1999
1996 1999
$20,000 or less 97.3 164.8
$20,001 to $50,000 91.6 157.8
$50,001 to $75,000 90.1 157.4
over $75,000 97.6 160.1
Table 7.2Average Monthly Expenditures on Cigarettes
by Amount Smoked and Income Levels(Adjusted for Inflation)
1996%
1999%
Factor Increase1996-1999
%Overall $40.76±1.05 $61.35±1.68 50.5%Annual Household Income <$20,000 39.96±1.71 59.57±3.81 49.1 $20,001-$50,000 39.96±1.51 63.04±3.02 57.8 $50,001-$75,000 41.31±1.76 65.54±3.32 58.7 $75,001+ 43.04±3.53 59.50±4.41 38.2 Unknown 42.75±4.78 55.32±4.57 29.4Amount Smoked 1-14 cigarettes/day 21.40±0.52 33.71±0.86 57.6 15-24 cigarettes/day 54.22±0.66 87.18±1.02 60.8 25+ cigarettes/day 95.36±2.65 158.9±06.48 66.6
Table entries are weighted percentages and 95% confidence limits.Source: CTS 1996, 1999
Price Sensitivity and Taxes
7-7
Price Elasticity
The extent to which the price of a product influences demand for that product—or how sensitivebuyers are to the price—is called the price elasticity of demand. Price elasticity is defined andcalculated as the percent change in demand that is due to a percentage change in price.
Elasticity = % change in demand% change in price
Overall price elasticity of demand for cigarettes consists of two components: participationelasticity—the extent to which price influences whether or not people smoke; and conditionaldemand—the amount of cigarettes consumed by those who smoke.
An expert panel convened by the National Cancer Institute arrived at a consensus estimate of theadult overall price elasticity of demand for cigarettes of –0.4 (National Cancer Institute, 1993);estimates of the overall price elasticity of demand for cigarettes in California lie between –0.45and –0.6 (Hu et al., 1995). Thus, for every 10% increase in cigarette prices, demand forcigarettes should fall by 4-6%. Most studies attribute approximately half of the change indemand to changes in smoking participation (increased quitting and reduced initiation) and halfto reduced consumption among the remaining smokers (Becker et al., 1990; Lewit et al., 1997).
Expected and Actual Changes in Cigarette Consumption
Because it describes the size and direction of the relationship between the price and demand forcigarettes, elasticity can be used to calculate the expected change in the consumption ofcigarettes that would result from real changes in the price of cigarettes.
Expected % change in demand = (elasticity) x (% change in price)
This technique was used in the 1989 Surgeon General’s Report to estimate the impact on theconsumption of cigarettes and on smoking prevalence of a proposed federal excise tax oncigarettes (U.S. Department of Health and Human Services, 1989). While it is not an empiricaltest or a calculation of the actual elasticity of demand for cigarettes, this is a useful andillustrative method of policy evaluation.
The dark bars in Figure 7.3 illustrate the expected annual percentage change in cigaretteconsumption in California due to actual changes in the average real price/pack from year to year,assuming a constant overall price elasticity of demand of –0.4. The lighter bars show the actualannual percentage changes in cigarette consumption in California.
Figure 7.3 shows that in every year except 1995, per capita cigarette consumption decreased.The figure also shows that throughout most of the California Tobacco Control Program, actualchanges in cigarette consumption exceeded the changes that would be expected from pricechanges alone. The differences between the actual and expected levels of consumption may beattributable to the other components of the Tobacco Control Program (including restrictions onwhere people can smoke), as well as national secular trends toward reduced consumption.

Price Sensitivity and Taxes
7-8
The changes in consumption following the 1999 priceincreases nearly matched the changes that were expected,based on the price change alone. A similar concordancebetween actual and expected changes in consumptionoccurred in 1989, after the implementation of the Proposition99 $0.25/pack excise tax increase. It is possible that in years
with relatively large price changes, the shock effect on consumption masks the effects of otherprogram efforts or tobacco industry promotional activities.
2. Analysis of Tax Evasion Following Proposition 10 Excise Tax Increase
Due to the 1999 tobacco industry-driven price increases, smokers across the US experiencedprice increases of approximately $0.70/pack. At the same time, California smokers experiencedan increase of $0.50/pack, due to the Proposition 10 excise tax increase, on top of the industryprice increases. It has been suggested that, because of the $0.50/pack excise tax increase, thehigher price of cigarettes in California would motivate smokers to buy their cigarettes from non-taxed or lower-taxed sources, such as the Internet, Indian Reservations, and out of state, to avoidthe California excise tax (California Board of Equalization and Fitz, 1999; Congressional Recordand Senate, May 05, 1998). If smokers evaded the state excise tax, rather than cut back or quitsmoking altogether, the state would potentially lose substantial revenue without achieving thebenefit of reduced smoking.
The decrease in per capitaconsumption following the1999 price increases nearlymatched the expecteddecrease.
-25.0%
-20.0%
-15.0%
-10.0%
-5.0%
0.0%
5.0%
10.0%
1989 1990 1991 1992 1993 1994 1995 1996 1997 1998 1999
Annual % Change in Trended Demand
Expected Change in Demand Due to Price Changes
Expected and Actual Percentage Changes in Cigarette ConsumptionDue to Price Changes in California, 1989-1999
Source: CA BOE, 1999; Tax Burden on Tobacco, 1999 Figure 7.3

Price Sensitivity and Taxes
7-9
To ascertain whether evasion was a problem in California, the 1999 CTS asked all adult currentsmokers:
Do you usually buy your cigarettes in California, out of state, or over the Internet?
Those who answered that they purchased their cigarettes in California were asked:
Where do you usually buy your cigarettes? Do you buy them ….• At convenience stores or gas stations• At supermarkets• At liquor stores or drug stores• At tobacco discount stores• At other discount stores such as Wal-Mart• On Indian reservations, or• In military commissaries?
The black bars in Figure 7.4 represent the percent of cigarettes bought at each type of store,accounting for the average daily cigarette consumption of each respondent across every type ofstore. The white bars represent the percent of buyers who report that they usually buy theircigarettes from each type of store.
0
10
20
30
40
50
Liquor/drugstores
($3.52/pack)
Conveniencestores/gas
stations($3.47/pack)
Supermarkets($3.28/pack)
Discount stores($2.91/pack)
Non/lower-taxedsources
($2.33/pack)
Other ($3.32/pack)
%
Buyers
Cigarettes
Figure 7.4Source: CTS 1999
Percent of Buyers and Cigarettes Purchased by Store Type
Liquor/drugstores
($3.52/pack)
Conveniencestores/gas
stations($3.47/pack)
Supermarkets($3.28/pack)
Discountstores
($2.91/pack)
Non/lower-taxed sources($2.33/pack)
Other($3.32/pack)
Buyers 16.6 44.7 8.6 20.8 5.4 3.5Cigarettes 14.0 44.6 9.3 23.5 4.5 3.8

Price Sensitivity and Taxes
7-10
The prices listed below each type of store reflect the average price/pack that smokers whousually buy from each type of store reported paying, accounting for whether the respondentreported buying cigarettes by the pack or by the carton.
The white bars in Figure 7.4 show that, more than 7 months after the implementation of the newexcise tax, only 5.4±0.8 % of California smokers avoided the tax either by usually purchasingcigarettes over the Internet (0.4±0.3%), or at military commissaries (1.9±0.5%), on Indianreservations (0.3±0.3%), or out of state (3.0±0.5%).
In fact, the vast majority of smokers purchased their cigarettesfrom the most convenient retail sources: convenience stores/gasstations (44.7±1.8%), or liquor/drug stores (16.6±1.6%), andsupermarkets (8.6±1.0%). One out of five smokers (20.8±1.3%)purchased their cigarettes at discount stores, such as a tobacco
discount store or a general discount store, like Wal-Mart.
The dark bars show that convenience stores/gas stations account for approximately the samefraction of all cigarettes purchased as buyers who reported purchasing from this source.Discount stores accounted for slightly more cigarettes than buyers (23.5% vs. 20.8%), as wouldbe expected: discount stores sell cigarettes by the carton, and therefore are preferred by theheaviest smokers.
The CTS data show that despite the potential savings, tax evasion does not appear to pose aserious threat to the state’s excise tax revenues or its tobacco control objectives. Indeed, aremarkably small fraction of California smokers go out of state, to military commissaries or buytheir cigarettes from Internet sources or Indian reservations. Smokers have always had theability to buy their cigarettes from Indian reservations or out of state, or from militarycommissaries if they were eligible. Thus, it is unlikely that even the 4.5% of cigarettespurchased from non-taxed or lower-taxed sources represents entirely new tax evasion,subsequent to the 1999 tax increase. Despite the threat that Internet cigarette vendors mayprovide smokers with an easy way to evade state excise taxes, California smokers were not usingthis method in 1999. It is possible that more smokers may explore this source in the future, butminimum purchase requirements (typically 5 cartons) present a disincentive for the majority ofsmokers, who do not buy by the carton, much less by multiple cartons. Since there are no earlierdata for comparison, it is unknown whether smokers are more inclined to seek out lower or non-taxed sources of cigarettes in 1999 than they were earlier in the decade.
Although there are several alternatives available to California smokers to minimize the cost ofsmoking, nearly 70% of smokers reported that they buy their cigarettes from the most expensivesources—convenience stores, liquor/drug stores, and supermarkets. Cigarettes purchased atliquor stores were the most expensive ($3.52/pack), closely followed by convenience stores($3.47/pack) and supermarkets ($3.28/pack). Discount stores offered relatively cheap cigarettes($2.91/pack), reflecting their lower volume-based mark-up and the additional discount forbuying by the carton. Smokers who reported that they purchased cigarettes from non-taxed or
Nearly 70% of Californiasmokers usually purchasedtheir cigarettes from themost convenient and mostexpensive sources.

Price Sensitivity and Taxes
7-11
lower-taxed sources paid the least ($2.33/pack), reflecting both a carton discount and the lack ofCalifornia or lower excise taxes.
By not taking advantage of cheaper alternatives for purchasing cigarettes, perhaps Californiasmokers were trying to regulate their behavior, limiting themselves to small quantities (buyingby the pack, at more expensive sources) to avoid the temptation to consume more than theywanted to (Thaler & Shefrin, 1981; O'Donoghue & Rabin, 2000). O’Donoghue and Rabin(2000) use the example of buying pints versus quarts of ice cream—many people will buy icecream by the pint, even though it is more expensive, in order to avoid temptation and limit theirconsumption. In an analogous way, smokers may subject themselves to the highest pricesbecause they do not specifically plan to buy cigarettes, and therefore only do so when they feelan urge to smoke and their choices are limited. Alternatively, they may buy by the pack to avoidtemptation, or may truly believe “this is my last pack” and therefore not care about relative price.Finally, many smokers may weigh the time and/or “hassle-costs” involved with seeking out theleast expensive cigarette sources and decide that buying cigarettes from convenience stores isactually worth the extra monetary expense. As Table 7.1 shows, smokers who reported that theyplanned to quit in the next 6 months paid significantly more for cigarettes than those withoutrelatively immediate plans to quit.
3. Adult Price Sensitivity
As evidence of Californians’ sensitivity to the price of cigarettes, this section examines tworelated issues. First, it explores smokers’ worries about the amount of money they spend oncigarettes. Second, it describes the choices smokers make in purchasing cigarettes: whether theybuy premium or generic; whether they buy by the carton or pack.
In 1996 and 1999, the CTS asked current adult smokers the following question to determinewhether the price of cigarettes was a cause of concern:
Are you worried about how much money you spend on cigarettes?
Table 7.3 presents a detailed analysis of answers to thisquestion, by demographic group, and by amount smokedand quitting intentions.
Table 7.3 shows that smokers were significantly more worried about how much they spent oncigarettes in 1999 than they were in 1996. In both years, more female smokers than malesmokers reported worry, but the increase in worry was greatest among male smokers. The 45-64year old age group showed the greatest increase in the percent of smokers worried about howmuch they spend on cigarettes. In 1996 and 1999, there were no significant differences acrossrace/ethnic groups in the percentage of smokers worried about how much they spent oncigarettes. Non-Hispanic White smokers experienced the greatest increase in worry over the 3-year period.
The percent of smokers worriedabout how much they spent oncigarettes increased by a factor of49.7% between 1996 and 1999.

Price Sensitivity and Taxes
7-12
In both 1996 and 1999, worry was approximately inversely related with quitting intentions: thesooner the smoker intended to quit, the more likely they were to be worried about how muchthey spent on cigarettes. This trend makes sense: those who are worried about how much theyspend may be motivated to quit smoking sooner. In fact, the data show a relative lack of worryamong those who have no intention to quit smoking anytime in the future.
In both years, significantly fewer light smokers (1-14 cigarettes/day) were worried, compared tomoderate (15-24 cigarettes/day) or heavy (25+ cigarettes/day) smokers.
Table 7.3Percent of Smokers Worried About Money Spent on Cigarettes
1996%
1999%
FactorIncrease
1996-1999%
Overall 35.1±1.3 52.5±1.9 49.7Gender
Female 38.2±1.8 55.1±2.2 44.2Male 32.8±1.7 50.7±2.5 54.9
Age18-24 32.3±3.6 47.9±4.9 48.425-44 37.4±1.7 53.5±2.6 43.045-64 34.1±2.0 56.3±3.1 64.965+ 27.9±4.9 42.7±7.0 53.0
Race/EthnicityAfrican American 34.5±4.4 46.9±6.3 36.3Asian/PI 38.4±8.1 52.7±7.3 37.3Hispanic 36.9±2.7 52.3±4.5 41.9Non-Hispanic White 33.8±1.6 53.2±2.1 57.6
Annual Household Income<$20,000 44.0±2.6 59.9±4.2 36.1$20,001-$50,000 33.6±1.6 53.4±2.7 58.8$50,001-$75,000 32.6±3.4 51.2±3.9 57.2$75,001+ 21.8±3.8 42.6±3.7 96.0Unknown 34.8±4.0 49.3±5.8 41.7
Quitting IntentionsNever expect to quit 17.7±3.1 34.4±4.5 94.1May quit, but not in next 6 months 31.7±2.0 51.8±2.7 63.4Will quit in 1-6 months 43.1±2.6 61.2±3.3 42.0Will quit next 30 days 46.0±4.1 54.2±4.1 17.6
Amount Smoked1-14 cigs/day 33.0±2.1 49.9±2.6 51.415-24 cigs/day 39.7±2.0 63.4±3.3 58.725+ cigs/day 39.8±3.3 63.2±5.0 58.7
Table entries are weighted percentages and 95% confidence limits.Source CTS 1996, 1999

Price Sensitivity and Taxes
7-13
Premium vs. Generic Cigarettes
In both 1996 and 1999, the vast majority (90.3±0.8% in 1996; 90.0±1.1% in 1999) of smokerssmoked premium brand cigarettes, such as Marlboros, Camel, Benson & Hedges, or Winstons, asopposed to generic cigarettes. Similarly, the majority of smokers in both years (65.6±1.3% in1996; 65.9±1.6% in 1999) bought their cigarettes by the pack. Therefore, although the majorityof smokers were worried about how much they spend on cigarettes, this worry was not translatedinto cost-minimizing behavior changes.
The characteristics of those who were cost-minimizing are logical and very similar: heaviersmokers, older smokers, and non-Hispanic White smokers were more likely to report that theyusually buy generics, and buy by the carton.
4. Support for a Cigarette Excise Tax
California has a strong history of utilizing the revenues from tobacco taxes for tobacco controland health care. The majority of the revenues from the 1989 cigarette excise tax increase wereused to fund the California Tobacco Control Program and medical services in California. Therevenues from a $0.02/pack excise tax increase in 1993 were dedicated to breast cancer care andresearch. All of the revenues from the Proposition 10 $0.50/pack increase in 1999 weredesignated to support early childhood development programs, including tobacco use preventionprograms, such as reducing smoking during pregnancy and exposure of infants and youngchildren to secondhand smoke. To gauge support for such taxes, in 1992, 1993, 1996, and 1999,the California Tobacco Survey asked adults:
How much additional tax on a pack of cigarettes would you be willing to support if all themoney raised was used to fund programs aimed at preventing smoking among children andother health care programs?
Answers could range between no increase and an increase of $3.
Figure 7.5 shows the cumulative level of overall support foradditional excise taxes of increasing levels for both 1996and 1999. Figure 7.5 shows that in 1999, approximately70% of all respondents supported some additional tax on apack of cigarettes, and there was slightly greater support fortaxes of at least $0.50/pack in 1999 than there was in 1996.
The cigarette price increases of1999 did not diminishCalifornian’s overwhelmingsupport for an additionalcigarette excise tax.

Price Sensitivity and Taxes
7-14
Overall, nearly 70% of Californians supported an excise tax increase of at least $0.25/pack, andnearly 50% of Californians supported an excise tax increase of at least $1/pack—even after therecent implementation of the Proposition 10 $0.50/pack increase.
Table 7.4 provides detailed demographic analyses and a comparison of 1999 results with 1996.The table shows that there was virtually no change between 1996 and 1999 in the levels ofsupport for an additional tax of at least $0.50/pack. Overall, support for a tax increase of≥$0.50/pack increased by a factor of 2%. Younger Californians were more likely than olderpeople to support an additional $0.50+/pack tax, and women were slightly more likely than mento support such a tax. There were few differences in support across racial/ethnic groups, butsmokers were significantly less likely to support an additional tax than were non- or former-smokers. Among current smokers, those who reported they were worried about how much theyspent on smoking showed no less support for an additional cigarette excise tax than did smokerswho were not worried.
Among all adults, those in the highest income group were more likely to support an additionaltax of ≥$0.50/pack than those in the lowest group, but between 1996 and 1999, there was anincrease in support for such a tax among the lowest two income and a decrease in support amongthe highest two income groups. Among smokers, there were no significant differences in supportfor the tax by household income.
Cumulative Percentage Favoring Additional Cigarette Excise Tax
0
10
20
30
40
50
60
70
80
$3.00 $2.00 $1.50 $1.00 $0.75 $0.50 $0.25
Additional Excise Tax
Cu
mu
lati
ve %
1996
1999
Source: CTS 1996, 1999 Figure 7.5

Price Sensitivity and Taxes
7-15
Table 7.4Support for a Cigarette Excise Tax of ≥≥ $0.50/pack
1996%
1999%
FactorChange
1996-1999%
Overall 57.1±1.2 58.2±1.3 +2.0
GenderFemale 58.0±1.8 60.3±1.8 +4.0Male 56.1±1.5 56.0±1.7 -0.2
Age18-24 63.2±2.2 65.0±3.0 +2.925-44 59.5±1.7 61.4±1.7 +3.245-64 54.1±2.0 54.7±2.5 +1.265+ 48.6±4.2 48.2±3.4 -0.9
Race/EthnicityAfrican American 51.3±4.6 49.7±4.5 -3.1Asian/PI 59.4±4.4 61.1±5.1 +2.8Hispanic 58.6±2.8 65.9±2.3 +12.5Non-Hispanic White 57.3±1.3 55.3±1.3 -3.5
Smoking StatusCurrent Smoker (all) 33.0±1.6 29.3±1.5 -11.2Current Smoker (worried about moneyspent on cigarettes)
34.3±2.5 29.0±2.1 -15.4
Former Smoker 58.3±2.4 57.7±2.6 -1.0Never Smoker 64.5±1.9 67.7±1.7 +5.0
Amount Smoked1-14 cigs/day 38.1±2.8 32.8±2.0 -14.015-24 cigs/day 26.7±1.7 20.6±1.9 -22.625+ cigs/day 19.5±3.0 15.4±4.0 -21.0
Annual Household Income<$20,000 52.4±2.7 56.4±3.0 +7.7$20,001-50,000 55.0±1.9 58.1±2.3 +5.6$50,001-75,000 62.9±2.5 59.7±2.5 -5.0$75,000+ 65.9±2.4 62.4±2.5 -5.3Unknown 52.4±3.4 51.6±4.2 -1.5
Current Smokers’ Household Income<$20,000 32.4±2.8 32.3±3.6 -0.2$20,001-50,000 32.0±1.9 27.4±2.4 -14.5$50,001-75,000 35.8±4.5 28.1±3.5 -21.5$75,000+ 36.6±4.1 31.4±3.7 -14.1Unknown 30.0±5.0 25.9±5.2 -13.7
Table entries are weighted percentages and 95% confidence limits.Source: CTS 1996, 1999

Price Sensitivity and Taxes
7-16
5. Adolescent Price Issues
Price Elasticity
Several studies have found that overall price elasticity of demand for cigarettes amongadolescents is between two and three times higher than the price elasticity of demand for adults,with overall elasticity estimates of –1.3 or more (Lewit et al., 1981; Chaloupka & Grossman,1996). In other words, teens may be much more sensitive than adults to cigarette prices. Thesestudies estimate that participation elasticity accounts for nearly 80% of the overall elasticity.Thus, participation elasticities for adolescents are estimated at about –0.8 or more.
The Board of Equalization consumption data do not specifically measure overall per capitacigarette consumption by adolescents. However, in exactly the same way as expected changes inconsumption were calculated for adults, it is possible to use the adolescent participation elasticityto calculate the expected changes in smoking prevalence among California adolescents thatmight result from a price increase.
Expected % change in prevalence = (adolescent participation elasticity) x (% change in price)
Figure 7.6 illustrates these results, using CTS data on standardized adolescent smokingprevalence from 1990, 1993, 1996, and 1999, and a conservative adolescent smokingparticipation elasticity estimate of –0.6 to calculate the expected changes in smoking prevalencebetween 1993, 1996, and 1999.
Actual and Expected Changes in Adolescent Prevalence
0.0%
29.2%
-33.0%
4.3%1.4%
-38.0%
-50.0%
-40.0%
-30.0%
-20.0%
-10.0%
0.0%
10.0%
20.0%
30.0%
40.0%
1990-1993 1993-1996 1996-1999
Actual % Change in Prevalence
Expected % Change in PrevalenceDue to Price Changes
Figure 7.6Source: CTS 1993, 1996, 1999; Tax Burden on Tobacco, 1999

Price Sensitivity and Taxes
7-17
Between 1990 and 1993, the real price/pack of cigarettes decreased by $0.17/pack, or 7.2%.Over this 3-year period, a smoking participation elasticity of –0.6 produces an expected increasein smoking prevalence of 4.3%. The actual change in prevalence between 1990 and 1993 wasnil.
Between 1993 and 1996, the real price/pack of cigarettes decreased by $0.05/pack, or 2.3%.Using –0.6 participation elasticity produces an expected increase in prevalence of 1.4%. Duringthis period, however, adolescent smoking prevalence increased by a factor of 29.2%.
Between 1996 and 1999, the real price/pack of cigarettes increased by $1.36/pack, or 63.3%.Based on this price change and a participation elasticity of –0.6, adolescent smoking prevalencewas expected to decrease by 38.0%; the actual decrease was 33.0%.
Figure 7.6 shows that the elasticity-based predictions were fairly close to the actual changesbetween 1990 and 1993, and between 1996 and 1999. Between 1993 and 1996, however,adolescent smoking was expected to remain fairly constant, but increased significantly. Thisfinding shows that factors other than price, such as tobacco industry advertising and promotionalpractices, play a role as well in adolescent smoking participation. The increase in participationseen in 1996 may have been larger or occurred earlier in the decade, as it did in the rest of theUnited States (Johnston et al., 2000), without the California Tobacco Control Program.
Expenditures on Cigarettes
To explore the extent to which cigarette prices matter to adolescents, it is important tounderstand what fraction of their disposable income they spend on cigarettes. Responses ofadolescents who had smoked in the last 30 days, and whose usual method of obtaining cigaretteswas to buy them—either themselves or through others—were used to construct Table 7.5.
Two questions were used to calculate the average number of cigarettes smoked/day for theseadolescents:
• Think about the last 30 days. On how many of these days did you smoke?and
• On the days that you did smoke, what was the average number of cigarettes that yousmoked?
Adolescents were also asked about their discretionary spending money:
About how much money do you have each week to spend on yourself any way you want to?
The average number of cigarettes smoked/day was multiplied by the amount that they said theyusually paid for a pack of cigarettes to obtain their weekly expenditures on cigarettes, and thiswas divided by the amount of money/week that they have to spend on themselves to obtain thefraction of discretionary income spent on cigarettes.

Price Sensitivity and Taxes
7-18
Table 7.5 shows that current experimenters who have everbought cigarettes spent approximately 4.0% of theirweekly discretionary income on cigarettes. Currentestablished smokers spent a greater proportion (15.9%) oftheir weekly discretionary income on cigarettes. Each
group may have spent less if they were given some of the cigarettes they smoked in the pastmonth, or possibly spent slightly more if they gave some cigarettes away. Regardless, even afterthe cigarette price increases of 1999, smoking accounts for only a small fraction ofexperimenters’ discretionary income, and is still a fairly modest fraction of the discretionaryincome of established smokers.
Generosity
Earlier research showed, and Chapter 9 confirms, that the majority of adolescent smokers do notexperience the price of cigarettes because they get their cigarettes from friends (Emery et al.,1999). Given the substantial price increases in 1999, it was expected that adolescents mightbegin to hesitate to share their increasingly expensive cigarettes. Thus, the 1999 CTS asked alladolescent ever-smokers who had given away cigarettes:
Have you ever refused to give or hesitated to give someone a cigarette when they asked for onebecause of how much cigarettes cost?
Table 7.6 presents the results of the analyses of the answers to this question from adolescentswho usually buy cigarettes (either themselves or have others buy for them).
Adolescent established smokersspent approximately 16% of theirweekly discretionary income oncigarettes.
Table 7.5Average Amount Smoked, Discretionary Income, and
Percent of Discretionary Income Spent on Cigarettes, 1999(usual source = buy myself or others buy for me)
Smoking Status AverageCigarettes/Day
WeeklyExpenditureson Cigarettes
WeeklyDiscretionary
Income
Percent ofDiscretionaryIncome Spenton Cigarettes*
CurrentExperimenter
1.0±0.5 $1.29±0.7 $37.69±11.4 4.0±1.6%
Current EstablishedSmoker
6.4±1.1 $7.99±1.3 $56.74±12.0 15.9±4.3%
*Manual calculations of this ratio do not produce exactly the same result as those generated with statistical softwarethat accounts for sample weights.Table entries are weighted percentages and 95% confidence limits.Source: CTS 1999

Price Sensitivity and Taxes
7-19
Table 7.6 shows that the majority (62.7±5.8%) of adolescentcigarette buyers neither hesitate nor refuse to give awaycigarettes because of the cost. Experimenters weresignificantly less likely to refuse and/or hesitate to giveaway cigarettes they had bought than were established
smokers. There were no significant differences in response across demographic groups or by theamount of money that teens have to spend on themselves each week (weekly discretionaryincome).
Since most adolescents do not buy their own cigarettes, but rather get them from others, it wouldbe expected that those adolescents who buy cigarettes must be bearing a considerable burden insupplying cigarettes to their friends. However, as shown above, only about a third hesitateand/or refuse to share their cigarettes. To assess the potential burden on those who buycigarettes, a generosity ratio was calculated as the proportion of cigarettes purchased byadolescents that are given away to other adolescents. The analyses of those who usually weregiven cigarettes were restricted to those who reported that the person who usually gave themcigarettes was under 18 years of age; buyers included those who reported that they usuallybought their own cigarettes or usually had others buy cigarettes for them.
Generosity = consumption of those who were given cigarettes by other teens(consumption of buyers + consumption of those given cigarettes by other teens)
If adolescents who bought cigarettes themselves or through an intermediary supplied all thecigarettes for those who were given cigarettes by another adolescent, then adolescent buyerspurchased slightly under 5 (4.8±0.8) packs of cigarettes/month, and gave away approximately ¼pack/month (0.24±0.1 packs/month). In other words, adolescent buyers gave awayapproximately 6.6% of the cigarettes they purchased, or slightly over 1 cigarette (1.3) from each
Price was not a deterrent togiving away cigarettes for themajority of adolescent cigarettebuyers.
Table 7.6Percent of Adolescent Cigarette Buyers
Who Refused or Hesitated to Give Away Cigarettes Because of Cost, 1999
Refused%
Hesitated%
Both Refusedand Hesitated
%
NeitherRefused nor
Hesitated%
Overall 14.3±3.6 9.5±2.8 13.6±4.3 62.7±5.8Smoking Status
Experimenter 10.5±5.3 5.6±3.7 7.4±6.0 76.5±7.6Established Smoker 17.0±5.8 12.2±4.6 18.0±5.8 52.9±6.7
Weekly Disposable Income$1-20 17.4±6.2 11.4±5.0 9.3±7.4 61.9±8.6> $20 13.0±4.4 7.5±4.0 16.5±6.4 63.0±7.1
Table entries are weighted percentages and 95% confidence limits.Source: CTS 1999

Price Sensitivity and Taxes
7-20
pack. At an average price of $4/pack, this amounts to an expenditure of little more than $1/monthto supply cigarettes to their friends. Even among those with the most restrictive levels ofdiscretionary income, there is not much financial disincentive to offering cigarettes to non-buyers.
Brand Smoked
The extra cost of premium cigarettes does not appear to deter adolescents from overwhelminglypreferring premium cigarettes to generics. The 1996 and 1999 CTS asked adolescent ever-smokers:
What brand of cigarettes do you usually smoke?
Nearly all adolescent ever smokers reported that they usually smoked premium brand cigarettes(96.7±1.1% in 1996 and 97.9±1.0% in 1999).
6. Summary
Cigarette prices in California increased by $1.36/pack, or 63%, between 1996 and 1999. Most ofthis increase came in 1999, when smokers in California experienced an increase ofapproximately $1.20/pack, resulting from the Proposition 10 $0.50/pack excise tax increase andtwo tobacco industry price increases in response to the provisions of the Multi-state MasterSettlement Agreement (Meier, 1998). The new tax passed by a narrow margin, and the anti-tobacco climate in California, fostered by the California Tobacco Control Program, may havemade the difference in countering the massive tobacco industry campaign to defeat the measure.
The average price/pack varied by smoking status, with lighter smokers paying a higherprice/pack on average than heavier smokers. This makes sense, since heavier smokers weremore likely to buy by the carton and to buy generic cigarettes, both ways to save money oncigarettes.
Using conservative estimates of the overall price elasticity of demand for cigarettes in California,it was shown that actual consumption levels decreased about as much as would have beenpredicted by a substantial price change—both in 1989, from the $0.25/pack Proposition 99excise tax increase, and in 1999 from the $1.20/pack increase due to the Proposition 10$0.50/pack excise tax and the tobacco industry price hikes after the Multi-state MasterSettlement Agreement.
Further, it was shown that there was minimal new tax evasion following the implementation ofthe $0.50/pack excise in January of 1999. Only 5.4% of adult smokers reported that they usuallybuy from non-taxed or lower-taxed sources, such as Indian reservations, military commissaries,out-of-state stores, or the Internet. The majority of adult smokers bought their cigarettes by thepack from convenience stores, liquor stores, or supermarkets—the most expensive sources ofcigarettes.
Price Sensitivity and Taxes
7-21
Despite the fact that they continued to buy their cigarettes from the most expensive sources, themajority of adult California smokers in 1999 reported that they were worried about the amountof money they spent on cigarettes. This contrasts with earlier years, when most adult smokersdid not worry about how much they were spending on cigarettes.
Even accounting for buying by the pack vs. the carton and generic vs. premium cigarettes, heavysmokers spent a substantial sum on smoking in 1999. On average, in 1999 light smokers (<15cigarettes/day) spent approximately $34/month; moderate smokers (15-24 cigarettes/day) spentapproximately $87/month; and heavy smokers (25+ cigarettes/day) spent approximately$159/month on smoking. These expenditures did not vary by income level.
Even after the implementation of the Proposition 10 $0.50/pack excise tax increase in 1999, amajority of Californians continued to support an additional cigarette excise tax of at least$0.50/pack. While the overall levels of support for such a tax represented a slight but significantincrease from 1996, support decreased significantly among current smokers.
As with adult smoking, the actual decrease in adolescent smoking was nearly identical to theexpected decrease, based on the price increase and adolescent price elasticity. Despite thesubstantial increases in cigarette prices, few adolescents reported that they had refused and/orhesitated to give away cigarettes because of the cost. Given that, on average, adolescents whobuy cigarettes give away only 1 cigarette out of each pack that they purchase, it is not surprisingthat for most adolescents who buy cigarettes, cost was not a reason to hesitate and/or refuse togive them away. Nearly all adolescents who smoke reported that they smoke premiumcigarettes, reflecting no change from previous years. Among adolescents who had ever boughtcigarettes, it was estimated that smoking accounted for approximately 4% of the disposableincome of experimenters, and 15% of the disposable income of established smokers.

Price Sensitivity and Taxes
7-22
CHAPTER 7: KEY FINDINGS
1. In 1999, California smokers experienced an increase of approximately $1.20/pack,resulting from the $0.50/pack excise tax increase due to the passage of Proposition 10 andfrom two tobacco industry price increases in response to the provisions of the Multi-stateMaster Settlement agreement.
2. In all survey years, younger smokers and lighter smokers reported paying significantlymore per pack than older smokers and heavier smokers.
3. Per capita cigarette consumption in California decreased by a factor of 20% following the1999 price increases; this decrease was nearly identical to the expected decrease, based onthe 52% average real price change between 1998 and 1999.
4. On average, smokers paid approximately $61/month to support their habit in 1999, anincrease by a factor of 50% from 1996. Light smokers (1-14 cigarettes/day) spentapproximately $34/month; moderate smokers (15-24 cigarettes/day) spent about$87/month; and heavy smokers (25+ cigarettes/day) spent nearly $160/month on smokingin 1999.
5. Monthly expenditures on smoking did not vary by household income, even after controllingfor the amount smoked.
6. Only 5.4±0.8% of California smokers avoided the new excise tax by usually purchasingcigarettes over the Internet (0.4±0.3%) at military commissaries (1.9±0.5%) on Indianreservations (0.3±0.3%), or out of state (3.5±0.5%).
7. Nearly 70% of California smokers reported that they usually buy their cigarettes from themost expensive sources—convenience stores, liquor/drug stores, and supermarkets.
8. Overall, over half (52.5±1.9%) of California smokers in 1999 reported that they wereworried about how much money they spend on cigarettes, an increase of nearly 50% from1996 (35.1±1.3%).
9. Even after the Proposition 10 $0.50/pack excise tax increase, approximately 70% of allrespondents in 1999 supported an excise tax increase of at least $0.25/pack—and nearly60% (58.2±1.3%) supported an increase of another $0.50/pack.
10. Based on the price change alone, it was expected that adolescent smoking prevalencewould decrease by a factor of 38% between 1996 and 1999; the actual decrease was 36%.
11. Despite the substantial increase in cigarette prices, the majority of adolescent cigarettebuyers neither hesitated nor refused to give away cigarettes because of the cost.

Price Sensitivity and Taxes
7-23
12. Adolescent established smokers spent approximately $8/week on cigarettes in 1999, whichamounted to approximately 16% of their discretionary income.
13. Nearly all adolescent ever-smokers smoked premium brand cigarettes.

Price Sensitivity and Taxes
7-24
CHAPTER 7: GLOSSARY
Adolescents
Current established smoker – has smoked a cigarette on at least one day in the past month andhas smoked at least 100 cigarettes in his or her lifetime.
Current experimenter – has smoked a cigarette on at least one day in the past month, but has notyet smoked 100 cigarettes in his or her lifetime.
Current smoker – has smoked a cigarette on at least one day in the past month.
Established smoker – has smoked at least 100 cigarettes in his or her lifetime.
Ever smoker – has smoked a cigarette (excludes puffers).
Experimenter – has smoked a cigarette (excludes puffers), but has not smoked at least 100cigarettes in his or her lifetime.
Puffer – someone who has not smoked a cigarette, but admits to puffing on one.
Adults
Current smoker – has smoked at least 100 cigarettes in his or her lifetime and smokes now (oldquestion) or now either everyday or some days (new question) at the time of the survey.
Former smoker – has smoked at least 100 cigarettes in lifetime, but does not smoke now (oldquestion) or now smokes not at all (new question).
Never smoker – has smoked fewer than 100 cigarettes in his or her lifetime.

Price Sensitivity and Taxes
7-25
CHAPTER 7: REFERENCES
Becker, G. S., M. Grossman, et al. An empirical analysis of cigarette addiction. Cambridge,MA, National Bureau of Economic Research; 1990.
California Board of Equalization and J. Fitz. Preliminary Estimates of California Cigarette TaxEvasion. Sacramento, Agency Planning and Research Division; 1999.
Chaloupka, F. and M. Grossman. Price, Tobacco Control Policies and Youth Smoking.Cambridge, MA, National Bureau of Economic Research; 1996.
Congressional Record and Senate. Comprehensive Anti-Tobacco Legislation: S5202; May 5,1998.
Emery, S. L., E. A. Gilpin, et al. How adolescents get their cigarettes: implications for policieson access and price. J Natl Cancer Inst 1999; 91(2): 184-186.
Hu, T.-W., H.-Y. Sung, et al. Reducing cigarette consumption in California: tobacco taxes vs. ananti-smoking media campaign. Am J Public Health. 1995;85:1218-1222.
Johnston, L.D., O'Malley, P. M., Bachman, J. G. Monitoring the Future National Survey Resultson Drug Use, 1975-1999. Volume 1: Secondary School Students. Rockville, MD: NationalInstitutes on Drug Abuse, 2000. (NIH Pub. No. 00-4802).
Lewit, E. M. and D. Coate. The potential for using excise taxes to reduce smoking. J HealthEcon. 1982;121-145.
Lewit, E. M., D. Coate, et al. The effects of government regulations on teenage smoking. J LawEcon 1981;24: 545-569.
Lewit, E. M., A. Hyland, et al. Price, public policy, and smoking in young people. Tob Control1997;(Suppl 2): S17-24.
Meier, B. Cigarette maker raises prices 45 cents a pack. New York Times; 1998.
National Cancer Institute. The Impact of Cigarette Excise Taxes on Smoking Among Childrenand Adults: Summary Report of a National Cancer Institute Expert Panel. Bethesda, MD,National Cancer Institute, Division of Cancer Prevention and Control, Cancer Control ScienceProgram; 1993.
O'Donoghue, T. and M. Rabin. The economics of immediate gratification. J Behav DecisionMaking 2000;13: 233-250.
Saba, R. P., T. R. Beard, et al. The demand for cigarette smuggling. Econ Inquiry. 1995;XXXIII(April): 189-202.

Price Sensitivity and Taxes
7-26
Shapiro, E. Price cut on Marlboro upsets rosy notions about tobacco profits. Wall StreetJournal: A1, A10; April 5, 1993.
Thaler, R. H. and H. M. Shefrin. An economic theory of self-control. J Political Economy.1981;86(2): 392-406.
U.S. Department of Health and Human Services (1989). Reducing the Health Consequences ofSmoking: 25 Years of Progress. A Report of the Surgeon General. Atlanta, GA, U.S. Departmentof Health and Human Services, Public Health Service, Centers for Disease Control, Center forChronic Disease Prevention and Health Promotion, Office on Smoking and Health. DHHSPublication No. (CDC) 89-8411.
U.S. Department of Health and Human Services. Reducing the Health Consequences of Smoking:25 Years of Progress. A Report of the Surgeon General. Atlanta, GA, U.S. Department of Healthand Human Services, Public Health Service, Centers for Disease Control, Center for ChronicDisease Prevention and Health Promotion, Office on Smoking and Health. DHHS Publication No.(CDC) 89-8411; 1989.

8-1
Chapter 8
MEDIA INFLUENCES ON SMOKING

Media Influences on Smoking
8-2
CHAPTER 8: MEDIA INFLUENCES ON SMOKING
Introduction
Throughout the 20th century, tobacco industry advertising and promotional activitieshave been major social and economic forces. During the 1990s, evidence accumulatedshowing that many of these activities were specifically targeted to encourage childrenand adolescents to take up smoking (Pierce et al. 1991; King, et al., 1998; Gilpin et al.,1997; Pierce et al., 1998). This research, together with tobacco industry documents thatdetailed the industry’s strategies to attract children and adolescents, informed themassive number of lawsuits against the tobacco industry and led to a proliferation oflocal ordinances banning tobacco advertising.
In 1998, the tobacco industry reached a settlement agreement with 46 states, which hadinitiated lawsuits to recover some of the social costs of smoking. The Multi-state MasterSettlement Agreement (MSA) included several provisions banning and/or limitingcigarette advertising, which became effective in 1999.
It is difficult to tell yet whether the tobacco industry actually stopped targeting youth inresponse to the MSA, or whether the restrictions effectively reduced adolescents’exposure to tobacco industry advertising and promotions. Recent research showed thatafter the MSA, the volume of cigarette advertisements in magazines with significantyouth readership actually increased (American Legacy Foundation, 2000). In addition,there is evidence that in-store cigarette advertising and promotions also increasedsignificantly after the MSA (Wakefield, et al, 2000). Therefore, there is certainly aperception of an on-going problem, which was not solved by the MSA.
Although the MSA included provisions to develop a substantial national anti-smokingmedia campaign, there were no MSA-related anti-smoking advertisements in the field in1999. Thus, the main source of Californians’ exposure to anti-smoking media remainedthe California Tobacco Control Program’s anti-smoking media campaign, which hasbeen in place to some degree since the TCP began in 1990.
The California Tobacco Surveys (CTS) provide data that show whether Californians’exposure and receptivity to tobacco industry advertisements and promotions, andexposure to anti-tobacco messages, have changed over time. Section 1 of this chapteranalyzes Californians’ exposure to cigarette advertising over time. Section 2 exploresevidence of adolescents’ and adults’ receptivity to cigarette advertising and promotions.Section 3 analyzes Californians’ exposure to anti-tobacco messages. Section 4 showsadults’ attitudes regarding regulation of tobacco industry advertising and promotions.Section 5 provides a summary of the chapter.

Media Influences on Smoking
8-3
1. Exposure to Cigarette Advertisements on Televised Sporting Events
Since 1996, several large cities and other municipalities in California have bannedtobacco advertising at local sporting events. The impact of these ordinances extendedbeyond reducing the exposure of the home game audience to tobacco advertising. Theseordinances also reduced the exposure of the entire television audience to tobaccoadvertising. In addition, the Master Settlement Agreement (MSA) specifically limitedtobacco companies to sponsoring one sporting or cultural event per brand in the US eachyear. The MSA did not limit sponsorship of events outside the US. With global satellitecoverage of nearly every major (and many minor) sporting and entertainment events, itwas unclear whether the MSA provisions would further limit exposure to this type ofadvertising.
The CTS cannot disentangle the specific effects of local ordinances banning tobaccoadvertising at sporting events versus the MSA restrictions, but the surveys do provideevidence about changes over time in Californians’ exposure to tobacco advertising ontelevised sporting events.
The 1996 and 1999 CTS asked all adults and adolescents the following question:
In the last year, how often have you seen a sports event on television in which you sawa logo of a tobacco product?
Figure 8.1 shows that among both adolescents andadults, the percent that replied they saw a logo on asports event on television “very often” in the pastyear decreased significantly between 1996 and1999. Among adolescents, the percent decreased by
0
5
10
15
20
25
Adolescents Adults
%
1996
1999
Adolescents and Adults Who Reported They Saw a Tobacco Brand Logoon a Televised Sporting or Cultural Event
"Very Often" in the Last Year
Source: CTS 1996, 1999 Figure 8.1
1996 1999
Adolescents 18.9 12.0
Adults 20.0 14.6
Between 1996 and 1999,exposure to tobacco logos ontelevised sporting eventsdecreased by a factor of 36.5%among California adolescents.

Media Influences on Smoking
8-4
a factor of 36.5%; among adults, the percent that saw a logo on a televised sports eventvery often decreased by a factor of 27.2%. These data suggest that the local ordinances,along with the provision of the MSA that deals with event sponsorship, may haveresulted in a decrease in exposure to tobacco industry advertising via this medium.
Appendix Tables A8.1 and A8.2 present detailed analyses of answers to this question bydemographic group and smoking status for adolescents and adults, respectively.
2. Receptivity to Cigarette Advertising and Promotions
Favorite Ad
In general terms, evidence exists that developing a positive attitude toward anadvertisement—liking the ad—is a precursor to product trial (MacKenzie, et al. 1986).Having a favorite cigarette ad significantly increases the probability that a committednever smoker will eventually progress toward smoking (Pierce, et al., 1998).
The 1993, 1996 and 1999 adolescent CTS and the 1996 and 1999 adult CTS asked allrespondents the following question:
What is the name of the cigarette brand of your favorite advertisement?
Respondents could provide the name of any brand to answer this question, but Marlboroand Camel accounted for the overwhelming majority of the responses. Thus, only theresults for Marlboro, Camel and no favorite ad are reported.
Adolescent committed never smokers are an interesting group to examine since theyhave the least risk of becoming smokers in the future. Thus, it is unlikely that theirability to name a favorite ad is related to any particular interest in smoking that couldhave preceded (and therefore conditioned) their exposure to the ad. Further, earlierresearch showed that among this group of never smokers, those who had a favorite adwere about two-thirds more likely than those without a favorite ad to progress towardsmoking (Pierce et al., 1998).
Figure 8.2 shows that between 1996 and 1999, thepercent of adolescent committed never smokers thatdid not name a favorite ad increased significantly(from 41.4±2.0% to 47.7±2.0%), while the percentthat named Camel as their favorite ad decreasedsignificantly (from 35.3±1.8% to 22.9±1.9%).However, the percent that named Marlboro increased
significantly over the same period (from 16.3±1.9% to 21.4±2.0%). While mostimportant for committed never smokers, this pattern was present in other groups of
Between 1996 and 1999, thedecrease in committed neversmokers’ preference forCamel as their favorite adwas more than half made upby their increased preferencefor Marlboro.

Media Influences on Smoking
8-5
adolescents as well. Thus, it appears that the increases in the percent that namedMarlboro at least partly accounted for the substantial decrease in the percent that namedCamel.
Figure 8.3 presents the percent of all respondents that named a favorite ad, by age group,in 1996 and 1999. The figure shows that in both 1996 and 1999, 15-17 year olds werethe most likely age group to name a favorite ad. The figure also shows that the
Favorite Ad Among Committed Never Smokers
0
10
20
30
40
50
60
Marlboro Camel None
%
1993 1996 1999
Source: CTS 1993, 1996, 1999 Figure 8.2
1993 1996 1999
Marlboro 15.4 16.3 21.4
Camel 36.1 35.3 22.9
None 38.6 41.4 47.7
0
20
40
60
80
12-14 15-17 18-20 21-24 25-44 45-64 65+
Age (years)
%
1996 1999
Respondents with a Favorite Ad
Source: CTS 1996, 1999 Figure 8.3
12-14 15-17 18-20 21-24 25-44 45-64 65+1996 64.9 73.3 60.0 61.8 51.9 42.6 28.31999 57.4 64.4 63.2 57.2 48.3 40.9 29.7
Media Influences on Smoking
8-6
decreases in the percent that could name a favorite ad were greatest among adolescents.Slightly more 18-20 year olds could name a favorite ad in 1999, compared to 1996.There were slight but insignificant decreases in the percent of 21-64 year olds with afavorite ad, and virtually no change in the percent of 65+ year olds with a favorite ad.
Appendix Tables A8.3 and A8.4 present adolescents’ and adults’ responses to thefavorite ad question, analyzed by demographics and smoking status.
Cigarette Brand Promotional Items
The tobacco industry spends a substantial proportion of its advertising and promotionalbudget on promotional items, such as t-shirts, baseball caps, duffel bags, key-chains, orbottle-openers emblazoned with cigarette brand logos. Tobacco promotional items alsocan include “gear” such as a leather jacket or other apparel, which is sometimes lessobviously branded, and available only through cigarette brand merchandise cataloguesby coupon exchange.
Consumer behavior theory indicates that promotional items are important incentives,which help maximize the probability that a potential consumer will purchase a givenbrand (Ray, 1982). Thus, possession of such an item strongly indicates a positivefeeling toward the brand.
A number of studies have linked the effectiveness of tobacco industry promotionalactivities with increases in adolescent smoking behavior (Pollay & Lavack, 1993; Evanset al., 1995; Gilpin et al., 1997; Pierce et al., 1998). Research has shown that adolescentcommitted never smokers who are willing to use a cigarette brand promotional item, oralready have one, are nearly 3 times as likely as those who have no item, and areunwilling to use one to progress toward smoking (Pierce, et al. 1998).
To assess adolescents’ and adults’ attitudes about, and actual use of, cigarette brandpromotional items, the 1996 and 1999 CTS asked all respondents the following question:
Some tobacco companies offer promotional items, such as clothing and bags, whichhave the company brand name or logo on them and which the public can buy orreceive for free. In the past 12 months have you . . .• Exchanged coupons for an item with a tobacco brand name or logo on it?• Received as a gift or for free, any item with a tobacco brand name or logo on it?• Purchased any item with a tobacco brand name or logo on it?
Altogether between 1996 and 1999, possession of apromotional item from one of these sources decreasedfrom 13.7±1.1% to 9.0±0.9% for adolescents, a factordecline of 34.5%. Adult rates also decreased, from10.5±0.6% in 1996 to 8.5±0.7% in 1999, a factordecrease of 18.8%.
Proportionally between 1996and 1999, the decrease in thepercent of adolescents thatreceived a free tobaccopromotional item was greaterthan for adults.

Media Influences on Smoking
8-7
Figure 8.4 shows fewer adolescents and adults received tobacco brand promotionalitems in 1999, compared to 1996. In 1996, significantly more adolescents than adultseither received such items for free or purchased them; approximately the same percent ofadults and adolescents exchanged coupons for promotional items. By 1999, thepercentages of adolescents and adults in each category were approximately equal.Between 1996 and 1999, the percent of adolescents that received a promotional item forfree decreased by a factor of 40%, whereas the percent of adults that received a freepromotional item decreased by a factor of 18%. This proportionally greater decreaseamong adolescents suggests that perhaps MSA provisions limiting the distribution ofpromotional items to adolescents were at least partly effective.
Appendix Tables A8.5 and A8.6 present the percent of adolescents and adults,respectively, that reported they received a tobacco brand promotional item (either as agift, from coupon exchange, or by purchasing it grouped together) by demographicgroups and smoking status.
0
2
4
6
8
10
12
14
%
1996 1999
Adolescents and Adults With Tobacco Brand Itemby How They Obtained It, 1996-1999
Source: CTS 1996, 1999 Figure 8.4
CouponExchange
ReceivedFree
Purchased
AdultsAdolescents
CouponExchange
ReceivedFree
Purchased
Adolescents Adults
CouponExchange
ReceivedFree
Purchased CouponExchange
ReceivedFree
Purchased
1996 4.4 10.8 3.7 4.5 8.3 2.11999 2.7 6.7 2.1 2.8 6.8 1.8

Media Influences on Smoking
8-8
Willingness to Use a Promotional Item
To specifically assess willingness to use tobacco brand promotional items, the followingquestion was asked of adolescents in 1996 and 1999, and of adults in 1999 only:
Do you think you would use a tobacco industry promotional item?
In 1996, 23.7±1.2% of adolescents were willing to use a tobacco brand promotionalitem, compared to 14.9±1.1% of adolescents in 1999—a factor decrease of 37.2%.Aside from the decrease in ownership of promotional items, the patterns in the percentof adolescents who had a promotional item and who were willing to use one were verysimilar between 1996 and 1999. Thus, for simplicity, Figure 8.5 uses only 1999 data toillustrate the relationship between having a promotional item, being willing to use apromotional item, and smoking experience among adolescents.
Significantly fewer committed never smokersreported having or being willing to use an item,compared to susceptible never smokers. Inturn, significantly fewer susceptible neversmokers than experimenters, and significantlyfewer experimenters than established smokers,had or were willing to use a tobacco branded
item. The figure also suggests that among never smokers and experimenters, there
0
10
20
30
40
50
%
Have promotional item
Would use promotional item
Adolescent Interest in Promotional Items, 1999
CommittedNever Smoker
SusceptibleNever Smoker
Experimenter EstablishedSmoker
Source: CTS 1999 Figure 8.5
Havepromotional item
Would usepromotional item
Committed Never Smoker 5.0 8.7
Susceptible Never Smoker 10.0 19.3
Experimenter 13.1 20.1
Established Smoker 29.9 40.5
There appears to be latent demandfor tobacco brand promotionalitems among adolescents acrosslevels of smoking experience:more adolescents are willing to usethan actually have an item.

Media Influences on Smoking
8-9
appears to be unsatisfied demand for tobacco brand promotional items: significantlymore committed and susceptible never smokers and experimenters were willing to usean item than actually had one.
Figure 8.6 shows a clear age trend in willingness to use a tobacco brand promotionalitem among adults. Young adults (ages 18-24) were significantly more likely to bewilling to use a tobacco promotional item than were adults over 25 years old.Comparing the willingness of young adults to use a promotional item with thewillingness of adolescents shows that in 1999 significantly more young adults (25.8±3.7% of 18-20 year olds and 27.9±2.9% of 21-24 year olds) were willing to use atobacco brand promotional item, compared to adolescents (11.7±1.4% of 12-14 yearolds and 18.1±1.5% of 15-17 year olds) (see Appendix Tables A8.7 and A8.8). Thistrend may reflect a shift in the tobacco industry’s marketing strategy after the MSA,more aggressively targeting the young adult market by sponsoring bar nights and otherentertainment specifically appealing to this age group.
Appendix Tables A8.7 and A8.8 present responses to this question across demographicgroups and smoking status for adolescents and adults, respectively.
Adults’ Willingness to Give Children/Adolescents Tobacco Brand Promotional Items
The 1999 CTS also explored adults’ willingness to give a child or teenager a tobaccobrand promotional item with the following two questions:
• Have you ever given a tobacco promotional item to a child or teenager?
11.7
17.6
23.1
27.925.8
0
5
10
15
20
25
30
35
18-20 21-24 25-44 45-64 65+
Age (years)
%
Adults Who Are Willing to Use a Tobacco Industry Promotional Item
Source: CTS 1999 Figure 8.6

Media Influences on Smoking
8-10
• Would you ever give a tobacco promotional item to a child or teenager if he or shewanted it?
Overall, only 1.2±0.2% of adults responded that theyhad ever given a tobacco promotional item to a childor teenager. Significantly more adults (7.6±0.6%)reported that they would give such an item to a child
or teenager if he or she wanted it. This pattern was consistent across demographicgroups.
Figure 8.7 shows that having given or being willing to give a tobacco brand promotionalitem to a child or teenager was associated with adult smoking status. Current smokershad higher rates than former smokers, who in turn showed higher rates than neversmokers. In each category of smoking status, very few adults reported that they hadactually given a child or teenager a tobacco brand promotional item, but significantlymore reported they were willing to give a child or teen such an item.
3. Anti-Tobacco Media Exposure
Between 1996 and 1999, there were important developments in the California TobaccoControl Program, which may have affected Californian’s exposure to anti-tobacco mediamessages. In fiscal years 1994-1995 and 1995-1996, funding for the California TobaccoControl Program (TCP)—which develops and runs anti-tobacco advertisements on
0
4
8
12
16
Never smoker Former smoker Current smoker
%
Ever Given
Willing to Give
Adults That Have/Were Willing to Give a Child or Teenager aTobacco Brand Promotional Item, by Adult Smoking Status
Source: CTS 1999 Figure 8.7
Never smoker Former smoker Current smokerEver given 0.7 2.0 3.0Willing to give 5.5 8.1 13.8
Very few adults either hadgiven or were willing to give atobacco brand promotionalitem to a child or teenager.
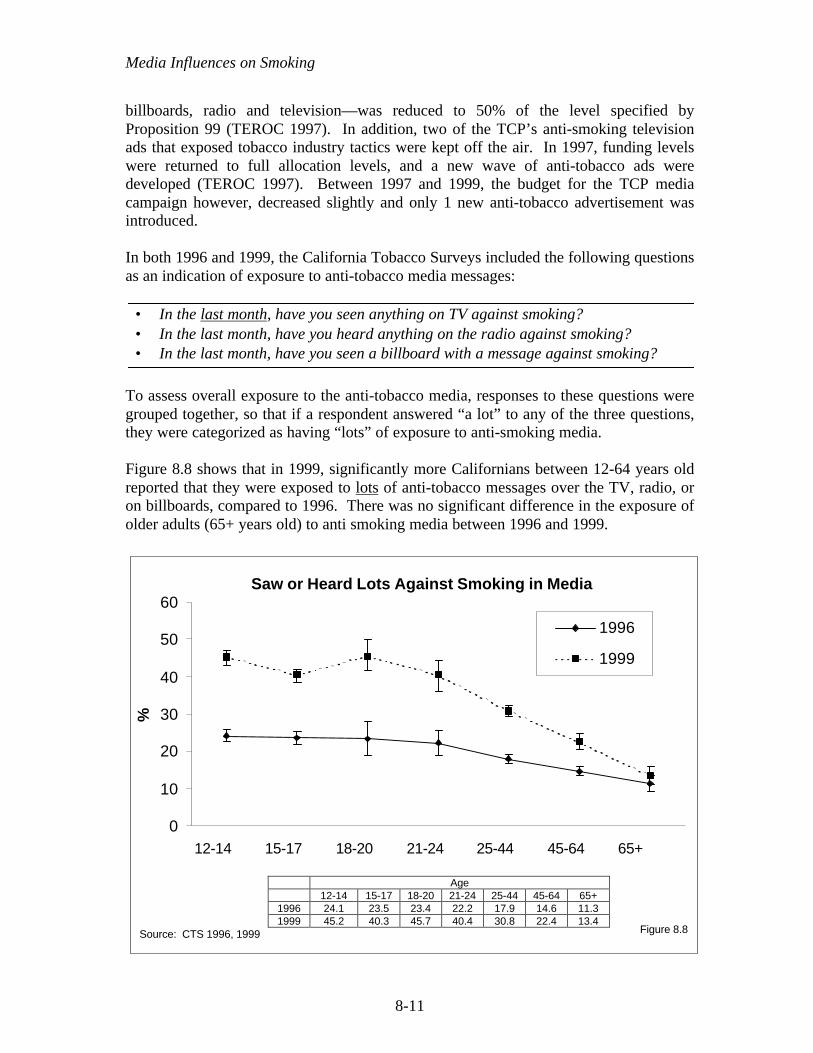
Media Influences on Smoking
8-11
billboards, radio and television—was reduced to 50% of the level specified byProposition 99 (TEROC 1997). In addition, two of the TCP’s anti-smoking televisionads that exposed tobacco industry tactics were kept off the air. In 1997, funding levelswere returned to full allocation levels, and a new wave of anti-tobacco ads weredeveloped (TEROC 1997). Between 1997 and 1999, the budget for the TCP mediacampaign however, decreased slightly and only 1 new anti-tobacco advertisement wasintroduced.
In both 1996 and 1999, the California Tobacco Surveys included the following questionsas an indication of exposure to anti-tobacco media messages:
• In the last month, have you seen anything on TV against smoking?• In the last month, have you heard anything on the radio against smoking?• In the last month, have you seen a billboard with a message against smoking?
To assess overall exposure to the anti-tobacco media, responses to these questions weregrouped together, so that if a respondent answered “a lot” to any of the three questions,they were categorized as having “lots” of exposure to anti-smoking media.
Figure 8.8 shows that in 1999, significantly more Californians between 12-64 years oldreported that they were exposed to lots of anti-tobacco messages over the TV, radio, oron billboards, compared to 1996. There was no significant difference in the exposure ofolder adults (65+ years old) to anti smoking media between 1996 and 1999.
0
10
20
30
40
50
60
12-14 15-17 18-20 21-24 25-44 45-64 65+
%
1996
1999
Saw or Heard Lots Against Smoking in Media
Source: CTS 1996, 1999 Figure 8.8
Age12-14 15-17 18-20 21-24 25-44 45-64 65+
1996 24.1 23.5 23.4 22.2 17.9 14.6 11.31999 45.2 40.3 45.7 40.4 30.8 22.4 13.4

Media Influences on Smoking
8-12
Some of the increase in exposure to anti-smokingmedia between 1996 and 1999 likely reflected thechange in the TCP’s media budget and activitiesbeginning in 1996, compared to earlier when thebudget was cut. The data in the first row of Table8.1 are for an 18-month period, but nonethelessrepresent a lower budget than subsequently.However, the real expenditures (adjusted forinflation) for anti-tobacco media by the California
Tobacco Control Program changed very little between 1997 and 1998, and actuallydecreased slightly in 1999. Therefore, it is also possible that some of the increase inmedia exposure reflected the growing news coverage of tobacco industry litigation andregulation.
Table 8.1California Tobacco Control Program Anti-tobacco Media Expenditures
($ Millions, Adjusted to 1999$)Outdoor Media(billboards, etc.)
$ Millions
General PublicMedia*
(Adults/Teens) $ Millions
Media* Aimedat Teens,
12-17 Years$ Millions
Total$ Millions
1995-1996** 2.10 9.44 0.81 12.351997 2.35 8.64 4.42 15.411998 2.59 9.20 3.74 15.531999 2.12 10.06 1.84 14.03*TV, radio, and miscellaneous
**18-month periodSource: California Department of Health Services Media Plans: 1997, 1998, 1999.
4. Attitudes About Tobacco Advertising Regulation
To assess adults’ attitudes about further regulation of tobacco industry advertising andpromotional strategies, the 1999 CTS asked all adults the following three questions:
• Do you think schools should prohibit students from wearing clothing or bringinggear with tobacco brand logos to school?
• Should the tobacco industry be permitted to offer items such as clothing orcamping equipment in exchange for coupons on cigarette packs?
• Do you think that advertising of tobacco products should be allowed or banned?
Table 8.2 presents the percent of respondents that answered affirmatively to the abovequestions, by demographic groups and smoking status.
Both the increased funding forthe Tobacco Control Program’smedia campaign starting in 1997and the extensive newscoverage of tobacco industrylitigation probably contributed tothe increased self-reportedexposure to anti-tobacco mediain 1999.

Media Influences on Smoking
8-13
Table 8.2 shows that in 1999, the majority of adults inCalifornia thought that schools should prohibitstudents from wearing clothes with tobacco brandlogos or bringing gear with such logos to school. Themajority of California adults in 1999 also thought that
Table 8.2Adult Attitudes about Regulating Tobacco Industry
Advertising and Promotional Activities in 1999Schools Should
Prohibit WearingClothes or BringingGear with Tobacco
Logos to School
% Agree
Industry ShouldNot be Permitted to
Offer Items forCoupons on
Cigarette Packs
% Agree
Advertising ofTobacco ProductsShould be Banned
% AgreeOverall 68.9 (±1.0) 58.0 (±1.0) 63.2 (±0.9)Gender Male 63.4 (±1.5) 51.2 (±1.6) 56.2 (±1.5) Female 74.2 (±1.3) 64.6 (±1.5) 70.0 (±1.2)Age 18-24 64.1 (±2.2) 51.7 (±3.0) 55.7 (±2.8) 25-44 69.4 (±1.5) 55.4 (±1.6) 62.3 (±1.3) 45-64 70.8 (±2.0) 59.4 (±1.7) 66.4 (±1.6) 65+ 68.3 (±2.6) 69.9 (±2.8) 67.4 (±3.5)Race/Ethnicity African American 72.0 (±4.4 59.3 (±5.8) 64.1 (±5.0) Asian/PI 68.5 (±4.1) 58.0 (±3.9) 68.1 (±4.1) Hispanic 76.9 (±2.0) 68.2 (±2.3) 76.8 (±2.0) Non-Hispanic White 64.9 (±1.3) 52.9 (±1.4) 55.3 (±1.3)Education <12 75.8 (±3.2) 67.2 (±3.3) 80.6 (±2.4) 12 70.3 (±2.0) 60.3 (±1.9) 64.0 (±1.6) 13-15 66.8 (±2.1) 54.0 (±2.0) 57.3 (±2.1) 16+ 64.6 (±1.7) 53.1 (±1.8) 55.6 (±1.8)Smoking Status Never smoker 72.3 (±1.3) 62.5 (±1.6) 67.1 (±1.4) Former smoker 67.6 (±2.5) 60.5 (±2.2) 63.2 (±2.2) Current smoker 60.2 (±1.6) 40.7 (±1.8) 51.1 (±1.5)Table entries are weighted percentages and 95% confidence limits.Source: CTS 1999
In 1999, nearly two-thirds ofCalifornians thought that alladvertising of tobaccoproducts should be banned.

Media Influences on Smoking
8-14
the tobacco industry should not be permitted to offer promotional items in exchange forcoupons from cigarette packs. Further, the majority if California adults also thought thatall advertising of tobacco products should be banned.
Men were significantly less likely than women to answer positively to the abovequestions. Young adults (18-24 years old) were significantly less likely than adults over25 years old to respond that they thought schools should prohibit students from wearingclothes or bringing gear to school with tobacco brand logos on them. Similarly, 18-24year olds were significantly less likely than adults over 45 years old to respond that theythought the tobacco industry should not be permitted to offer items for coupons or thatadvertising of tobacco products should be banned. Non-Hispanic White adults weresignificantly less likely than adults of other race/ethnic groups to agree to the questionsabout regulation. As education levels increased, support for regulating tobaccoadvertising and promotional activities decreased. Current smokers were significantlyless likely than never or former smokers to advocate further regulation of tobaccoindustry advertising and promotional activities.
5. Summary
The chapter showed that between 1996 and 1999, Californians’ exposure to tobaccoadvertising on televised sporting events decreased.
Several measures indicated that Californians—and adolescents in particular—were lessreceptive to tobacco industry advertising and promotional activities in 1999 than in1996. For example, significantly more adolescents had no favorite cigaretteadvertisement and significantly fewer named Camel as the brand of their favorite ad in1999, compared to 1996 or 1993. However, significantly more adolescents namedMarlboro as the brand of their favorite advertisement in 1999. The percent ofCalifornia adults with no favorite cigarette advertisement changed very little between1996 and 1999.
The CTS data showed that significantly fewer adults and adolescents obtained tobaccobrand promotional items, either for free, by coupon exchange or by purchasing the itemsin 1999, compared to 1996. Significantly fewer adolescents were willing to use atobacco brand promotional item in 1999, compared to 1996. The 1999 CTS dataconfirmed the relationship between having or being willing to use a tobacco brandpromotional item and adolescent smoking status. The data also showed thatsignificantly more never smokers and experimenters were willing to use such an item,compared to the number that actually had an item. Among adults in 1999, willingness touse a tobacco brand promotional item was inversely related to age: 27.9±2.9% of 21-24year olds were willing to use an item, compared to 23.1±1.5% of 25-44 year olds andonly 11.7±1.6% of 65+ year olds.
In 1999, very few adults reported that they had ever given a child or teenager a tobaccobrand promotional item, but significantly more adults reported that they would bewilling to give a child or teenager such an item if he or she wanted it. Willingness to
Media Influences on Smoking
8-15
give a child or teenager a tobacco brand promotional item was related to adult smokingstatus: current smokers were significantly more willing to give a child or teenager apromotional item than were former or never smokers.
For all but the oldest adults, Californians reported significantly more exposure to anti-smoking media in 1999 than in 1996. This finding probably reflects restored programmedia budgets and the publicity surrounding the Master Settlement Agreement.
A majority of adults supported further regulation of tobacco industry advertising andpromotional activities.

Media Influences on Smoking
8-16
CHAPTER 8: KEY FINDINGS
1. Exposure to tobacco advertising, in the form of seeing logos on televised sportingevents, decreased significantly among both adolescents (by a factor of 36.5%) andadults (by a factor of 27.2%) between 1996 and 1999.
2. The percentage of adolescent committed never smokers that named Camel as thebrand of their favorite advertisement decreased significantly between 1996 and1999. However, the percent that named Marlboro as the brand of their favorite adincreased significantly.
3. Among all respondents, having a favorite brand of cigarette advertisements wasinversely related to age: around 60% of respondents under age 25 had a favoritead, while less than half of adults between 25 and 64 years old, and fewer than 30%of those 65 years and older had a favorite ad.
4. Fewer adolescents (by a factor of 34.5%) and adults (by a factor of 18.8%)received tobacco promotional items in 1999, compared to 1996. In 1999,9.0±0.9% of adolescents received a promotional item.
5. Significantly fewer adolescents (14.9±1.1%) were willing to use a tobacco brandpromotional item in 1999, compared to 1996 (23.7±1.2%).
6. In both 1996 and 1999, significantly more adolescents were willing to use atobacco brand promotional item than actually had such an item, suggesting thatthere may be some unsatisfied demand for these items across all levels of smokingexperience.
7. In 1999, significantly more young adults (18-24 years old) than adolescents werewilling to use a tobacco brand promotional item.
8. Overall, only 1.2±0.2% of adults reported that they had ever given a tobaccopromotional item to a child or teenager. Significantly more—but still very few—adults (7.6±0.6%) reported that they would be willing to give a child or teenagersuch an item if they wanted it.
9. In 1999, considerably more Californians between 12-64 years old reported thatthey were exposed to lots of anti-tobacco messages over the TV, radio, or onbillboards, compared to 1996. Some of this increase may reflect the volume ofnews coverage of the tobacco industry litigation and regulation during 1997-1999.
10. In 1999, 68.9±1.0% of adults reported that they thought schools should prohibitstudents from wearing clothes with tobacco logos or bringing gear with tobaccologos to school. Nearly as many reported that they thought the industry should notbe permitted to offer items in exchange for coupons on cigarette packs(58.0±1.0%) and that the advertising of tobacco products should be completelybanned (63.2±0.9%).

Media Influences on Smoking
8-17
CHAPTER 8: APPENDIX
This appendix presents supporting tabular data for demographic and smoking statusgroups for the material covered in the main body of the chapter. The tables relevant toeach section are shown under the corresponding chapter section and subsection heading.
1. Exposure to Cigarette Advertisements of Televised Sporting Events
Table A8.1Adolescent Reporting Seeing a Tobacco Logo on a Televised Sports Event
Very Often in the Last Year
1996%
1999%
FactorDecrease
1996-1999%
Overall 18.9 (±1.1) 12.0 (±1.0) -36.4Gender Male 22.1 (±1.9) 14.4 (±1.5) -35.0 Female 15.4 (±1.3) 9.5 (±1.5) -38.2Age 12-14 17.9 (±1.6) 10.2 (±1.1) -43.0 15-17 19.9 (±1.6) 13.9 (±1.4) -30.1Race/Ethnicity African American 16.6 (±3.6) 13.4 (±4.3) -18.8 Asian/PI 16.1 (±3.1) 10.9 (±3.5) -32.4 Hispanic 16.4 (±1.7) 10.4 (±1.4) -36.6 Non-Hispanic White 21.9 (±1.6) 13.8 (±1.6) -36.9School Performance Much better than average 20.8 (±2.5) 14.2 (±2.6) -31.4 Better than average 18.9 (±1.8) 11.8 (±1.7) -37.5 Average and below 17.9 (±1.5) 11.2 (±1.3) -37.6Smoking Status Committed never smoker 17.5 (±1.8) 11.0 (±1.3) -37.2 Susceptible never smoker 18.4 (±2.3) 12.0 (±1.9) -35.0 Non-current experimenter 20.3 (±2.3) 14.4 (±3.0) -29.0 Current experimenter 21.2 (±5.7) 11.2 (±3.9) -47.3 Non-current established 26.8 (±10.3) 16.9 (±13.4) -37.0 Current established 22.4 (±5.6) 15.3 (±5.1) -31.8
Table entries are weighted percentages and 95% confidence limits.Source: CTS 1996,1999
Appendix Table A8.1 shows that overall, the percent of adolescents that reported seeinga tobacco logo on a televised sports event very often in the last year decreased by a

Media Influences on Smoking
8-18
factor of 36.4%, from 18.9±1.1% in 1996 to 12.0±1.0% in 1999. The decrease wasslightly larger for females compared to males. Importantly, the factor decrease wasquite large (43.0%) for 12-14 year olds.
In 1996, a significantly higher percentage of Non-Hispanic Whites reported seeing atobacco logo on a televised sports event very often in the past year, compared torespondents of other race/ethnic groups. By 1999, there were no significant differencesin exposure between the different race/ethnic groups. Exposure did not varysignificantly by school performance or smoking status.
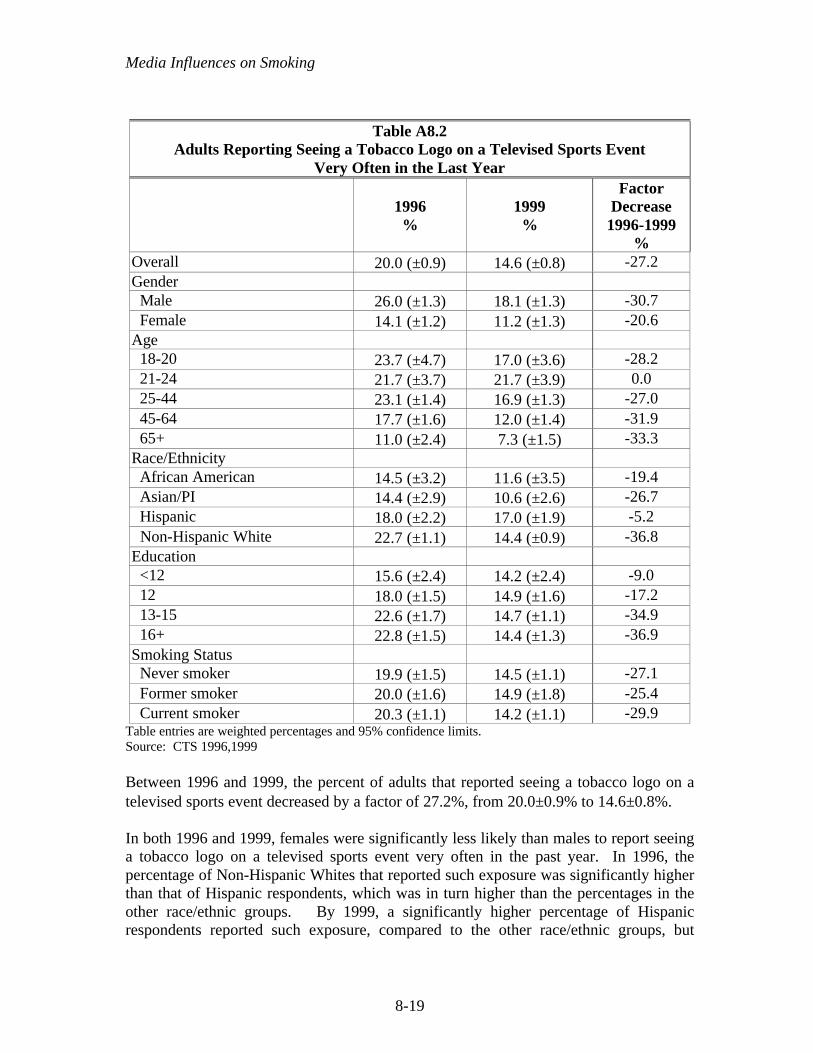
Media Influences on Smoking
8-19
Table A8.2Adults Reporting Seeing a Tobacco Logo on a Televised Sports Event
Very Often in the Last Year
1996%
1999%
FactorDecrease
1996-1999%
Overall 20.0 (±0.9) 14.6 (±0.8) -27.2Gender Male 26.0 (±1.3) 18.1 (±1.3) -30.7 Female 14.1 (±1.2) 11.2 (±1.3) -20.6Age 18-20 23.7 (±4.7) 17.0 (±3.6) -28.2 21-24 21.7 (±3.7) 21.7 (±3.9) 0.0 25-44 23.1 (±1.4) 16.9 (±1.3) -27.0 45-64 17.7 (±1.6) 12.0 (±1.4) -31.9 65+ 11.0 (±2.4) 7.3 (±1.5) -33.3Race/Ethnicity African American 14.5 (±3.2) 11.6 (±3.5) -19.4 Asian/PI 14.4 (±2.9) 10.6 (±2.6) -26.7 Hispanic 18.0 (±2.2) 17.0 (±1.9) -5.2 Non-Hispanic White 22.7 (±1.1) 14.4 (±0.9) -36.8Education <12 15.6 (±2.4) 14.2 (±2.4) -9.0 12 18.0 (±1.5) 14.9 (±1.6) -17.2 13-15 22.6 (±1.7) 14.7 (±1.1) -34.9 16+ 22.8 (±1.5) 14.4 (±1.3) -36.9Smoking Status Never smoker 19.9 (±1.5) 14.5 (±1.1) -27.1 Former smoker 20.0 (±1.6) 14.9 (±1.8) -25.4 Current smoker 20.3 (±1.1) 14.2 (±1.1) -29.9
Table entries are weighted percentages and 95% confidence limits.Source: CTS 1996,1999
Between 1996 and 1999, the percent of adults that reported seeing a tobacco logo on atelevised sports event decreased by a factor of 27.2%, from 20.0±0.9% to 14.6±0.8%.
In both 1996 and 1999, females were significantly less likely than males to report seeinga tobacco logo on a televised sports event very often in the past year. In 1996, thepercentage of Non-Hispanic Whites that reported such exposure was significantly higherthan that of Hispanic respondents, which was in turn higher than the percentages in theother race/ethnic groups. By 1999, a significantly higher percentage of Hispanicrespondents reported such exposure, compared to the other race/ethnic groups, but

Media Influences on Smoking
8-20
otherwise there were no significant differences between race/ethnic groups. The factordecrease in exposure among Hispanics was only 5.2% between 1996 and 1999,compared to 19.4% for African Americans, 26.7% for Asian/PIs, and 36.8% for Non-Hispanic Whites.
In 1996, exposure was higher among more highly educated respondents, but by 1999there were no significant differences across education levels. In both 1996 and 1999,there were no significant differences across smoking status in exposure.

Media Influences on Smoking
8-21
2. Receptivity to Cigarette Advertising and Promotions
Favorite Ad
Table A8.3Adolescents’ Named Brand of Favorite Advertisement
Marlboro Camel None
1993%
1996%
1999%
1993%
1996%
1999%
1993%
1996%
1999%
Overall 20.6 (±1.7) 22.1 (±1.4) 26.2 (±1.5) 39.5 (±2.0) 38.6 (±1.3) 25.6 (±1.3) 29.0 (±2.0) 30.9 (±1.2) 39.1 (±1.2)Gender
Male 21.8 (±2.4) 25.2 (±1.9) 28.9 (±2.0) 46.7 (±2.6) 40.8 (±1.8) 25.7 (±1.7) 25.0 (±2.9) 28.1 (±1.4) 37.6 (±1.8) Female 19.4 (±2.0) 18.6 (±2.0) 23.1 (±1.9) 32.3 (±2.8) 36.1 (±2.3) 25.4 (±1.8) 32.9 (±2.8) 34.1 (±2.1) 40.8 (±1.8)Age
12-14 18.2 (±2.2) 17.8 (±1.7) 24.2 (±2.2) 41.0 (±2.6) 38.3 (±1.9) 25.2 (±2.0) 31.0 (±2.4) 35.1 (±1.9) 42.6 (±2.1) 15-17 23.3 (±2.7) 26.3 (±2.0) 28.1 (±2.0) 37.8 (±2.9) 39.0 (±2.0) 25.9 (±2.0) 26.7 (±2.6) 26.7 (±1.7) 35.6 (±2.0)Race/Ethnicity
African American 7.1 (±3.1) 6.8 (±2.7) 14.3 (±3.9) 35.8 (±7.5) 33.1 (±4.0) 26.0 (±5.8) 34.0 (±8.1) 35.7 (±4.5) 38.8 (±5.2) Asian/PI 19.1 (±4.8) 25.7 (±4.2) 25.5 (±6.0) 34.3 (±6.6) 32.6 (±5.1) 25.9 (±4.9) 35.1(±7.5) 32.7 (±4.6) 37.9 (±5.1) Hispanic 25.2 (±3.5) 26.5 (±2.6) 30.2 (±2.4) 36.8 (±4.2) 34.7 (±2.8) 21.0 (±2.1) 29.7 (±3.8) 32.9 (±2.5) 42.2 (±2.4) Non-Hisp White 20.2 (±2.1) 20.7 (±1.6) 25.3 (±1.9) 42.9 (±2.5) 43.1 (±1.7) 29.5 (±1.8) 26.4 (±2.4) 28.6 (±1.9) 36.8 (±2.2)School Performance
Much better 17.8 (±3.4) 18.2 (±3.0) 22.4 (±2.5) 38.4 (±4.0) 38.6 (±2.7) 25.2 (±2.3) 33.4 (±4.8) 32.7 (±3.0) 39.9 (±2.6) Better than average 17.8 (±2.7) 19.8 (±1.9) 24.6 (±2.2) 40.4 (±3.6) 42.0 (±2.6) 27.3 (±2.1) 30.1 (±3.2) 30.4 (±2.2) 39.3 (±2.3) Average and below 24.1 (±2.7) 26.6 (±2.1) 29.4 (±2.0) 39.2 (±3.0) 35.4 (±2.2) 24.2 (±2.0) 26.2 (±2.8) 30.3 (±2.1) 38.5 (±2.3)Smoking status
Committed never smoker
15.4 (±2.0) 16.3 (±1.9) 21.4 (±2.0) 36.1 (±2.4) 35.3 (±1.8) 22.9 (±1.9) 38.6 (±2.6) 41.4 (±2.0) 47.7 (±2.0)
Susceptible never smoker
24.4 (±4.9) 20.7 (±3.1) 28.1 (±3.9) 39.5 (±5.2) 42.2 (±3.2) 27.8 (±3.3) 25.6 (±4.9) 28.4 (±3.1) 34.1 (±3.1)
Non-current experimenter
21.6 (±3.0) 23.4 (±2.9) 31.0 (±2.9) 45.3 (±4.1) 42.7 (±3.4) 27.4 (±3.0) 20.3 (±3.6) 23.2 (±2.7) 32.0 (±2.9)
Current experimenter
33.7 (±7.3) 43.4 (±5.8) 38.0 (±6.9) 41.3 (±9.2) 34.7 (±5.6) 30.8 (±7.1) 14.1 (±5.2) 13.5 (±3.5) 16.9 (±4.9)
Non-current established
31.8 (±18.0) 36.3 (±11.6) 34.0 (±14.0) 35.9 (±17.4) 35.7 (±10.2) 38.5 (±15.5) 21.3 (±11.2) 17.0 (±9.8) 22.3 (±15.2)
Current Established
38.6 (±7.7) 38.4 (±5.6) 40.0 (±8.0) 40.2 (±7.4) 40.0 (±5.3) 30.0 (±5.8) 8.6 (±3.7) 13.4 (±4.4) 15.4 (±6.3)
Table entries are weighted percentages and 95% confidence limits.Source: CTS 1993,1996,1999
Appendix Table A8.3 shows that in 1993 and 1996, fewer girls than boys named Camelor Marlboro as the brand of their favorite ad, but by 1999, this gender gap was no longerstatistically significant. Significantly fewer African-American adolescents namedMarlboro as their favorite ad in each year, compared to teens of other racial/ethnicgroups. Similarly, significantly more Hispanic adolescents named Marlboro in eachyear, compared to adolescents of other racial/ethnic groups. There were no significantdifferences between racial/ethnic groups and only minimal differences in favorite ads byschool performance or smoking status, except that committed never smokers aresignificantly more likely to have no favorite tobacco ad.

Media Influences on Smoking
8-22
Table A8.4Adults' Named Brand of Favorite Advertisement
Marlboro Camel None1996
%1999
%1996
%1999
%1996
%1999%
Overall 21.4 (±1.1) 24.2 (±1.2) 18.3 (±0.9) 13.0 (±0.8) 52.3 (±1.4) 54.5 (±1.1)Gender Male 25.5 (±1.6) 28.1 (±1.5) 21.7 (±1.3) 14.9 (±1.1) 46.9 (±2.1) 49.7 (±1.7) Female 17.4 (±1.1) 20.4 (±1.4) 15.0 (±1.0) 11.1 (±1.1) 57.7 (±1.4) 59.2 (±1.4)Age 18-20 24.1 (±3.8) 28.4 (±4.9) 27.9 (±4.2) 24.3 (±4.1) 40.0 (±5.2) 36.8 (±4.5) 21-24 26.4 (±3.5) 27.5 (±4.1) 28.0 (±3.1) 22.1 (±3.6) 38.2 (±4.1) 42.8 (±4.4) 25-44 23.6 (±1.6) 25.6 (±1.7) 20.1 (±1.5) 14.2 (±1.1) 48.1 (±2.0) 51.7 (±1.5) 45-64 19.9 (±1.8) 23.4 (±2.5) 14.8 (±1.5) 9.4 (±1.4) 57.4 (±2.5) 59.1 (±2.7) 65+ 12.3 (±2.1) 17.1 (±2.9) 8.8 (±2.3) 5.6 (±1.4) 71.7 (±3.3) 70.3 (±3.1)Race/Ethnicity African American 11.2 (±2.8) 12.8 (±2.7) 17.6 (±3.7) 13.0 (±3.5) 54.1 (±4.8) 57.4 (±5.3) Asian/PI 27.2 (±4.3) 29.4 (±5.8) 14.4 (±3.3) 12.2 (±4.0) 49.3 (±5.1) 50.3 (±5.8) Hispanic 24.8 (±2.5) 27.7 (±2.5) 15.1 (±1.9) 9.9 (±1.4) 54.6 (±2.8) 57.8 (±2.4) Non-Hispanic White 20.4 (±1.1) 22.9 (±1.2) 20.5 (±1.1) 14.7 (±0.9) 51.4 (±1.5) 53.3 (±1.1)Education <12 22.9 (±3.4) 25.6 (±4.3) 12.5 (±2.3) 8.6 (±2.3) 58.2 (±3.5) 60.1 (±3.8) 12 22.5 (±1.8) 26.4 (±1.6) 17.7 (±1.4) 13.9 (±1.3) 50.7 (±2.5) 51.6 (±2.1) 13-15 21.3 (±1.7) 22.8 (±1.5) 22.1 (±1.7) 15.2 (±1.5) 47.7 (±2.0) 53.2 (±1.9) 16+ 19.3 (±1.7) 22.4 (±1.9) 19.9 (±1.7) 13.3 (±1.5) 53.7 (±1.9) 54.5 (±2.0)Smoking Status Never smoker 18.0 (±1.5) 20.3 (±1.7) 17.9 (±1.4) 12.9 (±1.2) 57.4 (±1.9) 60.3 (±1.7) Former smoker 21.9 (±2.0) 27.3 (±2.5) 18.4 (±2.1) 11.5 (±1.3) 52.0 (±2.8) 53.3 (±2.4) Current smoker 31.1 (±1.5) 31.7 (±1.6) 19.6 (±1.0) 15.5 (±1.3) 37.7 (±1.4) 38.8 (±1.7)
Table entries are weighted percentages and 95% confidence limits.Source: CTS 1996,1999
Appendix Table A8.4 indicates that in both 1996 and 1999, significantly fewer femalesnamed Marlboro or Camel as their favorite brand, and significantly more femalesreported no favorite brand. In both years, as age increased above the 21-24 year old agegroup, the percent that named Marlboro or Camel as a favorite ad decreased (and thepercent that responded “none” increased).
In both years, significantly fewer African Americans named Marlboro as the brand oftheir favorite ad, but there were no significant differences between racial/ethnic groupsin the percent that named Camel or “none” as the brand of their favorite ad. In 1999,significantly fewer adults with at least some college education named Marlboro as thebrand of their favorite ad, compared to adults with no college education. In both 1996

Media Influences on Smoking
8-23
and 1999, significantly fewer adults who had not graduated from high school namedCamel as the brand of their favorite ad, compared to other adults.
In both 1996 and 1999, significantly fewer current smokers than former smokers, and inturn significantly fewer former than never smokers, reported “none” as the brand of theirfavorite ad. Correspondingly, significantly more current smokers named Marlboro asthe brand of their favorite ad, compared to never smokers. There was no differenceacross smoking status in the percent that named Camel as the brand of their favorite ad.

Media Influences on Smoking
8-24
Cigarette Brand Promotional Items
Table A8.5Adolescents with Tobacco Brand Promotional Items(Exchanged Coupons, Received Free, or Purchased)
1996%
1999%
Factor Decrease1996-1999
%Overall 13.7 (±1.1) 9.0 (±0.9) -34.5Gender Male 16.2 (±1.8) 10.8 (±1.4) -33.0 Female 11.0 (±1.3) 6.9 (±1.1) -36.6Age 12-14 11.5 (±1.4) 8.1 (±1.1) -30.1 15-17 15.8 (±1.6) 9.9 (±1.3) -37.6Race/Ethnicity African American 11.9 (±3.8) 7.9 (±3.1) -33.3 Asian/PI 14.1 (±3.7) 8.4 (±3.2) -40.7 Hispanic 12.6 (±2.0) 8.7 (±1.5) -30.9 Non-Hispanic White 14.1 (±1.2) 9.3 (±1.1) -33.9School Performance Much better than average 10.3 (±1.5) 7.1 (±1.9) -31.3 Better than average 13.4 (±1.8) 8.3 (±1.6) -37.8 Average and below 15.9 (±1.8) 10.4 (±1.4) -34.4Smoking Status Committed never smoker 6.9 (±1.1) 5.0 (±1.0) -27.5 Susceptible never smoker 12.4 (±2.2) 10.0 (±2.1) -18.9 Non-current experimenter 18.0 (±3.1) 12.2 (±)2.3 -32.5 Current experimenter 20.8 (±4.6) 16.8 (±5.9) -19.3 Non-current established 37.5 (±13.1) 30.0 (±17.0) -20.0 Current established 41.7 (±6.3) 29.9 (±7.7) -28.3
Table entries are weighted percentages and 95% confidence limits.Source: CTS 1996,1999
Appendix Table A8.5 shows that overall, the percent of adolescents that reported theyhad either exchanged coupons for, received as a gift, or purchased a tobacco brand itemdecreased significantly, by a factor of 34.5% between 1999 and 1996. In both 1996 and1999, boys were significantly more likely than girls to have tobacco brand merchandise.In 1996, older teens were slightly more likely to have an item, but this difference wasnot significant by 1999. In both years, there were no significant differences acrossrace/ethnicity in the percent of adolescents who reported they had tobacco brand items.Possession of items was less prevalent in students with much better or better thanaverage school performance.

Media Influences on Smoking
8-25
Adults and Promotional Items
Table A8.6Adults with Tobacco Brand Promotional Items
(Exchanged Coupons, Received Free, or Purchased)
1996%
1999%
Factor Change1996-1999
%Overall 10.5 (±0.6) 8.5 (±0.7) -18.8Gender Male 12.9 (±1.1) 9.5 (±0.8) -26.2 Female 8.2 (±0.7) 7.6 (±1.1) -7.4Age 18-20 15.4 (±2.8) 11.7 (±3.1) -23.6 21-24 16.3 (±3.0) 11.9 (±2.5) -27.0 25-44 13.1 (±1.0) 9.9 (±1.0) -25.0 45-64 7.7 (±1.1) 7.7 (±1.6) 0.7 65+ 1.7 (±0.6) 2.6 (±0.9) 52.9Race/Ethnicity African American 10.5 (±2.8) 10.9 (±2.5) 3.5 Asian/PI 8.2 (±1.9) 6.5 (±3.8) -20.4 Hispanic 11.0 (±1.8) 9.3 (±1.5) -15.3 Non-Hispanic White 10.6 (±0.7) 8.0 (±0.6) -24.1Education <12 10.5 (±1.8) 9.9 (±2.3) -6.2 12 13.9 (±1.2) 11.5 (±1.3) -17.1 13-15 11.6 (±1.2) 8.9 (±1.2) -23.1 16+ 6.3 (±0.8) 4.3 (±0.8) -31.7Smoking Status Never smoker 5.9 (±0.9) 5.1 (±1.1) -13.1 Former smoker 7.5 (±1.0) 6.5 (±1.0) -12.4 Current smoker 28.5 (±1.5) 21.9 (±1.5) -23.2Table entries are weighted percentages and 95% confidence limits.Source: CTS 1996,1999
Appendix Table A8.6 shows that in 1999, overall significantly fewer adults reported thatthey received a promotional item, either by exchanging coupons, for free as a gift, or bypurchasing an item themselves, compared to 1996. In both 1996 and 1999, men weresignificantly more likely than women to have tobacco brand merchandise.
The table shows an interesting age effect: in both 1996 and 1999, younger adults (18-24years old) were slightly less likely to have a promotional item than those in the 25-44year old age group, and significantly less likely than 45-64 year olds—who in turn weresignificantly less likely than adults over 65 years old to have a promotional item. While
Media Influences on Smoking
8-26
the factor change between 1996 and 1999 in the percent of adults between 18 and 44years of age was negative and significant, there was a slight but insignificant increase inthe percent of 45-64 year olds and a significant increase in the percent of 65+ year oldswith a promotional item.
There were no significant differences across race/ethnicity in the percent of adults with apromotional item in either year. The percent of African Americans with an itemincreased slightly between 1996 and 1999, while the percent of adults in the otherrace/ethnic groups decreased; however, the decrease was significant only in Non-Hispanic Whites. In 1996, individuals with a college degree were significantly lesslikely than were others to report that they had a promotional item in both 1996 and 1999.
Very few adult never smokers reported having a promotional item in either 1996 or1999; former smokers were about one-third as likely to have a promotional item as werecurrent smokers.

Media Influences on Smoking
8-27
Willingness to Use a Promotional Item
Table A8.7Adolescent Willingness to Use a Tobacco Brand Promotional Item
1996%
1999%
FactorDecrease
1996-1999%
Overall 23.7 (±1.2) 14.9 (±1.1) -37.2Gender Male 28.8 (±1.8) 19.7 (±1.7) -31.6 Female 18.1 (±1.7) 9.6 (±1.3) -46.6Age 12-14 19.4 (±1.6) 11.7 (±1.4) -39.5 15-17 28.0 (±1.6) 18.1 (±1.5) -35.3Race/Ethnicity African-American 18.4 (±4.0) 11.6 (±3.2) -37.1 Asian/PI 23.0 (±5.1) 14.3 (±3.6) -38.0 Hispanic 25.4 (±2.9) 17.6 (±2.3) -30.9 Non-Hispanic White 23.5 (±1.6) 13.0 (±1.3) -44.8School Performance Much better than average 16.6 (±2.2) 11.6 (±1.9) -30.1 Better than average 23.2 (±2.0) 13.1 (±1.7) -43.7 Average and below 28.2 (±1.9) 18.1 (±2.0) -36.0Smoking Status Committed never smoker 12.7 (±1.4) 8.7 (±1.3) -31.3 Susceptible never smoker 27.5 (±2.9) 19.3 (±3.0) -29.7 Non-current experimenter 28.5 (±2.4) 18.9 (±3.2) -33.5 Current experimenter 38.7 (±4.8) 24.8 (±6.5) -35.8 Non-current established 46.8 (±10.6) 28.6 (±14.2) -38.9 Current established 54.1 (±6.5) 43.6 (±6.7) -19.3
Table entries are weighted percentages and 95% confidence limits. Source: CTS 1996,1999
Appendix Table A8.7 shows that among adolescents, significantly fewer girls than boyswere willing to use a tobacco brand promotional item in either 1996 or 1999. Also inboth years, a significantly lower percentage of younger adolescents (12-14 years old)were willing to use a promotional item, compared to older adolescents (15-17 years old).
In 1996, there were no significant differences across race/ethnicity in the percentage ofadolescents willing to use a tobacco brand promotional item. By 1999, significantlymore Hispanic teens than African Americans or Non-Hispanic Whites were willing touse a tobacco brand promotional item. In both years, willingness to use an item was

Media Influences on Smoking
8-28
directly related to smoking experience, and inversely related to self-perceived schoolperformance.
Table A8.8Adult Willingness to Use a Tobacco Brand
Promotional Item, 19991999
%Overall 20.5 (±0.9)Gender Male 26.5 (±1.3) Female 14.8 (±1.0)Age 18-20 25.8 (±3.7) 21-24 27.9 (±2.9) 25-44 23.1 (±1.5) 5-64 17.6 (±1.5) 65+ 11.7 (±1.6)Race/Ethnicity African American 21.0 (±4.3) Asian/PI 16.0 (±2.5) Hispanic 15.4 (±1.4) Non-Hispanic White 23.7 (±1.2)Education <12 15.5 (±2.0) 12 23.9 (±1.5) 13-15 23.8 (±1.4) 16+ 17.8 (±1.4)Smoking Status Never smoker 13.2 (±1.1) Former smoker 20.6 (±1.8) Current smoker 43.3 (±1.7)Table entries are weighted percentages and 95% confidence limits.Source: CTS 1996,1999
Appendix Table A8.8 shows that in 1999, significantly fewer women than men werewilling to use a tobacco brand promotional item. The table also showed that willingnessto use a promotional item decreased with age. Significantly more Non-Hispanic Whiteadults were willing to use an item, compared to Asian/PI or Hispanic adults.Significantly more adults with 12-15 years of education were willing to use a tobaccobrand promotional item, compared to those with fewer than 12 years or 16+ years ofeducation. Not surprisingly, willingness to use was associated with smoking status, withsignificantly fewer never smokers than former smokers, and significantly fewer formersmokers than current smokers, willing to use such an item.

Media Influences on Smoking
8-29
CHAPTER 8: GLOSSARY
Adolescents
Committed never smoker – a never smoker who does not expect to try a cigarette soonand who answers definitely not to whether he or she would accept a cigarette offered bya friend and to a question about whether he or she will smoke in the next year.
Current established smoker – has smoked a cigarette on at least one day in the pastmonth and has smoked at least 100 cigarettes in his or her lifetime.
Current experimenter – has smoked a cigarette on at least one day in the past month, buthas not yet smoked 100 cigarettes in his or her lifetime.
Established smoker – has smoked at least 100 cigarettes in his or her lifetime.
Experimenter – has smoked a cigarette (excludes puffers), but has not smoked at least100 cigarettes in his or her lifetime.
Former established smoker – an established smoker who has not smoked a cigarette onany days of the past month.
Non-current established smoker – see former established smoker.
Non-current experimenter – has not smoked a cigarette on any days in the past month,and has not smoked at least 100 cigarettes in his or her lifetime.
Puffer – someone who has not smoked a cigarette, but admits to puffing on one.
Susceptible never smoker – a never smoker who either expects to try a cigarette soon orwho does not answer definitely not to whether he or she would accept a cigarette offeredby a friend or to a question about whether he or she will smoke in the next year.
Adults
Current smoker – has smoked at least 100 cigarettes in his or her lifetime and smokesnow (old question) or now either everyday or some days (new question) at the time ofthe survey.
Former smoker – has smoked at least 100 cigarettes in lifetime, but does not smoke now(old question) or now smokes not at all (new question).
Never smoker – has smoked fewer than 100 cigarettes in his or her lifetime.

Media Influences on Smoking
8-30
CHAPTER 8: REFERENCES
American Legacy Foundation. 2000. American Legacy Foundation Statement by CherylG. Healton, Dr. P.H., President and CEO. World wide web:http://www.americanlegacy.org/community/releases/analysis_5_16_00.html (accessedSeptember, 2000).
Evans N, Farkas AJ, Gilpin, EA, Berry CC, Pierce, JP. Influence of tobacco marketingand exposure to smoking on adolescent susceptibility to smoking. Journal of theNational Cancer Institute. 1995;87:1538-1545.
Gilpin EA, Pierce JP, Rosbrook B. Are adolescents receptive to current sales promotionpractices of the tobacco industry. Preventive Medicine. 1997;26:14-21.
King C, Siegel M, Celebucki C, Connoly GN. Adolescent exposure to cigaretteadvertising in magazines: An evaluation of brand-Specific advertising in relation toyouth readership. JAMA, 1998:279:516-520.
MacKenzie, SB, et al. 1986. The role of attitude toward the ad as a mediator ofadvertising effectiveness: a test of competing explanations. J of Marketing Research,XXIII:May, 130-43.
Pierce JP, Gilpin E, Burns DM, Whalen E, Rosbrook B, Shopland D, Johnson M. Doestobacco advertising target young people to start smoking? Evidence from California.JAMA. 1991;266:3154-3158.
Pierce JP, Choi W, Gilpin EA, Farkas AJ, Berry CC. Tobacco industry promotion ofcigarettes and adolescent smoking. JAMA. 1998; 279:511-515.
Pollay RW, Lavack AM. The targeting of youths by cigarette marketers: Archivalevidence on trial. In: Advances in Consumer Research. McAlister M, Rothschild ML,eds; 1993.
Ray ML. Advertising and Communication Management. Englewood Cliffs, NJ: PrenticeHall; 1982.
TEROC. “Toward a Tobacco-Free California: Fourth Master Plan for the CaliforniaTobacco Control Program.” Tobacco Education and Research Oversight Committee:Sacramento, CA; 1997.
Wakefield MA, Terry YM, Chaloupka FJ, et al. Changes at the point-of-sale for tobaccofollowing the 1999 tobacco billboard ban. ImpacTeen Research Paper Series, No. 4.Chicago, IL; 2000.

9-1
Chapter 9
ACCESS TO AND EASE OF PURCHASE OF CIGARETTES

Access to and Ease of Purchase of Cigarettes
9-2
CHAPTER 9: ACCESS TO AND EASE OF PURCHASE OF CIGARETTES
Introduction
Adolescents can get their cigarettes from two very different types of sources: commercial andsocial. So far, public policy has emphasized restrictions on commercial sources of cigarettes.Limiting the ability of minors to purchase cigarettes or other tobacco products is a seeminglypractical and politically popular measure aimed at curbing teens smoking. By California law, theminimum age for the purchase of cigarettes or smokeless tobacco is 18 years old. In 1994,California enacted the Stop Tobacco Access to Kids Enforcement (STAKE) Act, whichstrengthened the state’s ban on the sale of tobacco products to minors. Later, the Department ofHealth Services initiated “sting” inspections of retail establishments that sold cigarettes, andincreased the fines for noncompliance with the STAKE Act. Each of these strategies aimed toreduce teen smoking by making it difficult for adolescents to purchase cigarettes.
Analyses of the 1996 California Tobacco Surveys (CTS) showed that California’s stronglegislative record against tobacco sales to minors actually affected very few adolescents. Thevast majority of teen smokers in 1996 did not buy cigarettes, but rather got them from friends.Teen smokers did not begin to purchase cigarettes until they were nearly daily smokers (Emery,et al., 1999).
Since 1996, two things have changed, which may have affected the ease with which adolescentscan get cigarettes from both sources. First, as Chapter 4 showed, fewer adolescents smoke; thus,there should be fewer social sources of cigarettes. Second, both the state’s Tobacco ControlProgram and the tobacco industry itself have instituted media campaigns, which focussed publicattention on the law limiting adolescents’ commercial access to tobacco, with the goal ofincreasing compliance. In addition, grass-roots approaches to reducing commercial accesscontinued the activities they began in the late 1980s.
The 1999 California Tobacco Survey allows exploration of several aspects of adolescent accessto cigarettes. Section 1 of this chapter examines adolescents’ perceptions of the ease of obtainingcigarettes; Section 2 looks at trends in never smokers getting offered cigarettes; Section 3analyzes the ways in which adolescents obtain the cigarettes they smoke. Section 4 examineswhere adolescents buy cigarettes, and Section 5 reports on adults’ attitudes about laws aimed atreducing teens’ access to cigarettes. Section 6 summarizes the findings from this chapter.
1. Adolescent Never Smokers’ Perceptions of the Ease of Obtaining Cigarettes
The perception of how easy it is to get cigarettes may influence never smokers’ willingness toexperiment. If it takes some effort to get cigarettes, some adolescents may be less open to trying.To assess adolescents’ perceptions about how easy it is to obtain cigarettes, the 1990, 1993, 1996and 1999 CTS asked:
Do you think it would be easy or hard for you to get cigarettes if you wanted some?

Access to and Ease of Purchase of Cigarettes
9-3
Only adolescents who had never smoked—not even a puff—wereconsistently asked the above question in each survey. Figure 9.1shows that the percentage of never smokers who thought cigaretteswere easy to get did not change significantly between 1990 and1996, but decreased significantly in between 1996 and 1999, from57.2±1.5% to 48.0±1.5% (by a factor of 16.1%).
In 1996 and 1999, all respondents were asked specifically about getting a few or a pack ofcigarettes:
Do you think it would be easy, somewhat difficult, or hard to buy: (a pack of cigarettes; a fewcigarettes ([not a carton or pack]).
Cigarettes must be purchased by the pack; in fact it is illegal for stores to sell single cigarettes.Thus, responses about the ease of getting a few cigarettes largely reflect adolescents’ perceptionsof the ease of obtaining cigarettes from social sources. In contrast, answers about the ease ofgetting a pack of cigarettes mostly indicate adolescents’ perceptions about buying cigarettes.
Table 9.1 presents adolescent’s answers to these questions, by age, sex, and race/ethnicity forboth years. The table shows that between 1996 and 1999, adolescents’ perceptions that it is easyto obtain cigarettes, either a few at a time or by the pack, decreased significantly across alldemographic groups. However, the decrease in perceived ease of obtaining a few cigarettes(social sources) was smaller than the decrease in the perception that it is easy to buy a pack ofcigarettes (commercial sources).
Never Smokers Who Think It Would Be Easy To Get Cigarettes
48.057.256.957.9
0
10
20
30
40
50
60
70
1990 1993 1996 1999
% o
f N
ever
Sm
oke
rs
Source: CTS 1990, 1993, 1996, 1999Figure 9.1
Between 1996 and 1999,the percent of neversmokers who thoughtcigarettes were easy toget decreased by a factorof 16%.

Access to and Ease of Purchase of Cigarettes
9-4
In 1999, the CTS data included census tract information, which made it possible to compareresponses from rural and urban areas. Table 9.1 shows that there is very little difference betweenthe perceptions of rural and urban youth on the ease of access to cigarettes.
Because the legal purchase age for cigarettes is 18 years, it might be expected that youngeradolescents would think it is harder to buy a pack of cigarettes than do older adolescents.Indeed, the data show that in both 1996 and 1999 younger adolescents were less likely than olderadolescents to report that they thought it was easy to buy a pack of cigarettes, and the decrease inthe perceived ease of buying a pack of cigarettes was greatest among the youngest adolescents.Between 1996 and 1999, the perception that it is easy to buy a pack of cigarettes decreased byover a factor of 50% among adolescents between 12-15 years of age. There was not muchdifference between boys’ and girls’ responses to this question in either year, or in the percentagedecrease for boys and girls over the 3-year interval between surveys.
Table 9.1Adolescents’ Perceptions about the Ease of Buying Cigarettes
by Demographic Characteristics% Who Think it’s Easyto Get a Few Cigarettes
(Primarily Social Sources)
% Who Think it’s Easyto Buy a Pack
(Primarily CommercialSources)
1996%
1999%
FactorDecrease1996-99
%
1996%
1999%
FactorDecrease1996-99
%Overall 69.1±1.2 47.4±1.3 -31.4 51.5±1.4 26.7±1.3 -48.2Age
12-13 46.2±2.3 28.8±2.1 -37.7 24.7±2.3 9.5±1.3 -61.414-15 74.9±2.4 51.6±2.7 -31.1 55.4±2.1 24.6±2.5 -55.616-17 86.4±1.8 63.0±2.7 -27.1 74.8±2.3 47.3±2.6 -36.7
SexMale 69.5±1.6 44.8±2.0 -35.5 50.6±1.9 25.4±1.8 -49.9Female 68.8±1.8 49.9±1.7 -27.5 52.4±1.9 28.0±2.0 -46.6
Race/EthnicityAfrican American 69.1±4.3 51.3±5.8 -25.7 55.3±4.9 28.2±4.9 -49.0
Asian/PI 64.0±3.1 42.8±4.3 -33.1 43.1±4.6 26.8±4.7 -37.9Hispanic 64.6±2.6 46.1±2.4 -28.7 46.2±2.8 24.9±2.2 -46.0Non-Hispanic White 73.5±1.6 49.3±2.1 -33.0 56.5±1.9 28.1±1.8 -50.3
Rural/UrbanRural 46.7±4.4 27.1±3.0Urban 47.5±1.4 26.7±1.4
Table entries are weighted percentages and 95% confidence limits.Source: CTS 1996, 1999

Access to and Ease of Purchase of Cigarettes
9-5
Once adolescents have started smoking and are in the processof developing a nicotine addiction, they will need to buy morethan just a few cigarettes. At this point, they are more likelyto attempt to purchase a pack of cigarettes. Figure 9.2 showsthat significantly fewer 15-17 year old experimenters (current
and non-current), established occasional and established daily smokers thought that it was easyto buy a pack of cigarettes in 1999 than in 1996. Perceptions were associated with smokingexperience: in 1996, significantly fewer experimenters than either occasional or daily establishedsmokers thought it was easy to buy a pack of cigarettes. In 1999, significantly fewerexperimenters than daily established smokers thought it was easy to buy a pack of cigarettes butthere was no significant difference in the perceptions of experimenters and occasionalestablished smokers. It is important that even established smokers, both occasional and daily,thought it was more difficult to buy a pack of cigarettes in 1999 than in 1996. The decrease inperceptions that it is easy to buy cigarettes may play a role in preventing progression fromexperimentation to daily smoking.
0
20
40
60
80
100
%
1996
1999
Source: CTS 1996, 1999 Figure 9.2
Perception of Ease of Buying a Pack of Cigarettes (Age 15-17 Years)
Experimenter
Established Smokers
Occasional Daily
SmokingExperience
1996 1999
Experimenter 73.2 45.7
Occasional 86.8 52.5
Daily 93.4 63.7
Compared to 1996, fewercurrent smokers reported itwas easy to buy a pack ofcigarettes in 1999.

Access to and Ease of Purchase of Cigarettes
9-6
Figure 9.3 illustrates the changes in perceptions of 12-14 year olds about the ease of getting afew cigarettes for committed never smokers and susceptible never smokers. Perceptions aboutthe ease of getting a few cigarettes may be most relevant to these adolescents, who have not yetbegun to smoke or are in the early stages of smoking uptake. The figure shows that perceptionsof the ease of obtaining cigarettes are associated with the level of commitment not to smoke.
In both 1996 and 1999, less than half of committed neversmokers thought it was easy to get a few cigarettes. Between1996 and 1999, the percent of committed never smokers thatthought it was easy to get a few cigarettes decreased by afactor of 36.5%. In both years, significantly more susceptiblethan committed never smokers thought it was easy to get afew cigarettes. Between 1996 and 1999, the percent of
susceptible never smokers that thought it was easy to get a few cigarettes decreased by a factorof 22.5%. Because the data are cross-sectional, it is impossible to determine whether perceptionsabout ease of getting a few cigarettes are influenced by the adolescents’ level of commitment notto smoke or if these perceptions affect commitment.
0
20
40
60
80
100
Committed never smoker Susceptible never smoker
%
1996
1999
Adolescent Smoking Experience
Perception of Ease of Obtaining a Few Cigarettes (Age 12-14 years)
Source: CTS 1996, 1999 Figure 9.3
CommittedNever Smoker
SusceptibleNever Smoker
In both 1996 and 1999,susceptible never smokerswere more likely thancommitted never smokers tothink that it was easy to get afew cigarettes.
1996 1999
Committed never smoker 44.7 28.4
Susceptible never smoker 54.7 42.4
Access to and Ease of Purchase of Cigarettes
9-7
These changes in perceptions about the ease of obtaining cigarettes may be attributable toincreased grass-roots efforts in many communities to reduce illegal sales of cigarettes to minors.In both Los Angeles and the San Francisco area, local lead agencies and community-basedorganizations have initiated merchant education programs and other activities designed to reduceadolescent access to cigarettes through commercial sources. For example, the Stop TobaccoAccess for Minors Project (STAMP) in Solano County conducts its own compliance checks andproduces merchant educational materials and training workshops, which have been adopted inseveral communities across the state (Kropp, 1999).
National regulation may also have played a role. In February of 1997, a new regulation issuedby the Federal Drug Administration (FDA) went into effect making it illegal to sell cigarettes toyouths under the age of 18, banning the placement of cigarette machines in most locations(which was already the case in California), and mandating photo ID checks for personsappearing to be under the age of 27 years. The FDA mounted a media campaign in support ofthe new regulation and made funds available to California and other states to enforce it.However, a Federal Court of Appeals invalidated this regulation in August 1998.
In addition, advertising campaigns—by both the Tobacco Control Program and the tobaccoindustry—which focused on making sure that merchants asked to see proof-of-age when sellingcigarettes may have also influenced adolescents’ perceptions about the ease of obtainingcigarettes. The California Tobacco Control Program media campaign encouraged individuals tocall a toll-free number (1-800-5-ASK 4 ID) to report merchants who illegally sold cigarettes tominors. Results from the random compliance checks (or “sting” operations) that were conductedas part of the strengthened STAKE Act were widely publicized, and promoted the norm thatselling cigarettes to minors is unacceptable. Around the same time, the tobacco industryimplemented the “It’s the Law” publicity campaign. Although it has been argued that suchcampaigns do not have much practical effect in limiting teen access to cigarettes or deterringadolescent smoking (DiFranza & Brown, 1992; DiFranza, et al, 1996; Glantz, 1996), theevidence from the California Tobacco Surveys suggests that at least they may have influencedadolescents’ perceptions about the ease of obtaining cigarettes.
2. Never Smokers Offered Cigarettes
Chapter 4 showed that fewer adolescents smoked in 1999; the data presented above showed thatfewer adolescents think it is easy to get cigarettes in 1999. However, despite the significantreduction in the number of adolescents who smoke and perceptions of ease of access from bothcommercial and social sources, there have only been modest changes in never smokers’opportunities to obtain cigarettes. As another measure of the availability of cigarettes fromsocial sources, the 1990, 1996, and 1999 CTS asked all never smokers:
Have you ever been offered a cigarette?
Table 9.2 shows that approximately 40% of all never smokersreported that they had been offered cigarettes in 1990, 1996,and 1999. The table shows few statistically significantchanges in the percent of never smokers who were offered
In 1999, nearly one quarter of12-13 year old never smokersreported being offered acigarette.

Access to and Ease of Purchase of Cigarettes
9-8
cigarettes between 1990 and 1999. Older adolescents were more likely in each year to reportthat they had been offered cigarettes, probably because smoking prevalence increases with age,and therefore, older adolescents are more likely to know smokers. Nearly a quarter of theyoungest age group (12-13 years old) reported being offered cigarettes in each survey, which is acause for concern. There were no significant differences between ethnic groups. Slightly morestudents whose school performance was average and below reported being offered cigarettes,compared to average and better than average students.
Figure 9.4 shows that in both 1996 and 1999, committed never smokers were significantly lesslikely than susceptible never smokers to be offered cigarettes. One component of the definitionof susceptibility is responding other than “definitely not” to the question, “If one of your bestfriends were to offer you a cigarette, would you smoke it?” The cross-sectional CTS data areunable to show whether susceptibility precedes the offer of cigarettes, or if the offer leads tosusceptibility. Moreover, it is impossible to determine from these data whether some susceptiblenever smokers actively seek out smokers to get an offer of a cigarette.
Table 9.2Percent of Never Smokers Offered Cigarettes
1990%
1996%
1999%
Factor Change1990-1999
%Overall 37.9±2.3 42.3±1.6 40.9±1.6 7.7Age
12-13 24.0±3.8 24.8±1.9 23.2±2.4 -3.414-15 42.1±3.8 49.2±2.7 45.5±2.9 8.016-17 55.1±4.8 61.0±2.9 62.1±3.3 12.7
GenderFemale 37.3±3.5 39.2±2.3 38.8±2.5 4.0Male 38.6±2.9 45.2±2.2 42.8±2.0 10.8
Race/EthnicityAfrican American 37.6±6.6 44.5±5.3 41.9±6.0 11.5Asian/PI 28.0±7.5 33.0±4.6 32.7±4.9 16.6Hispanic 41.3±4.8 46.7±3.1 45.5±2.8 10.1Non-Hispanic White 37.1±2.2 41.1±2.0 39.0±2.6 5.1
School PerformanceMuch Better thanAverage
36.5±5.2 37.1±2.9 32.9±3.3 -9.9
Better than Average 34.8±3.2 42.7±2.2 38.1±2.6 9.5Average and Below 41.7±3.6 45.6±2.6 47.8±2.8 14.6
Table entries are weighted percentages and 95% confidence limits.Source: CTS 1990, 1996, 1999

Access to and Ease of Purchase of Cigarettes
9-9
3. How Do Adolescents Usually Get Cigarettes?
Public policy on reducing adolescents’ access to cigarettes has focussed on effectively barringsales of cigarettes to minors. Whether this strategy actually limits adolescents’ access tocigarettes is controversial; several studies have shown that such laws have minimal impact onadolescent smoking (Chaloupka & Grossman, 1996; Rigotti, et al., 1997). Evidence from theCTS suggests that, whether or not minimum purchase age laws reduce adolescents’ ability to buycigarettes, such laws do not affect the majority of adolescent smokers, because most adolescentsdo not buy their own cigarettes (Emery, et al., 1999).
Usual Source of Cigarettes
The 1996 and 1999 CTS asked adolescents who had ever smoked a cigarette:
Which of the following best describes how you usually get most of the cigarettes that yousmoke? Would you say . . .
• I buy them myself,• Someone in my home buys them for me,• Someone in my home gives them to me,• I take them from someone in my home without permission,• Other people buy them for me,• Other people give them to me,• I take them from other people without permission, or• I take them from a store without permission?
0
10
20
30
40
50
60
Committed Never Smoker Susceptible Never Smoker
%
1996
1999
Never Smokers Offered Cigarettes
Source: CTS 1996, 1999 Figure 9.4
1996 1999
Committed Never Smoker 37.0 37.0
Susceptible Never Smoker 51.8 49.7

Access to and Ease of Purchase of Cigarettes
9-10
These responses were grouped into four categories:
• Buy myself, which included only the response: I buy them myself.• Someone buys for me, which included the responses: Someone in my home buys them for me
and Other people buy them for me.• Others give them to me, which included the responses: Someone in my home gives them to
me and Other people give them to me.• Take them, which included the responses: I take them from someone in my home without
permission, I take them from other people without permission, or I take them from a storewithout permission.
Figure 9.5 shows that sources of cigarettes for thoseadolescents who have ever smoked remained relativelyconstant between 1996 and 1999. In 1999, most adolescents(61.3±3.4%) still obtained their cigarettes from friends orothers, without paying for them. Another 21.9±2.5% also got
their cigarettes from others, by having others buy their cigarettes for them. In 1999, significantlyfewer ever smokers bought their own cigarettes than did in 1996, and this difference was madeup for by the other categories in relatively equal and small increases.
Table 9.3 provides details of where adolescents get their cigarettes, by smoking status, age,gender, ethnicity, and rural/urban residence. This table shows that nearly three-quarters ofexperimenters were usually given the cigarettes they smoked in 1996 and 1999, while only
Source of Cigarettes
0
10
20
30
40
50
60
70
Buy them myself Someone buys them for me Someone gives them to me I take them% A
do
lesc
ent
Eve
r S
mo
kers
1996
1999
Source: CTS 1996, 1999 Figure 9.5
Buy themmyself
Someone buys them for me
Someone givesthem to me
I take them
1996 1999
Buy them myself 16.1 9.3
Someone buys them for me 20.2 21.9
Someone gives them to me 58.4 61.3
I take them 5.3 7.5
In 1999, less than 10% ofadolescent ever smokersusually bought their owncigarettes.
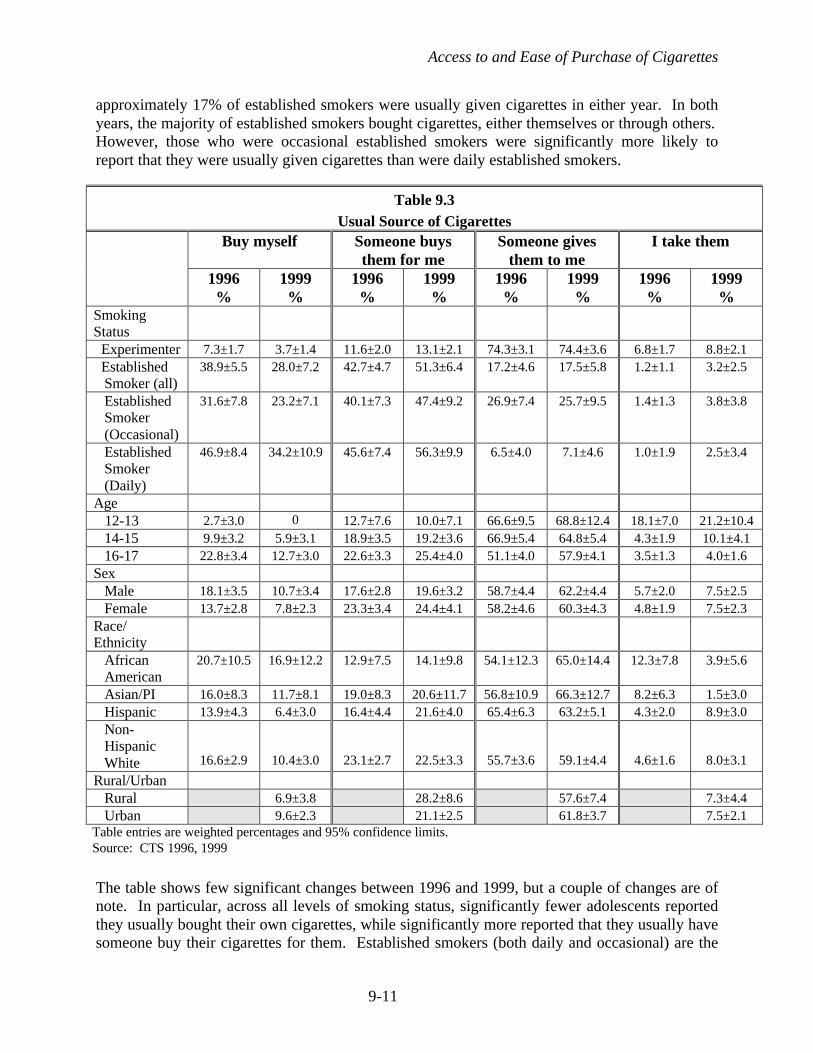
Access to and Ease of Purchase of Cigarettes
9-11
approximately 17% of established smokers were usually given cigarettes in either year. In bothyears, the majority of established smokers bought cigarettes, either themselves or through others.However, those who were occasional established smokers were significantly more likely toreport that they were usually given cigarettes than were daily established smokers.
The table shows few significant changes between 1996 and 1999, but a couple of changes are ofnote. In particular, across all levels of smoking status, significantly fewer adolescents reportedthey usually bought their own cigarettes, while significantly more reported that they usually havesomeone buy their cigarettes for them. Established smokers (both daily and occasional) are the
Table 9.3Usual Source of Cigarettes
Buy myself Someone buysthem for me
Someone givesthem to me
I take them
1996%
1999%
1996%
1999%
1996%
1999%
1996%
1999%
SmokingStatus Experimenter 7.3±1.7 3.7±1.4 11.6±2.0 13.1±2.1 74.3±3.1 74.4±3.6 6.8±1.7 8.8±2.1 Established
Smoker (all)38.9±5.5 28.0±7.2 42.7±4.7 51.3±6.4 17.2±4.6 17.5±5.8 1.2±1.1 3.2±2.5
EstablishedSmoker(Occasional)
31.6±7.8 23.2±7.1 40.1±7.3 47.4±9.2 26.9±7.4 25.7±9.5 1.4±1.3 3.8±3.8
EstablishedSmoker(Daily)
46.9±8.4 34.2±10.9 45.6±7.4 56.3±9.9 6.5±4.0 7.1±4.6 1.0±1.9 2.5±3.4
Age 12-13 2.7±3.0 0 12.7±7.6 10.0±7.1 66.6±9.5 68.8±12.4 18.1±7.0 21.2±10.4
14-15 9.9±3.2 5.9±3.1 18.9±3.5 19.2±3.6 66.9±5.4 64.8±5.4 4.3±1.9 10.1±4.116-17 22.8±3.4 12.7±3.0 22.6±3.3 25.4±4.0 51.1±4.0 57.9±4.1 3.5±1.3 4.0±1.6
SexMale 18.1±3.5 10.7±3.4 17.6±2.8 19.6±3.2 58.7±4.4 62.2±4.4 5.7±2.0 7.5±2.5Female 13.7±2.8 7.8±2.3 23.3±3.4 24.4±4.1 58.2±4.6 60.3±4.3 4.8±1.9 7.5±2.3
Race/Ethnicity
AfricanAmerican
20.7±10.5 16.9±12.2 12.9±7.5 14.1±9.8 54.1±12.3 65.0±14.4 12.3±7.8 3.9±5.6
Asian/PI 16.0±8.3 11.7±8.1 19.0±8.3 20.6±11.7 56.8±10.9 66.3±12.7 8.2±6.3 1.5±3.0Hispanic 13.9±4.3 6.4±3.0 16.4±4.4 21.6±4.0 65.4±6.3 63.2±5.1 4.3±2.0 8.9±3.0Non-HispanicWhite 16.6±2.9 10.4±3.0 23.1±2.7 22.5±3.3 55.7±3.6 59.1±4.4 4.6±1.6 8.0±3.1
Rural/UrbanRural 6.9±3.8 28.2±8.6 57.6±7.4 7.3±4.4Urban 9.6±2.3 21.1±2.5 61.8±3.7 7.5±2.1
Table entries are weighted percentages and 95% confidence limits.Source: CTS 1996, 1999

Access to and Ease of Purchase of Cigarettes
9-12
most likely group to buy their own cigarettes, but in 1999 they were less likely to report that theyusually bought their own cigarettes, compared to 1996. Among 16-17 year olds—those closestto the age of legal purchase—the percent that reported they usually bought their own cigarettesdecreased from 22.8±3.4% in 1996 to 12.7±3.0. These changes in usual source of cigarettes mayreflect the decreased perceptions that cigarettes are easy to get.
Who Buys for or Gives Cigarettes to Minors?
The data presented above show that the vast majority (83.2±4.6%) of adolescents get theircigarettes from others—whether or not they actually pay for them. If it were possible tosubstantially reduce these social exchanges of cigarettes, adolescents’ access to cigarettes couldbe severely limited. By knowing more about these social sources of cigarettes, it may bepossible to target media campaigns or public policy to reduce adolescents’ access to cigarettesfrom such sources. For the first time, in 1999 the CTS was able to probe this issue further, andasked adolescents:
• Who was the person who usually (bought/gave) you cigarettes?and
• How old is this person who usually (bought/gave) you cigarettes?
Figure 9.6 shows the age distribution of those who givecigarettes to and those who buy cigarettes for adolescentsmokers. The black bars on the figure show that those whogive cigarettes to adolescents tend to also be adolescents, orwere in the 18-20 year old age group, but very few were 21+
years old. Over half (51.1±4.6%) are the same age as the recipient, and under 18—too young tolegally buy cigarettes themselves. Another 22.6±3.5% are older than the recipient, but still under18. And 22.1±3.5% are of legal age to buy cigarettes, but still under 21.
Social Source of Cigarettes by Age of Supplier
0
10
20
30
40
50
60
70
<18, own age <18, older 18-20 21+
% C
ateg
ory
Others buy
Others give
Age of Supplier (years)
Source: CTS 1999 Figure 9.6
Others buy Others give
<18, own age 13.5 51.1<18, older 5.0 22.618-20 56.5 22.121+ 25.1 4.2
In 1999, 95% of those who aregiven cigarettes get themfrom individuals under 21years of age.

Access to and Ease of Purchase of Cigarettes
9-13
In contrast, the gray bars show that those who buy cigarettesfor other adolescents tend to be at least 18 years old, with56.5±6.9% being between 18-20 and 25.1±4.2% being over21 years old. Fewer than one in five (18.4±5.8%) individualswho buy cigarettes for adolescents are actually other
adolescents, who are under the legal age to purchase.
Nearly three-quarters (73.8±3.1%) of the adolescents who reported they get their cigarettes fromothers were given these cigarettes. Over 90% of those who are given cigarettes report that thesecigarettes come from friends (87.0±2.5%) and from a boyfriend/girlfriend (3.5±1.6%). Of thosewho have others buy cigarettes for them, the majority (65.7±6.1%) rely on friends to make thepurchase.
These statistics suggest that until peer approval of smoking and sharing cigarettes is reduced, itwill be difficult to significantly reduce adolescents’ access to cigarettes. Alternatively, raisingthe purchase age to 21 years might reduce access by increasing the age gap between those whoare legal to buy and those who get their cigarettes from others, either for free or by having othersbuy them.
Profile of Those Who Give Away Cigarettes
The 1999 CTS also asked ever smokers:
Have you ever given cigarettes away to your friends or acquaintances?
Table 9.4 shows that approximately half of all ever smokersreported that they had given away cigarettes. The profile ofthose who give away cigarettes closely mirrors thedescriptions of the givers offered by the recipients from theprevious section.
Table 9.4Percent of Ever Smokers
Who Have Ever Given Away Cigarettes, 1999All Ever smokers 47.7±3.4Gender
Female 46.7±4.8Male 48.6±4.5
Age12-13 35.6±12.314-15 39.8±6.916-17 54.1±4.6
Smoking StatusExperimenter 34.2±3.7Established Smoker 93.9±3.0
Table entries are weighted percentages and 95% confidence limits.Source: CTS 1999
Close to 95% of establishedsmokers have given awaycigarettes to friends oracquaintances in 1999.
In 1999, over 56% of thosewho have others buycigarettes for them ask 18-20year olds to make thepurchase.

Access to and Ease of Purchase of Cigarettes
9-14
The percentage of ever smokers who reported giving away cigarettes increased with age;significantly more 16-17 year olds gave away cigarettes, compared to the younger adolescents.This age effect is likely driven by smoking status. Nearly all established smokers reported thatthey had given away cigarettes.
4. Where Adolescents Buy Cigarettes
The 1996 and 1999 CTS asked adolescents who reportedthey had ever bought cigarettes whether they often,sometimes, or never bought cigarettes from a list of types ofstores. Table 9.5 shows that, although fewer adolescentswere buying their own cigarettes in 1999, there were no
significant changes in the types of stores where adolescents reported they often bought theircigarettes. The 1999 CTS included two new categories of stores (Tobacco Discount and OtherDiscount) that were not choices on earlier surveys.
Table 9.5 illustrates that gas stations, followed by liquor stores and small groceries were the mostfrequently reported type of stores where adolescents who buy cigarettes said they often madethese purchases. These adolescent buying patterns are consistent with results of annual randomcompliance checks of retail stores conducted by the California Department of Health Services(DHS). Between 1995 and 1998, illegal sales rates declined from 37% to 13% in these surveys,but in 1999, the illegal sales rate rose again, to 16% (CDHS, 2000). The DHS found the highestrate of illegal sales (32%) in gas stations. The surveys also found relatively high illegal salesrates (19%), and a large increase since 1998 (39%) among small grocery stores.
Although there has been some concern that Internet cigarette vendors may represent an easysource of cigarettes for adolescents, none of the adolescents who reported buying their own
Table 9.5Ever-Buyers Often Buy Cigarettes at:
1996%
1999%
Type of StoreSupermarket 6.3±2.0 5.9±2.9Small Grocery 25.7±4.3 26.4±5.9Gas Station 47.0±5.3 44.1±7.3Tobacco Discount Stores 6.3±2.7Other Discount Stores 2.2±2.8Liquor Stores 44.4±5.1 41.3±7.3Drug Stores 4.9±2.4 4.7±3.0
Vending Machine 6.3±2.5 2.2±2.3Other 7.9±2.9 10.0±4.5
Table entries are weighted percentages and 95% confidence limitsSource: CTS 1996, 1999
In 1999, most adolescents whobuy cigarettes get them fromgas stations, liquor stores, orsmall grocery stores.

Access to and Ease of Purchase of Cigarettes
9-15
cigarettes in the 1999 CTS purchased them from Internet sources. Most Internet vendors requireat least some nominal proof of age, a minimum purchase of at least a carton (and generally 5cartons) of cigarettes, and a credit card to place the order—all of which are likely to besignificant barriers for adolescent smokers.
5. Adult Attitudes about Teen Access
The 1996 and 1999 CTS asked all adults the following questions about minimum purchase agelaws:
• Do you think the laws banning the sale of tobacco products to minors have been adequatelyenforced?
• Do you think that store owners should need a license to sell tobacco?
Table 9.6 shows that in 1990, 1996, and 1999, a minority ofadults thought that current levels of enforcement of theminimum purchase age laws were adequate, but that overtime considerably more adults thought enforcement wasadequate. Between 1990 and 1999, the percentage of adults
who reported that they thought enforcement was adequate increased by a factor of 126%.
This table also shows wide support for tobacco-sales licensing—nearly three-quarters of adults in1999 thought that store owners should be licensed to sell tobacco.
Table 9.6 also shows that in each year, significantly more current smokers thought thatenforcement was adequate, compared to never or former smokers. By 1999, nearly half(46.6±1.7%) of current smokers thought enforcement was adequate; a nearly identical percent ofcurrent smokers thought that enforcement was not adequate (46.9±1.6%). Similarly, support fortobacco sales licensing was significantly lower among current smokers. Publicity about thestate’s efforts to enforce the minimum purchase age, such as the 1-800- ASK 4 ID program,along with the tobacco industry’s “It’s the Law” campaign, may have contributed to the growing
Table 9.6Adult Attitudes About Minimum Purchase Age Enforcement and Retail Licensing
% Who ThinkEnforcement Adequate
% Who Think LicenseShould Be Required To
Sell Tobacco1990%
1996%
1999%
1996%
1999%
Total 15.2±0.8 22.4±1.0 34.3±1.2 74.0±0.9 73.0±1.0Smoking status Never smoker 13.6±1.2 20.5±1.6 32.5±1.7 78.6±1.2 78.5±1.4
Former smoker 13.9±1.1 19.3±1.6 29.4±1.8 72.6±1.7 67.9±2.2Current smoker 20.8±1.0 32.2±1.5 46.6±1.7 61.9±1.5 63.1±1.6
Table entries are weighted percentages and 95% confidence limits.Source: CTS 1990, 1996, 1999
Adults were over twice aslikely in 1999 to thinkminimum purchase age lawswere adequately enforcedcompared to 1990.

Access to and Ease of Purchase of Cigarettes
9-16
perception that enforcement is adequate. Evidence from random compliance checks suggeststhat, in fact, enforcement has improved over time. Despite the slight increase in violationsbetween 1998 and 1999, the illegal sales rate in 1999 was less than half that of 1995 (16% in1999, vs. 37% in 1995) (CDHS, 2000).
6. Summary
This chapter showed that there were significant decreases in adolescents’ perceptions about theease of obtaining cigarettes between 1996 and 1999. Perceptions about the ease of obtainingcigarettes from commercial sources decreased the most. Nearly 50% fewer adolescents in 1999thought that it was easy to buy a pack of cigarettes. Perceptions about the ease of obtainingcigarettes from social sources also decreased significantly: over 30% fewer thought that it waseasy to buy a few cigarettes. These decreases in adolescents’ perceptions that cigarettes are easyto get may be due to a combination of grass-roots activism as well as anti-tobacco and tobaccoindustry advertising that emphasized minimum purchase age laws and their increasedenforcement.
The percent of adolescents who reported they buy their own cigarettes decreased significantlyfrom 16.1±2.2% in 1996 to 9.3±2.1% in 1999. This decrease may reflect the decreasedperception that it is easy to buy a pack of cigarettes. As in 1996, established smokers in 1999were much more likely to buy cigarettes, either themselves or through others, than wereexperimenters.
Over 80% of adolescent ever smokers reported that they usually get their cigarettes from socialsources, and nearly three-quarters of these adolescents were given cigarettes and therefore didnot pay for them. Adolescents who got cigarettes from others usually got them from other teens,over 70% of whom were under 18 years of age; another 22% of suppliers were under 21.Raising the age of legal purchase to 21 years may increase the gap between adolescents andsuppliers, thus decreasing access from social sources.
Of those who did buy their own cigarettes, most said that they bought from small stores, such asgas stations (44.2±7.3%), liquor stores (41.3±7.3%), or small groceries (26.4±5.9%). Thesefindings were nearly identical to earlier years’, and suggest that the larger supermarket chainsand discount stores have successfully implemented fairly strict policies about selling cigarettes tominors. Smaller stores may be more independent and thus less able as a group to consistentlyenforce policies against selling tobacco to minors.
Adults’ opinions about the enforcement of laws banning the sales of tobacco to minors suggestedthat, like adolescents, fewer adults in 1999 thought that cigarettes are easy for adolescents to get,compared to 1996. Although still a minority, a growing percent of adults thought that lawsbanning the sales of cigarettes to minors were adequately enforced by 1999, compared to earlieryears. Perhaps, like adolescents, adults were influenced by media campaigns that focussed onthe access issue.

9-17
CHAPTER 9: KEY FINDINGS
1. For the first time since the CTS began in 1990, never smokers’ perceptions that it is easy toget cigarettes decreased significantly (by a factor of 16.1%) from 57.2±1.5% in 1996 to48.0±1.5% in 1999.
2. Overall, the percent of adolescents who thought it was easy to buy a pack of cigarettesdecreased significantly (by a factor of 48.2%) from 51.5±1.4% in 1996 to 26.7±1.3% in1999.
3. Overall, the percent of adolescents who thought it was easy to get a few cigarettesdecreased significantly (by a factor of 31.4%) from 69.1±1.2 in 1996 to 47.4±1.3% in1999.
4. Consistently, from 1990 to 1999, approximately 40% of never smokers reported that theyhad been offered cigarettes.
5. The majority of adolescents reported that they usually get their cigarettes from others—61.3±3.4% were given these cigarettes and 21.9±2.5% had others buy cigarettes for them in1999.
6. Significantly fewer adolescent ever smokers reported that they usually bought their owncigarettes in 1999 (9.3±2.1%) than in 1996 (16.1±2.2%).
7. Over 70% of adolescents who are given cigarettes get them from other underageadolescents, and another 22% get them from friends under the age of 21 years.
8. Most adolescents who buy cigarettes usually get them from gas stations, liquor stores, orsmall grocery stores—a pattern that has remained consistent since 1996.
9. Social sources of cigarettes are an important factor in adolescents’ access to cigarettes.
10. In 1999, approximately one-third (34.3±1.2%) of adults believed that minimum purchaseage laws are adequately enforced; this level is over twice as high as in 1990, when only15.2±0.8% of adults believed that these laws were adequately enforced.

Access to and Ease of Purchase of Cigarettes
9-18
CHAPTER 9: GLOSSARY
Adolescents
Committed never smoker – a never smoker who does not expect to try a cigarette soon and whoanswers definitely not to whether he or she would accept a cigarette offered by a friend and to aquestion about whether he or she will smoke in the next year.
Current established smoker – has smoked a cigarette on at least one day in the past month andhas smoked at least 100 cigarettes in his or her lifetime.
Current smoker – has smoked a cigarette on at least one day in the past month.
Daily smoker – answers 25 or more days to the question about how many days in the last monthhe or she smoked.
Established smoker – has smoked at least 100 cigarettes in his or her lifetime.
Experimenter – has smoked a cigarette (excludes puffers), but has not smoked at least 100cigarettes in his or her lifetime.
Never smoker – has never smoked or even puffed on a cigarette.
Occasional smoker – answers less than 25 days to the question about how many days in the lastmonth he or she smoked.
Puffer – someone who has not smoked a cigarettes, but admits to puffing on one.
Susceptible never smoker – a never smoker who either expects to try a cigarette soon or whodoes not answer definitely not to whether he or she would accept a cigarette offered by a friendor to a question about whether he or she will smoke in the next year.
Adults
Current smoker – has smoked at least 100 cigarettes in his or her lifetime and smokes now (oldquestion) or now either everyday or some days (new question) at the time of the survey.
Former smoker – has smoked at least 100 cigarettes in lifetime, but does not smoke now (oldquestion) or now smokes not at all (new question).
Never smoker – has smoked fewer than 100 cigarettes in his or her lifetime.

Access to and Ease of Purchase of Cigarettes
9-19
CHAPTER 9: REFERENCES
California Department of Health Services. More California retailers selling tobacco to kids.Press Release No. 25-00. World Wide Web: http://www.dhs.ca.gov/opa/prssrels/2000/25-00.htm(accessed 7/21/00).
Chaloupka FJ, Grossman M. Price, Tobacco Control Policies, and Youth Smoking. WorkingPaper 5740. National Bureau of Economic Research; 1996.
Emery S, Gilpin EA, White MM, Pierce JP, How adolescents get their cigarettes: implicationsfor policies on price and access. J Natl Cancer Inst. 1999;91:184-186.
DiFranza JR, Brown LJ. The Tobacco Institute’s “It’s the Law” campaign: Has it halted sales oftobacco to children? Am J Pub Health. 1992;82 (9): 1271-1273.
DiFranza JR, Savageau JA, Aisquith BF. Youth access to tobacco: the effects of age, gender,ending machine locks, and “It’s the Law” programs. Am J Pub Health. 1996;86:221-224.
Glantz S. Preventing tobacco use—the youth access trap. Am J Pub Health. 1996;86:156-158.
Kropp, R. Retailer-Focused Programs and Policies to Prevent Tobacco Use and NicotineAddiction among Children and Teens. M. L. Forst, Planning and Implementing EffectiveTobacco Education and Prevention Programs. Springfield, IL: Charles C. Thomas, 175-196;1999.
Rigotti, NA, DiFranza JR, Chang Y, Tisdale T, Kemp B, Singer D. The effect of enforcingtobacco sales laws on adolescents’ access to tobacco and smoking behavior. New Eng J Med.1997;337:1044-1051.
10-1
Chapter 10
SCHOOL SMOKING: POLICIES AND COMPLIANCE
School Smoking: Policies and Compliance
10-2
CHAPTER 10: SCHOOL SMOKING: POLICIES AND COMPLIANCE
Introduction
School smoking prevention efforts have the potential to influence adolescent smoking inseveral ways. The implementation and enforcement of smokefree school policies limits theopportunity for teens to smoke. A study from Australia indicates that many adolescentsstart smoking regularly at school (Hill & Borland, 1991). Further, the existence andenforcement of these policies promote norms against smoking as an acceptable behaviorfor everyone, including teachers who are important role models for adolescents. Finally,anti-smoking curricula can provide vital information on the health dangers and theaddictive nature of cigarettes.
Since 1952, the California State Education Code has banned all student smoking on thegrounds of junior high and middle schools (Pentz et al., 1989). In 1991, AB-99 requiredthat all schools become tobacco-free by July 1, 1996 in order to qualify for anti-tobaccoprogram funding. Legislation passed in 1994 moved the implementation date of the AB-99school policies ahead by a year, to July 1, 1995. This chapter examines the extent to whichstudents believe that their peers and teachers comply with the school smoking ban and thedegree of enforcement students themselves advocate.
For decades, schools have played a central role in educational efforts aimed at smokingprevention (Glynn, 1989; USDHHS, 1989; Hansen, 1992; USDHHS, 1994). It isrecognized that such programs have the most chance of success in the setting ofcomprehensive community-based tobacco control programs (USDHH, 2000). Since 1995,the state of California has required school-based anti-tobacco education for grades 4-8.The Tobacco Use Prevention Education (TUPE) program, an integral component of theCalifornia Tobacco Control Program, provides entitlement funds for tobacco education ingrades 4-8, and competitive grants for tobacco education in grades 9-12 (Fishbein et al.,1998). Thus, by 1999, nearly all adolescents should have been exposed to a smokingprevention lesson in school. In this chapter, students’ recall and opinions of such classesare described.
Section 1 analyzes trends in student compliance with school smoking regulations. Section2 examines trends in perception of teachers’ smoking. Section 3 explores students’exposure to anti-smoking curricula. Section 4 summarizes the chapter.
1. Smokefree School Policies
Obeying the Rule Not to Smoke
If tobacco use policies are not consistently enforced in schools, they can convey a mixedmessage to students (Bowen et al., 1995). However, Pentz, et al. (1989) showed that, whenconsistently enforced and coupled with cessation education, school smoking policies areassociated with decreased smoking prevalence among adolescents. To assess compliance

School Smoking: Policies and Compliance
10-3
with smokefree policies at schools, the 1990, 1993, 1996 and 1999 California TobaccoSurveys (CTS) asked adolescents the following question:
How many students who smoke obey the rule not to smoke on school property?
Figure 10.1 shows that after a slight but steady declinethrough 1996, the percentage of adolescents whoperceive that most or all students obey the rule not tosmoke on school property increased significantly by1999 when two-thirds of students perceived that the
school smoking ban was generally obeyed. This represents a turnaround by a factor of63.9% since 1996. The lower level in 1996 was attributed to the possible increasedawareness of the rule and that it was being violated in high schools since the policy wasrelatively new. It appears that by 1999, the rule had gained much wider acceptance.
Table 10.1 shows the perception that most or all students obey the rule for demographicsubgroups. Students age 12-13 years reported significantly higher compliance than olderstudents. This finding would be expected for two reasons: fewer 12-13 year olds smoke,and a smoking ban in junior high and middle schools has been in place for over 40 years(Pentz et al., 1989). Younger students also showed the greatest factor increase between1996 and 1999.
46.3 43.740.7
66.7
01020304050607080
1 2 3 4
Year
%
Most or All Students Who SmokeObey the Rule Not to Smoke on School Property
Figure 10.1Source: CTS 1990, 1993, 1996, 1999
1990 1993 1996 1999
Compliance with schoolsmoking policies increased64% between 1996 and1999.

School Smoking: Policies and Compliance
10-4
While a significantly higher percentage of Non-Hispanic White than minority studentsreported that most or all student smokers obeyed the school smoking in 1999, all ethnicgroups showed impressive increases in perceived compliance with the school smoking bansince 1996. In all years, students with average or below average school performance weresignificantly less likely to think the no-smoking rule was obeyed by most or all smokingstudents, but all groups showed substantial increases in this perception.
How Many Students Witnessed Smoking in School?
In earlier years of the CTS, students were asked separate questions about whether they hadseen students or teachers smoking at school. The 1996 and 1999 CTS were slightlymodified to ask students the following single question to ascertain the level of complianceto the new law:
Have you seen anyone smoke in school in the last two weeks?
Table 10.1How Many Students Who Smoke
Obey the Rule Not to Smoke on School Property?
Responding “Most” or “All”
Demographics 1990%
1993%
1996%
1999%
FactorIncrease
1996-1999
%All Students 46.3 (±2.0) 43.7 (±1.6) 40.7 (±1.4) 66.7 (±1.5) 63.9Gender
Boys 48.5 (±2.9) 46.0 (±2.2) 40.5 (±1.9) 67.0 (±2.0) 65.4Girls 44.2 (±2.7) 41.4 (±2.9) 40.9 (±2.0) 66.4 (±2.2) 62.3
Age12-13 56.9 (±3.9) 53.5 (±2.2) 46.1 (±2.4) 80.0 (±2.4) 73.514-15 41.9 (±3.5) 39.0 (±3.0) 37.7 (±2.6) 62.0 (±2.6) 64.416-17 39.3 (±3.6) 37.0 (±3.6) 38.3 (±2.5) 57.7 (±2.8) 50.7
Race/EthnicityAfrican American 49.2 (±8.8) 42.5 (±7.7) 38.3 (±5.0) 65.2 (±5.4) 70.2Asian/PI 42.1 (±6.6) 38.0 (±5.9) 34.5 (±4.3) 61.4 (±4.8) 78.0Hispanic 42.8 (±3.5) 38.5 (±3.8) 39.6 (±2.9) 63.0 (±2.5) 59.5
Non-Hispanic White 48.9 (±2.6) 47.9 (±2.3) 43.3 (±2.0) 72.5 (±2.0) 67.8School Performance Much above average 49.2 (±5.2) 50.9 (±4.0) 42.9 (±2.3) 71.3 (±3.6) 66.2 Above average 48.1 (±2.9) 44.9 (±3.2) 43.0 (±2.4) 71.3 (±2.2) 66.2 Average or below 43.6 (±2.7) 39.6 (±2.7) 37.1 (±2.1) 60.4 (±2.2) 62.5
Table entries are weighted percentagesand 95% confidence limits.Source: CTS 1990, 1993, 1996, 1999

School Smoking: Policies and Compliance
10-5
In 1996, over one-third (36.0±1.5%) of students hadseen anyone smoking at school, but this had declined tojust over one-quarter (26.3±1.7%) by 1999, which isconsistent with the increased perception that the rule isobeyed. Answers to this question varied widely,
depending on the student’s age and whether they attended private or public school. In bothyears, significantly more of the oldest teens observed someone smoking at school. In 1999,only 11.4±4.1% of private and religious school students reported they had seen smoking atschool, while 28.3±1.7% of public school students answered “yes” to this question, whichis a significant difference. The decrease in witnessing someone smoking was apparent inall demographic groups.
Table 10.2Students Who Have Seen Anyone Smoking at School
Demographic Groups 1996%
1999%
Factor Decrease1996-1999
%All Students 36.0 (±1.5) 26.3 (±1.7) -26.9Gender
Boys 37.0 (±2.1) 27.3 (±2.5) -26.2Girls 34.9 (±2.1) 25.2 (±1.8) -27.8
Age12-13 year olds 12.3 (±2.0) 7.5 (±1.7) -39.014-15 year olds 44.2 (±2.4) 33.2 (±2.8) -24.916-17 year olds 51.1 (±2.3) 38.3 (±2.6) -25.0
Race/EthnicityAfrican American 35.1 (±5.2) 27.1 (±6.2) -22.8Asian/PI 41.7 (±4.1) 31.0 (±5.7) -25.7Hispanic 32.2 (±2.9) 24.4 (±2.4) -24.2Non-Hispanic White 37.0 (±1.8) 26.7 (±2.0) -27.8
School Performance Much better than average 35.5 (±3.3) 26.5 (±3.2) -25.4 Above average 36.1 (±2.6) 24.2 (±2.4) -33.0 Average or below 36.3 (±2.1) 28.2 (±3.1) -22.3School
Private/Religious School 16.0 (±3.3) 11.4 (±4.1) -28.8Public School 39.0 (±1.5) 28.3 (±1.7) -27.5
Table entries are weighted percentages and 95% confidence limits.Source: CTS 1996, 1999
In 1999, 25% fewer adolescentshad witnessed someonesmoking at school in the pasttwo weeks compared to 1996.

School Smoking: Policies and Compliance
10-6
Trends in Student Preferences for Smokefree School Grounds 1993-1999
Adolescents often confront the strict enforcement of any type of restriction with resistanceand noncompliance. To test students’ reactions to smokefree policies, the 1993, 1996 and1999 CTS asked adolescents the following question:
Do you think that all smoking by anyone should be banned on school grounds at alltimes, including meetings and sporting events?
The word “ban” was deliberately used in this questionto maximize the number of adolescents who woulddisagree and thereby provide a conservative estimate ofstudent support for school smoking policies. Despitethe wording, in 1999 an overwhelming majority,
89.2±0.8%, of students surveyed, supported the imposition of a policy prohibiting smokingat any time on school grounds, up from about 84% in both 1993 and 1996.
In 1999, the vast majority ofstudents (89%) support acomplete ban on smoking onschool grounds.
Table 10.3Students Who Preferred that Smoking be Banned on School Grounds
Demographic Groups 1993%
1996%
1999%
FactorChange
1993-1999%
All Students 84.8 (±1.3) 84.4 (±1.1) 89.2 (±0.8) 5.2Gender
Boys 84.3 (±2.1) 84.1 (±1.7) 89.1 (±1.1) 5.7Girls 85.4 (±2.0) 84.8 (±1.3) 89.3 (±1.5) 4.6
Age12-13 year olds 90.9 (±2.0) 90.4 (±1.5) 92.2 (±1.4) 1.414-15 year olds 83.6 (±2.7) 84.3 (±2.3) 90.1 (±1.5) 7.816-17 year olds 79.0 (±2.7) 78.3 (±2.6) 84.9 (±2.0) 7.5
Race/EthnicityAfrican American 84.1 (±6.2) 86.9 (±3.7) 90.7 (±3.4) 7.8Asian/PI 86.0 (±5.4) 88.8 (±2.5) 88.2 (±3.2) 2.6Hispanic 86.7 (±2.6) 82.3 (±2.1) 86.2 (±1.7) -0.6Non-Hispanic White 83.5 (±1.6) 84.2 (±1.6) 91.7 (±1.0) 9.8
School Performance Much above average 88.7 (±2.8) 89.2 (±1.9) 90.0 (±2.1) 1.5
Above average 84.7 (±2.1) 86.0 (±1.6) 90.6 (±1.6) 7.0Average or below 83.4 (±2.2) 80.1 (±2.0) 87.4 (±1.8) 4.8
Table entries are weighted percentages and 95% confidence limits.Source: CTS 1993, 1996, 1999

School Smoking: Policies and Compliance
10-7
Table 10.3 shows preference for a smokefree school within different demographicsubgroups of students. Although younger students were significantly more likely to preferthat smoking be banned on school grounds in all years, it was the older students whoshowed a greater shift in preference between 1993 and 1999. Non-Hispanic White studentsalso showed a significantly increased preference for smoke-free schools over this time. Incontrast to 1996, in 1999 this preference was equally high regardless of the level of schoolperformance. In fact, by 1999 all demographic groups showed very high levels ofpreference for smokefree school campuses.
How do Adolescent Current Smokers View the School No-Smoking Policies?
Smokefree school policies will interfere with the abilityof adolescent smokers to smoke during school hours.However, even current smokers (any smoking in the past30 days) showed impressive changes in support for the
smokefree policy between 1996 and 1999. Current smokers in 1999 were more likely (by afactor of 52.0%) to perceive that students who smoke (including presumably themselves)obey the rule. Also, they were less likely by a factor of 19.0% to have seen someonesmoking on school property, and more likely to prefer that smoking be banned by a factorof 15.4%. The fact that even more current smokers agree with the school smoking ban isan important success for the TCP.
0102030405060708090
100
1 2 3 4 5 6
%
1996
1999
School Policy Against Smoking by Current Smoking Status and Year
Figure 10.2Source: CTS 1996, 1999
Most or all obey Seen someonesmoking (yes)
Preference forsmokefree school
Nonsmokers CurrentSmokers
Nonsmokers CurrentSmokers
Nonsmokers CurrentSmokers
Most or all obey Seen someone smoking(yes)
Preference forsmokefree school
Nonsmokers CurrentSmokers
Nonsmokers CurrentSmokers
Nonsmokers CurrentSmokers
1996 41.7 37.5 33.3 56.9 88.2 55.8
1999 68.1 57 24.7 46.1 91.2 64.4
In 1999, almost two-thirds ofcurrent smokers support thesmokefree school policy.

School Smoking: Policies and Compliance
10-8
2. Trends in Perceptions of Teachers’ Smoking
A teacher’s influence on students extends far beyond the classroom knowledge theyconvey. Earlier research has established a link between teachers’ smoking at school andadolescent smoking uptake (Allen et al., 1991, 1992). In the 1990, 1993, 1996 and 1999California Tobacco Survey, all students were asked:
How many of the teachers in your school smoke cigarettes?
This question cannot accurately assess the prevalence of smoking among teachers.Adolescents typically overestimate both peer and adult smoking. Nevertheless,adolescents’ perceptions and trends in these perceptions are important. In 1990, 81.0±1.7%of all adolescents perceived that any teachers smoke (i.e., they answered either a few, some,most, or all); this percentage remained about the same in 1993 (81.3±1.6%), declinedsignificantly by 1996 (70.7+1.2%), and declined significantly again to 66.9±1.8% by 1999.The factor decrease from 1990 to 1999 was 17.4%.
Figure 10.3 illustrates that all age groups of students have significant declines in theperception that any teachers smoke. Younger students were least likely in each year toperceive that any teachers smoke. In 1990 and 1993, about 70% of 12-13 year oldsperceived that any of their teachers smoke, and by 1996 and 1999, only about 52% ofstudents in this age group perceived that any teachers smoke. This change represents adecrease by a factor of about 26% from 1990. Only the 14-15 year olds showedsignificant declines in their perceptions that any teachers smoke between 1996 and 1999.In 1996, 77.2±1.9% of this age group thought any teachers smoke, but in 1999 thisperception had declined to 68.0±2.9%, a reduction by a factor of about 12%.
0
20
40
60
80
100
1990 1993 1996 1999
% W
ho
Th
ink
An
y T
each
ers
Sm
oke 12-13 14-15 16-17
Source: CTS 1990, 1993, 1996, 1999 Figure 10.3
Perception that Teachers Smoke by Age
1990 1993 1996 199912-13 70.4 69.8 52.1 52.214-15 84.3 86.5 77.2 68.016-17 88.8 89.3 82.3 81.1

School Smoking: Policies and Compliance
10-9
Although students may see teachers smoking outside of school or smell smoke on theirbreath or clothes, it is likely that teacher compliance to smokefree school policies hasincreased since AB-99 was implemented in 1995, so that fewer students are aware of theirsmoking. Compliance may be higher in middle schools or private schools because teachersare more aware of their role model standing, but older students may simply be more awareof teachers’ behavior.
3. Trends in Health Education Classes at Schools 1990-1999
Seventeen-year-old students interviewed as part of the 1999 CTS were 13 years of age in1995, when smoking prevention education should have become a part of their middle-school educational experience. Thus, nearly all students in 1999 should have had a classthat discussed the health dangers of smoking. To assess the extent to which students recallhaving been exposed to such curriculum, the 1990, 1993, 1996 and 1999 CTS asked:
Have you ever taken a class or course at school in which the health risks of smoking werediscussed?
The question was intentionally broad because it was judged unlikely that students receiveinformation on smoking at every grade level. Figure 10.4 shows that the proportion ofadolescents who could recall ever having such a class increased only slightly, by a factor of6.3%, between 1990 and 1999.
While all students should now be reached, these classes may not make a sufficient impactto be remembered. It is of interest, therefore, to examine which demographic groups were
73.275.7 76.1 77.8
0
10
20
30
40
50
60
70
80
1 2 3 4
Year
%
Students Who Recall Taking a Class on the Health Dangers of Smoking
Source: CTS 1990, 1993, 1996, 1999 Figure 10.4
1990 199919961993

School Smoking: Policies and Compliance
10-10
able to recall having a class on the health risks of smoking in recent years. Table 10.4shows recall of a smoking prevention class by demographic groups in 1996 and 1999.
As students get older, they have had more opportunity to have had a class that discussedthe health effects of smoking. Thus, it is not surprising that there was a significant agetrend in recall of having such a class. While African American and Hispanic students in1996 were less likely to recall having a class that covered this topic, it is encouraging thatthe gap in recall for minorities was closing by 1999. Students performing at average orbelow average in school were significantly less likely to recall having a class in both years.Both private and public school students were about equally likely to recall having a classcovering the health effects of tobacco use.
Table 10.4Students Who Recall Having a Class on the Health Risks of Smoking
Demographic Groups 1996%
1999%
Factor Change1996-1999
%All Students 76.1 (±1.3) 77.8 (±1.4) 2.1Gender
Boys 75.2 (±1.9) 76.8 (±2.1) 2.1Girls 77.0 (±1.6) 79.0 (±1.7) 2.6
Age12-13 year olds 74.0 (±2.1) 76.3 (±2.4) 3.114-15 year olds 76.0 (±2.1) 77.1 (±2.3) 1.416-17 year olds 78.3 (±2.5) 80.1 (±2.1) 2.3
Race/EthnicityAfrican American 70.4 (±5.2) 74.0 (±5.6) 5.1Asian/PI 78.6 (±3.7) 77.9 (±4.5) -0.9Hispanic 69.9 (±3.0) 74.0 (±2.7) 5.9Non-Hispanic White 80.3 (±1.5) 82.2 (±1.5) 2.4
School Performance Much better than average 79.9 (±2.4) 79.8 (±3.0) 0.1 Above average 78.8 (±1.7) 81.4 (±1.9) 3.3 Average or below 71.3 (±2.0) 73.7 (±2.6) 3.4School
Private/Religious School 75.0 (±3.6) 77.4 (±3.7) 3.2Public School 76.4 (±1.4) 78.1 (±1.5) 2.2
Table entries are weighted percentages and 95% confidence limits.Source: CTS 1996, 1999

School Smoking: Policies and Compliance
10-11
Adolescent Perception of Health Class Effectiveness
Adolescent perception of the effectiveness of such classes in deterring smoking is anotherway to measure their impact. Respondents to the 1996 and 1999 CTS who reported havinga class on the health effects of smoking were asked the following question:
Do you think that kids who took the health class on the effects of smoking are moreagainst smoking, less against smoking, or had no change in attitude toward smoking as aresult of taking this class?
Of teens who recalled taking the health class in 1996, 56.9±1.6% responded that theythought kids who took the health class had no change in attitudes toward smoking, or thatthey were less against smoking than kids who did not take the class. In 1999, thispercentage had declined significantly to 47.7±1.8%, suggesting that either the quality ofclassroom instruction in this regard had improved or that teens were more receptive to themessages of such classes.
In both years, the adolescents’ smoking experience was associated with perception of classeffectiveness. In 1996, 69.2±2.7% of adolescent ever smokers or puffers thought the classwas ineffective compared to 50.3±2.0% of never smokers. In 1999, 61.7±3.1% of eversmokers or puffers and 42.4±2.0% of never smokers held this view. This association mayreflect the fact that health classes reinforce the determination of never smokers. However,it is unclear whether experimentation took place before or after they attended the healthclass. If experimentation preceded the health class, it may or may not have discouragedfurther experimentation or smoking uptake. Since a majority of the ever smokers or puffersdid not credit the class with influencing their peers against smoking, such classes likely hadminimal personal impact as well. However, even adolescent experimenters who had such aclass were more likely to think it was effective in 1999 than in 1996.
4. Summary
The results presented in this chapter suggest that compliance with smokefree schoolpolicies has increased markedly between 1996 and 1999. As a result, reported exposure toanyone smoking at school in the past two weeks has also declined substantially. Alldemographic groups of teens showed these encouraging trends. In 1999, more teens,including those who are current smokers, believed that smoking should be banned onschool property for everyone. These important gains in eliminating smoking at school maybe a factor in the downturn in adolescent smoking (Chapters 2 and 4).
The data also suggest that fewer teens perceived that their teachers were smoking in 1999than in earlier years. This change in perception represents progress, as teachers areimportant role models for students. Either fewer teachers smoked in 1999 than in earlieryears, or more teachers were respecting the smokefree policies in California schools so thatstudents were less aware of their smoking. Either way, these results indicate that fewerstudents thought these important role models were smokers.

School Smoking: Policies and Compliance
10-12
In addition, the results presented above showed that classes on the health effects ofsmoking may be improving. Slightly more students recalled taking such a class in 1999than in 1996, and more students in 1999 thought that the class was effective indiscouraging teens from smoking. Even adolescents who had experimented with cigarettesshowed an increase in their perceptions that the class was effective.

School Smoking: Policies and Compliance
10-13
CHAPTER 10: KEY FINDINGS
1. Adolescents report that compliance with school no-smoking rules has increaseddramatically since 1996. At that time 40.7±1.4% of students reported that most or allstudents who smoke obeyed the rule, and by 1999 66.7±1.5% gave this report, anincrease by a factor of 63.9%.
2. Consequently, in 1999 the percentage of students who reported seeing someonesmoking on school property within the last two weeks (36.0±1.5%) was lower by afactor of 26.9% compared to 1996 (26.3±1.7%).
3. By 1999, 89.2±0.8% of all students expressed a preference that smoking be bannedon school grounds for everyone. Even 64.4±5.1% of current smokers expressed thispreference, up from 55.8±4.6% in 1996, a factor increase of 15.4%.
4. The percentage of students who reported that any teachers smoked continued todecline. In 1990, 81.0±1.7% of students perceived that any teachers smoked, whichdeclined to 70.7±1.2% in 1996 and further to 66.9±1.8% by 1999, a factor decrease of17.4% since 1990.
5. By 1999, all students should have been exposed to smoking prevention curriculum inschool, and 77.8±1.4% reported that they had been, up from 73.2±1.8% in 1990, afactor increase of 6.3%.
6. Of students who reported having a class on the health effects of smoking, thepercentage who thought that the course was ineffective in making kids more againstsmoking decreased from 56.9±4.6% in 1996 to 47.7±1.8% in 1999, a factor decreaseof 16.2%. This trend was present even in students who had ever smoked or puffed ona cigarette.

School Smoking: Policies and Compliance
10-14
CHAPTER 10: GLOSSARY
Adolescents
Current smoker – has smoked a cigarette on at least one day in the past month.
Ever smoker – has smoked a cigarette (excludes puffers).
Never smoker – has never smoked or even puffed on a cigarette.
Non-current smoker – has not smoked a cigarette on any days in the past month.
Nonsmoker – never smoker or non-current smoker.
Puffer – someone who has not smoked a cigarette, but admits to puffing on one.

School Smoking: Policies and Compliance
10-15
CHAPTER 10: REFERENCES
Allen K, Moss A, Botman S. Teenage Attitudes and Practices Survey (TAPS):Methodology and Response Rates. Paper presented at the 119th Annual Meeting of theAmerican Public Health Association; 1991.
Allen KF, Moss AJ, Giovino GA, Shopland DR, Pierce JP. Teenage Tobacco-Use: DataEstimates from the Teenage Attitudes and Practices Survey: United States, 1989. AdvanceData; No. 224. Hyattsville, MD: National Center for Health Statistics; 1992.
Bowen DJ, Kinne S, Orlandi M. School policy in COMMIT: a promising strategy toreduce smoking by youth. J School Health. 1995;65:140-144.
Fishbein H, Larsen M, Howard_Pitney B, Rohrback L. Independent Evaluaton of theCalifornia Tobacco Control Prevention and Education Program: Wave 1 Data. 1996-1997. Sacramento, CA: California Department of Health Services; 1998.
Hansen WB. School-based substance abuse prevention: a review of the state of the art incurriculum, 1980–1990. Health Educ Res. 1992;7:403–430.
Hill D, Borland R. Adults’ accounts of onset of regular smoking: influences of school,work, and other settings. Public Health Reports. 1991;106:181-185.
Pentz MA, Brannon BR, Charlin VL, Barrett EJ, MacKinnon DP, Flay BR. The power ofpolicy: the relationship of smoking policy to adolescent smoking. Am J Pub Health.1989;79:857–862.
US Department of Health and Human Services. Reducing the Health Consequences ofSmoking: 25 Years of Progress. A Report of the Surgeon General. Atlanta, GA:USDHHS, Centers for Disease Control and Prevention, National Center for ChronicDisease Prevention and Health Promotion, Office on Smoking and Health. DHHS Pub.No. (CDC) 89-8411; 1989.
US Department of Health and Human Services. Preventing Tobacco Use Among YoungPeople: A Report of the Surgeon General. Atlanta, GA: USDHHS, Centers for DiseaseControl and Prevention, National Center for Chronic Disease Prevention and HealthPromotion, Office on Smoking and Health; 1994.
US Department of Health and Human Services. Reducing Tobacco Use. A Report of theSurgeon General. Atlanta, GA: USDHHS, Centers for Disease Control and Prevention,National Center for Chronic Disease Prevention and Health Promotion, Office on Smokingand Health; 2000. S/N 017-001-0544-4.

11-1
Chapter 11
OTHER TOBACCO USE

Other Tobacco Use
11-2
CHAPTER 11: OTHER TOBACCO USE
Introduction
Aside from a few programs designed to deter adolescent use of smokeless tobacco(chewing tobacco and snuff), the California Tobacco Control Program (TCP) has mainlyfocused on discouraging cigarette smoking. Nevertheless, it is important to monitor theuse of other tobacco products in the population. For instance, adult cigar use prevalencein 1996 doubled compared to the level observed in 1990. This increase in cigar usefollowed an advertising campaign that promoted cigar smoking as a trendy symbol ofsophistication. Two magazines, Smoke and Cigar Aficionado, were introduced topromote this image.
One typical large cigar may be equivalent to smoking 10 cigarettes in terms of nicotine,tar and carbon monoxide (Rickert et al., 1985; Henningfield et al., 1996). Smoking oneor more cigars per day appears to increase the risk of a number of smoking-related healthproblems (USDHHS, 1998). Because of this health danger, the US Congress recentlypassed a bill requiring health warnings on cigar packaging and wrappers (FTC, 2000).
Although nondaily cigar use accounted for the entire increase in cigar smoking inCalifornia from 1990 to 1996, the extent of cigar use (beyond use everyday or some days)was not probed in the 1996 CTS. The 1999 CTS included additional questions to addressthe level of cigar consumption.
Also, in recent years a novel tobacco product, bidis, has made its way into the US market,gaining considerable popularity among youth. Bidis or beedies are flavored (chocolate,vanilla, strawberry, cherry, mint, mango, etc.) hand-rolled “cigarettes” imported fromIndia and other Asian countries. Wrapped in a leaf, tapered at both ends and tied with acolorful string, they look somewhat like a marijuana joint. Bidis are not filtered andproduce about 3 times more carbon monoxide and nicotine and about 5 times more tarthan a typical standard US cigarette (Rickert, 1999). To stay lit, bidis require the smokerto inhale more frequently than standard cigarettes. Furthermore, a paper-wrapped bundleof 20 bidis sells for about $2.00, considerably less than a package of standard UScigarettes.
Bidis may promote nicotine addiction among their generally youthful users, some ofwhom do not consider them to be tobacco products, since they are often sold in healthfood stores. New questions were included in the 1999 CTS to assess the prevalence andextent of bidi use among California adolescents.
This chapter examines changes in the use of tobacco products other than cigarettes usingdata from the 1990, 1993, 1996 and 1999 California Tobacco Surveys (CTS). Section 1presents data on changes in the use of pipes and smokeless tobacco in adults. Section 2

Other Tobacco Use
11-3
deals with adult cigar use, including level of consumption. Section 3 looks at the use ofalternative tobacco products (smokeless tobacco, cigars and bidis) in adolescents. Section4 summarizes the chapter.
1. Adult Use of Pipes and Smokeless Tobacco
The 1990, 1996 and 1999 California Tobacco Surveys (CTS) asked adult respondentswho admitted to ever using other forms of tobacco than cigarettes, whether they now usea particular product everyday, some days or not at all. To determine prevalence, useeveryday and some days are combined into the category of current use. Because veryfew women use pipes or smokeless tobacco, only trends for men are presented. It isimportant to note that even among men, use of pipes and smokeless tobacco isuncommon. Overall in 1990, 2.4±0.4% of adult men smoked pipes; this percentagedecreased to 1.5±0.3% in 1996 and was unchanged at 1.5±0.4% in 1999. Adult malesmokeless tobacco use was 2.6±0.5% in 1990, 2.5±0.4% in 1996 and 2.4±0.4% in 1999.Figure 11.1 shows the prevalence of current use of pipes and smokeless tobacco in 1990,1996 and 1999 for men by age. (Further demographic breakdowns are presented in TableA11.1 at the end of this chapter).
0
1
2
3
4
5
6
18-24 25-44 45-64 65+ 18-24 25-44 45-64 65+Age
% C
urr
entl
y U
sin
g
1990
1996
1999
Prevalence of Pipe and Smokeless Tobacco Use by Age in Adult Men
Pipe Smokeless Tobacco
Source: CTS 1990, 1996, 1999 Figure 11.1
Pipe Smokeless Tobacco
1990 1996 1999 1990 1996 1999
18-24 1.18 1.58 1.23 18-24 3.3 4.1 3.4
25-44 1.84 0.93 1.08 25-44 2.5 3.2 3.4
45-64 3.8 1.83 2.34 45-64 1.28 1.23 0.93
65+ 3.3 2.6 1.48 65+ 0.47 0.44 0.5 7

Other Tobacco Use
11-4
Among older men, pipe use appears to have declined from 1990 to 1999; the decline forthose aged 65+ years was significant. Smokeless tobacco use by adult men did notchange significantly for any age group between 1990 and 1996.
2. Adult Cigar Use
As with the questions on pipe smoking and smokeless tobacco use, the 1990, 1996, and1999 California Tobacco Surveys (CTS) asked respondents who had ever used cigarswhether they smoke cigars everyday, some days, or not at all. Again, current use wasdefined as use everyday or some days. In the entire population, current use increasedsignificantly, from 2.5±0.7% in 1990 to 4.9±0.4% in 1996, but declined slightly to4.4±0.3% in 1999. However, the population prevalence of every day use was only 0.2%in each of these years.
Figure 11.2 presents the prevalence of current cigar use by gender and age in 1990, 1996and 1999. Details of the demographic distribution of cigar use in 1999 are available inTable A11.1 at the end of this chapter. Although use of cigars is much more prevalentamong men than among women, in the youngest two age groups both genders showedsignificant increases (approximately tripled) in cigar use from 1990 to 1996 but nofurther increases by 1999. These same age groups of women appeared to show even
0
2
4
6
8
10
12
14
16
18-24 25-44 45-64 65+ 18-24 25-44 45-64 65+Age
% C
urr
ent
Cig
ar S
mo
kers
1990
1996
1999
Current Cigar Use by Gender and Age
Source: CTS 1990, 1996, 1999 Figure 11.2
Men WomenMen Women
Age 1990 1996 1999 Age 1990 1996 1999
18-24 4.0 12.3 10.5 18-24 0.28 3.14 1.50
25-44 5.4 11.0 9.2 25-44 0.33 1.31 1.08
45-64 4.8 6.2 7.0 45-64 0.15 0.33 0.28
65+ 3.8 1.83 2.7 65+ 0.06 0 0

Other Tobacco Use
11-5
greater declines (percentage wise) than men from 1996 to 1999. These trends suggestthat the cigar fad has peaked in California, and may now be beginning to decline.
Cigarette Smoking Status and Cigar Smoking
Cigar smoking is related to cigarette smoking status.In 1990, cigar use was significantly lower among menwho never smoked cigarettes than among formercigarette smokers. Former cigarette smokers, in turn,showed lower rates of cigar use than current cigarette
smokers did. In 1996, the difference in current cigar use between never and formercigarette smokers disappeared, but in 1999 never smokers again had lower rates ofcurrent cigar use than former smokers. The increase between 1990 and 1996 wassignificant in all smoking status groups for males, but not females, because of low usagerates. These trends are illustrated in Figure 11.3. In 1999, cigar use among neversmokers declined significantly compared to 1996, but there was no decrease in cigar useamong former and current cigarette smokers.
0
5
10
15
20
NeverSmoker
FormerSmoker
CurrentSmoker
NeverSmoker
FormerSmoker
CurrentSmoker
% C
urr
ent
Cig
ar S
mo
kers 1990
1996
1999
Source: CTS 1990, 1996,1999 Figure 11.3
Current Cigar Use by Gender and Cigarette Smoking Status
Men Women
From 1996 to 1999, cigarsmoking declined in neversmokers but not in current orformer cigarette smokers.
Men WomenStatus 1990 1996 1999 Status 1990 1996 1999
Never Smoker 2.2 7.5 5.0 Never Smoker 0.06 0.82 0.34
Former Smoker 3.9 6.5 7.8 Former Smoker 0.14 0.49 0.62
Current Smoker 10.9 14.8 15.4 Current Smoker 0.92 2.9 2.6
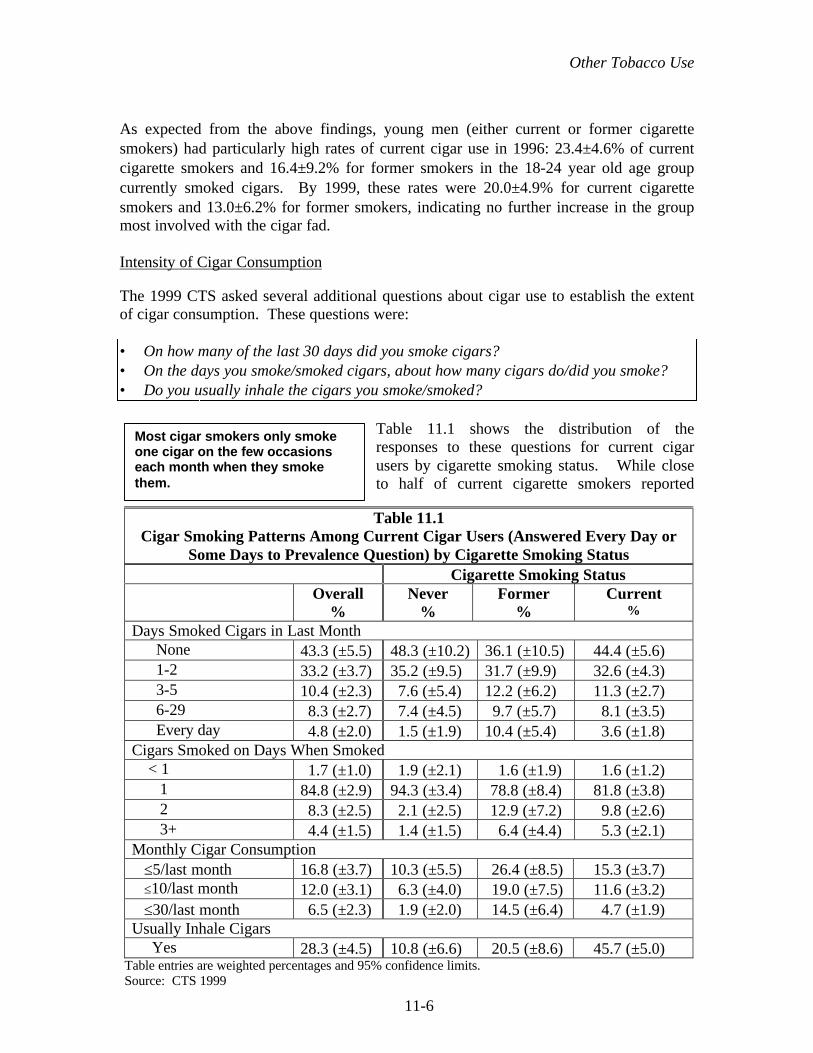
Other Tobacco Use
11-6
As expected from the above findings, young men (either current or former cigarettesmokers) had particularly high rates of current cigar use in 1996: 23.4±4.6% of currentcigarette smokers and 16.4±9.2% for former smokers in the 18-24 year old age groupcurrently smoked cigars. By 1999, these rates were 20.0±4.9% for current cigarettesmokers and 13.0±6.2% for former smokers, indicating no further increase in the groupmost involved with the cigar fad.
Intensity of Cigar Consumption
The 1999 CTS asked several additional questions about cigar use to establish the extentof cigar consumption. These questions were:
• On how many of the last 30 days did you smoke cigars?• On the days you smoke/smoked cigars, about how many cigars do/did you smoke?• Do you usually inhale the cigars you smoke/smoked?
Table 11.1 shows the distribution of theresponses to these questions for current cigarusers by cigarette smoking status. While closeto half of current cigarette smokers reported
Table 11.1Cigar Smoking Patterns Among Current Cigar Users (Answered Every Day or
Some Days to Prevalence Question) by Cigarette Smoking StatusCigarette Smoking Status
Overall%
Never%
Former%
Current%
Days Smoked Cigars in Last Month None 43.3 (±5.5) 48.3 (±10.2) 36.1 (±10.5) 44.4 (±5.6) 1-2 33.2 (±3.7) 35.2 (±9.5) 31.7 (±9.9) 32.6 (±4.3) 3-5 10.4 (±2.3) 7.6 (±5.4) 12.2 (±6.2) 11.3 (±2.7) 6-29 8.3 (±2.7) 7.4 (±4.5) 9.7 (±5.7) 8.1 (±3.5) Every day 4.8 (±2.0) 1.5 (±1.9) 10.4 (±5.4) 3.6 (±1.8)Cigars Smoked on Days When Smoked < 1 1.7 (±1.0) 1.9 (±2.1) 1.6 (±1.9) 1.6 (±1.2) 1 84.8 (±2.9) 94.3 (±3.4) 78.8 (±8.4) 81.8 (±3.8) 2 8.3 (±2.5) 2.1 (±2.5) 12.9 (±7.2) 9.8 (±2.6) 3+ 4.4 (±1.5) 1.4 (±1.5) 6.4 (±4.4) 5.3 (±2.1)Monthly Cigar Consumption ≤5/last month 16.8 (±3.7) 10.3 (±5.5) 26.4 (±8.5) 15.3 (±3.7) ≤10/last month 12.0 (±3.1) 6.3 (±4.0) 19.0 (±7.5) 11.6 (±3.2) ≤30/last month 6.5 (±2.3) 1.9 (±2.0) 14.5 (±6.4) 4.7 (±1.9)Usually Inhale Cigars Yes 28.3 (±4.5) 10.8 (±6.6) 20.5 (±8.6) 45.7 (±5.0)
Table entries are weighted percentages and 95% confidence limits.Source: CTS 1999
Most cigar smokers only smokeone cigar on the few occasionseach month when they smokethem.

Other Tobacco Use
11-7
smoking no cigars in the last month, only a third of former cigarette smokers did. Sincethey don’t smoke cigarettes, nonsmokers (former and never) appear to smoke more daysthan cigarette smokers. Former cigarette smokers were the most likely to report dailycigar use, and daily prevalence is significantly higher than for current and never smokers.The vast majority (>85%) of current cigar users smoked no more than 1 cigar on the daysthey used cigars. This was particularly the case for those who had never smokedcigarettes; for never smokers this percentage was significantly higher than in current andformer smokers.
Multiplying the number of days cigars were smokedin the past month by the number of cigars smoked onthe days when cigar smoking occurred gives anindication of monthly cigar consumption.
Significantly higher percentages of former cigarette smokers smoked 5 or more, 10 ormore and 30 or more cigars per month compared to either current smokers or neversmokers. However, it is the current cigarette smokers that were the most likely to inhalethe cigars they smoke. The percentages that usually inhaled cigars were significantlydifferent among the cigarette smoking status groups.
3. Adolescent Use of Alternative Tobacco Products
Adolescent respondents to the CTS were asked the following questions about their use ofalternative tobacco products:
• Have you ever tried using chewing tobacco or snuff?• Have you ever tried cigars, cigarillos, or little cigars?• Have you ever smoked a bidi, a specially flavored cigarette from India?
If the response to any of these questions was yes, the adolescent was then asked:
On how many of the past 30 days did you ….. ?
While the questions about smokeless tobacco were asked on the 1993, 1996 and 1999CTS, the question on cigars was only asked in 1996 and 1999, and the question on bidiswas only asked in 1999.
Smokeless Tobacco
Significantly fewer California adolescents usedsmokeless tobacco in 1996 than in 1993, and therewas a further significant decline from 1996 to 1999.Overall, the percentage of teens who had ever usedsmokeless tobacco decreased from 8.2±0.7% in
1993 to 6.2±0.6% in 1996 and to 3.1±0.5% in 1999. Current use (in the past 30 days) ofsmokeless tobacco by adolescents declined from 1.7±0.5% in 1993 to 1.0±0.3% in 1996
In 1999, former cigarettesmokers showed the highestintensity of cigar use.
In 1999, smokeless tobaccouse among adolescent boyswas at only one third the levelobserved in 1993.
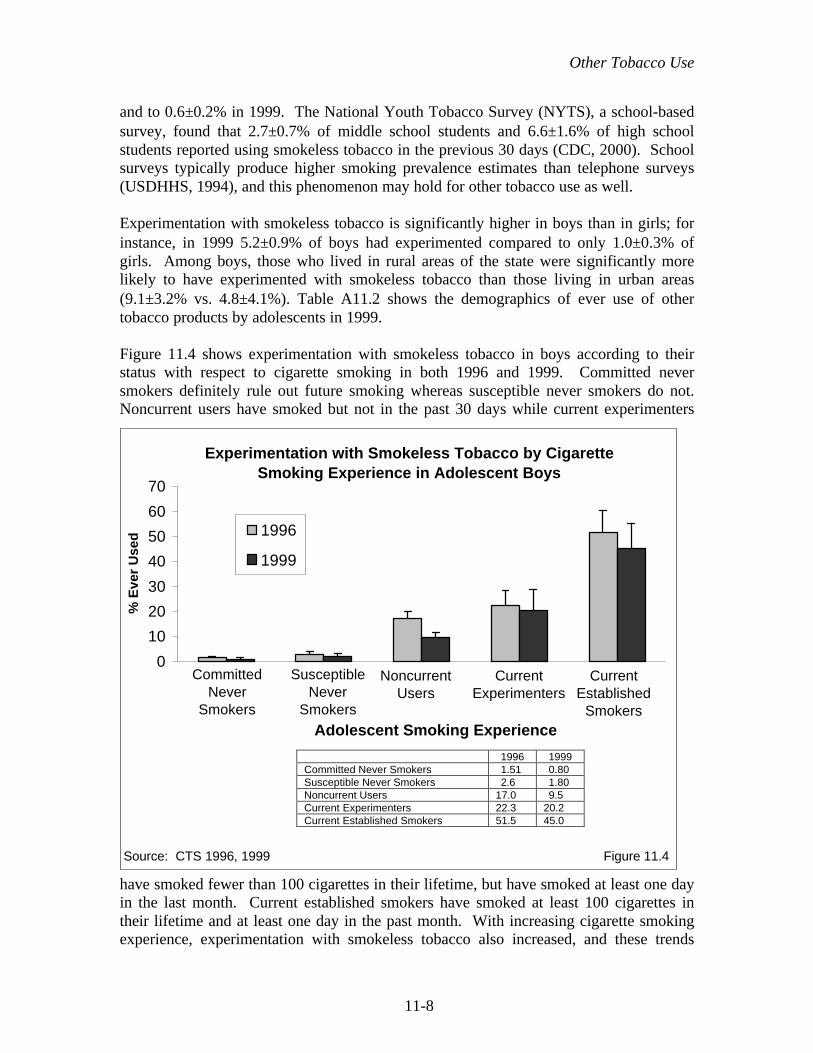
Other Tobacco Use
11-8
and to 0.6±0.2% in 1999. The National Youth Tobacco Survey (NYTS), a school-basedsurvey, found that 2.7±0.7% of middle school students and 6.6±1.6% of high schoolstudents reported using smokeless tobacco in the previous 30 days (CDC, 2000). Schoolsurveys typically produce higher smoking prevalence estimates than telephone surveys(USDHHS, 1994), and this phenomenon may hold for other tobacco use as well.
Experimentation with smokeless tobacco is significantly higher in boys than in girls; forinstance, in 1999 5.2±0.9% of boys had experimented compared to only 1.0±0.3% ofgirls. Among boys, those who lived in rural areas of the state were significantly morelikely to have experimented with smokeless tobacco than those living in urban areas(9.1±3.2% vs. 4.8±4.1%). Table A11.2 shows the demographics of ever use of othertobacco products by adolescents in 1999.
Figure 11.4 shows experimentation with smokeless tobacco in boys according to theirstatus with respect to cigarette smoking in both 1996 and 1999. Committed neversmokers definitely rule out future smoking whereas susceptible never smokers do not.Noncurrent users have smoked but not in the past 30 days while current experimenters
have smoked fewer than 100 cigarettes in their lifetime, but have smoked at least one dayin the last month. Current established smokers have smoked at least 100 cigarettes intheir lifetime and at least one day in the past month. With increasing cigarette smokingexperience, experimentation with smokeless tobacco also increased, and these trends
0
10
20
30
40
50
60
70
Adolescent Smoking Experience
% E
ver
Use
d 1996
1999
CommittedNever
Smokers
SusceptibleNever
Smokers
NoncurrentUsers
CurrentExperimenters
CurrentEstablished
Smokers
Experimentation with Smokeless Tobacco by CigaretteSmoking Experience in Adolescent Boys
Source: CTS 1996, 1999 Figure 11.4
1996 1999Committed Never Smokers 1.51 0.80Susceptible Never Smokers 2.6 1.80Noncurrent Users 17.0 9.5Current Experimenters 22.3 20.2Current Established Smokers 51.5 45.0

Other Tobacco Use
11-9
were statistically significant for both 1996 and 1999. There was some indication of thedecline in experimentation with smokeless tobacco in all cigarette smoking status groups,and the decline was statistically significant in all groups except the current cigarette usegroups.
While use of smokeless tobacco was at relatively low levels in 1999, adolescents mayhave turned to cigars or bidis instead.
Cigars
Overall in 1996, 15.0±1.2% of teens 12-17 years of age reported they had ever tried acigar. This percentage declined significantly to 11.9±1.1% in 1999. As in 1996, in 1999boys were significantly more likely to have experimented with cigars; 15.0±1.7%reported they had ever smoked a cigar, compared to 8.7±1.2% of girls. Non-HispanicWhite adolescents (15.7±1.8%) were more likely to have tried cigars than other ethnicgroups. Refer to Table A11.2 at the end of this chapter for the complete demographicbreakdown of adolescent experimentation with cigars. The 1999 CTS indicated that2.9±0.6% of California adolescents 12-17 years of age used cigars in the past month. TheNYTS found that 6.1±1.1% of middle school students and 15.3±1.4% of high schoolstudents used cigars in the past month (CDC, 2000).
Experimentation with cigars was rare among committed never smokers, but occurredabout twice as often in susceptible never smokers (Figure 11.5). Adolescents who have
0
20
40
60
80
100
Adolescent Smoking Status
% E
ver
Use
d
1996
1999
Experimentation with Cigars by Cigarette Smoking Experience
Source: CTS 1996, 1999 Figure 11.5
CommittedNever
Smokers
SusceptibleNever
Smokers
NoncurrentUsers
CurrentExperimenters
CurrentEstablished
Smokers
1996 1999
Committed Never Smokers 1.73 1.48
Susceptible Never Smokers 3.2 4.3
Noncurrent Users 28.0 27.6
Current Experimenters 48.2 52.6
Current Established Smokers 74.5 77.6
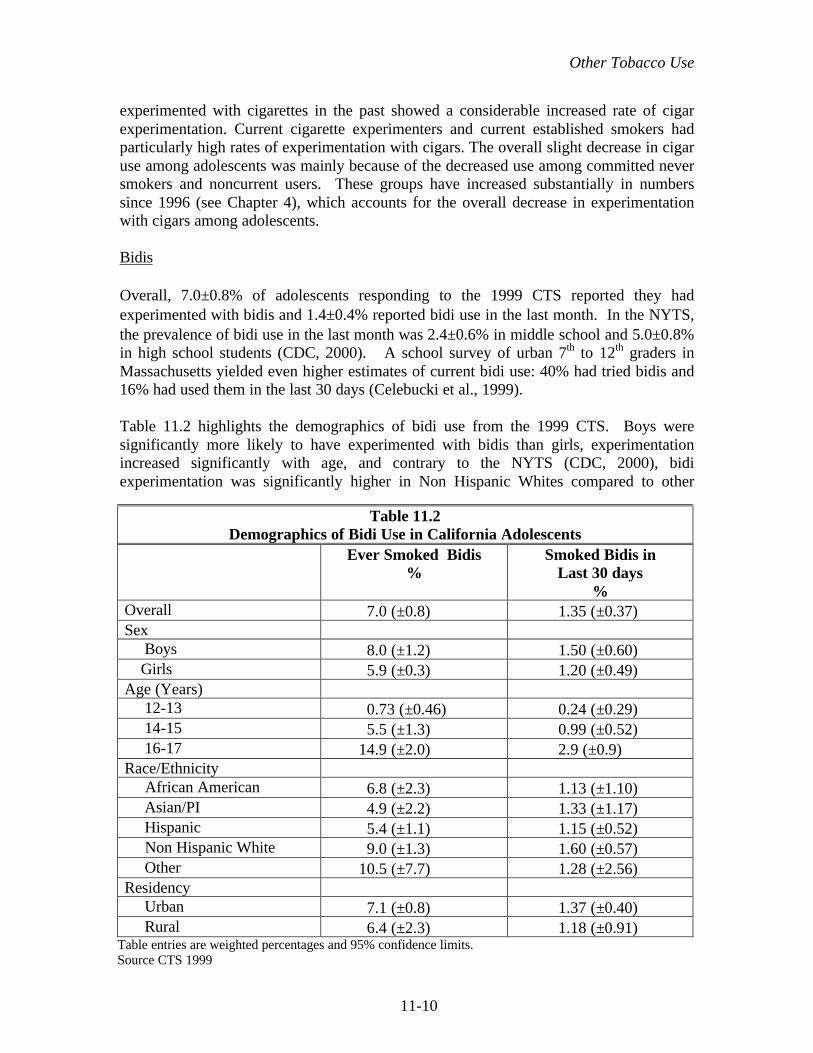
Other Tobacco Use
11-10
experimented with cigarettes in the past showed a considerable increased rate of cigarexperimentation. Current cigarette experimenters and current established smokers hadparticularly high rates of experimentation with cigars. The overall slight decrease in cigaruse among adolescents was mainly because of the decreased use among committed neversmokers and noncurrent users. These groups have increased substantially in numberssince 1996 (see Chapter 4), which accounts for the overall decrease in experimentationwith cigars among adolescents.
Bidis
Overall, 7.0±0.8% of adolescents responding to the 1999 CTS reported they hadexperimented with bidis and 1.4±0.4% reported bidi use in the last month. In the NYTS,the prevalence of bidi use in the last month was 2.4±0.6% in middle school and 5.0±0.8%in high school students (CDC, 2000). A school survey of urban 7th to 12th graders inMassachusetts yielded even higher estimates of current bidi use: 40% had tried bidis and16% had used them in the last 30 days (Celebucki et al., 1999).
Table 11.2 highlights the demographics of bidi use from the 1999 CTS. Boys weresignificantly more likely to have experimented with bidis than girls, experimentationincreased significantly with age, and contrary to the NYTS (CDC, 2000), bidiexperimentation was significantly higher in Non Hispanic Whites compared to other
Table 11.2Demographics of Bidi Use in California Adolescents
Ever Smoked Bidis%
Smoked Bidis inLast 30 days
%Overall 7.0 (±0.8) 1.35 (±0.37)Sex Boys 8.0 (±1.2) 1.50 (±0.60) Girls 5.9 (±0.3) 1.20 (±0.49)Age (Years) 12-13 0.73 (±0.46) 0.24 (±0.29) 14-15 5.5 (±1.3) 0.99 (±0.52) 16-17 14.9 (±2.0) 2.9 (±0.9)Race/Ethnicity African American 6.8 (±2.3) 1.13 (±1.10) Asian/PI 4.9 (±2.2) 1.33 (±1.17) Hispanic 5.4 (±1.1) 1.15 (±0.52) Non Hispanic White 9.0 (±1.3) 1.60 (±0.57) Other 10.5 (±7.7) 1.28 (±2.56)Residency Urban 7.1 (±0.8) 1.37 (±0.40) Rural 6.4 (±2.3) 1.18 (±0.91)
Table entries are weighted percentages and 95% confidence limits.Source CTS 1999

Other Tobacco Use
11-11
ethnic groups, except African Americans. While bidi use appears higher in urbancompared to rural areas, these differences were not statistically significant.
Figure 11.6 shows that as with smokeless tobaccoand cigar experimentation, bidi experimentationoccurs significantly more often in adolescents withcigarette smoking experience. Current bidi use
also showed this significant trend. In 1999, nearly as many current established smokershad experimented with bidis as had experimented with cigars (Figure 11.5).
Because bidis have a high nicotine content, they may promote cigarette consumption inadolescent cigarette smokers. It is of interest to determine the extent of major (a pack ormore in the past month) cigarette use among adolescent current smokers according towhether or not they have used bidis. Figure 11.7 illustrates this analysis for adolescents12-14 and 15-17 years of age.
0
20
40
60
80
100
1 2 3 4 5
Adolescent Smoking Experience
%
EverIn Last 30 Days
Bidi Use by Traditional Cigarette Smoking Status
Source: CTS 1999Figure 11.6
CommittedNever
Smokers
SusceptibleNever
Smokers
NoncurrentUsers
CurrentExperimenters
CurrentEstablished
Smokers
Bidi Use
Bidi UseEver In Last
30 DaysCommitted Never Smokers 0.24 0.0Susceptible Never Smokers 1.03 0.02Noncurrent Users 15.2 1.79Current Experimenters 30.6 9.1Current Established Smokers 69.7 17.9
As with other tobacco products,bidi use is associated with the useof cigarettes.

Other Tobacco Use
11-12
The percentage of adolescents reporting consumption of at least a pack of cigarettes inthe past month is much lower among current cigarette smokers who have never used bidisthan among those who have ever used bidis in both age groups. Whether bidi usepromotes high levels of cigarette consumption or whether adolescents who smoke a lot ofcigarettes are more likely to use bidis cannot be determined from these data. However,the high prevalence of significant cigarette consumption among bidi users in the youngerage group suggests that bidis may foster nicotine addiction.
4. Summary
The data presented in this chapter indicate that the use of pipes and smokeless tobacco byadults remains low. While cigar use increased dramatically between 1990 and 1996,particularly among people under the age of 45 years, the slight decline from 1996 to 1999suggests that the cigar fad is passing, at least among people who have never smokedcigarettes. As in 1996, the current cigar smoker in 1999 is more likely to be a Non-Hispanic White, better educated man who also currently smokes or formerly smokedcigarettes.
While very few cigar smokers (<5%) smoke cigars every day, daily cigar smoking ishighest among former cigarette smokers compared to current or never smokers. Over40% of adults who say they smoke cigars some days had not smoked any days in the pastmonth. Further, over 85% of cigar users only smoked 1 cigar on the days they didsmoke. While few cigar smokers who had never smoked cigarettes inhale, this
0
20
40
60
80
1 2
% C
urr
ent
Sm
oke
rsS
mo
kin
g 2
0+ C
igs/
Mo
nth
Never
Ever
Traditional Cigarette Consumptionand Bidi Use Among Current Cigarette Smokers
Source: CTS 1999 Figure 11.7
12-14 15-17Age (years)
Bidi Use
Bidi UseNever Ever
12-14 year olds 21.7 46.6
15-17 year olds 38.8 67.8

Other Tobacco Use
11-13
percentage increased for former cigarette smokers and was highest among currentcigarette smokers.
Whether this occasional cigar use among adults (especially young adult males) andadolescents was a result of industry advertising campaigns promoting cigar use as anemblem of the young sophisticate remains to be investigated. The advertising campaignmay have led people to believe that there is no harm in the occasional use of tobaccoproducts.
While efforts to reduce adolescent use of smokeless tobacco products appear to havebeen successful, adolescents may have turned to cigars and bidis instead. The rates ofexperimentation with these products in 1999 were much higher than the rate ofadolescent experimentation with smokeless tobacco, and both boys and girls wereparticipating.
The correlation of alternative tobacco product use with adolescent cigarette smokingexperience suggests that adolescents willing to experiment with one tobacco product arewilling to experiment with others as well. Therefore, tobacco control efforts aimed atadolescents should seek to establish norms against the use of any tobacco products. Theincrease in the percentage of the adolescent population that are committed never smokersand who refrain from using other tobacco products is a sign of program success.
It appears that bidi use is associated with relatively high levels of cigarette consumptioneven in young adolescent smokers, but whether bidi use leads to higher cigaretteconsumption or whether adolescents who smoke at greater consumption levels are moreopen to experimenting with bidis or other tobacco products is unknown.

Other Tobacco Use
11-14
CHAPTER 11: KEY FINDINGS
1. The use of pipes and smokeless tobacco in adult males continues to decrease. In1999, only 1.5±0.4% of adult males currently used pipes and only 2.4±0.4% usedsmokeless tobacco.
2. The cigar smoking fad appears to have peaked. In 1999, adult current cigar use was4.4±0.3% compared to 4.9±0.5% in 1996. Importantly, current cigar use declinedsignificantly among adults who had never smoked cigarettes, in men from7.5±1.4% in 1996 to 5.0±0.9% in 1999.
3. Regarding cigar smoking intensity, the 1999 CTS showed that:
a. Most current cigar smokers only smoked a few cigars a month: 83.2±3.7%smoked fewer than 5 cigars in the last month, and 43.3±5.5% smoked none inthe last month.
b. Current cigar smokers who are former cigarette smokers smoked more cigarsthan either never smokers or current smokers. Of former cigarette smokers,10.4±5.4% were daily cigar smokers and 19.0±7.5% smoked more than 10cigars/month. For never cigarette smokers these rates were 1.5±1.9% and6.3±4.0%, respectively, and for current cigarette smokers the rates were3.6±1.8% and 11.6±3.2%.
c. Current cigarette smokers were more likely to inhale the cigars they smoke(45.7±5.0%), compared to former cigarette smokers (20.5±8.6) or nevercigarette smokers (10.8±6.6%).
4. Smokeless tobacco use has continued to decline among adolescent boys. In 1999,the percentage of boys who had used smokeless tobacco in the past 30 days was0.6±0.2%, compared to 1.7±0.5% in 1993. The percentage of ever use(experimentation) was 3.1±0.5% in 1999, down from 8.7±0.7% in 1993.
5. Adolescents of both genders are experimenting with cigars and a tobacco productnew to the United States, bidis, a flavored cigarette imported from Asian countries.In 1999, 11.9±1.1% of adolescents had experimented with cigars, downsignificantly from 15.0±1.2% in 1996. In 1999, 7.0±0.8% of adolescents reportedexperimenting with bidis.
6. Adolescent experimentation with other tobacco products is highly associated withtheir experience with cigarettes. Almost none of the adolescents committed tonever smoking cigarettes had used any other tobacco product. Since this portion ofthe adolescent population is increasing (Chapter 4), there should be declines in theuse of other tobacco products over time.

Other Tobacco Use
11-15
Table A11.1 Current Tobacco Use Status (1999 Adult CTS)OVERALL Any
TobaccoProduct
Use
Cigarettes* Cigars Pipes ChewingTobacco/
Snuff
PopulationSize
SampleSize
(%) (%) (%) (%) (%) (n) (n)TOTAL 21.7 18.2 4.3 0.8 1.2 23,905,198 14,729SEXMale 28.3 21.7 8.1 1.5 2.4 11,692,309 7,272Female 15.4 14.9 0.7 0.1 0.1 12,212,889 7,457SEX MaleAGE18-24 33.0 26.8 10.5 1.2 3.4 1,759,465 1,16125-44 31.7 23.8 9.2 1.1 3.4 5,357,749 3,25145-64 26.6 20.7 7.0 2.3 0.9 3,164,734 2,09165+ 12.9 9.4 2.7 1.5 0.6 1,410,361 769RACE/ETHNICITYHispanic 26.3 22.9 5.0 0.8 0.7 3,360,533 1,800Non-Hispanic White 30.0 20.5 10.6 2.1 3.6 6,354,293 4,386African-American 27.3 25.1 5.9 0.5 1.6 649,838 338Asian/PI 21.4 19.6 3.8 0.4 0.3 1,164,277 642Other 53.6 46.4 9.9 3.6 8.3 163,368 106EDUCATION<12 32.0 30.1 4.2 1.4 1.2 2,292,741 97912 32.2 25.7 7.9 1.3 3.6 2,948,219 2,05913-15 30.2 22.8 9.9 1.8 2.7 3,025,122 2,23016+ 20.6 11.6 9.1 1.4 1.9 3,426,227 2,004HOUSEHOLD INCOMEMissing 21.9 18.6 4.8 0.7 0.7 1,174,102 688$10,000 or less 32.0 29.0 4.7 1.3 2.1 852,802 447$10,001 to $20,000 31.0 28.5 4.8 1.5 1.6 1,273,041 761$20,001 to $30,000 29.8 24.3 6.4 1.6 3.4 1,486,478 871$30,001 to $50,000 28.7 23.1 7.2 1.6 2.8 2,198,089 1,425$50,001 to $75,000 29.4 19.4 11.2 1.9 3.2 2,003,708 1,299over $75,000 26.4 16.7 11.3 1.4 2.2 2,704,089 1,781URBAN/RURALUrban 27.8 21.5 7.9 1.4 2.1 10,633,499 6,452Rural 32.8 24.3 9.3 1.9 5.0 1,058,810 820
REGIONLos Angeles 21.0 18.6 3.6 0.7 0.5 6,961,682 3,129San Diego 23.3 19.0 4.7 1.1 1.3 2,025,890 943Orange 18.9 14.9 5.4 0.7 0.8 1,952,763 1,189Santa Clara 16.3 13.8 3.0 0.2 1.2 1,198,554 731San Bernadino 24.6 22.7 4.1 1.3 0.7 1,120,416 779Alameda 16.9 13.7 3.6 0.7 0.7 1,019,881 598Riverside 26.0 22.7 4.5 1.2 1.5 976,702 678Sacramento 22.1 17.7 4.8 0.8 1.0 838,583 600Contra Costa 23.1 18.4 7.5 1.8 1.5 655,733 497San Francisco 20.7 18.7 3.4 0.3 0.7 644,186 512San Mateo, Solano 22.2 18.2 4.5 0.5 1.4 820,811 558Marin, Napa, Sonoma 20.8 16.9 4.4 0.4 1.2 594,959 510Butte, Colusa, Del Norte, Glenn, etc. 28.7 24.7 4.1 0.8 4.7 775,761 578San Luis Obispo, Santa Barbara, Ventura 20.0 14.5 5.3 0.5 2.4 1,002,031 638Amador, Alpine, Calaveras, El Dorado,etc.
24.9 19.4 5.7 0.5 3.2 928,440 639
Santa Cruz 21.9 17.8 4.4 1.4 2.6 463,698 543Fresno, Madera, Merced, Stanislaus 23.2 19.1 4.5 0.7 1.8 1,052,982 680Imperial, Inyo, Kern, Kings, Mono, Tulare 23.5 19.5 4.4 0.6 1.7 872,126 927
*Use caution in comparing the 1999 data with earlier CTS years because of the change in how smokingstatus is defined.

Other Tobacco Use
11-16
Table A11.2 Experimentation with Tobacco Products (1999 Youth CTS)OVERALL Cigarettes Chewing
Tobacco/Snuff
Cigars Bidis AnyTobaccoProduct
Use
POPULATIONSIZE
SAMPLESIZE
(%) (%) (%) (%) (%) (n) (n)TOTAL 22.7 3.1 11.9 7.0 26.1 2,918,234 6,090SEXMale 23.0 5.2 15.0 8.0 27.4 1,512,912 3,062Female 22.5 1.0 8.7 5.9 24.6 1,405,322 3,028AGE12-13 7.3 0.8 3.4 0.7 9.7 995,530 2,00814-15 22.6 2.5 10.5 5.6 25.4 989,282 2,05316-17 39.3 6.3 22.6 15.3 44.2 933,422 2,029RACE/ETHNICITYHispanic 23.6 2.5 9.6 5.4 26.3 1,083,232 2,178Non-Hispanic White 25.8 4.9 15.7 9.0 29.9 1,180,692 2,910African-American 14.9 0.8 10.3 6.8 19.2 232,401 412Asian/PI 15.4 0.9 8.0 4.9 17.2 362,238 496Other 21.9 3.3 10.5 10.5 26.0 59,671 94SCHOOL PERFORMANCEMuch bet than aver 15.4 2.4 7.8 4.2 18.0 594,637 1,277Better than aver 21.6 3.0 12.6 6.9 25.1 1,091,990 2,367Average and below 27.3 3.7 13.3 8.4 30.8 1,231,607 2,446HOUSEHOLD INCOMEMissing 22.7 3.3 11.7 7.8 25.7 247,804 479$10,000 or less 22.8 2.6 9.7 6.6 25.5 228,259 398$10,001 to $20,000 21.7 2.3 9.8 4.7 24.6 345,189 623$20,001 to $30,000 23.5 2.7 10.9 7.1 27.2 342,060 659$30,001 to $50,000 23.2 3.0 11.5 5.4 26.2 528,987 1,070$50,001 to $75,000 25.1 3.7 12.8 8.1 28.0 509,865 1,134over $75,000 20.8 3.6 14.0 8.3 25.0 716,070 1,727URBAN/RURALUrban 22.4 2.9 12.0 7.1 25.7 2,640,687 5,319Rural 26.2 5.7 11.8 6.4 29.4 277,547 771
REGIONLos Angeles 21.6 1.7 10.2 5 24.7 857,849 1,292San Diego 20.7 2.5 13 8.7 24.7 238,404 390Orange 20.6 1.9 10.5 6.8 22.5 230,671 486Santa Clara 26.8 2.2 8.3 10.3 28.1 136,179 276San Bernadino 21.4 4.7 10.8 6.4 24 160,152 367Alameda 20 3.1 15.2 9.9 23.7 111,904 222Riverside 20.7 2.8 8.2 5 22.5 128,038 318Sacramento 22.5 5.5 11.2 6 24.1 99,833 208Contra Costa 20.2 3.4 12.1 9.7 24.7 76,172 235San Francisco 23.4 2.9 16.5 15.2 27.3 46,760 94San Mateo, Solano 33.5 4.9 15.3 11.7 35.8 88,446 200Marin, Napa, Sonoma 27.7 5.3 28.2 12.6 40.9 60,827 205Butte, Colusa, Del Norte,Glenn, etc.
32 8.3 16.2 9 34.3 95,929 239
San Luis Obispo, SantaBarbara, Ventura
24 2.9 13.6 5 30.5 124,569 229
Amador, Alpine, Calaveras, ElDorado,etc.
22.8 4 15.7 7.8 28.5 116,584 284
Santa Cruz 21.2 2.8 12.8 9 26.1 60,084 218Fresno, Madera, Merced,Stanislaus
22.3 4.8 12.2 5.5 24 153,397 336
Imperial, Inyo, Kern, Kings,Mono, Tulare
24.3 5 10.4 4.9 27.9 132,436 491

Other Tobacco Use
11-17
Cigarette ChewingTobacco/
Snuff
Cigars Bidis AnyTobaccoProduct
Use
POPULATIONSIZE
SAMPLESIZE
(%) (%) (%) (%) (%) (n) (n)SEX Male
AGE12-13 7.1 1.5 4.6 0.9 10.6 521,024 1,02414-15 23.6 3.8 13.8 7.1 27.6 523,994 1,05216-17 40.0 10.8 27.8 16.8 45.9 467,894 986RACE/ETHNICITYHispanic 24.2 4.0 12.3 6.8 28.0 569,724 1,144Non-Hispanic White 24.9 8.1 19.4 9.5 30.2 605,409 1,436African-American 15.2 1.4 11.0 7.2 19.9 110,481 185Asian/PI 18.1 1.6 11.3 6.1 21.1 193,899 253Other 20.9 4.6 15.4 12.3 26.8 33,399 44SCHOOL PERFORMANCEMuch bet than ave 15.1 4.6 10.2 4.7 19.6 289,265 598Better than ave 22.7 5.0 16.0 7.8 26.9 561,201 1,191Average and below 26.6 5.6 16.2 9.5 31.3 662,446 1,273HOUSEHOLD INCOMEMissing 25.4 5.8 16.4 7.7 30.0 133,427 240$10,000 or less 28.6 2.4 10.4 8.5 31.4 120,738 210$10,001 to $20,000 21.6 3.5 12.4 5.6 25.5 190,724 336$20,001 to $30,000 23.1 4.3 13.6 8.2 28.3 180,244 335$30,001 to $50,000 21.5 5.4 15.3 6.4 26.2 261,309 515$50,001 to $75,000 24.4 6.5 15.3 8.4 27.6 260,167 569over $75,000 20.9 6.0 17.5 9.9 26.4 366,303 857URBAN/RURALUrban 22.6 4.8 15.0 8.0 27.1 1,374,493 2,674Rural 26.4 9.1 14.9 8.0 30.5 138,419 388
SEX Female
AGE12-13 7.7 0.0 2.1 0.4 8.7 474,506 98414-15 21.5 1.0 6.8 3.8 23.0 465,288 1,00116-17 38.5 1.8 17.3 13.7 42.5 465,528 1,043RACE/ETHNICITYHispanic 23.0 0.8 6.6 3.8 24.4 513,508 1,034Non-Hispanic White 26.6 1.5 11.8 8.4 29.6 575,283 1,474African-American 14.7 0.3 9.6 6.3 18.5 121,920 227Asian/PI 12.4 0.0 4.3 3.4 12.6 168,339 243Other 23.2 1.6 4.1 8.1 24.8 26,272 50SCHOOL PERFORMANCEMuch bet than ave 15.7 0.3 5.6 3.7 16.4 305,372 679Better than ave 20.3 0.9 9.0 6.1 23.1 530,789 1,176Average and below 28.1 1.4 10.0 7.0 30.4 569,161 1,173HOUSEHOLD INCOMEMissing 19.6 0.4 6.3 7.9 20.8 114,377 239$10,000 or less 16.4 2.7 8.9 4.6 18.9 107,521 188$10,001 to $20,000 21.9 0.8 6.6 3.7 23.5 154,465 287$20,001 to $30,000 23.9 0.9 7.9 5.9 25.9 161,816 324$30,001 to $50,000 24.8 0.7 7.8 4.4 26.3 267,678 555$50,001 to $75,000 25.9 0.8 10.2 7.9 28.3 249,698 565over $75,000 20.8 1.1 10.3 6.6 23.5 349,767 870URBAN/RURALUrban 22.1 0.8 8.7 6.1 24.2 1,266,194 2,645Rural 25.9 2.2 8.8 4.8 28.3 139,128 383

Other Tobacco Use
11-18
CHAPTER 11: GLOSSARY
Adolescents
Committed never smoker – a never smoker who does not expect to try a cigarette soonand who answers definitely not to whether he or she would accept a cigarette offered by afriend and to a question about whether he or she will smoke in the next year.
Current established smoker – has smoked a cigarette on at least one day in the past monthand has smoked at least 100 cigarettes in his or her lifetime.
Current experimenter – has smoked a cigarette on at least one day in the past month, buthas not yet smoked 100 cigarettes in his or her lifetime.
Current smoker – has smoked a cigarette on at least one day in the past month.
Current (Smokeless Tobacco, Cigar, Bidi) user – answers yes to the question aboutwhether he or she used the product on any of the last 30 days.
Ever (Smokeless Tobacco, Cigar, Bidi) user – answers yes to the question about whetherhe or she has ever used the product.
Experimenter – has smoked a cigarette (excludes puffers), but has not smoked at least100 cigarettes in his or her lifetime.
Non-current smoker (user) – has not smoked a cigarette on any days in the past month.
Puffer – someone who has not smoked a cigarette, but admits to puffing on one.
Susceptible never smoker – a never smoker who either expects to try a cigarette soon orwho does not answer definitely not to whether he or she would accept a cigarette offeredby a friend or to a question about whether he or she will smoke in the next year.
Adults
Current (Cigar, Pipe, Smokeless Tobacco) user – answers yes to the question aboutwhether he or she currently uses the product.
Current smoker – has smoked at least 100 cigarettes in his or her lifetime and smokesnow (old question) or now either everyday or some days (new question) at the time ofthe survey.
Ever (Cigar, Pipe, Smokeless Tobacco) user – answers yes to the question about whetherhe or she has ever used the product.

Other Tobacco Use
11-19
Former smoker – has smoked at least 100 cigarettes in lifetime, but does not smoke now(old question) or now smokes not at all (new question).
Never smoker – has smoked fewer than 100 cigarettes in his or her lifetime.
Occasional cigar smoker – answers some days to the question about whether he or shenow smokes cigars everyday or some days.

Other Tobacco Use
11-20
CHAPTER 11: REFERENCES
Celebucki C, Turner-Bonker DM, Connolly G, Koh HK. Bidi use among urban youth –Massachusettes, March-April 1999. MMWR 1999;48(36):796-799.
Centers for Disease Control. Tobacco use among middle and high school students – UnitedStates, 1999. MMWR. 2000;49(3):49-53.
Federal Trade Commission. Commission Actions: June 2000. World Wide Web:http://www.ftc.gov/os/2000/06/index.htm#26 (June 26, 2000), File Numbers 002 3199through 002 3205; 2000.
Henningfield JE, Hariharan M, Kozlowski LJ. Nicotine content and health risks of cigars.JAMA. 1996;276:1857-1858.
Rickert WS, Robinson JC, Bray DF, Rogers B, Collishaw NE. Characterization of tobaccoproducts: A comparative study of the tar, nicotine, and carbon monoxide yields of cigars,manufactured cigarettes, and cigarettes made from fine-cut tobacco. Prev Med.1985;14:226-233.
Rickert WS. Determination of Yields of “Tar”, Nicotine and Carbon Monoxide from BidiCigarettes: Final Report. Ontario, Canada: Labstat International, Inc.; 1999.
US Department of Health and Human Services. Preventing Tobacco Use Among YoungPeople. A Report of the Surgeon General. USDHHS Public Health Service, Centers forDisease Control and Prevention, National Center for Chronic Disease Prevention and HealthPromotion, Office on Smoking and Health; 1994.
US Department of Health and Human Services. Cigars. Health Effects and Trends.Smoking and Tobacco Control Monograph 9. Bethesda, MD: US Department of Healthand Human Services, Public Health Service, National Institutes of Health, NationalCancer Institute; 1998.