1974 - ceaa-acee.gc.ca
TRANSCRIPT

IRON ORE COMPANY OF CANADA
GEOTECHNICAL ENGINEERING
PERMAFROST STUDIES
A REPORT ON
"SUMMARY OF THE PERMAFROST STUDIES
IN THE SCHEFVERVILLE AREA"
MAY 1, 1974
PREPARED AS AN INPUT TOWARDS
CHAPTER 11 ON RESOURCE DEVELOPMENT
(PART II - MINING) AND
CHAPTER 5 ON SITE INVESTIGATIONS
(GEOPHYSICAL SURVEYS)
OF THE PERMAFROST ENGINEERING MANUAL
BEING COMPILED BY THE NATIONAL RESEARCH
COUNCIL 0̂ CANADA, OTTAWA

ACKNOWLEDGEMENT
This is a Geotechnical Engineering Report.
U
PROJECT NAME'
REPORT NAME:
REPORT DATE:
SUBMITTED TO
SUBMITTED BY
Permafrost Studies
Summary of the Permafrost Studies in the
Schef f erville Area.. .
April, 1974
J. Devon, Supervisor
Geotechnical Engineering
0. Garg, Engineer
Oeotechnical Engineering

TABLE QV CONTENTS
1.0 INTRODUCTION
1.1 General
1.2 History of Permafrost Investigations
CHAPTER 5 SITE INVESTIGATIONS
2.0 GEOPHYSICAL SURVEYS
2.1 Distribution of Permafrost
2.1.1 Techniques Used in Delineation of Permafrost
2.1.1.1 Seismic Surveys
2.1.1.2 Resistivity Surveys
2.1.1.3 Borehole Logging
2.1.2 Results from Permafrost Prediction Program
2.2 Ice Occurrence and Distribution
CHAPTER 11 RESOURCE DEVELOPMENT
3.0 OPEN PIT MINING IN PERMAFROST
3.1 Exploration (Techniques for Delineation)
3.1.1 Vegetation and Snow Cover
3.1.2 Temperature Measurements
3.2 Production (Problems Associated with the Mining of Frozen Material)
3.2.1 Drilling and Blasting
3.2.2 Processing (on site) - Crushing
3.2.2.1 Construction of Structures on Site
3.2.2.2 Material Handling
PROJECT REPORTNUMBER NUMBER PAGE
TECHNICAL SERVICESFORM - 1212-05

3.2.3 Transportation
3.3 Techniques Used in the Delineation of Permafrost at the Mining
Phase
4.0 SUMMARY & CONCLUSIONS
REFERENCES
PROJECTNUMBER
REPORTNUMBER PAGE 11
TECHNICAL SERVICESFORM - 1212-05

LIST OF FIGURES
FIGURE 1
FIGURE 2(photograph)
FIGURE 3(photograph)
FIGURE 4
FIGURE 5
FIGURE 6
FIGURE 7
8
FIGURE 9
10
Location of Schefferville with Respect to
the Distribution of Permafrost,
Occurrence of Ice Along the Bedding and Joints.
Measuring the Temperature in a Pit ^ace Using
a Thermistor Probe Developed by the Geotechnical
Engineering Section, Iron Ore Company of Canada.
A Typical Time Distance Plot from Seismic Survey.
Plotting and Interpretation of the Field
Resistivity Data.
Summarv of Permafrost Prediction Program.
Page
In back pocket
22
23
Delineation of Base of Permafrost -
^leming 3
Permafrost Prediction on 1 in=40 ft. Scale
Plan for Lift 2433 - Timmins 1.
Permafrost Distribution Along Section 440—
Fleming 3.
24
25
26
Delineation of Top of Permafrost - Fleming 3. In back pocket
In back pocket
In back pocket
In back pocket
PROJECTNUMBER
FORM - 1212-O5
REPORTNUMBER PAGE
TECHNICAL SERVICES
111

INTRODUCTION
1.1 General
Mining exploration and production activities in the permafrost
regions of Canada have increased rapidly over the last twenty years.
A brief history of these mining developments in the Canadian Arctic
and Sub-Arctic regions has recently been compiled by Brown (5) and
Dubnie (7). From both these publications it becomes clear that a
major contribution to studies in the discontinuous permafrost zone
has resulted from the observations in the Central Labrador - Ungava
Peninsula region. These studies have been undertaken in connection with
the open pit iron ore mining operations of the Iron Ore Company of Cana-
da (I.O.C.C.). The mining operations in the Labrador Trough are centered
around the town of Schefferville (54 49TN, 66 50TW) in Northern Quebec
and lie within the discontinuous zone of permafrost (16) (see Figure 1).
The general topography of the area is one of parallel ridges and valleys.
Permafrost occurs at higher elevations.
1.2 History of Permafro_s^t_Investigation5
Permafrost studies in the Schefferville area began in 1055 with
a joint I.O.C.C. and National Research Council program in the Ferriman
Mine area. This was the first mine where extensive permafrost was en-
countered in development trenches and continued to a depth of approxima-
tely 250 feet. Studies in the Ferriman area continued until the mid
1960's, largely in the form of a joint I.O.C.C.- McGill University
tPROJECTNUMBER
REPORTNUMBER PAGE
TECHNICAL SERVICESFORM - 1Z52-O3
project with technical advice from the Division of Building Research
of the National Research Council. The details and the results obtained
from these studies have been reported by Bonnlander and Major-Marothy (3),
Ives (14) and Annersten (1).
In 1967, the focus of interest was transferred to the Timmins
area, located approximately 13 miles west-northwest of Schefferville,
when the decision was made to open the Timmins 1 mine. The realiza-
tion that of a total of some 40 deposits, approximately half are ex-
pected to be whollv or partially affected by permafrost, led-to the
establishment of an experimental site on the Timmins 4 deposit. The
purpose of this site was to study the factors affecting permafrost and
to develop techniaues for delineation of permafrost (18,22,23). In
addition to continuing these studies, the Geotechnical Engineering
section has developed, between 1970-73, a program of routine permafrost
delineation for the operating pits as well as determination of the
physical properties of frozen rocks (10).
CHAPTER 5 SITE INVESTIGATIONS
2.0 GEOPHYSICAL SURVEY_5
2.1 Distribution of Permafrost
In order to evaluate the various deposits from an economic
aspect., and schedule the introduction of new deposits into the ope-
ration, delineation of permafrost on a regional and deposit scale
is essential, furthermore, if the operating and handling costs are
PROJECTNUMBER
REPORTNUMBER PAGE
TECHNICAL SERVICESFORM - 1212-05

to be kept to a minimum, the distribution of permafrost within a
38 foot mining lift must also be known. It is with these objectives
that the Heotechnical Engineering Section of the Iron Ore Company
of Canada has developed a three phase program of permafrost deli-
neation and determination of the properties of frozen rocks. The three
phases are¥
1) Regional Exploration Phase
2) Deposit Development Phase
3) Mining Phase
Each stage produces a prediction aimed at a specific phase
of decision making. A summary of the prediction program appears in
Figure 6.
2.1.1 Techniques Used-__J-n_ Pelineation of Permafrost
The two geophysical techniques used most commonly in the
delineation of permafrost in the Schefferville area areV-
1) Seismic Survevs
2) Resistivity Surveys
In addition,borehole logging techniques have been used on
a limited basis in the delineation program.
2.1.1.1 Seismic Surveys
Seismic Refraction surveys with an S.I.E. RS-4 multi-
channel seismograph are carried -out to delineate overburden depths
and the permafrost table. In order to avoid dip effects, the geo-
phone arrays are oriented parallel to the strike. A typical plot
PROJECTNUMBER
REPORTNUMBER PAGE
TECHNICAL SERVICESFORM - 1 2 1 2 - 0 5

depicting the relationship between the first arrival time of the
signal, and the shot-detector (geophone) distance is shown in Figure
4. The depths to the various layers are calculated by using the
standard relationships between the velocities and the critical distan-
ces (6). These surveys are undertaken preferably in August and Septem-
ber when most of the groundfrost is no longer present.
Interpretation of the data is based on these following
broad groups of velocities:
1) <3,500 ft/sec for unfrozen overburden
2) 3,500 to 6,000 ft/sec for frozen overburden and
leached unfrozen rock.
3) >6,000 ft/sec for bedrock, with velocities in frozen
bedrock being up to 3 times those for the same material in an unfrozen
state.
Eased on the above interpretation procedure the depths
to the permafrost table at the locations of the survey are obtained
(9).
Seismic survevs are being used on a routine basis in the
Schefferville area for determining the top of permafrost and for
obtaining the physico-mechanical properties of the material (11).
2.1.1.2 Resistivity Surveys
Resistivity surveys using a Soiltest R-60 dc svstem are
performed in order to delineate the base of the permafrost. The sur-
vey lines are oriented parallel to the strike of the geological
PROJECT REPORTNUMBER NUMBER PAGE
TECHNICAL SERVICESFORM - 1212-O5

formations. Although both Wenner (horizontal profiling and vertical
sounding) and Schlumberger configurations were tested and found to
be satisfactory, the latter was preferred because of its lower sen-
sitivity to lateral inhomogeneities. Since the aim of the resis-
tivity survevs is to obtain the depth to the base of permafrost, an
expanding electrode configuration is used.
An example of the plot of calculated apparent resisti-
vity values versus the electrode spacing used in the survey on log-
log paper is shown in figure 5. These plots are interpreted using
Orellana and Mooney two and three layer Master Curves. The maximum depth
of penetration obtained in permafrost is in the order of 150 feet
using the above instrumentation. However, greater depths of penetra-
tion in the order of 250 feet have been achieved in the permafrost
areas of Schefferville using a high power ac transmitter (20).
It should be mentioned that the depths to the base of
permafrost obtained from the resistivity surveys in areas of known
geology correlate within 15 percent with depths obtained" from temperature
measurements.
2.1.1.3 Borehole Logging
The initial attempt to evaluate the use of borehole log-
ging techniques in the delineation of permafrost was made in 1971 (24).
The logging was done with equipment built to NIM specifications by
Gearhart-Owen Industries Inc. It was concluded that the dry-hole resis-
tivity and natural gamma logging tools offered the best potential for
PROJECT REPORTNUMBER NUMBER PAGE
TECHNICAL SERVICESFORM - 1212-05

the delineation of permafrost and the stratigraphic correlation
respectively.
Based on a subsequent study it was concluded that higher
electrical resistivity and negative self potential values obtained
from logging could successfully delineate permafrost at depth (20).
Finally, the results from a recent study suggest that
uphole wave-front (seismic) shooting techniques also have potential
for determining the bottom of permafrost in the Schefferville area
(13).
2.122 Results from Permafrost Prediction Program
Permafrost investigations for a particular deposit such
as Fleming 3 constitute the second of the three phased delineation pro-
gram (8) .
During this stage the aim is to delineate permafrost in
three dimensions using geophysical methods and ground temperature mea-
surements from thermocable installations.
Seismic surveys provide the depths to the permafrost table
and resistivity surveys are used for determining the base of the perma-
frost. An example of the results obtained from resistivity surveys for
Fleming 3 is shown in Figure 8. The map is subdivided into four zones
(9). These are:-
i) unfrozen
ii) unfrozen to-70'feet talik but possible permafrost
below 70 feet.
s" .t :.
PROJECT REPORTNUMBER NUMBER PAGE
TECHNICAL SERVICESFORM - 1212-08

iii) Permafrost with a base between 100 and 150 feet.
iv) Permafrost with a base greater than 150 feet.
The delineation of permafrost in a deposit at this stage
has the following practical applications in the development and pro-
duction of an ore body. These, in order of time areV-
i) Delineation of areas where development trenching is
feasible.
ii) Expected ground conditions during development drilling,
iii) Economic planning of mining operations, particularly
with respect to production drilling and blasting costs.
iv) Delineation of areas of the pit wall which will be
affected by permafrost. This is required for the
design of pit slope angles.
v) Operational planning of areas where free digging is
possible during dirt stripping.
vi) Delineation of areas of potential water problems during
operations .
vii) Broad delineation of the blasting patterns and charges
to be used.
For some of these applications only the depth of the per-
mafrost table is required, whereas for others only the depth to the
base of permafrost is required. Keeping these separate purposes- in mind,
two different plans can be drawn. Figure 7 is a contoured
plan of the depth to the permafrost table. This also delineates areas
PROJECT REPORTNUMBER NUMBER PAGE '
TECHNICAL SERVICESFORM - 1Z12-O5

of frozen overburden which generally require drilling and blasting.
Figure 8 shows the estimated base of the permafrost, as interpreted
from the resistivity survev.
2 . 2 Ice Occurrence and
An understanding of the nature of permafrost and its relation-
ship to the material affected by it is required for a possible solution
to any of the problems caused by permafrost. Therefore, observations
regarding the type and distribution of ice have been made on a regular
basis in the operating pits such as Timmins 1 and ^leming 3. These
observations indicate a definite relationship between the lithology
and moisture content of the rocks and the nature of permafrost. The
highly leached porous ores generally contain less than 5 percent mois-
ture (bv weight) and ice is rarely visible, even with a hand lens.
The material is well bonded bv minute crystals of ice present in pore
spaces. In such cases the presence of permafrost must generally be
confirmed by temperature measurements.
In the lower grade ore material and waste wall rocks which are
more massive and have a distinct fracture pattern, ice is generally
present as sheets and lenses (1/2" or more in thickness) parallel to
the bedding and joints (Figure 2). The moisture content shows varia-
tions with rock tvpe, with average values being in the 10-15 percent
range (by weight) and local maxima as high as 30 percent (by weight)
in slates. Around temperatures in permafrost vary between 25° and
32° "F. Although no definite measurements have been taken, it seems
to? PROJECTNUMBER
REPORTNUMBER PAGE
TECHNICAL SERVICESFORM - 1212-05

likely that a portion of pore water in most of the rock types must
remain unfrozen at the range of temperatures encountered in the
Schefferville area.
It should he emphasised that at any given depth there is very
little temperature difference between rock types. A strong correla-
tion exists between the moisture (ice) content, and the form of ice
for a particular rock tvpe. The mining problems caused by the pre-
sence and distribution of permafrost are discussed in Chapter 11.
CHAPTER 11 RESOURCE DEVELOPMENT
3.0 OBEN PIT MINING IN PERMAFROST
3.1 Exploration (Techniques for Delineation)^
As outlined in Figure 6 the distribution of permafrost at the
exploration stage of the open pit mining is required for:
a) Preliminary deposit scheduling
b) Long tange planning of mining access facilities and
c) Selection of areas where future detailed permafrost studies
are required.
In order to achieve the above objectives a study of the topo-
graphy, vegetation, snow cover and the surficial features indicative of
permafrost is undertaken in the area.
3.1.1 Vegetation and Snow Cover
It is fairly well established that topography, vegetation,
snow cover, drainage and mean annual air temperature are the controlling
PROJECT REPORTNUMBER ____ NUMBER PAGE
TECHNICAL SERVICESFORM - 1212-05

factors in the distribution of permafrost in the discontinuous zone
(4). Based on the earliest study undertaken in the Sche££erv:'.lle
area, it was concluded that the quickest way to predict the location
of permafrost was through the analysis of the topography and vegeta-
tion (3). Based on recent studies, the critical snow depth for the
maintenance of permafrost in the Schefferville area has been found
to be approximately 27 inches (12, 17).
Although snow is the most important parameter in the
distribution of permafrost, the widespread application of the concept
of critical snow cover is still in the process of refinement. There-
fore it is necessary at this time to place great emphasis on tempera-
ture measurements at depth.
3.1.2 Temperature __Mga_sur_em_ent_s_
The initial temperature measurements in the Schefferville
area were made using thermocouples as sensors. Thermocables having 12-
thermocouples per cable were initially installed in oil-filled holes lined
with plastic tubing. The instroments used to measure the temperatures
were a Speed-o-max recorder and a Honeywell potentiometer (21). In the
next series of installations in 1968, thermocables were enclosed in
rubber hose and inserted in drill holes, which were filled with sand. This
was done primarily to reduce the risk of loss of oil and inflow of water
to the plastic-lined tubes. The Honeywell potentiometer was used in the
measurements. The accuracy of the potentiometer was estimated to be
0.2°F to 75 feet with increasing inaccuracy to about 0.6°F at 200 feet
r iPROJECT REPORTNUMBER _____ NUMBER PAGE 10
TECHNICAL SERVICESF O R M - 1212-05

(21, 22). Apart from the need to improve upon the accuracy
of the temperature-measurements using a potentiometer, its use for
extended periods of_time during.the.cold.winter months posed practical
problems, such as the freezing of the ice bath and the variation of
the emf of the standard cell.
Thermistors mounted on multi-conductor cables have been
used in all the holes since 1971. Thermistors were preferred over
thermocouples for the following reasonsV-
1) Higher sensitivity to changes in temperature.
2) Compactness, and simplicity in mechanical design.
3) Availability of an accurate readout system (precision-
bridge) capable of providing satisfactory temperature
measurements for extended periods of time in cold
winter months.
The accuracy of the temperature measurements
using thermistors depends on the accuracy of their calibration. The-
thermistors used since 1971 are accurate to - 0.005°F.
The end product of the regional exploration phase is a
l" = 1000 feet scale permafrost prediction map. The estimated accuracy
of the 2-dimensional prediction is in the order of _ 500 feet or better
3.2 Production (Problems Associated with, the joining of Frozen
Ma_t_eri_ajL)
3.2.1 Drilling and Blasting
The heat generated during rotary blast-hole drilling with
air circulation in permafrost particularly with high ice contents and -.
PROJECT REPORTNUMBER NUMBER PAGE
TECHNICAL SERVICESFORM - 1212-OB

temperatures close to 32°^, causes the ice on the sides of the hole
to melt. This leads to severe caving. Also, the filling
of blast holes with water from the nearby talik zones of limited ex-
tent further aggravates the problems of melting and caving, and often
several holes have to be drilled before one is suitable for loading.
Ice present' in the permanently frozen rocks absorbs a
large proportion of the energy generated by the explosives in a blast
Therefore, in order to obtain the required fragmentation,
far more explosives are needed to break tfae frozen material as compared
with the unfrozen material. It has been found that the efficiency of
a blast is controlled not only by the total ice content but also by
the type and distribution of the ice. In practice, a more dense blast
hole pattern and a more powerfullexplosive (Metallized Slurry such as
Hydromex as opposed to AN-^0) is required (2,15). This results in an
increase in the.cost of the blasting operation.
Poor fragmentation due to permafrost produces large blocks
of material and uneven pit floor topography and results in a reduction
of production rates.
3.2.2 Processing (onsite) - Crushing
Problems are encountered due to the blasted material
refreezing together and causing bridging in fcHe crusher feed hoppers.
Based on a study conducted on the crushability index it was concluded
that the percentage of the particles larger than 1 1/2 inches at the
PROJECTNUMBER
REPORTNUMBER PAGE 12
TECHNICAL SERVICESFORM - 1212-05

secondary crusher is at least three times greater in frozen material
than in unfrozen ore. This is due to the increased hardness and plas-
ticity of the frozen material. Therefore the cost of crushing the
frozen ore on site prior to shipment is increased.
3.2.2.1 Cp_nstruc_t_ion__of_ Structures^ on Site
The presence of permafrost has created problems
in the selection of construction sites. The active layer over per-
mafrost provides an.unstable base for buildings and railroads.
During the construction of the railroad from
Sept-lies to Schefferville (19), other rail facilities, .and the r-.
Schefferville townsite,.permaf rost was encountered. The ice rich mate-
rial was excavated and the site filled with dry unfrozen rock*
Site investigation of the proposed location of the
Timmins Mine service garage proved the existence of extensive zones
of ice richhpermafrost with a"n unstable active layers Further site
investigations, including ground temperature measurements located a
permafrost free area. The building was constructed in 1968 and no
problems have been encountered with the foundations.
3.2.2.2 Material Handling
In addition to the above mentioned problems, there
are handling problems which also contribute to the increased cost of
mining the frozen ore in the Schefferville area. These are:-
1) The surface and near surface runoff conditions in
the permafrost areas lead to an open pit acting as a sump. The runoff
PROJECT REPORTNUMBER _____ NUMBER PAGE
TECHNICAL SERVICESFORM - 1212-05

water flows over the permafrost surface and enters the pit. The pre-
sence of water on the pit floor results in thawing of the permafrost
and leads to difficult operating conditions.
2) Unfrozen overburden may normally be stripped without blasting,
but frozen overburden must be drilled and blasted prior to its removal.
3) The stockpiles in Sept-lies may freeze if not insulated during
the cold winter months. A program has been initiated in Sept-lies to
monitor the temperature changes in the stockpiles:
a) with natural snow cover
b) with an artificial snow cover which has been put in place
earlv in the winter before heavv snow occurs, and before frost has had
the opportunity of penetrating verv far.
These problems can only be controlled by careful planning
and closely controlled operating procedures. Therefore the delineation of
permafrost on a regional and deposit scale as well as on a 38 foot mining
lift is essential.
3.2.3 Transp o r t a t ion
Two problems that are usually encountered during the trans-
portation of frozen ore from the producing mines in Schefferville to
Sept-lies, Quebec, 360 miles away are:
1) Thawing of ore en route to Sept-lies results in wet 'sticky'
ore which is difficult to remove from the rail car.
2) During the beginning and the end of ore season when the air
temperatures are still below 32°7, the ore freezes to the sides and the
bottom of cars. This necessitates breaking..the .bond, between the ore:and
PROJECT REPORTNUMBER NUMBER PAGE
TECHNICAL SERVICESFORM - 1212-05

the car by heating with propane heaters before the
ore can be dumped.
3.3 Techniques Used in the 'Delineation of Permafrost at the
Mining Phas e
In addition to carrying out the geophysical surveys for
each 38 foot lift prior to mining, temperature measurements are made
both in the pit walls and floors and in blast holes during the mining
phase (see Figure 6) of the permafrost program. These temperature
measurements involve the use of portable thermistor probes specially
developed for this purpose ("Figure 3).
In the pit floor, holes are drilled to between 2 and 5
t feet using either a steel rod or a Cobra drill. Temperature stability
is generally reached within 20 minutes, although in cases of excep-
tional ground disturbance this can be extended to 2 hours.
In the 9 7/8"inch blast holes the thermistor probe is
mounted on copper wire in a bell shaped insulator. This insulates the
probe from the air temperature in the drill hole. The major problem
experienced in temperature measurements involve ensuring that the
results are not affected by outside influences such as air temperature,
surface water and. heat generated during drilling.
The results of this third and the final stage of inves-
tigation for the permafrost delineation are:-
PROJECT REPORT -.rNUMBER NUMBER PAGE
TECHNICAL SERVICESFORM - 1212-05

1) a plan showing the distribution of permafrost which
outline the areas of potential problems in drilling and blasting.
2) the distribution of permafrost on a 1 in=40 ft scale'geo-
logical cross section which contains the designed pit limits. "Examples of
these are shown in Figure 9 and 10. respectively.
In addition to temperature measurements in the pit face,
pit floor and blast holes, observations on the type, quantity and dis-
tribution of ice in the various rocks are also made on a lift by lift
basis during the excavations in the pit.. This allows, .evaluation of the accuracy
of the permafrost delineation and makes available supplementary information
required for a complete understanding of the behaviour of frozen material
for future mining operations in permafrost.
As a part of the overall program of predicting the behavi-
our of frozen material during the mining operations on a 88 foot lift,
the following physical and mechanical .properties of frozen rocks have
also been measured in the laboratorv:-
1) Thermal conductivity.
2) Sonic velocity.
3) Electrical resistivitv.
4) Compressive and shear strengths.
It is hoped that these studies will help in the o.pt-imization
of the mining operations.
PROJECT REPORTNUMBER __̂ _̂ _̂ NUMBER PAGE 16
TECHNICAL SERVICESFORM - 1212-OB
4.0 SUMMARY AND CONCLUSIONS
To date the main efforts in the Iron Ore Company of Canada's
permafrost program have been aimed at the three dimensional delinea-
tion of permafrost in the Schefferville area. Permafrost predictions
on three different scales are required for three distinct phases of
the open pit mining operations i.e. exploration, development and mining
However limited efforts have also been made towards:
1) the determination of physical and mechanical properties and
the behaviour of frozen material and
2) the monitoring of blasts in permafrost.
PROJECT REPORTNUMBER NUMBER PAGE 17
TECHNICAL SERVICESFORM - 1212-05

REFERENCES
1) Annersten, L.J. (1964): Investigations of Permafrost in
the Vicinity of Knob Lake, 1961-62. MeGill Sub-Arctic Re-
search Paper 16, p. 51-143.
2) Bauer, A. et al (1965): How I.O.C. Puts Crater Research to
Work. Engineering and Mining Journal, V. 166, No. 9 Sept.
1965, pp. 117-121.
3) Bonnlander, B. and Major-Marothy, G.M. (1957): Report on
Permafrost Investigations 1956-57. Internal Report of the
Iron Ore Company of Canada.
4) Brown, R.J.E. (I960): The Distribution of Permafrost and
its Relationship to Air Temperature in Canada and the USSR.
Arctic Vol. 13. No. 3.
5) (1970): Permafrost in Canada: Its Influence
on Northern Development. University of Toronto Press.
6) Dobrin, M. (1960): Introduction to Geophysical Prospec-
ting. McGraw-Hill Book Company, Second Edition.
7) Dubnie, A. (1972): Northern Mining Problems with Particu-
lar Reference to Unit Operations in Permafrost. Techni-
cal Bulletin TB 148 of the Mining Research Centre-EMR,
June 1972.
8) Garg, O.P. (1971): Permafrost Prediction .for Fleming 3 De-
posit. Internal Report of the Iron Ore Company of Canada,
March 1971. Technical Services Report No. 6907-5.
PROJECT REPORTNUMBER NUMBER PAGE 18
TECHNICAL SERVICESFORM - 121Z-OS

9) (1971): Permafrost Delineation in Fleming 3
Using Geophysical Techniques. Internal Report of the Iron
Ore Company of Canada, December 1971. Technical Services
Report No. 6907-6.
10) Garg, O.P. and Stacey, P.F. (1972): Techniques Used in the
Delineation of Permafrost in the Schefferville, P.Q. Area.
Proceedings of a Seminar on the Thermal Regime and Measure-
ments in Permafrost. National Research Council. Technical
Memorandum No. 108.
11) (1973): In situ Physico-mechanical Properties
of Permafrost Using Geophysical Techniques. Proceedings
North American Contribution, Second International Confe-
rence on Permafrost. National Academy of Sciences. Was-
hington D.C.
12) Granberg, H. (1973): Indirect Mapping of Snow Cover for
Permafrost . Prediction at Schefferville, P.O. Proceedings
North American Contribution, Second International Confe-
rence on Permafrost. National Academy of Sciences, "Was-
hington, D.C.
13) Hunter, J.A.K. (1973): Seismic Up-Hole Wave Front Expe-
riments in Permafrost, Schefferville, Quebec. Prelimina-
ry Report Submitted to the Iron Ore Company by the Geolo-
gical Survey of Canada.
PROJECT REPORTNUMBER ___^ NUMBER PAGE 19
TECHNICAL SERVICESFORM - 1212-08

14) Ives, J.D. (1962): Iron Mining in Permafrost, Central
Labrador - Ungava. Geographical Bulletin, No. 17,
p. 66-77.
15) Lang, L.C. (1965): Pit Slope Control by Controlled Blas-
ting, Canadian Mining Journal, V. 86, No. 12, Dec 1965.
16) Mayer, P.W.A. (1966): Mining in Canada's Sub-Arctic -
Tbe Iron Ore Company of Canada, CIMM Bull. No. 656,
Dec., 1966, pp. 1437-1441.
17) Nicbolson, F.H. and Granberg, H.B. (1973): Permafrost
and Snow Cover Relationships near Schefferville. Pro-
ceedings North American Contribution, Second International
Conference on Permafrost. National Academy of Sciences,
"Washington, D.C.
18) __ and Thorn, E.G. (1973): Studies at the
Timmins 4 Permafrost Experimental Site. Proceedings
North American Contribution, Second International Con-
ference on Permafrost. National Academy of Sciences,
Washington, D.C.
19) Pryer, R.W.J. (1966): Mine Railroads in Labrador - Un-
gava. In Permafrost: Proceedings of an International
Conference. National Academy of Sciences, Washington,
D.C.
Q PROJECTNUMBER
REPORTNUMBER PAGE 20
TECHNICAL SERVICESFORM - 1212-00

20) Seguin, M.K. and Garg, O.P. (1972): Delineation of Fro-
zen Rocks from Labrador - Ungava Penninsula Using Bore-
hole Geophysical Logging. Paper Presented at the Qth
Canadian Symposium on Rock Mechanics held in Montreal
on Dec. 13-15, 1972.
21) Thorn, B.C. (1969): Permafrost in the Knob Lake Iron
Mining Region; Proceedings of the 3rd Canadian Confe-
rence on Permafrost. National Research Council. Te-
chnical Memorandum No. 96.
22) (1969): New Permafrost Investigations Near
Schefferville, P.Q. Rev. Geogr. Montr., 1969, Vol.
XXIII, No. 3, P. 317-327.
23) (1970): Comprehensive Report on Timmins 4
Permafrost Experimental Site. Internal Report of the
Iron Ore Company of Canada. Technical Services Report
No. 6907-4.
24) Wyder, J.E. (1972): Report of Borehole Geophysical
Logging at Iron Ore Company of Canada, Schefferville
P.O. August 1971. Part of the Geological Survey of
Canada. Project 680035.
PROJECTNUMBER
FORM - 1212-05
REPORTNUMBER PAGE 21
TECHNICAL SERVICES
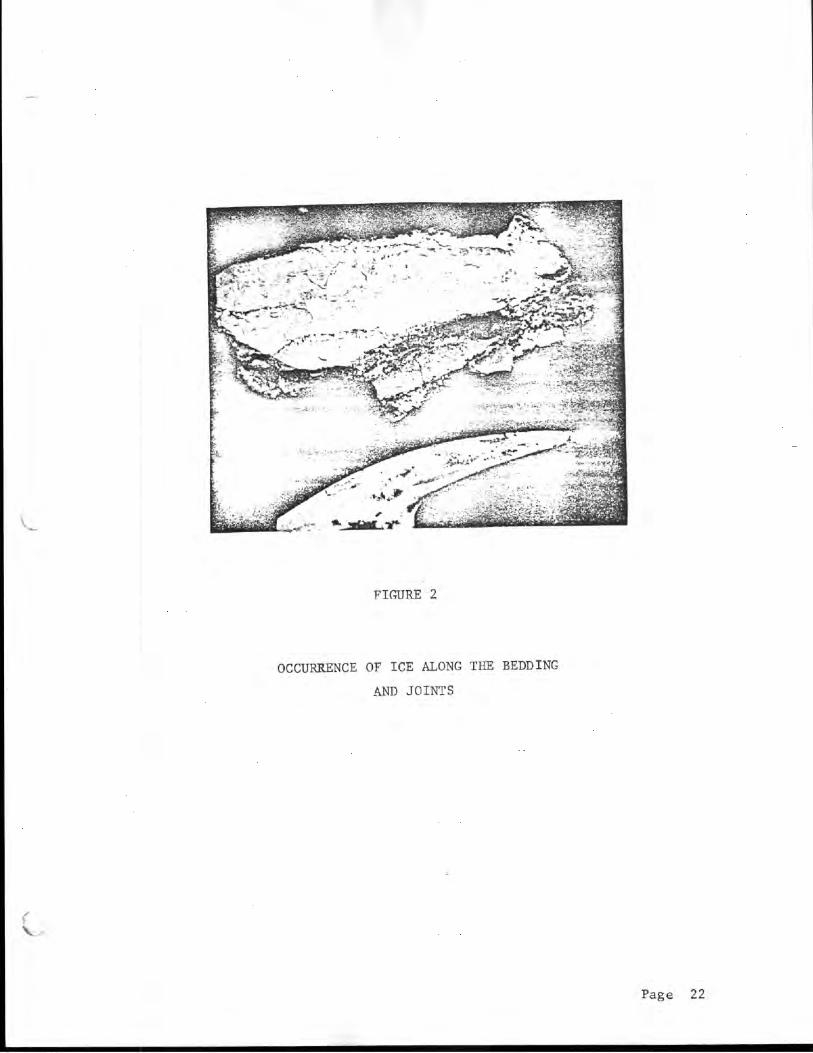
FIGURE 2
OCCURRENCE 07 ICE ALONG THE BEDDING
AND JOINTS
V
Page 22
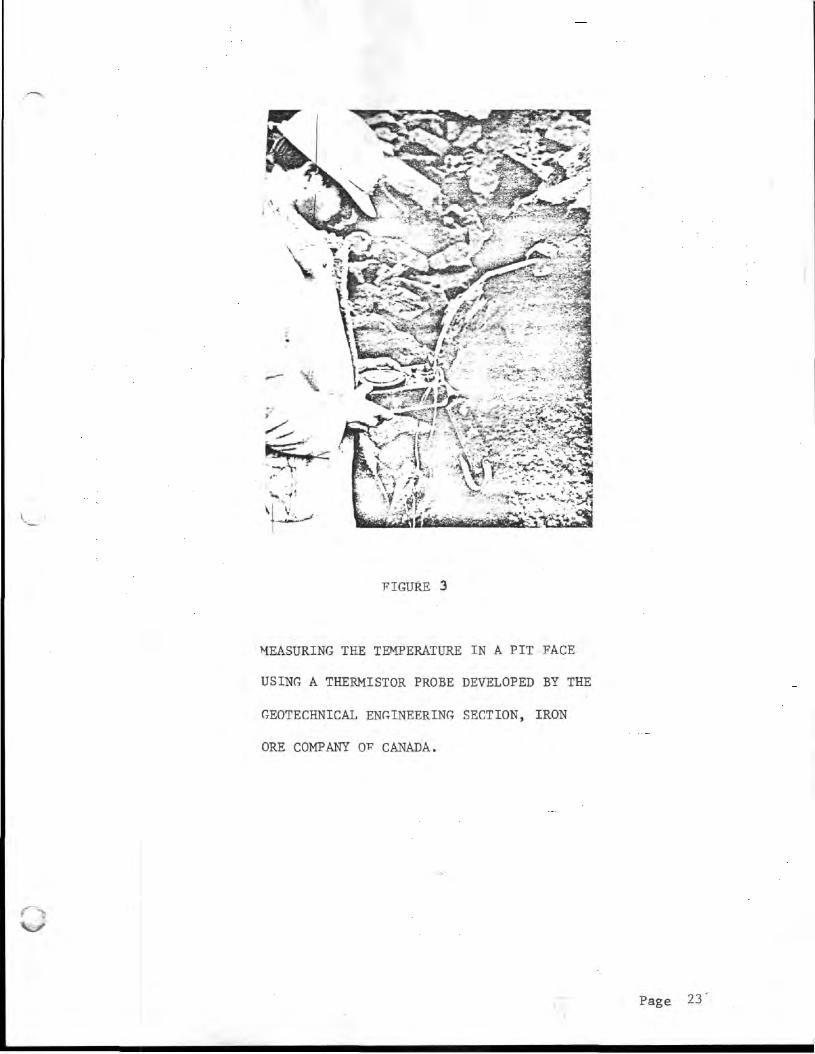
FIGURE 3
MEASURING THE TEMPERATURE IN A PIT FACE
USING A THERMISTOR PROBE DEVELOPED BY THE
GEOTECHNICAL ENGINEERING SECTION, IRON
ORE COMPANY OT? CANADA.
Page 23

FIGURE No.6
SUM M A R Y OF P E R M A F R O S T P R E D I C T I O N PROGRAM
P H A S E S C A L E
R e g i o n a l exp lo ra t ion | " = I O O O '
TECHNIQUES U S E D
Aer ia l photos, use ofgeomorphologicalfeatures
P U R P O S E
Pre l im ina ry deposit schedu-ling.
Long range planning of miningaccess faci l i t ies
Future pe rma f ros t studies
Deposit development
l " = 100'-
I" -200'
Ground tempera turemea s u r e m e n ts
.Seismic surveys
Re s i s t i v i t y surveys
For an economic evaluationof a deposit
Fac i l i ta tes mine planning(Design of s lopesand hydrolo( gical pro b lems)
Min ing
(lift by lift)I" =40'
Se ismic surveys
Res is t i v i t y surveys
Outline areas for d i f f i cu l t drilling
Pred ic t ion of response tob l a s t i n g

• I
1,000,000
|-100,000
BEST FITTED CURVEPOINTS FROM SURVEY
CURRENT ELECTRODE SPACING
Mo,ooo
DEPTH of 1st LAYER ( h, )= L i f t . •
DEPTH of 2nd LAYER (h2)= II ft.
j I = 65 000-«-ft.
2 = 28000-^ft.3f 3 -
1000
IRON ORE COMPANY OF CANADA
GEOTECHNICAL ENGINEERING
"FIGURE No.5INTERPRETATION OF THE FIELDRESISTIVITY DATA. FLEMING No.5
JULY 197110
L ( FEET)100 IOC
Page 25

IRON ORE COMPANY OF CANADAGEOTECHNICAL ENGINEERING
60FIGURE No.4
A TYPICAL TIME DISTANCE PLOT FROM
SEISMIC SURVEY FLEMING No.3
50-
DEPTH OF FIRST LAYER Z , =
DEPTH OF SECOND LAYER Zo = 30
X ARRIVAL TIME AS PICKED UP FROM SEISMIC RECORD
100 120
DISTANCE IN FEET
140 [60 180 200