193680-df ccsa 31.03.2017 17 - copersucar.com.br€¦ · copersucar s.a. financial statements march...
TRANSCRIPT

KPDS 193680
Copersucar S.A.Financial statements march 31, 2017

Copersucar S.A. Financial statements
March 31, 2017
2
Contents Independent auditors' report on the financial statements 3
Balance sheets 7
Statements of income 8
Statements of comprehensive income 9
Statements of changes in shareholders' equity 10
Statements of cash flows 11
Statements of added value 12
Notes to the financial statements 13

KPMG Auditores Independentes, a Brazilian entity and a member firm of the KPMG network of independent member firms affiliated with KPMG International Cooperative (“KPMG International”), a Swiss entity.
KPMG Auditores Independentes, uma sociedade simples brasileira e firma-membro da rede KPMG de firmas-membro independentes e afiliadas à KPMG International Cooperative (“KPMG International”), uma entidade suíça.
3
KPMG Auditores Independentes
Rua Arquiteto Olavo Redig de Campos, 105, 6º andar - Torre A
04711-904 - São Paulo/SP - Brazil
Caixa Postal 79518 - CEP 04707-970 - São Paulo/SP - Brazil
Telephone: +55 (11) 3940-1500 Fax: +55 (11) 3940-1501
www.kpmg.com.br
Independent auditors' report on the financial statements
To the Management and Board Members of Copersucar S.A. São Paulo - SP
Opinion We have examined the individual and consolidated financial statements of Copersucar S.A. ("Company"), identified as Parent Company and Consolidated, respectively, comprising the balance sheet as of March 31, 2017 and the related statements of income, comprehensive income, changes in shareholders' equity and cash flows for the year then ended, as well as the summary of the significant accounting policies and other explanatory notes.
In our opinion, the aforementioned individual and consolidated financial statements present fairly, in all material respects, the individual and consolidated financial position of Copersucar S.A. as of March 31, 2017, the individual and consolidated performance of its operations and its respective individual and consolidated cash flows for the year then ended, in conformity with the accounting practices adopted in Brazil and International Financial Reporting Standards - IFRS issued by the International Accounting Standards Board (IASB).
Basis for opinion Our audit was conducted in accordance with Brazilian and international standards on auditing. Our responsibilities, according to such standards, are described in the following section, entitled “Auditors’ responsibility for the audit of the individual and consolidated financial statements”. We are independent of the Company and its subsidiaries, according to the relevant ethical principles established in the Accountant’s Code of Professional Ethics and the professional standards issued by the Federal Accounting Council, and comply with other ethical responsibilities according to such standards. We believe that the audit evidence obtained is sufficient and appropriate to provide a basis for our opinion.
Other issues
Statements of added value The individual and consolidated statements of added value (DVA) for the year ended March 31, 2017, prepared under responsibility of Company's Management, and presented as supplementary information for IFRS purposes, were submitted to audit procedures carried out jointly with the audit of financial statements of Copersucar S.A. To form an

KPMG Auditores Independentes, a Brazilian entity and a member firm of the KPMG network of independent member firms affiliated with KPMG International Cooperative (“KPMG International”), a Swiss entity.
KPMG Auditores Independentes, uma sociedade simples brasileira e firma-membro da rede KPMG de firmas-membro independentes e afiliadas à KPMG International Cooperative (“KPMG International”), uma entidade suíça.
4
opinion, we evaluated whether these statements are reconciled with accounting statements and accounting records, as applicable, and whether their forms and contents are in accordance with criteria defined in Technical Pronouncement CPC 09 - Statement of Value Added. In our opinion, these statements of added value were adequately prepared, in all material respects, according to criteria defined in this Technical Pronouncement and are consistent with individual and consolidated accounting statements taken as a whole.
Other information that accompany the individual and consolidated financial statements and the auditor’s report The management of Copersucar S.A. is responsible for such other information, which comprise the Management Report that should made available after this report date.
Our opinion on the individual and consolidated financial statements do not include the Management Report, and we do not express any type of audit conclusion on such report.
In connection with the audit of the individual and consolidated financial statements, our responsibility is to read the Management Report, and, when doing so, consider whether such report is, in material respects, inconsistent with the financial statements or with the knowledge we obtained in the audit, or seem otherwise materially misstated. If, based on the work carried out, we conclude that there is material misstatement in the Management Report, we are required to report such fact. We do not have anything to report on this respect.
Responsibilities of management and governance for the individual and consolidated financial statements Management is responsible for the preparation and adequate presentation of the individual and consolidated financial statements in accordance with the accounting practices adopted in Brazil and International Financial Reporting Standards - IFRS issued by the International Accounting Standards Board (IASB), and the internal controls it deemed necessary to enable the preparation of these financial statements free of significant distortions, regardless of whether the latter were caused by fraud or error.
In the preparation of the individual and consolidated financial statements, management is responsible for assessing the ability of Copersucar S.A. to continue as going concern, disclosing, when applicable, the matters related to its going concern, and the use of this accounting basis in the preparation of the financial statements, unless the management intends to liquidate the Copersucar S.A. and its subsidiaries, or cease their operations, or do not have any realistic alternative to avoid the discontinuance of operations.
Those charged with governance of Copersucar S.A. and its subsidiaries are those with responsibility for supervising the process of preparation of the financial statements.

KPMG Auditores Independentes, a Brazilian entity and a member firm of the KPMG network of independent member firms affiliated with KPMG International Cooperative (“KPMG International”), a Swiss entity.
KPMG Auditores Independentes, uma sociedade simples brasileira e firma-membro da rede KPMG de firmas-membro independentes e afiliadas à KPMG International Cooperative (“KPMG International”), uma entidade suíça.
5
Responsibilities of the auditors for the audit of individual and consolidated statements Our aims are to obtain reasonable assurance about whether the individual and consolidated financial statements, taken as a whole, are free from material misstatement, whether due to fraud or error, and issue an audit report containing our opinion. Reasonable assurance means a high level of security, but not a guarantee that an audit conducted in accordance with Brazilian and international auditing standards always detects any existing material misstatements. Misstatements may arise from fraud or error, and are considered material when, individually or in aggregate, may influence, from a reasonable perspective, the economic decisions of users taken based on such financial statements.
As part of an audit conducted according to the Brazilian and international auditing standards, we exercise professional judgment, and maintain professional skepticism during the audit. Moreover:
• We identify and assess risks of material misstatements in the individual and consolidatedfinancial statements, whether due to fraud or error, plan and perform audit procedures inresponse to such risks, as well as obtain appropriate and sufficient audit evidence to baseour opinion. The risk of not detecting material misstatement resulting from fraud is higherthan the one resulting from error, once fraud may involve the act of cheating internalcontrols, collusion, falsification, omission or intentional misrepresentations.
• We obtain understanding of the internal controls relevant to the audit for planning auditprocedures appropriate to the circumstances, but not with the aim to express opinion onthe effectiveness of the internal controls of Copersucar S.A. and its subsidiaries.
• We evaluate the adequacy of the adopted accounting policies and the reasonableness ofthe accounting estimates and the respective disclosures made by management.
• We arrive at a conclusion on the adequacy of the use, by management, of the goingconcern basis of accounting, and based on the obtained audit evidences, whether there ismaterial uncertainty in relation to events or conditions that may raise significant doubts onthe ability to continue as going concern of the Copersucar S.A. and its subsidiaries. If weconclude that there is material uncertainty, we shall draw attention in our audit report tothe respective disclosures in the individual and consolidated financial statements orinclude modification in our opinion, should the disclosures be inadequate. Our conclusionsare based on the audit evidences obtained through the date of our report. However, futureevents or conditions may cause Copersucar S.A. and its subsidiaries to no longercontinue as going concern.
• We evaluate the overall presentation, structure and content of the financial statements,including the disclosures and whether the individual and consolidated financial statementsrepresent the corresponding transactions and events in a way compatible with the fairpresentation objective.
• We obtain appropriate and sufficient audit evidence regarding the financial information ofthe entities or business activities of the group to express an opinion on the individual andconsolidated financial statements. We are responsible for the direction, supervision andperformance of the audit of the group, and, consequently, the audit opinion.

KPMG Auditores Independentes, a Brazilian entity and a member firm of the KPMG network of independent member firms affiliated with KPMG International Cooperative (“KPMG International”), a Swiss entity.
KPMG Auditores Independentes, uma sociedade simples brasileira e firma-membro da rede KPMG de firmas-membro independentes e afiliadas à KPMG International Cooperative (“KPMG International”), uma entidade suíça.
6
We communicate with Management regarding, among other aspects, the planned scope and timing of the audit, as well as significant audit findings, including any possible significant deficiencies in internal controls that we identify during our work.
São Paulo, May 17, 2017
KPMG Auditores Independentes CRC 2SP014428/O-6 Original report signed by André Luiz Monaretti Fernando Rogério Liani Accountant CRC 1SP160909/O-3 Accountant CRC 1SP229193/O-2

Copersucar S.A.
Balance sheets as of March 31, 2017 and 2016
(In thousands of reais)
Assets Note 2017 2016 2017 2016 Liabilities Note 2017 2016 2017 2016
Current assetsCash and cash equivalents 7 1,264,785 932,854 476,215 704,929 18 1,214,640 1,481,847 924,606 1,028,317 Trade accounts receivable 8 694,290 774,088 262,134 430,690 19 1,853,779 2,243,662 1,633,721 1,995,014 Inventories 9 2,289,203 2,327,423 1,113,107 1,087,272 39,889 17,359 30,501 11,141Current taxes 10 276,676 296,439 269,745 264,196 14,939 - - -Advances to suppliers 11 323,292 446,562 11,904 16,693 20 40,121 54,040 2,123 16,841Brokers 12 26,338 79,672 518 - 12 8,665 7,653 - 38Unrealized derivative financial instruments 23 565,128 309,310 224,702 141,053 21 1,315,636 880,191 397 476Other accounts receivable 72,912 67,935 20,147 25,349 23 322,916 656,478 238,055 313,522
Current liabilitiesSuppliersLoans and financingPayrollProvision for income taxesTax and contributionsBrokersAdvance from custumersUnrealized derivative financial instruments Other accounts payable 75,715 59,012 22,155 9,480
Total current assets 5,512,624 5,234,283 2,378,472 2,670,182 Total current liabilities 4,886,300 5,400,242 2,851,558 3,374,829
Non-current liabilitiesNon-current assets Loans and financing 19 2,322,665 1,580,136 1,021,158 862,342 Deferred assets 13 450,740 411,829 425,477 398,493 Employee benefits 18,716 36,484 15,302 5,100Deposit in court 22 53,736 39,422 38,473 25,522 Tax and contributions 20 184 321 - -Unrealized derivative financial instruments 23 7,636 13,901 2,262 13,901 Provisions for contingencies 22 17,961 37,022 169 20,993Intercompany 25 - - 4,600 13,399 Unrealized derivative financial instruments 5,724 - 5,277 -Other accounts receivable 932 6,538 - 4,879 Deferred tax liabilities 13 152,622 114,849 84,068 57,353Investments 14 1,003,133 867,136 1,579,845 1,356,434 Other accounts payable 1,169 6,869 - -Investment property 15 - - 70,743 70,242 Uncovered liability 14 - - - 2,593Property, plant and equipment 16 762,684 791,296 97,521 105,663 Intangible assets 17 247,180 271,485 13,463 15,958 Total non-current liabilities 2,519,041 1,775,681 1,125,974 948,381
Total non-current assets 2,526,041 2,401,607 2,232,384 2,004,491
180,301 180,301 180,301 180,301 1,769 - 1,769 -(134) (8) (134) (8)
34,336 21,614 34,336 21,61411,233 10,702 11,233 10,702
383,036 143,742 383,036 143,742
Shareholders’ equity Capital Capital reserve Shares in treasury Legal reserve Income reserves Investment reserves Revaluation reserve 22,783 (4,888) 22,783 (4,888)
Shareholders’ equity attributable to controlling shareholders 26 633,324 351,463 633,324 351,463
Interest of non-controlling interest - 108,504 - -
Total shareholders' equity 26 633,324 459,967 633,324 351,463
Total assets 8,038,665 7,635,890 4,610,856 4,674,673 Total liabilities and shareholders' equity 8,038,665 7,635,890 4,610,856 4,674,673
See the accompanying notes to the financial statements.
Consolidated Parent company Consolidated Parent company
7

Copersucar S.A.
Statements of income
Years ended as of March 31, 2017 and 2016
(In thousands of reais)
2017 2016 2017 2016
Note
Net revenue 27 28,269,893 26,324,006 8,279,163 7,901,678 Unrealized derivative financial instruments 23 634,895 (658,739) 53,846 2,144 Cost of sales 29 (28,048,458) (24,836,635) (7,903,864) (7,230,754)
Gross income 856,330 828,632 429,145 673,068
Sales expenses 29 (124,781) (122,860) (49,237) (41,660) Administrative expenses 29 (226,397) (216,968) (124,502) (98,219) Other income 56,217 26,051 49,137 16,484 Other expenses (42,120) (39,117) (8,738) (3,809)
Income before net financial 519,249 475,738 295,805 545,864
Financial income 28 1,017,307 1,958,221 734,687 806,072 Financial expenses 28 (1,300,555) (2,235,080) (962,648) (1,033,358)
Net financial 28 (283,248) (276,859) (227,961) (227,286)
Equity in net income of subsidiaries 14 65,430 (67,461) 192,426 (231,246)
Income before taxes 301,431 131,418 260,270 87,332
Provision for income taxes (current) 30 (112,290) (32,746) (71,337) (46,154) Provision for income taxes (deferred) 30 67,823 (53,541) 65,500 (8,739)
Total income and social contribution taxes (44,467) (86,287) (5,837) (54,893)
Net income for the year 256,964 45,131 254,433 32,439
Net income atributtede to:Controlling shareholders 254,433 32,439 254,433 32,439 Non-controlling interest (NCI) 2,531 12,692 - -
Net income for the year 256,964 45,131 254,433 32,439
See the accompanying notes to the financial statements.
Consolidated Parent company
8

Copersucar S.A.
Statements of comprehensive income
Years ended as of March 31, 2017 and 2016
(In thousands of reais)
2017 2016 2017 2016
Net income for the year 256,964 45,131 254,433 32,439
Comprehensive income
Accumulated translation adjustment included 765 (2,916) 765 (2,916) Accumulated translation adjustment (102,010) 92,779 (102,010) 92,779Non-Deliverable Forward investment hedge 191,855 (161,428) 191,855 (161,428) Non-Deliverable Forward - Cash flow hedge 4,277 (129) 4,277 (129) Income and social contribution taxes (66,685) 54,929 (66,685) 54,929
Total comprehensive income 285,166 28,367 282,635 15,675
Comprehensive net income attributable to:Controlling shareholders 282,635 15,675 282,635 15,675
Non-controlling interest (NCI) 2,531 12,692 - -
Total comprehensive income 285,166 28,367 282,635 15,675
See the accompanying notes to the financial statements.
Consolidated Parent company
9

Copersucar S.A.
Statements of changes in shareholders' equity
Years ended as of March 31, 2017 and 2016
(In thousands of reais)
Total
In 2015 180,301 - (8) 19,992 9,886 113,233 12,692 - 336,096 158,678 494,774 -
Realization of deemed cost - - - - - - (816) 816 - - - Comprehensive income for the year: -
Accumulated translation adjustment included - - - - - - (2,916) - (2,916) - (2,916) Net investment hedge in foreign transaction - - - - - - (13,763) - (13,763) - (13,763) Net cash flow hedge - - - - - - (85) - (85) - (85)
Net income for the year - - - - - - - 32,439 32,439 12,692 45,131 Distribution of income:
Legal reserve - - - 1,622 - - - (1,622) - - - Compulsory minimum dividends (R$ 0.0002 per share) - - - - - - - (308) (308) - (308) Profit retention - - - - 816 30,509 - (31,325) - - -
Transactions with non-controlling interest - - - - - - - - - (62,866) (62,866)
In 2016 180,301 - (8) 21,614 10,702 143,742 (4,888) - 351,463 108,504 459,967
Realization of deemed cost - - - - - - (531) 531 - - -
Income (loss) from disposal of shares in treasury - 1,769 - - - - - - 1,769 - 1,769
Shares in treasury - - (126) - - - - - (126) - (126)
Comprehensive income for the year: - -
Accumulated translation adjustment included - - - - - 765 - 765 - 765
Net investment hedge in foreign transaction - - - - - - 24,614 - 24,614 - 24,614
Net cash flow hedge - - - - - - 2,823 - 2,823 - 2,823
Net income for the year - - - - - - - 254,433 254,433 2,531 256,964
Distribution of income: - -
Legal reserve - - - 12,722 - - - (12,722) - - -
Compulsory minimum dividends (R$ 0.00196 per share) - - - - - - - (2,417) (2,417) - (2,417)
Profit retention "ad referendum" Annual Shareholders’ Meeting - - - - 531 239,294 - (239,825) - - -
Transactions with non-controlling interest - - - - - - - - - (111,035) (111,035)
In 2017 180,301 1,769 (134) 34,336 11,233 383,036 22,783 - 633,324 - 633,324
See the accompanying notes to the financial statements.
Revaluation reserve Retained earnings
Equity attributable to controlling shareholders
Non-controlling interest
Reserves
Investment reserveCapital Capital reserve
Shares in treasury
Legal reserve Profit retention
10

Copersucar S.A.
Statements of cash flows
Years ended as of March 31, 2017 and 2016
(In thousands of reais)
2017 2016 2017 2016
Cash flow from operating activitiesNet income for the year 256,964 45,131 254,433 32,439
Adjusted by:(65,430) 67,461 (192,426) 231,246 94,466 (165,250) - - (2,286) - - - 62,977 59,088 13,648 11,959
(67,823) 53,541 (65,500) 8,739 (156,948) (325,753) 1,658 331,963
999 27,071 853 461 (19,061) 448 (20,824) 8 (17,768) (5,742) 10,202 5,100 356,384 (387,273) 188,788 (194,921)
(139,738) 638,103 291,176 105,075
Equity in net income of subsidiariesSubsidiary gains with foreign exchange variationChange in brokers fair valueDepreciation and amortizationDeferredInterest and exchange variation on loans and financingsNet value of write-offs of property, plant and equipment and intangible assets Increase in provision for contingenciesEmployee benefitsChange in inventories’ fair values Change in fair value of derivative financial instrumentsGain on interest in associated companies (10,627) (10,882) (10,627) (10,882)
Changes in assets and liabilities
67,196 75,498 168,285 385,680 433,028 (349,472) 29,034 77,458
(326,154) 632,936 (214,623) 349,948 19,763 77,147 (5,549) 105,137 14,248 39,352 1,693 21,146 87,218 1,385,341 4,789 (1,691) 57,862 (101,688) (556) 46
(14,314) (4,767) (12,951) (4,537) (226,822) (1,278,019) (103,711) (1,168,596)
22,530 (9,024) 19,360 (7,694) 9,751 (7,893) (14,718) (11,290)
(30,022) 38,816 12,679 3,636 (217,477) (297,395) (177,140) (255,257)
(8,869) (9,812) - -
Decrease in trade accounts receivableDecrease/(Increase) in operations with related parties(Increase)/decrease in inventoriesDecrease/(Increase) in current taxesDecrease in other accounts receivableIncrease in advance to supplierDecrease/(Increase) in stock exchange operations(Increase) in deposits in court(Decrease) in suppliersIncrease/(Decrease) in social and payroll and employee benefits Increase/(Decrease) in tax and contributions(Decrease)/Increase in other accounts payableInterest paid on loans and financingIncome and social contribution taxes paidDividends receivable - 49,246 10,000 496,636
Net cash flow generated in operating activities 180,047 236,209 187,973 511,809
Cash flows from investment activitiesApplication of funds in investments (252,674) (107,835) (145,139) (46,900) Application of funds in property, plant and equipment (59,978) (166,607) (4,364) (24,874) Application of funds in intangible assets - (4,775) (1) (6)
Net cash (used) in investment activities (312,652) (279,217) (149,504) (71,780)
Cash flows from financing activities
Disposal of shares in treasury 1,642 - 1,642 - Loss with financial instrument – investment hedge (241,521) (28,218) (241,521) (28,218) Dividends paid (308) - (308) - Loans and financing obtained 3,647,155 2,504,501 1,920,429 1,498,451 Payments of loans and financing (2,938,343) (2,564,981) (1,947,425) (1,698,717)
Net cash generated/(used) in financing activities 468,625 (88,698) (267,183) (228,484)
Net increase/decrease in cash and cash equivalents 336,020 (131,706) (228,714) 211,545
Statement of changes in cash and cash equivalentsAt the end of the year 1,264,785 932,854 476,215 704,929 Effect of foreign exchange variation on cash and cash equivalents (4,089) 13,306 - - At the beginning of the year 932,854 1,051,254 704,929 493,384
Net increase/decrease in cash and cash equivalents 336,020 (131,706) (228,714) 211,545
See the accompanying notes to the financial statements.
Consolidated Parent company
11

Copersucar S.A.
Statements of added value
Years ended as of March 31, 2017 and 2016
(In thousands of reais)
2017 2016 2017 2016
RevenueSale of merchandise, products and services 29,208,743 27,352,009 9,182,624 8,953,034 Other income (18,108) 35,989 6,113 1,307 Change in fair value of financial instruments 634,895 (658,739) 53,846 2,144 Estimated allowance for doubtful accounts 94 (329) - -
29,825,624 26,728,930 9,242,583 8,956,485
Inputs acquired from third partiesCost of products, goods, and services sold (28,723,674) (25,682,663) (8,780,696) (8,167,366) Materials, outsourced services and other (263,702) (214,034) (64,503) (55,215) Other (31,702) (33,727) (320) (78)
(29,019,078) (25,930,424) (8,845,519) (8,222,659)
Gross added value 806,546 798,506 397,064 733,826
Depreciation and amortization (62,977) (42,987) (13,648) (11,959)
Added value received as transferEquity in net income of subsidiaries 65,430 (67,461) 192,426 (231,246) Financial income 1,017,307 1,958,221 734,687 806,072 Other 53,976 25,304 48,320 15,741
1,136,713 1,916,064 975,433 590,567
Total added value payable 1,880,282 2,671,583 1,358,849 1,312,434
Distribution of added value (1,880,282) (2,671,583) (1,358,849) (1,312,434)
PersonnelDirect remuneration (130,196) (93,920) (34,193) (30,009) Benefits (74,911) (62,467) (52,129) (33,185) FGTS (8,750) (8,064) (2,968) (2,993)
(213,857) (164,451) (89,290) (66,187)
Taxes, rates and contributionsFederal (62,798) (155,064) (25,818) (117,800) State (22,118) (57,372) (20,422) (56,286) Municipal (9,243) (7,669) (634) (552)
(94,159) (220,104) (46,874) (174,638)
Third parties’ capital remunerationInterest (1,300,555) (2,235,080) (962,648) (1,033,357) Rentals (14,747) (6,817) (5,604) (5,813)
(1,315,302) (2,241,897) (968,252) (1,039,170)
Remuneration of own capital(Income) for the year (254,433) (32,439) (254,433) (32,439) Non-controlling interest (2,531) (12,692) - -
(256,964) (45,131) (254,433) (32,439)
See the accompanying notes to the financial statements.
Consolidated Parent company
12

Copersucar S.A. Financial statements
March 31, 2017
13
Notes to the financial statements
(In thousands of reais)
1 Operations The business purpose of the Company organized in the form of a privately-held corporation, domiciled in Brazil, headquartered and located in São Paulo (SP) and is mainly engaged in: to import, export, manufacture, store, load and unload sugar; for ethanol and by-products in the domestic and international markets; for commercial representation of sugar, ethanol and derivatives; land river, sea logistics; cargo shipments including hazardous and acting as operator of multimodal transport, for provision of technical and consultancy services related to the aforementioned activities; and interest in other entities.
The individual and consolidated financial statements of the Company for the year ended March 31, 2017 comprise the parent company and its subsidiaries.
The fiscal year of the Company and its subsidiaries ends on March 31 every year, except for Copersucar North America, LLC, whose year ends as of December 31 of each year. For the next crop, Copersucar North America’s fiscal year begins to follow the fiscal year from April to March.
2 Company's entities
Entity City/State: - Country 2017 Main activities Direct subsidiaries:
Companhia Auxiliar de Armazéns Gerais São Paulo/SP - Brazil 100.00000%
To sell food products and goods in general on the wholesale market, rent warehouses, provide storage facilities, export sugar and other products of vegetable origin and undertake port operating activities.
Copersucar Armazéns Gerais S.A. São Paulo/SP - Brazil 99.99997%
Wholesale trade of food products and goods in general, retail and wholesale trade and distribution of fuel for automotive or industrial purposes, and rental of warehouses.
Copersucar Trading A.V.V. Orangestad - Aruba 100.00000%
Importing and exporting sugar and ethanol, which are mainly purchased from Cooperativa de Produtores de Cana-de-Açúcar, Açúcar e Álcool do Estado de São Paulo (Cooperative).
Copersucar North America, LLC Franklin/TN - USA 100.00000% Interest in other companies. Indirect subsidiary:
Eco-Energy Global Biofuels LLC Franklin/TN - USA 100.00000%
Operates in an integrated manner in the biofuel supply chain, focusing on trade, logistics and marketing services.
Sugar Express Transportes S.A.
Ribeirão Preto/SP - Brazil 100.00000%
is responsible for the road transport of sugar and ethanol.

Copersucar S.A. Financial statements
March 31, 2017
14
Entity City/State: - Country 2017 Main activities
Associated companies:
Centro de Tecnologia Canavieira S.A. São Paulo/SP - Brazil 16.93150%
Research and development of new technologies to be applied in the agricultural activities, logistics and manufacturing processes of the sugarcane and sugar and alcohol sectors; research and development of sugarcane varieties, especially the genetic improvement of sugarcane; control of diseases and pests, particularly for biological control purposes; and transfer of agricultural, industrial and laboratory technologies.
Uniduto Logística S.A. São Paulo/SP - Brazil 39.07370%
Develops, builds and operates pipelines to move liquids for sell / wholesale trade in domestic and foreign markets, intermodal terminals and port terminals for the export of such liquids; moreover, to participating in other companies whose business purpose is one or more activities listed in the previous items.
Jointly controlled subsidiaries:
Logum Logística S.A. Rio de Janeiro/RJ - Brazil 21.28310%
Implements the construction and operates intermodal and multimodal networks for the transport of ethanol, oil by-products and other biofuels to the domestic and international markets; activities directly or indirectly related to intermodal and multimodal transport of ethanol, oil by-products and other biofuels; participation in projects whose aim is to promote the development of intermodal and multimodal transport of ethanol, oil by-products and other biofuels; imports, exports, acquisition, sells, distributes or leases of all the machinery and equipment related to the aforementioned activities, and exploration and development of opportunities in business related to the installation of optic fiber cables in its rights of way.
Alvean Sugar Intermediação e Agenciamento Ltda. São Paulo/SP - Brazil 50.00000%
Providing agency services and the sell raw and white sugar trading.
Alvean Sugar, S.L. Bilbao - Spain 50.00000% Originating and sell in the global trading raw and white sugar.
In March/17 Copersucar North America acquired, as provided for in the purchase agreement entered into in December /12, the total shares of Eco-Energy Global Biofuels LLC in the USA.
3 Preparation basis
a. Statement of compliance (in relation to IFRS standards and CPC standards)The individual and consolidated financial statements were prepared according to theInternational Financial Reporting Standards (“IFRS”) issued by the International AccountingStandards Board (IASB) and also in accordance with accounting practices adopted in Brazil("BR GAAP”).

Copersucar S.A. Financial statements
March 31, 2017
15
The issue of financial statements was approved by the Executive Board on May 17, 2017.
Details on the Group’s significant accounting policies are shown in Note 5.
All the relevant information on the financial statements, and only these, are being evidenced and are the same as those employed by Company Management.
b. Functional and presentation currencyThe individual and consolidated financial statements are presented in Real, which is thefunctional currency of the all the Company’s entities, except for Copersucar North AmericaLLC and Eco-Energy Global Biofuels LLC, the functional currency of which is the US dollar.All financial information presented in BRL has been rounded to the thousand nearest value inthousand, except otherwise indicated.
c. Use of estimates and judgmentsThe preparation of Company's individual and consolidated financial statements requiresManagement to make judgments and estimates and adopt assumptions that affect the amountspresented for income, expenses, assets and liabilities, including contingent liabilities. However,uncertainty relating to these judgments, assumptions and estimates could lead to results thatrequire a significant adjustment to the book value of certain assets and liabilities in futureperiods.
Estimates and assumptions are reviewed on a continuous basis. Reviews of estimates arerecognized on a prospective basis.
The main accounting estimates, assumptions and judgments are: useful life of fixed assets (note5.h.iv), useful life of intangible assets (note 5.i.iv), inventories (note 9), deferred assets andliabilities and use of tax losses (note 13), investment property (note 15), and provisions forcontingencies (note 22), financial instrument (note 23) and lease (note 32).
d. Measurement of fair valueA number of the Company's accounting policies and disclosures require the determination offair value, for both financial and non-financial assets and liabilities. The Company usesobservable market data as much as possible and fair values are classified on hierarchical basis,according to valuation techniques, as follows:
• Level 1: Prices quoted (not adjusted) in active markets for identical assets and liabilities.
• Level 2: Inputs, except for quoted prices, included in Level 1 which are observable for assets orliabilities, directly (prices) or indirectly (derived from prices).
For this fiscal year, there are no valuations at fair value made by the Company that fall withinLevel 3 defined by CPC 40 (item 27A.c.).
The Company recognizes transfers between fair value hierarchic levels at the end of thefinancial statements year in which changes occurred.
When applicable to fair values, additional information about the assumptions made indetermining is disclosed in the notes specific to that asset or liability.

Copersucar S.A. Financial statements
March 31, 2017
16
4 Measuring basis The individual and consolidated financial statements were prepared based on the historical cost, except for the following material items recognized in the balance sheets:
• Derivative financial instruments measured at fair value;
• Non-derivative financial instruments designated at fair value through profit or loss are measuredat fair value;
• Property, plant and equipment - measured at acquisition and deemed cost; and
• Inventories - calculated at fair value less sales expenses, through marking to market, except forAnhydrous inventory, which is valued under the average acquisition cost, not exceeding the netrealizable value, as mentioned in Note 5 (item g).
5 Significant accounting policies The accounting policies described below have been consistently applied to all the years presented in these individual and consolidated financial statements in accordance with IFRS and the accounting pronouncements issued by the Accounting Pronouncement Committee (CPC), unless otherwise stated.
The accounting policies have also been consistently applied by the Company’s entities.
a. Consolidation basis
(i) Subsidiaries The financial statements of the subsidiaries are included in the consolidated financial statements as from the date they start to be controlled by the Company until the date such control ceases. The accounting policies of the subsidiaries are aligned with the policies adopted by the Company.
The individual financial statements of the parent company, financial information of subsidiaries are recognized under the equity method.
(ii) Investments in jointly-controlled subsidiaries A joint venture is a contractual agreement that joins together two or more parties for the purpose of executing a particular business undertaking which is subject to joint control.
The individual financial statements of the Parent company, financial information from jointly-controlled subsidiaries are recognized under the equity method.
(iii) Investments in associated companies Associated companies are the entities in which the Company has, directly or indirectly, significant influence but not control on financial and operating policies. The significant influence is characterized by the Company holding, directly or indirectly, from 20% to 50% of the voting rights of the other entity.
In the Parent company's individual financial statements, investments in associated companies are accounted for at the equity method and are initially recognized at cost. When the participation of the Company in the losses of an investee, whose shareholders' equity has been

Copersucar S.A. Financial statements
March 31, 2017
17
accounted for, exceeds its ownership interest in the investee recorded at the equity method, the book value of that ownership interest, including long-term investments, is reduced to zero and recognition of additional losses is closed.
(iv) Transactions eliminated in the consolidation Intragroup balances and transactions, and any income or expenses derived from intragroup transactions, are eliminated in the preparation of the consolidated financial statements. Unrealized gains originating from transactions with investees are eliminated against the investment. Unrealized losses are also eliminated, unless the transaction shall provide evidence of asset impairment.
(v) Non-controlling interest (NCI) The Group chose to measure minority interests in acquiree at their proportion in identifiable net assets on acquisition date. Changes to the Company’s interest in a subsidiary that do not result in loss of control are accounted for as transactions of shareholders’ equity.
b. Operating income
(i) Trading of sugar and ethanol Operating income from sale of sugar and ethanol in the normal course of business is measured at the fair value of the consideration received or receivable, net of returns, commercial discounts and bonuses. Operating income is recognized when: (i) risks and benefits more significant related to ownership of the goods have been transferred to the purchaser; (ii) it is probable that the financial economic benefits will flow to the Company; (iii) costs and potential return of goods can be reliably estimated; (iv) there is no continuous involvement with goods sold; and (v) the amount of operating income can be reliably measured. In the event it is probable that discounts will be granted and their amounts can be reliably measured, the discounts are recognized as to deduction from operating income as the related sales are recognized.
(ii) Rendering of services Income (loss) from the provision of storage, logistics and loading of sugar and ethanol are recognized when: (i) the amount of the income can be reliably estimated; (ii) it is likely that the economic benefits related to the transaction will flow to the entity; (iii) the stage of completion of the transaction at the end of the reporting year can be reliably measured, and (iv) the expenses incurred for the transaction and the expenses to complete it can be reliably measured.
c. Financial income and expensesFinancial income substantially comprises income from interest-earning investments, foreignexchange fluctuations of financial items and positive changes in the fair value of financialinstruments used to hedge currency and interest rate risks, as well as gains on the settlement ofthese instruments. Interest income is recognized in profit or loss using the effective interestmethod.
Financial expenses substantially comprise expenses with interest on loans, liability foreignexchange fluctuations of financial items and negative changes in the fair value of financialinstruments used to hedge currency and interest risks, as well as losses on the settlement ofthese instruments. Borrowing costs which are not directly attributable to the acquisition,

Copersucar S.A. Financial statements
March 31, 2017
18
construction, or production of a qualifying asset are accounted in profit or loss using the effective interest rate method.
d. Foreign currency
(i) Foreign currency transactions Transactions in foreign currency are translated into the functional currency of the Company (Real) at the foreign exchange rates on the dates of the transactions. Balances of foreign currency are translated at the foreign exchange rate in force on the date of closing of the financial statements and foreign exchange gains or losses are recognized in financial income (loss).
(ii) Group’s foreign companies For the subsidiaries which the functional currency is the Dollar, assets and liabilities of foreign transactions are translated into Brazilian reais (parent company’s functional currency) at the exchange rate prevailing on presentation date. Income and expenses from foreign transactions are converted into reais at the average exchange rates (selling rate - PTAX) calculated in the year.
For the subsidiaries with Reais as functional currency, foreign currency differences generated in the translation to the currency presentation are recognized in the income (loss) for the year, since the functional currency of the operation abroad is the Real.
Such exchange variations are recognized in earnings or losses in the individual financial statements of the parent company or subsidiary.
For the translation of transactions in US dollar (USD) to the functional currency of the Company (Brazilian real - R$), the following exchange rates were used for the Consolidated and Parent company:
Average annual rate Spot closing rate
2017 2016 2017 2016
R$/USD 3.2983 3.5932 3.1684 3.5589
e. Employee benefits
(i) Defined contribution plans The Company offers to its employees a Private Pension Plan of Defined Contribution, in order to provide to the people the possibility to accumulate funds to ensure a monthly income in the future, allowing the employee to maintain a proper life standard after retirement. The Company’s pension plan is accessible to all the employees and directors, on optional basis.
The employee who opts to join the plan may opt for two types: 1- “Free benefit generator plan (PGBL)” or 2 - “Free benefit generator life (VGBL)”. Pursuant to the approved rules of the plan, the employee may participate through basic or supplementary contributions, and the Company contributes in parity with the basic contributions that the employee makes up to the limit of 6% of the salary of contribution. In addition, the employee may make extraordinary contributions, without payment by the Company.

Copersucar S.A. Financial statements
March 31, 2017
19
(ii) Profit sharing and bonuses The employees’ profit sharing and variable remuneration of the executives are contingent upon the attainment of operating and financial targets. The Company recognizes a liability and an expense allocated to production cost and to general and administrative expenses, when these targets are achieved. (Note 31).
f. Income and social contribution taxesThe current and deferred income tax and social contribution charge is calculated based onenacted tax acts, at the balance sheet date of countries in which the Group's entities operate andgenerate taxable income. Management periodically evaluates the positions taken by the Groupin the calculations of income tax with respect to situations in which applicable tax regulation issubject to interpretations; and establishes provisions when appropriate, on the basis of amountsexpected to be paid to the tax authorities.
Income tax is computed on taxable income at the rate of 15%, plus a 10% surtax for incomeexceeding R$ 240 in the 12-month period, whereas social contribution is computed at the rate of9% on taxable income, recognized on the accrual basis. Also, it may affect the offset of tax losscarryforwards is considered, limited to 30% of annual taxable income.
The income and social contribution tax expense comprises current and deferred taxes onincome. Current taxes and deferred taxes are recognized in income unless items directlyrecognized in Shareholders' equity or in Other comprehensive income.
Current tax assets and liabilities are offset only if certain criteria are met.
(i) Current tax Current taxes are the taxes payable or receivable on the taxable income or tax loss for the year and any adjustments to taxes payable in relation to prior years at aforementioned rates.
(ii) Deferred tax Deferred tax is calculated on tax losses and negative basis of income social contribution, as well as temporary losses between calculation bases on assets and liabilities and book values of financial statements.
A deferred income and social contribution tax asset is recognized to the extent that it is probable that future taxable income will be available against which the unused tax losses and credits can be utilized.
Deferred income and social contribution tax assets are reviewed at each preparation date of financial statements and reduced when their realization is no longer probable.
(iii) Tax exposures When determining current and deferred income tax, the Company takes into consideration the impact of uncertainties related to tax positions taken. The Company believes that the provision for income tax recorded in liabilities is adequate for all outstanding tax years, based on its evaluation of several factors, including interpretations of tax laws and past experience. This evaluation is based on estimates and assumptions and may involve several judgments on future events. New information may be provided, making the Company change its judgment on the

Copersucar S.A. Financial statements
March 31, 2017
20
existing provision adequacy and as a result, affect the income tax expense for the year in which it is made.
g. InventoriesThe Company’s inventories are marked-to-market less costs to sell, except for Anhydrousinventory which is valued under the average acquisition cost, not exceeding the net realizablevalue. The net realizable value is the sales price estimated for the normal course of thebusinesses, less estimated costs for the sale. In determining fair value, the Company uses as areference the indices disclosed by public sources and related to the products and active marketswhere it operates. Changes in the fair value of these inventories are recognized in the income(loss) for the year.
h. Property, plant and equipment
(i) Recognition and measurement Property, plant and equipment items are stated at historical acquisition or construction cost, net of depreciation and accumulated impairment losses, when applicable. Software acquired as an integral part of the functionalities of an item of equipment is capitalized as part of the equipment.
The cost of property, plant and equipment includes expenditures that are directly attributable to the acquisition of the asset. The cost of assets built includes: materials and direct labor; any other costs attributable to bringing the assets to the location and condition requires for them to operate, costs for dismantling and restoration of the site where they are located; and borrowing costs on qualifiable assets.
When parts of a property, plant and equipment item have different useful lives, they are accounted for as separate items (major components) of PP&E.
Gains and losses on disposal of a property, plant and equipment item are determined by comparing the proceeds from disposal with the book value of Property, plant and equipment and are recognized net within "Other operating income/expenses" in income (loss).
(ii) Reclassification for investment property When the use of a property changes from owner-occupied to investment property, the property is remeasured to fair value and reclassified as an investment property. Any increase resulting from this remeasurement is recognized in income (loss) to the extent the gain reverses earlier impairment loss of this property, which cannot exceed the book value initially recognized (net of depreciation). If there is a remaining increase, the same is recognized in revaluation reserve, as part of other comprehensive income. Any decrease is recognized in income (loss).
(iii) Subsequent costs The replacement cost of a component of property, plant and equipment is recognized in the book value of the item when it is probable that the future economic benefits embodied in the component will flow to the Company and its cost can be reliably measured. Book value of the component that has been replaced by another component and maintenance cost are accounted for in the incurred statement of income for the year.

Copersucar S.A. Financial statements
March 31, 2017
21
(iv) Depreciation Fixed asset items are depreciated from the date they are available for use, or, in the case of assets constructed by the Company, as of the date the construction is concluded and the asset is available for use. The depreciation is recognized in statement of income under the straight-line method regarding estimated useful lives.
Depreciation is calculated over the depreciable amount, which is the cost of an asset, or other amount substituted for cost, less its residual value.
The annual weighted average rates for the current and comparative year are as follow:
Annual weighted average rate: 2017 and 2016
Consolidated Parent
company
Constructions and improvements 1.90% 1.90%Machinery and equipment 3.77% 2.86%Data processing equipment 19.52% 19.52%Furniture and fixtures 6.94% 6.95%Vehicles 8.59% 8.50%Leasehold improvements 4.92% -
The depreciation methods, useful lives and residual values are reviewed at each reporting date, and adjusted if appropriate.
i. Intangible assets and goodwill
(i) Intangible assets with defined useful life Intangible assets acquired by the Company with finite useful lives are measured at cost, less accumulated amortization and accumulated impairment losses, when applicable.
(ii) Intangible assets with undefined useful life
Goodwill The goodwill calculated on the acquisition of Eco-Energy Global Biofuels, LLC shares is supported by expected future earnings. The Company assesses annually and whenever there are indications of the likelihood of recovering the goodwill on these investments, to this end employing practices applied in the market regarding the subsidiary's cash flow.
(iii) Subsequent expenses Subsequent expenses are capitalized only when they increase the future economic benefits embodied in the specific asset to which they relate. All other expenditures, including expenditures on internally-generated goodwill and trademarks, are recognized in profit or loss as incurred. Book value of the intangible assets that has been replaced by another component is accounted for in the statement of income for the year in which replacement occurred. Daily costs of maintenance are recognized in income (loss) as incurred.
(iv) Amortization Amortization is calculated over the cost of the asset, or other amount substituted for cost, less its residual value.

Copersucar S.A. Financial statements
March 31, 2017
22
Amortization is recognized in profit or loss, under “Administrative expenses” caption, on a straight-line basis over the estimated useful lives of the intangible assets, except goodwill, as of the date they are available for use. Software estimated useful life for current and comparative years is 5 years.
j. Investment propertyInvestment property is property held to earn rentals or for capital appreciation or both, but notfor sale in the ordinary course of business, or use in the production or supply of products orservices or for administrative purposes. Investment property is initially measured at cost and,subsequently, when significant, at fair value, and changes to fair value are recognized in theincome (loss).
Cost includes expenses directly attributable to the acquisition of an investment property. Thecost of investment property build by the owner includes the material used, direct labor, or anyother cost directly attributable to bringing the investment property to a working condition for itsintended purpose, and the capitalized interest on borrowings.
k. Financial instruments
(i) Non-derivative financial assets The Company initially recognizes the loans and receivables on the date that they are originated. All other financial assets (including assets designated at fair value through profit or loss) are initially recognized on the date of the negotiation under which the Company becomes a party to the contractual provisions of the instrument.
The non-derivative financial assets of the Company are financial assets measured at fair value through profit or loss and loans and receivables.
Financial assets measured at fair value through profit or loss Financial assets are stated at fair value through profit or loss if the Company manages these investments and makes decisions on investment and redemption based on fair value according to the risk management and strategy of investment documented by the Company. Changes in fair value and transaction costs, after initial recognition, are recorded in income (loss) for the year.
Assets measured at fair value through profit or loss are comprised by: inventories (except for anhydrous compounds), stock exchange derivatives and unrealized financial instruments.
Loans and receivables Loans and receivables are financial assets with fixed or determinable payments, but not quoted on any active market. Such assets are initially recognized at fair value and after the initial recognition, loans and receivables are measured at amortized cost through the effective interest method, less any impairment loss.
Loans and receivables comprise trade accounts receivable, other receivables, related parties and advance to supplier.
Copersucar S.A. Financial statements
March 31, 2017
23
(ii) Non-derivative financial liabilities The Company recognizes subordinated liabilities on the date that they are originated. All other financial liabilities (including liabilities designated at fair value through profit or loss) are recognized initially on the negotiation date on which the Company becomes a party to the contractual provisions of the instrument. The Company fails to recognize a financial liability when its contractual obligations are discharged or canceled or expired.
Such financial liabilities are initially recognized at fair value. After their initial recognition, these financial liabilities are measured at amortized cost using the effective interest rate method.
Other non-derivative financial liabilities comprise loans and financing, suppliers, advance from customers and other accounts payable.
(iii) Capital Common and preferred shares are classified as shareholders' equity.
The minimum mandatory dividends, as established in the By-laws, are recognized as liabilities. Additional dividends proposed should be approved by the Board of Directors of the Company and recognized in the Shareholders' equity under this caption.
(iv) Derivative financial instruments The Company holds derivative financial instruments: futures, swaps and NDFs (Non-Deliverable Forward) for hedging interest rate, foreign exchange and commodity price risks.
The purpose of the transactions involving derivatives is always related to the Company's operations and the reduction of its exposure to currency and market risks, duly identified by the policies and guidelines established. The results obtained from such operations are consistent with the policies and strategies defined by Company's management and all the gains or losses resulting from derivative financial instruments are recognized at fair value.
Gains/losses related to unrealized derivative financial instruments arising from commodity price hedging and foreign exchange variation are recognized in gross profit. Derivative effects related to foreign exchange and interest risks are recognized in financial income (loss).
Derivatives are initially recognized at their fair value, while the attributable transaction costs are recognized in profit or loss when incurred. After the initial recognition, derivatives are measured at fair value and changes accounted profit or loss for the year.
(v) Net investment hedge abroad The Company uses hedge accounting for foreign currency differences between the operation’s functional currency abroad of the investee and functional currency of the parent company (Brazilian Real).
Within the conditions for hedge effectiveness, exchange differences arising from the translation of financial liability designated as hedge, of a net investment in a foreign operation are recognized in other comprehensive income and accumulated as revaluation reserve in shareholders’ equity.

Copersucar S.A. Financial statements
March 31, 2017
24
l. ImpairmentThe Company reviews on each reporting date, in order to calculate if there is an indication ofimpairment loss, and when there is objective evidence that a loss event has occurred after theinitial recognition of the asset, and that such loss event had a negative effect on the projectedfuture cash flows of that asset that can be reliably estimated. When it is not possible to estimatethe individual recoverable amount of an asset, the Company calculates the recoverable amountof the cash generating unit to which the asset belongs.
When assessing impairment on an aggregate basis the Company makes use of historical trendsof probability of default, the recovery term and the amounts of losses incurred, adjusted toreflect the Management's judgment regarding assumptions if the current economic and creditconditions are such that the actual losses will probably be higher or lower than those suggestedby historical trends.
Provisions for estimated losses on receivables from the receivable portfolio are recognized inthe income statement for the year under “Sales expenses" as an Estimated Provision forDoubtful Accounts (PECLD) in each year of recoverable amount valuation, in accordance withIAS 39/CPC 38 - “Financial Instruments: Recognition and Measurement.”
The recoverable value of an asset or cash-generating unit is the greater of its value in use and itsfair value less sales expenses. In assessing value in use, the estimated future cash flows arediscounted to their present value using a pre-tax discount rate that reflects current marketconditions as to the recoverability year of capital and the risks specific to the asset or CGU(Cash Generating Unit).
The Company's corporate assets do not generate separate cash inflows. If there is indication thata corporate asset is impaired, the recoverable value is determined for the CGU or group ofCGUs to which the corporate asset belongs in a reasonable and consistent manner.
An impairment loss is recognized when the book value of an asset or its CGU exceeds itsrecoverable value. Impairment losses are recorded in the income (loss) for the year. Impairmentlosses recognized for CGUs are initially allocated to reduce the book value of any goodwillattributed to the CGUs and then, if there was a remaining loss, to reduce the book value of theother assets within the CGU or group of CGUS on a pro-rata basis.
On March 31, 2017 and 2016, the Company did not identify indications that the value of theseassets is lower than the realizable value.
m. ProvisionsA provision is set up when the Company has a legal or constructive obligation as a result of apast event, which can be reliably estimated, and it is probable that an outflow of funds will berequired to settle the obligation.
n. Leases
(i) Determining whether an agreement contains a lease At the beginning of the agreement, the Group establishes if it is or contains a leasing. At the beginning or upon revaluation if an agreement contains a leasing, the Group separates the

Copersucar S.A. Financial statements
March 31, 2017
25
payments and other considerations required by the agreement related to the leasing from those related to other elements of the agreement based on the fair value of each element. If the Group concludes, for a financial lease, that it is not possible to separate the payments on reliable basis, then the assets and liabilities are recognized for an amount equal to the fair value of the assets; subsequently, the liabilities are reduced when the payments are made and the financial cost associated to the liabilities is recognized using the incremental funding rate of the Group.
(ii) Leased assets Assets maintained as lease by the Company and that substantially transfer to the Company all ownership risks and benefits are classified as financial lease. Upon initial recognition, the leased asset is measured at an amount equal to the lower of its fair value and the present value of the minimum lease payments.
Assets held under other leases are classified as operating leases and are not recognized in the Group's balance sheet.
(iii) Lease payments The payments made under operating leases are recognized in the income statement on the straight-line basis, in accordance with the effective term of the lease. Lease incentives received, when applicable, are recognized as an integral part of the total lease expenses over the effective term of the lease.
o. Segment informationAn operating segment is a component of the Company which engages in business activitiesfrom which it may earn income and incur expenses. The operating segments reflect how theCompany’s management reviews the financial information for decision-making. Managementdefined the Group's operating segments based on reports employed to make strategic decisionsas follow: Trading of sugar and ethanol and rendering of services.
p. Statements of added valueThe Company prepared individual and consolidated statements of added value in accordancewith the rules of technical pronouncement CPC 09 - Statement of Added Value, which arepresented as an integral part of the financial statements under accounting practices adopted inBrazil applicable to publicly-held companies, whereas under IFRS they represent supplementaryfinancial information.
q. New standards and interpretations not yet adoptedThe following new standards and interpretations were issued by the IASB but are not yeteffective for the year ended March 31, 2017. The early adoption of standards, althoughencouraged by the IASB, is not allowed in Brazil by the Accounting PronouncementCommittee (CPC):
• IFRS 9 - Financial instruments. It covers the classification, measuring and the recognition offinancial assets and liabilities. The full version of IFRS 9 was published in July 2014, effectiveas of January 1, 2018. Management is evaluating the full impact of its adoption.
• IFRS 15 - Income from contracts with clients. This new standard provides the principles that anentity applies to determine the measurement of revenue and when will be recognized. Thestandard will become effective as of January 1, 2018 and supersedes IAS 11 - "Construction

Copersucar S.A. Financial statements
March 31, 2017
26
Contracts” and IAS 18 - "Income" and their related interpretations. Management is evaluating the full impact of its adoption.
• IFRS 16 - Leases. IFRS 16 requires that an entity should recognize that any lease in which theGroup is a lessee should be stated in the balance sheet. The new standard is applicablebeginning on or after January 1, 2019 and replaces the IAS 17 - Leases. Management isevaluating the full impact of its adoption.
There are no IFRS standards or IFRIC interpretations other than the aforementioned, that arenot yet effective and that are expected to have a significant impact on the Company.
The Accounting Pronouncements Committee has not yet issued any accounting pronouncementor amendments in current pronouncements corresponding to all new IFRSs.
6 Operating segments Management defined the Group's operating segments based on reports employed to make strategic decisions as follow: Trading of sugar and ethanol and rendering of services.
• Trading of sugar and ethanol - purchase and sale of raw, white sugar, anhydrous ethanol andhydrous ethanol in domestic and foreign market.
• Rendering of services - Comprises the results from the provision of storage, logistics servicesand loading of sugar and ethanol.
The selected information on results by segment, measured based on the same accounting practices used in the preparation of the consolidated information, are as follows:
2017 2016
Sugar/Ethanol Services Total Sugar/Ethanol Services Total
Net revenue (a) 28,465,713 439,075 28,904,788 25,313,634 351,633 25,665,267Cost of sales (27,846,288) (202,170) (28,048,458) (24,657,601) (179,034) (24,836,635)
Gross margin 619,425 236,905 856,330 656,033 172,599 828,632
(a) The amounts shown as net revenue include the Income from unrealized derivative financial instruments, separately disclosed in the statements of income.
Consolidated net operating income by geographic area is as follows:
Region/Country 2017 2016
United States 12,920,756 12,123,857Brazil 8,363,968 7,911,580Switzerland 3,581,783 3,366,022United Arab Emirates 1,436,172 1,087,352Canada 969,562 981,488Seychelles Islands 834,262 618,020Japan 79,941 23,090China 50,740 19,973Spain 13,744 -Uruguay 9,113 -South Korea 8,725 76,762Great Britain 1,127 72,994

Copersucar S.A. Financial statements
March 31, 2017
27
Region/Country 2017 2016
Colombia - 433Philippines - 19,989Nigeria - 9,332Netherlands - 13,105Sweden - 9
Total 28,269,893 26,324,006
7 Cash and cash equivalents
Consolidated Parent company
2017 2016 2017 2016
Cash 27 32 26 16Bank - Checking account 768,808 228,199 6,042 6,746Investment Fund 390,579 - 390,579 -Interest earning bank deposits 105,371 704,623 79,568 698,167
Total 1,264,785 932,854 476,215 704,929
The balances of investment funds are remunerated by quotas, equivalent to 101% of CDI (average of 12 months).
The balances of interest earning bank deposits are represented by fixed-income securities, which substantially yield of 99% (Debentures) of the variation of CDI-CETIP - Interbank Deposit Certificate (101% as of March 31, 2016), have daily liquidity and can be redeemed immediately, without a fine or loss of yield.
For more information on the Company's exposure to interest, foreign currency and liquidity risks, see Note 23.
8 Trade accounts receivable
Note Consolidated Parent company
2017 2016 2017 2016
212,249 370,134 244,497 385,395450,910 376,479 - -
Domestic market Foreign market Related parties 25 31,131 27,475 17,637 45,295
Total 694,290 774,088 262,134 430,690
The Company's exposure to credit risks, as well as balances average age, currency risk and impairment losses related to trade accounts receivable are disclosed in note 23.
Trade accounts receivable are classified as receivables stated at amortized cost. The Company assessed the adjustment to present value, with the CDI - Interbank Deposit Certificate market

Copersucar S.A. Financial statements
March 31, 2017
28
rate, of its balances of trade accounts receivable as of March 31, 2017 and 2016, and concluded that the amounts substantially match the book values presented on the balance sheet.
9 Inventories
Consolidated Parent company
2017 2016 2017 2016
Sugar 1,341,107 1,270,309 599,421 569,963Ethanol 895,598 1,007,047 505,580 511,116Gasoline 578 - - -RIN / LCFS 26,762 38,071 - -Natural gas 12,216 4,298 - -Stocks, packaging, and others 12,942 7,698 8,106 6,193
Total 2,289,203 2,327,423 1,113,107 1,087,272
An advance is given to customers for sugar inventories meant for the foreign market under liabilities (prepayment) amounting to R$ 1,310,656 as of March 31, 2017 and 873,163 as of March 31, 2016, as described in Note 21, of the jointly-controlled subsidiary Alvean Sugar S.L.
The volumes of inventory of Anhydrous Ethanol of the Company on March 31, 2017 are compliant with resolution ANP No. 67 of December 2011 (art.10), and are stated at average acquisition cost, which does not exceed net realizable value.
The inventories of tradable products - sugar, ethanol (except for anhydrous), gasoline (and gasoline by-products), RINs and LCFS (Renewable Identification Numbers and e Low Carbon Fuel Standard) are valued at fair value based on quoted market prices (mark to market) less costs to sell. On a monthly basis, the acquisition cost, without including freight and storage expenses and recoverable taxes, is compared with the equivalent quoted market price as of the reporting date. Reference prices are available to the public and obtained from active markets, as follows:
• Prices of raw sugar contracts negotiated on the Intercontinental Exchange (ICE) (sugar contract#11) / NYBOT;
• Prices of domestic sugar contracts disclosed by the Center for Advanced Studies on AppliedEconomics (CEPEA) of the Luiz de Queiroz School of Agriculture from the University of SãoPaulo (USP);
• Prices of anhydrous and hydrated ethanol disclosed by the Center for Advanced Studies onApplied Economics (CEPEA) of the Luiz de Queiroz School of Agriculture from the Universityof São Paulo (USP);
• Prices of anhydrous ethanol over-the-counter contracts, based on Ethanol (Platts) T2 FOBRotterdam, disclosed by CME Group;
• Prices of anhydrous ethanol over-the-counter contracts, based on Chicago Ethanol (Platts) SwapFutures, disclosed by CME Group;

Copersucar S.A. Financial statements
March 31, 2017
29
• Prices of Renewable Identification Numbers (RINs)/ Low Carbon Fuel Standards (LCFs), withdifferent expiry dates, as published by the Oil Price Information Service (OPIS)/ Heating OilBio Reference;
• Prices of gasoline and its by-products (C5, CBOB, Agreement 93 and NC4), as published by theOil Price Information Service (OPIS) (C5 and NC4) and by Platts - CME Group (CBOB andAgreement 93); and
• Price of natural gas - Nymex Henry Hub gas futures, disclose by the CME Group.
The adjustment amount is accounted for under "Selling costs" on the income statement for theyear.
The reference prices used to determine the fair value of inventories each year are as follows:
Commodity Market index Unit 2017 2016
Raw sugar Sugar #11 (ICE/NYBOT) ¢lb 16.76 15.35White sugar Crystal Sugar (CEPEA/ESALQ) R$/ton 1,480.00 1,532.80Anhydrous ethanol Anhydrous ethanol (CEPEA/ESALQ) R$/m3 1,697.60 2,113.70Hydrous ethanol Hydrous ethanol (CEPEA/ESALQ) R$/m3 1,526.40 1,906.60Anhydrous ethanol (Europe) Ethanol (Platts) T2 FOB Rotterdam (CME Group) EUR/m3 525.00 454.00Anhydrous ethanol (USA) Ethanol (Platts) Chicago Platts (CME Group) USD/GL 1.69 1.55Gasoline OPIS/ Platts USD/GL 1.42 -RIN OPIS / Heating Oil Reference US$/unit 0.53 0.82Natural gas Nymex henry hub gas futures USD/mmbtu 3.01 1.80
10 Current taxes
Consolidated Parent company
2017 2016 2017 2016
ICMS 127,316 92,742 126,934 92,473IPI 9,265 9,265 9,265 9,265PIS 22,173 16,285 16,155 10,899COFINS 54,767 49,540 54,564 49,540IRPJ 48,343 121,683 48,102 94,893CSLL 14,812 6,924 14,725 7,126
Total 276,676 296,439 269,745 264,196
11 Advances to suppliers
Note Consolidated Parent company
2017 2016 2017 2016
Related parties 25 271,196 213,758 - 2Other suppliers 52,096 232,804 11,904 16,691
Total 323,292 446,562 11,904 16,693
They correspond to advances for the future delivery of sugar regarding the 2017/2018 crop.

Copersucar S.A. Financial statements
March 31, 2017
30
12 Brokers It refers to the balances receivable and payable of deposited amounts related to the margin and premiums and adjustments paid or received in transactions with derivatives not settled on the Stock Exchange.
13 Deferred assets and liabilities Deferred assets and liabilities were allocated as follows:
Consolidated Assets Liabilities Net
2017 2016 2017 2016 2017 2016
Intangible assets 14,974 14,974 - - 14,974 14,974 Deferred foreign exchange rate 10,921 42,307 - - 10,921 42,307 Provisions 33,056 14,242 - 15,827 33,056 30,069 Adjustment to fair value 56,763 - (78,279) - (21,516) - Depreciation - - (47,207) (52,650) (47,207) (52,650) Tax loss carryforwards 195,746 254,194 - (4,696) 195,746 249,498 Fair value of inventories - (70,008) (6,155) (375) (6,155) (70,383) Derivatives 21,562 12,645 - (52,657) 21,562 (40,012) Deemed cost - - (6,554) (6,827) (6,554) (6,827) Investment hedge abroad 78,241 143,472 (1,410) 44 76,831 143,516 Other 39,477 3 (13,017) (13,515) 26,460 (13,512)
Total 450,740 411,829 (152,622) (114,849) 298,118 296,980
Parent company Assets Liabilities Net
2017 2016 2017 2016 2017 2016
Intangible assets 14,974 14,974 - - 14,974 14,974 Deferred foreign exchange rate 12,193 42,160 - - 12,193 42,160 Provisions 11,747 8,657 - - 11,747 8,657 Adjustment to fair value 56,763 - (78,247) - (21,484) - Tax loss carryforwards 192,494 246,590 - (4,696) 192,494 241,894 Fair value of inventories - (70,008) (5,821) - (5,821) (70,008)Derivatives 19,587 12,645 - (52,657) 19,587 (40,012)Investment hedge abroad 78,241 143,472 - - 78,241 143,472 Other 39,478 3 - - 39,478 3
Total 425,477 398,493 (84,068) (57,353) 341,409 341,140
Changes in temporary differences during the year:
Consolidated Balance at 2015
Recognized in income
Recognized in other
comprehensive income
Balance at 2016
Recognized in income (loss)
Recognized in other
comprehensive income
Balance at 2017
Intangible assets 14,974 - - 14,974 - - 14,974 Deferred foreign exchange rate 8,379 33,928 - 42,307 (31,386) - 10,921 Provisions 18,747 11,322 - 30,069 2,987 - 33,056 Adjustment to fair value - - - - (21,516) - (21,516) Depreciation (8,798) (43,852) - (52,650) 5,443 - (47,207) Tax loss carryforwards 198,789 50,709 - 249,498 (53,752) - 195,746 Fair value of inventories (3,735) (66,648) - (70,383) 64,228 - (6,155) Derivatives (10,394) (29,618) - (40,012) 61,574 - 21,562 Deemed cost (7,247) 420 - (6,827) 273 - (6,554) Investment hedge abroad 88,586 - 54,930 143,516 - (66,685) 76,831 Other (3,710) (9,802) - (13,512) 39,972 - 26,460
Total 295,591 (53,541) 54,930 296,980 67,823 (66,685) 298,118

Copersucar S.A. Financial statements
March 31, 2017
31
Parent company Balance at 2015
Recognized in income
Recognized in other
comprehensive income
Balance at 2016
Recognized in income
(loss)
Recognized in other
comprehensive income
Balance at 2017
Intangible assets 14,974 - - 14,974 - - 14,974 Deferred foreign exchange rate 8,655 33,505 - 42,160 (29,967) - 12,193 Provisions 11,068 (2,411) - 8,657 3,090 - 11,747 Adjustment to fair value - - - - (21,484) - (21,484) Tax loss carryforwards 185,839 56,055 - 241,894 (49,399) - 192,495 Fair value of inventories (3,735) (66,273) - (70,008) 64,187 - (5,821) Derivatives (10,394) (29,618) - (40,012) 59,599 - 19,587 Investment hedge abroad 88,586 - 54,886 143,472 - (65,231) 78,241 Other - 3 - 3 39,474 - 39,477
Total 294,993 (8,739) 54,886 341,140 65,500 (65,231) 341,409
Deferred assets were recognized, since Management analyzed its estimates of future earnings and considered it probable that future taxable earnings against which these expenses can be charged will be available.
14 Investments As of March 31, 2017, Company recorded a gain of R$ 192,426 in the Parent company and R$ 65,430 in the consolidated as of March 31, 2016 (loss of R$ 231,246 in the Parent company and R$ 67,461 in the consolidated as of March 31, 2016) arising from equity in the earnings of its associated companies, subsidiaries and joint ventures in the individual financial statements.
The chart above presents a summary of the equity income of subsidiaries, associated companies and joint ventures.

Copersucar S.A. Financial statements
March 31, 2017
32
Interest % Number of shares Current assets Non-current
assets Total assetsCurrent
liabilitiesNon-current
liabilities Total liabilitiesShareholders’
equity Income Other income (losses) Income or loss Equity in net income of
subsidiaries
2017 Parent company ConsolidatedCompanhia Auxiliar de Armazéns Gerais (a) 100.00000 2,019,843 77,932 310,082 388,014 87,655 128,187 215,842 172,172 201,684 (146,412) 55,272 55,272 -Copersucar Armazéns Gerais (a) 99.99997 3,512,925 9,277 8,533 17,810 1,748 70 1,818 15,992 19,862 (16,045) 3,817 3,817 -Sugar Express Transportes S.A. (a) 99.99000 49,995 - - - - - - - 8,260 (8,102) 158 158 -Copersucar Trading A.V.V. (a) 100.00000 24,253,702 2,314,500 34,337 2,348,837 1,592,488 516,449 2,108,937 239,900 8,071,764 (8,008,354) 63,410 63,410 -Copersucar North America LLC (a) 100.00000 100 1,027,431 539,417 1,566,848 648,388 760,972 1,409,360 157,488 13,391,299 (13,386,373) 4,926 4,926 -CTC-Centro de Tecnologia Canavieira S.A. (c) 16.93155 135,769 326,970 485,988 812,958 84,859 186,589 271,448 541,510 173,472 (160,941) 12,531 1,966 1,966Uniduto Logística S.A.) 39.07370 207,819,638 1,298 139,744 141,042 62 - 62 140,980 58 (314) (256) (110) (110)Logum Logística S.A. (b) 21.28315 1,822,713,392 384,024 2,003,888 2,387,912 1,721,434 - 1,721,434 666,478 232,653 (409,406) (176,753) (38,597) (38,597)Alvean Sugar Intermediação e Agenciamento Ltda. (b) 50.00000 100,000 7,558 633 8,191 4,158 12 4,170 4,021 16,829 (14,841) 1,988 994 994Alvean Sugar, S.L. (b) 50.00000 764,020 4,171,905 37,479 4,209,384 2,735,186 59,240 2,794,426 1,414,958 16,060,298 (15,859,117) 201,181 100,590 100,590Richmond Terminal, VA (b) 50.00000 - 1,952 9,290 11,242 200 - 200 11,042 1,174 - 1,174 - 587
192,426 65,430
2016 Companhia Auxiliar de Armazéns Gerais (a) 99.99995 2,019,842 23,965 318,801 342,766 102,392 103,597 205,989 136,777 182,392 (148,842) 33,550 33,550 -Copersucar Armazéns Gerais (a) 99.99997 3,512,925 2,874 11,931 14,805 2,630 - 2,630 12,175 12,084 (12,910) (826) (826) -Sugar Express Transportes S.A. (a) 99.99000 49,995 9,413 2,417 11,830 1,193 13,229 14,422 (2,592) 13,744 (14,365) (621) (621) -Copersucar International N.V. (a) 100.00000 24,253,702 - - - - - - - - (228,675) (228,675) (228,675) -Copersucar Trading A.V.V. (a) 100.00000 24,253,702 1,719,958 655 1,720,613 1,544,123 - 1,544,123 176,490 7,161,002 (7,144,502) 16,500 16,500 -Copersucar North America LLC (a) 100.00000 100 1,055,590 566,545 1,622,135 625,746 717,128 1,342,874 279,261 12,371,482 (12,354,108) 17,374 17,374 -CTC-Centro de Tecnologia Canavieira S.A. (c) 18.51160 132,938 347,339 348,622 695,961 63,682 201,438 265,120 430,841 144,342 (141,319) 3,023 566 566Uniduto Logística S.A.) 39.0737 118,214,502 2,615 82,465 85,080 3,068 - 3,068 82,012 9 (305) (296) (116) (116)Logum Logística S.A. (b) 22.65000 940,615,490 533,903 1,971,148 2,505,051 2,236,615 - 2,236,615 268,436 246,782 (480,930) (234,148) (46,830) (46,830)Alvean Sugar Intermediação e Agenciamento Ltda. (b) 50.00000 100,000 3,502 707 4,209 2,171 6 2,177 2,032 16,089 (14,511) 1,578 789 789Alvean Sugar, S.L. (b) 50.00000 764,020 4,184,505 87,456 4,271,961 2,812,560 79,847 2,892,407 1,379,554 13,881,390 (13,927,304) (45,914) (22,957) (22,957)Copa Shipping (b) 50.00000 25,000 - - - - - - - 1,200 - 1,200 - 600Richmond Terminal, VA (b) 50.00000 - 1,605 11,225 12,830 733 - 733 12,097 974 - 974 - 487
(231,246) (67,461)
(a) Subsidiary
(b) Joint control
(c) Associated company

Copersucar S.A. Financial statements
March 31, 2017
33
The table below presents the breakdown of investments:
Consolidated Parent company
2017 2016 2017 2016
Copersucar Armazéns Gerais S.A. - - 15,991 12,175 Companhia Auxiliar de Armazéns Gerais - - 172,172 136,776 Logum Logistica S.A. 131,761 53,535 131,761 53,535 Uniduto Logistica S.A. 59,614 37,851 59,614 37,851 CTC - Centro de Tecnologia Canavieira S.A. 93,298 77,763 93,298 77,763 Copersucar North América LLC - - 157,486 170,915Copersucar Trading A.V.V. - - 239,900 176,490Alvean Sugar Intermediação e Agenciamento Ltda. 2,010 1,016 2,010 1,016Alvean Sugar, S.L. 707,480 689,780 707,480 689,780
994,163 859,945 1,579,712 1,356,301
Other unconsolidated investments - valued at fair value:
Other investments 8,970 7,191 133 133
8,970 7,191 133 133
Total investments 1,003,133 867,136 1,579,845 1,356,434
Subsidiary’s uncovered liability: Sugar Express Transporte S.A. - - - (2,593)
The investee Centro de Tecnologia Canavieira S.A., in a Board of Directors’ Meeting held on December 7, 2016, decided and approved capital increase of R$ 98,802 through issuance of 41,869 new common shares. The share of Copersucar S.A. went from 17.6751% to 16.8510%, generating gains of R$ 10,145 recorded under caption “other income”. In February 2017, the remaining shares were subscribed and ownership interest became 16.9315% on March 31, 2017.
15 Investment property
Parent company Land Constructions and
improvementsAssets under construction Total
Cost Balance at 2016 15,527 58,817 26 74,370Transfers - 2,060 - 2,060
Balance at 2017 15,527 60,877 26 76,430
Depreciation Balance at 2016 - (4,128) - (4,128)Depreciation for the year - (1,559) - (1,559)
Balance at 2017 - (5,687) - (5,687)
Net book value In 2016 15,527 54,689 26 70,242
In 2017 15,527 55,190 26 70,743

Copersucar S.A. Financial statements
March 31, 2017
34
The Parent company Copersucar S.A. has a warehouse and a tanking park which are held as investment properties through a lease to the related party Copersucar Armazéns Gerais. These leases’ periods vary from two to five years, respectively. Subsequent refurbishments may occur if agreed upon between the parties. No contingent rent is charged.
The fair value estimate of this asset does not differ from the cost of acquisition.
16 Property, plant and equipment
Consolidated Land Constructions and
improvementsMachinery and
equipmentData processing
equipmentFurniture
and fixtures Vehicles Products
GuaranteeLeasehold
improvements
Property, plant and equipment
under construction Total
Cost Balance at 2016 26,275 76,083 390,476 2,596 11,353 24,055 1,459 262,773 152,819 947,889Foreign exchange variation (1,179) (3,828) (23,238) - (917) (2,562) - (5,246) (2,321) (39,291) Additions - - 1,515 241 108 3,645 - 18 54,452 59,979 Disposals - 137 (48) (3) (53) (652) - - (452) (1,071)Transfers - 24,940 84,852 150 120 - - 42,230 (156,918) (4,626)
Balance at 2017 25,096 97,332 453,557 2,984 10,611 24,486 1,459 299,775 47,580 962,880
Depreciation Balance at 2016 - (7,582) (92,889) (1,798) (4,458) (6,501) - (43,365) - (156,593) Foreign exchange variation - 478 3,268 - 377 737 - 389 - 5,249 Depreciation for the year - (4,611) (26,501) (181) (1,545) (2,758) - (13,063) - (48,659) Disposals - (137) (322) 2 29 235 - - - (193)
Balance at 2017 - (11,852) (116,444) (1,977) (5,597) (8,287) - (56,039) - (200,196)
Net book value In 2016 26,275 68,501 297,587 798 6,895 17,554 1,459 219,408 152,819 791,296
In 2017 25,096 85,480 337,113 1,007 5,014 16,199 1,459 243,736 47,580 762,684

Copersucar S.A. Financial statements
March 31, 2017
35
Parent company Machinery and
equipmentData processing
equipment Furniture and fixtures Vehicles
Property, plant and equipment under
construction Total
Cost Balance at 2016 103,001 2,293 2,769 1,691 6,510 116,264 Additions 4 190 9 449 3,712 4,364Disposals - (3) (53) (586) (452) (1,094)Transfers 963 - - - (7,389) (6,426)
Balance at 2017 103,968 2,480 2,725 1,554 2,381 113,108
Depreciation Balance at 2016 (7,350) (1,606) (1,298) (347) - (10,601) Depreciation for the year (4,778) (113) (199) (135) - (5,225) Disposals - 2 29 208 - 239
Balance at 2017 (12,128) (1,717) (1,468) (274) - (15,587)
Net book value In 2016 95,651 687 1,471 1,344 6,510 105,663
In 2017 91,840 763 1,257 1,280 2,381 97,521
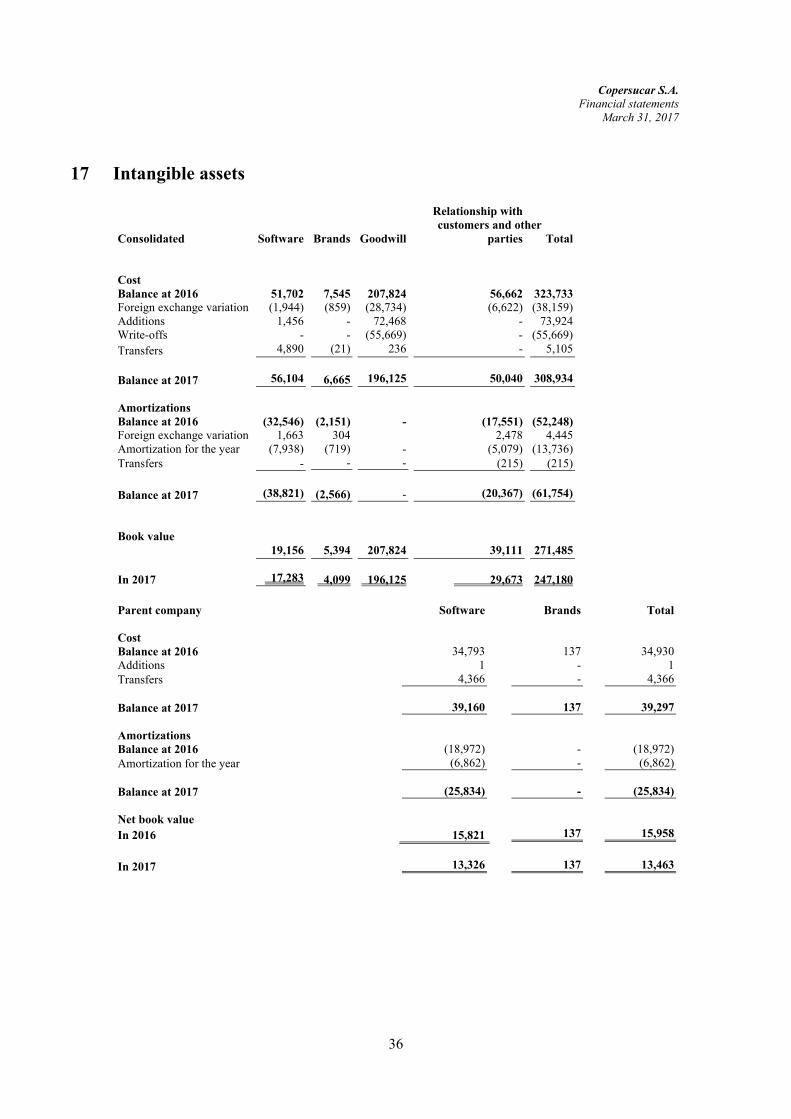
Copersucar S.A. Financial statements
March 31, 2017
36
17 Intangible assets
Consolidated Software Brands Goodwill
Relationship with customers and other
parties Total
Cost Balance at 2016 51,702 7,545 207,824 56,662 323,733 Foreign exchange variation (1,944) (859) (28,734) (6,622) (38,159) Additions 1,456 - 72,468 - 73,924 Write-offs - - (55,669) - (55,669)Transfers 4,890 (21) 236 - 5,105
Balance at 2017 56,104 6,665 196,125 50,040 308,934
AmortizationsBalance at 2016 (32,546) (2,151) - (17,551) (52,248) Foreign exchange variation 1,663 304 2,478 4,445 Amortization for the year (7,938) (719) - (5,079) (13,736) Transfers - - - (215) (215)
Balance at 2017 (38,821) (2,566) - (20,367) (61,754)
Book value 19,156 5,394 207,824 39,111 271,485
In 2017 17,283 4,099 196,125 29,673 247,180
Parent company Software Brands Total
Cost Balance at 2016 34,793 137 34,930Additions 1 - 1Transfers 4,366 - 4,366
Balance at 2017 39,160 137 39,297
Amortizations Balance at 2016 (18,972) - (18,972)Amortization for the year (6,862) - (6,862)
Balance at 2017 (25,834) - (25,834)
Net book value In 2016 15,821 137 15,958
In 2017 13,326 137 13,463

Copersucar S.A. Financial statements
March 31, 2017
37
18 Suppliers
Note Consolidated Parent company
2017 2016 2017 2016
Suppliers 582,486 514,105 240,373 64,141Related parties 25 632,154 967,742 684,233 964,176
Total 1,214,640 1,481,847 924,606 1,028,317
The balances of suppliers and related parties mainly correspond to the item “Accounts payable from ethanol and sugar purchases".
In the year ended March 31, 2017 the Company performed confirming operations, whereby the suppliers transfer the right to receive securities to financial institutions in exchange for the advance receipt of the securities. The institution, in turn, becomes the creditor of the operation. There is no relevant change in the terms and conditions previously established with the suppliers, thus, the Company classifies it under the caption of suppliers. The balance payable for suppliers upon acceptance of the Company on March 31, 2017 is R$ 139,913.
The exposure of the Company to liquidity risks related to trade accounts payable and other accounts payable, is disclosed in Note 23.
19 Loans and financing This note provides information on the terms of interest-bearing borrowing agreements, which are measured at amortized cost. For more information on the Company's exposure to interest, foreign currency and liquidity risks, see Note 23.

Copersucar S.A. Financial statements
March 31, 2017
38
Consolidated Parent company
Description Currency Index Average annual
interest rate Year of
maturity 2017 2016 2017 2016
Export credit note US$ Prefixed rate 1.60% 2017 127,662 - 127,662 - Export prepayment US$ Prefixed rate 1.90% 2017 127,589 178,491 - - Direct External Borrowing US$ Prefixed rate 3.73% 2017-2018 935,820 1,928,151 456,154 1,928,151 Direct External Borrowing US$ Pre-fixed Rate/Libor 2.71% 2017-2018 759,613 - 695,457 - Working capital US$ Prefixed rate 3.09% 2018 492,964 689,953 - - Working capital US$ Pre-fixed Rate/Libor 4.14% 2018-2020 272,482 - - - FINIMP - Import financing US$ Prefixed rate 2.28% 2017 52,466 - 52,466 - Export credit note R$ CDI-CETIP 13.85% * 2017-2022 452,133 560,992 452,133 560,992 Certificate of Receivables from Agribusiness R$ CDI-CETIP 12.80% * 2017-2018 299,712 301,153 299,712 301,153 BNDES-FINAME R$ Prefixed rate 2.86% 2017-2022 26,448 46,538 43,482 46,538 BNDES-FINAME R$ TJLP 9.17% 2016 - 820 - - BNDES-FINEM R$ TJLP 9.05% 2017-2024 101,742 97,178 - - BNDES-FINEM R$ Prefixed rate 2.50% 2020 17,033 20,522 17,033 20,522 CDCA R$ CDI-CETIP 13.08% 2017-2018 510,780 - 510,780 -
Total loans and financing 4,176,444 3,823,798 2,654,879 2,857,356
Current liabilities 1,853,779 2,243,662 1,633,721 1,995,014
Non-current liabilities 2,322,665 1,580,136 1,021,158 862,342
(*) Including operation costs.

Copersucar S.A. Financial statements
March 31, 2017
39
Terms and schedule of debt amortization Terms and conditions of outstanding loans are as follows:
Consolidated 2017 2016
Book valueFair
valueBook value
Fair value
Export credit note 579,795 578,004 560,992 717,306 Export prepayment 127,589 126,480 178,491 190,502Direct External Borrowing 1,695,433 1,673,520 1,928,151 1,824,843Working capital 765,446 765,446 689,953 644,315FINIMP - Import financing 52,466 51,653 - -Certificate of Receivables from Agribusiness 299,712 299,712 301,153 331,195BNDES-FINAME 26,448 26,448 47,358 47,358BNDES-FINEM 118,775 101,742 117,700 117,700CDCA 510,780 510,780 - -
Total 4,176,444 4,133,785 3,823,798 3,873,219
Parent company 2017 2016
Book valueFair
valueBook value
Fair value
Export credit note 579,795 578,004 560,992 717,306
Direct External Borrowing 1,151,611 1,147,807 1,928,151 1,824,843FINIMP - Import financing 52,466 51,653 - -Certificate of Receivables from Agribusiness 299,712 299,712 301,153 331,195BNDES-FINAME 43,482 43,482 46,538 46,538BNDES-FINEM 17,033 17,033 20,522 20,522CDCA 510,780 510,780 - -
Total 2,654,879 2,648,471 2,857,356 2,940,404
Maturities of the principal and interest on loans and financing as of March 31, 2017
Consolidated Parent companyIn months: Up to 6 584,485 576,250 6-12 1,269,294 1,057,471
12-24 1,730,253 678,496 24-60 531,196 297,933 >60 61,216 44,729
Total 4,176,444 2,654,879
The Company and its subsidiaries do not have covenants (financial covenants) in the loan and financing agreements in effect.

Copersucar S.A. Financial statements
March 31, 2017
40
Guarantees Guarantees are provided on contracting of bank credit facilities needed to maintain Parent company and subsidiaries’ cash balance, however, there are guarantees received and granted to the related party. Of the amount presented above, R$ 2,631,365 is guaranteed by the related party - Cooperativa (refer to Note 25).
The loans and financing below are secured by mortgaged property:
Borrowing company Type of financing Maturity 2017
Copersucar S.A. BNDES - FINAME (in BRL) 2017 8,231 Copersucar S.A. BNDES - FINAME (in BRL) 2018 10,888 Copersucar S.A. BNDES - FINAME (in BRL) 2019 10,888 Copersucar S.A. BNDES - FINAME (in BRL) 2020 10,888 Copersucar S.A. BNDES - FINAME (in BRL) 2021 2,224 Copersucar S.A. BNDES - FINAME (in BRL) 2022 361 Copersucar S.A. BNDES - FINEM (in BRL) 2017 3,456 Copersucar S.A. BNDES - FINEM (in BRL) 2018 4,526 Copersucar S.A. BNDES - FINEM (in BRL) 2019 4,526 Copersucar S.A. BNDES - FINEM (in BRL) 2020 4,527
60,515
20 Tax and contributions
Consolidated Parent company
2017 2016 2017 2016
ICMS 34,367 49,681 1,441 16,185PIS 57 20 22 7COFINS 259 95 98 32ISS 793 625 72 17Other 4,645 3,619 490 600
Total current 40,121 54,040 2,123 16,841
Taxes in installments 184 321 - -
Total non-current 184 321 - -
Total 40,305 54,361 2,123 16,841
21 Advance from customers Consolidated Parent company
Note 2017 2016 2017 2016
596 685 397 4764,384 6,343 - -
Domestic market Foreign market Related parties 25 1,310,656 873,163 - -
Total 1,315,636 880,191 397 476

Copersucar S.A. Financial statements
March 31, 2017
41
The aforementioned advances of the related party Alvean Sugar SL, amounting to R$ 1,310,656 as of March 31, 2017, will be offset with the balance of sugar to be delivered by the Company.
22 Provision for contingencies Management, based on information from its legal advisors, analyzed the outstanding legal proceedings, and in respect of tax and labor claims previous experience with regards to amounts claimed, recorded provisions for amounts considered sufficient to cover estimated losses from current lawsuits, as follows:
Consolidated Parent company
Tax Labor Total Tax Labor Total
2015 35,540 1,034 36,574 20,985 - 20,985
474 144 618 - 8 8Provisions made and restatements during the year Provisions used during the year - (170) (170) - - -
2016 36,014 1,008 37,022 20,985 8 20,993
Provisions made and restatements during the year 461 2,180 2,641 - 161 161Provisions used during the year (20,985) (717) (21,702) (20,985) - (20,985)
2017 15,490 2,471 17,961 - 169 169
In relation to the contingencies presented above, as of March 31, 2017, there are deposit in court for the Consolidated and Parent Company totaling R$ 53,736 and R$ 38,473, respectively (R$ 39,422 and R$ 25,522 as of March 31, 2016).
With respect to the thesis of exclusion of ICMS from the PIS and COFINS tax base, the Company is party to a lawsuit with deposit in court and after the decision of the Federal Supreme Court (STF), which judged constitutional such exclusion with general repercussion, the Company, in consequence, performed the write-off of the provision on March 31, 2017, in the amount of R$ 20,985.
The Company is not a party to other contingencies for which an unfavorable outcome is regarded as possible.
23 Financial instruments
a. Classification of financial instruments and fair valueDuring the years ended March 31, 2017 and 2016, no reclassification of financial instrumentswas performed.

Copersucar S.A. Financial statements
March 31, 2017
42
Fair value vs. book value The fair values of the financial assets and liabilities, together with the book values presented in the balance sheet, are as follows:
Consolidated Fair value hierarchy Book value Fair value
2017 2016 2017 2016
Financial instruments measured at fair value through profit or loss Assets
Level 1/Level 2 1,264,785 932,854 1,264,785 932,854Level 2 2,010,006 2,327,423 2,010,006 2,327,423Level 2 26,338 79,672 26,338 79,672
Cash and cash equivalents Inventories BrokersUnrealized derivative financial instruments Level 2 572,764 323,211 572,764 323,211
Level 2 8,665 7,653 8,665 7,653 Liabilities
BrokersUnrealized derivative financial instruments Level 2 328,640 656,478 328,640 656,478
Loans and receivables Trade accounts receivable Level 2 694,290 774,088 694,290 774,088 Advances to suppliers Level 2 323,292 446,562 323,292 446,562 Other accounts receivable Level 2 73,844 74,473 73,844 74,473
Liabilities held at amortized cost Level 2 1,214,640 1,481,847 1,214,640 1,481,847Level 2 4,176,444 3,823,798 4,133,785 3,873,219Level 2 1,315,636 880,191 1,315,636 880,191
Suppliers Loans and financing Advances from custumers Other accounts payable Level 2 76,884 65,881 76,884 65,881
Parent company Fair value hierarchy Book value Fair value
2017 2016 2017 2016
Financial instruments measured at fair value through profit or loss Assets
Level 1/Level 2 476,215 704,929 476,215 704,929
Level 2 859,633 1,087,272 859,633 1,087,272Level 2 518 - 518 -
Cash and cash equivalents Inventories BrokersUnrealized derivative financial instruments Level 2 226,964 154,954 226,964 154,954
Liabilities Brokers Level 2 - 38 - 38 Unrealized derivative financial instruments Level 2 238,055 313,522 238,055 313,522
Loans and receivables Trade accounts receivable Level 2 262,134 430,690 262,134 430,690 Advances to suppliers Level 2 11,904 16,693 11,904 16,693 Other accounts receivable Level 2 20,147 30,228 20,147 30,228

Copersucar S.A. Financial statements
March 31, 2017
43
Parent company Fair value hierarchy Book value Fair value
2017 2016 2017 2016
Granted loans - related parties Level 2 4,600 13,399 4,600 13,399Liabilities held at amortized cost Suppliers Level 2 924,606 1,028,317 924,606 1,028,317
Level 2 2,654,879 2,857,356 2,648,471 2,940,404 Loans and financing Advances from custumers Level 2 397 476 397 476 Other accounts payable Level 2 22,155 9,480 22,155 9,480
The fair values are substantially equivalent to the accounting values shown on the balance sheet.
b. Fair value hierarchyThe table below provides an analysis of financial instruments that are measured at fair valueafter first-time recognition, grouped in Levels 1 to 2 based on the observable level of fair value.The descriptions of the hierarchies are shown in note 3.d.
c. Financial risk managementThe Company is exposed to market risks, which include interest and exchange variations, pricesof commodities, credit risk/counterparty, liquidity risk and operating risk. Currently, the riskmanagement policy identifies and classifies the priorities, analyzing and monitoring them onstructured basis. Capital expenditure limits are approved by the Board of Directors; allexposures are reported and measured with the appropriate frequency.
The risk management area calculates, monitors and reports on the main risks incurred byCopersucar to the business areas, the Executive Board and the Audit and Risk ManagementCommittee; it provides the information required to define risk limits to the Audit and RiskManagement Committee and the Board of Directors; and acts proactively with the businessareas, carrying out risk simulations, recommending actions, in order to assist in structuring thebusiness strategy. The Risk Management Area reports directly to the CEO, as part of thestructure of the Company's corporate governance. The Committee regularly reports on itsactivities to the Board of Directors, which is responsible for establishing and supervising theCompany’s risk management framework.
The risk management policy is established to identify and analyze the risks the Company faces,to define capital limits, exposures and controls, and to monitor risks and adherence to the pre-established limits. The risk management policy and process and policy are reviewed annually orfrom time to time as appropriate, in order to reflect changes in market conditions and theCompany's activities through training and management policies and procedures aiming atdeveloping a disciplined and constructive control environment by means of a risk culture.
Audit and Risk CommitteeThe Audit and Risk Management Committee is comprised at least three (3) and maximum six(6) members, all members of the Board of Directors and/or Advisory Board or appointed by theBoard of Directors for a 2-year term of office, allowing two successive terms of office.
The Audit and Risk Management Committee shall hold meetings in periodicities defined by theBoard of Directors and extraordinary meetings may be convened whenever justifiable to check

Copersucar S.A. Financial statements
March 31, 2017
44
and discuss the strategies that are being implemented. Any change in the Global Risk policy should be recommended by the Committee and approved by the Board of Directors.
The Committee aids Board of Directors playing an important role in Corporate Governance model adopted by the Company. Activities attributions are as follows:
• Monitor the mapping of all existing risks in the Company's business;
• Ensure compliance of the risks incurred with the Global Risk Policy;
• Recommend the adoption of actions to internally disseminate the risk sensitivity culture;
• Report to the Chairman of the Board of Directors on the non-compliance with standards andregulations assessed as high risk;
• Discuss together with the risk management area the initial premises for the risk limits to bedefined, considering the definition of risk appetite and business strategy established by theBoard of Directors. The following are among the premises: estimated production volume for thesubsequent crop (existing members and newcomers), expectations about prices and volatilitiesand any other factor that could result in financial risks;
• Set risk limits and submit them, through the CEO, for analysis and approval by the Board ofDirectors;
• Follow up and discuss internal controls, reports, pending items and issues referring to internaland external audit work; and
• Establish the Company’s internal audit plan and monitor it with the Internal Audit.
The Internal Audit is responsible for assessing misstatements and potential threats to thebusiness based on the risk evaluation matrix of the Company, which is prepared in conjunctionwith the Internal Control area. It is responsible for performing analyses of financial, operating,strategic, of reputation, IT and compliance risks of the Company, and for making suggestions ofimprovement and the follow-up of the respective action plans.
Credit riskIn order to reduce credit risk, Copersucar adopts the practice of performing a detailed analysisof the financial position of its clients, establishing a credit limit for term sales, permanentlyfollowing-up clients’ debt balance. The Company’s Credit Committee is composed of thecommercial and financial executive officers who approve or refuse these requests of credit.
Analyses are valid for up to one year and subject mainly to three considerations: (i) quantitativeanalysis containing detailed assessment of the economic and financial ratios relating toindebtedness, liquidity, profitability and operational cycles shown on the balance sheets of thelast three fiscal years; (ii) qualitative analysis containing the corporate structure, consultationswith tax and credit rating agencies, Sintegra, Federal Revenue Service and Serasa, technicalinspection report, client representation in the sector in which it operates, period of operation inthe market, trade references, list of the main suppliers, list of the assets of the company and/or

Copersucar S.A. Financial statements
March 31, 2017
45
partners; and (iii) analysis of guarantees, examined by the Financial and Legal areas and requested at the discretion of its management.
The Risk Management Area monitors the ratio between the credit given to customers against their volume of accounts receivable and the respective MTM value of futures contracts. This monitoring is meant to assess the credit limits available and suggest, where feasible, possible revaluations of those limits.
(i) Trade accounts receivable The Company and its subsidiaries are subject to credit risk. Management seeks to mitigate credit risk using a strict credit policy, client selection, monitoring of sales financing terms per business segment, and individual credit limits; these procedures are adopted to minimize possible default risks in trade accounts receivable.
For domestic market customers, receipt period is 48 days for sugar; while for ethanol sales, 70% of clients pay within 27 days and remaining 30% pay at sight. As regards accounts receivable from foreign market, including Latin America, approximately 80% of exports proceedings pay using Cash Against Documents.
Maximum credit risk exposure is substantially focused on financial instruments below:
Consolidated Parent company
2017 2016 2017 2016
Demand deposits 768,808 228,199 6,042 6,746Investment Fund 390,579 - 390,579 -Interest earning bank deposits 105,371 704,623 79,568 698,167Trade accounts receivable 694,290 774,088 262,134 430,690Advances to suppliers 323,292 446,562 11,904 16,693Brokers 26,338 79,672 518 -Unrealized derivative financial instruments 572,764 323,211 226,964 154,954Other accounts receivable 73,844 74,473 20,147 30,228
Interest earning bank deposit transactions are scattered into several financial institutions that are considered as prime institutions by the market.
The three most important clients of the Company are responsible for R$ 86 thousand of receivables as of March 31, 2017 (R$ 158 thousand as of March 31, 2016), and during these periods relevant exchanges occurred between clients.
Impairment losses Trade accounts receivable mature as follows:
Consolidated 2017 2016
Gross PECLD Gross PECLD
Not overdue - in days: 643,531 - 718,821 - 0-30 40,827 - 44,213 - 31-120 318 - - - >120 10,218 (604) 12,377 (1,323)
Total 694,894 (604) 775,411 (1,323)

Copersucar S.A. Financial statements
March 31, 2017
46
Parent company 2017 2016
Gross PECLD Gross PECLD
Not overdue - in days: 256,749 - 415,706 - 0-30 1,889 - 11,044 -31-120 318 - - - >120 3,782 (604) 4,806 (866)
Total 262,738 (604) 431,556 (866)
The expense on the recognition of the allowance estimated for doubtful accounts (PECLD) was recorded in ‘Sales expenses' in the statement of income. Whenever provisioned amounts are not expected to be recovered, the amount in this caption is realized against the definite write-off of the receivable, and this provision becomes tax deductible.
Liquidity risk Liquidity risk is the risk of the Company encountering difficulties in performing the obligations associated with its financial liabilities that are settled with cash payments or with another financial asset. The Company's approach in liquidity management is to guarantee that it always has sufficient liquidity to perform its obligations upon maturity, under normal and stress conditions, without causing unacceptable losses or with a risk of sullying the Company's reputation.
We present below the contractual maturities of financial liabilities including payment of estimated interest and excluding, the impact of the negotiation agreements of currencies by the net position.
Consolidated Contractual cash flow
6 / < 6-12 1-2 2-5 >5 months months years years years
1,214,640 1,214,640 - - - -4,176,444 584,485 1,269,294 1,730,253 531,196 61,216 1,315,636 1,315,636 - - - -
2017SuppliersLoans and financing Advance from customers Unrealized derivative financial instruments: - NDF 174,264 - 174,264 - - -- Swap 75,385 3,039 67,069 5,277 - - - Commodity future 78,991 - 78,544 447 - - Other accounts payable 76,884 75,715 - 1,169 - -
1,481,847 1,481,847 - - - -3,823,798 356,680 1,886,982 431,614 1,028,635 119,887
880,191 880,191 - - - -
252,263 252,263 - - - -
2016SuppliersLoans and financing Advance from customers Unrealized derivative financial instruments:- NDF - Swap 108,797 79,439 29,358 - - - - Commodity future 295,418 295,418 - - - - Other accounts payable 65,881 59,012 - 6,869 - -

Copersucar S.A. Financial statements
March 31, 2017
47
Parent company Contractual cash flow
6 / < 6-12 1-2 2-5 >5 months months years years years
924,606 924,606 - - - -2,654,879 576,250 1,057,471 678,496 297,933 44,729
397 397 - - - -
2017SuppliersLoans and financing Advance from customers Unrealized derivative financial instruments: - NDF 173,742 - 173,742 - - - - Swap 69,577 3,039 61,260 5,277 - - - Commodity future 14 - 14 - - - Other accounts payable 22,155 22,155 - - - -
1,028,317 1,028,317 - - - -2,857,356 294,028 1,700,986 418,244 354,098 90,000
476 476 - - - -
196,374 196,374 - - - - 108,797 79,439 29,358 - - -
2016 SuppliersLoans and financing Advance from customers Unrealized derivative financial instruments:- NDF - Swap Other accounts payable 9,480 9,480 - - - -
Market risk Market risk represents the likelihood of financial losses to which the Company is exposed, resulting from variations on market prices and/or rates, whether commodity prices, foreign exchange rates and interest rates (domestic or foreign). The purpose of market risk management is to control and monitor all exposures to these risks so that they remain within acceptable parameters defined by the Board of Directors.
The Company buys and sells derivatives to hedge its exposures and also complies with financial obligations to manage market risks properly. All these actions are conducted according to guidelines established in Company’s Global Risk Policy that it is established by the Audit and Risk Committee and approved by the Board of Directors.
(i) Foreign exchange risk The Company is subject to foreign exchange risk deriving from differences between currency in which sales, purchases, loans and investments are denominated and the Company’s respective functional currency; in this case, Brazilian Real.
The Company uses Over-the-counter Contracts to hedge against currency risk. When necessary, these contracts are renewed on maturity.
Monetary assets and liabilities denominated in foreign currency are managed by their net exposure, through purchase and sale of foreign currency at demand or future rates (forwards), when necessary, substantially for short-term exposures.
Amounts of the Company’s main bank loans in Dollar are hedged using swap contracts, over-the-counter contracts or are offset against assets indexed at the same currency.
Interest on loans is denominated in the loan's currency. In general, loans are denominated in currencies equal to the cash flows generated by the Company basic operations, mainly in USD.

Copersucar S.A. Financial statements
March 31, 2017
48
Exposure to this type of risk is continuously adjusted along with the Company's normal course of business. Therefore, management of this exposure is a dynamic process conducted through derivative contracts, aiming at carrying out hedge adjustments according to the new need. The use of these derivative contracts is defined every year, at the risk limit pre-established by the Board of Directors and monitored by Company’s executives and Audit and Risk Committee.
a. Investment hedge abroadThe Company uses financial instruments (NDF - Non-Deliverable Forward) to hedge againstforeign exchange variation on investments in its Subsidiary in Spain - Alvean and CopersucarNorth America, whose functional currency is the Dollar.
b. Cash flow hedgeThe subsidiary Companhia Auxiliar de Armazéns Gerais has cash flow hedges to protect againstcurrency variation exposure of the contract signed with Alvean Sugar S.L.
Foreign currency exposureThe Company’s foreign currency exposure is substantially linked to US dollar (USD) variationon the following base dates:
Consolidated 2017 2016
762,533 221,363282,079 309,705
1,586,549 1,641,8987,344 180,293
25,824 79,673340,426 168,256
- 26,723129,740 46,439870,677 696,035294,178 303,851
Assets Cash and cash equivalents Trade accounts receivable InventoriesAdvances to suppliers Brokers Unrealized derivative financial instruments Current taxes Other accounts receivable InvestmentsProperty, plant and equipment Intangible assets 232,612 254,657
(396,634) (511,486)(2,768,596) (2,796,595)(1,375,459) (880,244)
(2,148) (2,039)(36,795) (36,034)
(8,665) (7,615)(78,530) (342,828)(40,558) (44,449)
Liabilities SuppliersLoans and financing Advance from customersSocial charges and payroll Brokers Unrealized derivative financial instruments Deferred tax liabilities Other accounts payable
(51,316) (46,798)
Gross exposure of the shareholders' equity (226,739) (739,195)
Notional derivatives contracted to hedge against the foreign exchange risk 19,847 676,886
Net exposure (206,892) (62,309)

Copersucar S.A. Financial statements
March 31, 2017
49
Parent company 2017 2016Assets Trade accounts receivable 12,896 16,151Inventories 289,045 284,596Investments 864,966 689,778Liabilities Suppliers (192,794) (22)Loans and financing (1,331,739) (1,928,151)
Gross exposure of the shareholders' equity (357,626) (937,648)
Notional derivatives contracted to hedge against the foreign exchange risk 26,740 594,604
Net exposure (330,886) (343,044)
The Company’s foreign exchange exposure refers basically to book balances referring to subsidiary Copersucar Trading operation.
Amounts below comprise the Notional balance presented above:
Consolidated Parent company
Description Maturity 2017 2016 2017 2016
Foreign exchange NDF (Investment and Merchandise) 2017-2018 (1,173,056) (1,238,988) (1,142,400) (1,321,271) Foreign exchange swap 2017-2018 1,192,903 1,915,874 1,169,140 1,915,875
Total 19,847 676,886 26,740 594,604
Foreign exchange sensitivity analysis The Company adopted three scenarios for the sensitivity analysis, being one of them the probable scenario presented below, and two other scenarios that may present the impairment of the Company's financial instruments' fair values.
Probable scenario was internally defined by Market Intelligence area and represents the Company’s expectations on this indicator variation over the following 12 months. Possible and remote scenarios are those proposed by CPC.
Methodology used was the fair value recalculation with each scenario focused on market rate on March 31, 2017 less amounts already recognized, and calculation of income value by which the Company would be affected according to each scenario. The analysis considers that all the remaining variables, especially interest rates, are kept constant.
Scenarios
Exchange risk Probable Possible Remote
Scenarios and price levels 3.3645% (3.2750 BRL/USD) 25% (3.9605 BRL/USD) 50% (4.7526 BRL/USD)
Assets 152,477 1,132,990 2,265,980Liabilities (160,105) (1,189,675) (2,379,349)Derivatives 668 4,962 9,924
Total effects (6,960) (51,723) (103,445)

Copersucar S.A. Financial statements
March 31, 2017
50
Brazilian Real appreciation against currencies above, on March 31, 2017, would have the same effect in terms of module, but with the opposite result on currencies presented above, considering that all other variables would remain constant.
(i) Commodity price risk The Company maintains commodity derivatives to minimize income fluctuation caused by recognition of assets and liabilities, and rights and obligations at fair value, evaluated according to commodities' quotation disclosed by (ICE, NYBOT, OPIS, PLATTS and LIFFE) intercontinental exchange and CEPEA/ESALQ indices.
Exposure to this type of risk is continuously adjusted along with the Company's normal course of business. Therefore, management of this exposure is a dynamic process conducted through derivative contracts, aiming at carrying out hedge adjustments according to the new need.
Sugar and ethanol are traded in domestic and foreign markets and sugar sale price is formed by Sugar #11/ICE sugar price of the New York Stock Exchange and ethanol by CEPEA/ESALQ indicator. This becomes them the main portfolio risk factors. Net exposure of sugar purchases and sales is managed and hedged with the use of Sugar #11/ICE derivative financial instruments (future or over-the-counter) referred to the same stock exchange. With respect to ethanol, due to lack of net derivative financial instruments for hedging purposes, its exposure is managed/monitored so as to restrict its exposure to the risk of price variation. Monitoring of exposure and exposure is carried out through limits pre-established by the Board of Directors.
Gains or losses originated from these hedge instruments are recorded in income for the year.
To minimize the risk and the effects of volatility of commodity price changes, mainly related to ethanol, natural gas and other commodities, the subsidiary Eco-Energy uses various derivative financial instruments, including exchange-traded futures, traded in stock exchange or over the counter, swaps and options contracts. Eco-Energy monitors and manages this exposure according to global risk management policy. As such, the Company seeks to reduce potentially adverse effects that the volatility of these markets may have on its operating results. Eco-Energy can take positions in relation to these products as a way to mitigate possible operating losses.
Commodity risk
Consolidated Volume Notional
2017 2016 2017 2016Forward contracts Long position Goods Sugar (tons) 125,137 125,929 (132,698) 17,151 Ethanol (m3) 3,222,831 3,353,266 4,212,075 4,499,475 Corn (m3) 322,580 404,418 287,438 477,068 RIN/LCFS (credit unit) 31,722 35,409 76,587 87,590 Natural gas (mmbtu) 80,958 55,450 540,636 346,418 Derivatives - swap (m3) 300 5,247 61 7,567
Total 4,984,099 5,435,269

Copersucar S.A. Financial statements
March 31, 2017
51
Volume Notional
2017 2016 2017 2016Future contracts (Forward) Short position Goods Sugar (ton) (33,316) (100,995) 26,580 (104,069)
Ethanol (m3) (3,884,968) (4,003,474) (5,302,321) (5,474,961) Gasoline (m3) (15,740) (59,620) (21,358) (5,078) Corn (m3) (189,201) (404,418) (199,767) (479,419) RIN/LCFS (credit unit) (56,765) (35,981) (193,380) (129,452) Natural gas (mmbtu) (63,543) (40,015) (616,895) (254,236) Derivatives - swap (m3) (12,160) - (5,197) -
Total (6,312,338) (6,447,215)
The Company uses basically two categories of price instruments to control commodities’ exposure:
a. Future derivative contracts negotiated directly by the Company in Stock Exchange(ICE/NYBOT) or over-the-counter with prime financial institutions, including NDF (Non-Deliverable Forward). Although the policy allows to operate with other financial instruments,considering certain restrictions, the Company does not currently have them in portfolio.
b. Forward contracts traded directly with clients and suppliers.
Fair value of futures and options derivative contracts in stock exchange is equivalent to marketvalue for reversal of such positions. Transactions conducted in stock exchange environmentneed to have initial margins available and adjustments are made on a daily basis.
For over-the-counter contracts, measurement at fair value is given by the difference betweenprices fixed on contracting and their respective market values, through public information. Thismeasurement follows usual market models and is monthly calculated both by the Company andby banks that intermediate transactions. For these contracts, margin calls are not needed. Theimpact on the Company's cash flow only occurs on the settlement date of the contracts.
Measurement at fair value of forward contracts with clients and suppliers is carried out based onthe difference between fixed purchase or sale price and market price on base date. To determinemarket prices, the same setting indicators are used, that is Sugar #11/ICE quotations in case ofsugar contracts. For each future contract of AA (Against Actuals), SEO (Seller ExecutionOrder) and BEO (Buyer Execution Order) types, there is a physical contract with the same priceand volume variables.
The methodology of the calculation of fair value adopts quotations of contract no. 11 of ICEFUTURES Intercontinental Exchange of New York as pricing basis to define indicators,according to weighing based on percentage pre-attributed to reference screen.
Balances for the Supply Agreement with the Cooperativa are included in forward contracts (seenote 25) as well as balances of foreign and domestic market sales. These volumes representcontract portion whose price is already defined according to CEPEA methodology. The

Copersucar S.A. Financial statements
March 31, 2017
52
calculation also considers the pure change assumptions for FOB prices and freight and lifting costs are adjusted at price CEPEA/ESALQ Raw Sugar index.
Sensitivity analysis for commodity risk The Company adopted three scenarios for the sensitivity analysis, being one of them the probable scenario presented below, and two other scenarios that may present the impairment of the Company's financial instruments' fair values.
Probable scenario was internally defined by Market Intelligence area and represents the Company’s expectations on this indicator variation over the following 12 months. The scenarios: Possible and Remote scenarios are those proposed by CVM Instruction no. 475/08.
Used methodology was to recalculate fair value with the variation of each scenario on market rate as of March 31, 2017.
Scenarios
Commodities price risk Probable Possible Remote
Scenarios and price levels 5.9% -25% -50%
Non-derivative 40,929 (173,225) (346,450)Derivatives (6,834) 18,647 39,258
Total effects 34,095 (154,578) (307,192)
Due to this commodity (sugar) quotation behavior seasonality, this scenario is subject to variations during the year/crop.
(i) Interest rate risk The Company's debt is linked to fixed and floating rates, therefore, it is exposed to interest rate fluctuations. CDI exposure risk is partially offset by financial investments.
The purpose of managing the Company’s total financial cost is to make its financial costs be in line with those practiced in the market, considering entities of similar size.
Fixed rate instruments The Company does not record any fixed rate financial assets or liabilities at fair value through profit or loss. Therefore, a change in the interest rates on the reporting date would not change income (loss).
Variable rate instruments
Consolidated Parent company
2017 2016 2017 2016
Financial assets 494,374 718,412 472,058 698,067Financial liabilities (2,396,462) (960,143) (1,958,082) (862,145)
The Company does not carry out sensitivity analysis for financial instruments linked to variable interest rates because it considers that they are partially mitigated by financial assets.

Copersucar S.A. Financial statements
March 31, 2017
53
Gains (losses) with unrealized derivative financial instruments Summary of gains (losses) recorded on March 31, 2017 and 2016 that affected balance sheet, and amounts that affected the Company’s accumulated income on those dates:
Consolidated 2017 2016
Effects on the balance sheet
Effects on income (loss)
Effects on the balance sheet
Effects on income
(loss)
Assets Liabilities Assets Liabilities
Commodities 396,568 78,991 634,895 135,213 295,418 (658,739)
396,568 78,991 634,895 135,213 295,418 (658,739)
Non-deliverable forwards 161,175 174,264 (10,887) 61,715 252,263 141,794SWAP 15,021 75,385 77,415 126,283 108,797 43,571
176,196 249,649 66,528 187,998 361,060 185,365
Total 572,764 328,640 323,211 656,478
Current 565,128 322,916 309,310 656,478
Non-current 7,636 5,724 13,901 -
Parent company 2017 2016
Effects on the balance sheet
Effects on income
(loss) Effects on the balance sheet
Effects on income
(loss)
Assets Liabilities Assets Liabilities
Commodities 56,142 14 53,846 10,714 8,351 2,144
56,142 14 53,846 10,714 8,351 2,144
Non-deliverable forwards 161,175 173,742 (110,404) 17,958 196,374 87,111SWAP 9,647 69,577 77,415 126,282 108,797 43,571
170,822 243,319 (32,989) 144,240 305,171 130,682
Total 226,964 243,332 154,954 313,522
Current 224,702 238,055 141,053 313,522
Non-current 2,262 5,277 13,901 -
Operating risk Operating risk is the risk of direct or indirect losses arising from different causes related to the Company's business processes, personnel, technology and infrastructure and external factors, except credit, market and liquidity risks, as those arising from legal and regulatory requirements and from generally accepted corporate behavior standards.

Copersucar S.A. Financial statements
March 31, 2017
54
The purpose of the Company is to monitor possible operating risks and mitigate financial losses and damages to reputation and business continuity, thus seeking cost effectiveness and avoiding non-effective control procedures.
Capital management Management’s policy is to maintain capital basis sufficient to maintain investor, creditor and market trust. The main objective is future development of business.
The Company operates with several financial instruments, as follows: interest earning bank deposits, trade accounts receivable, trade accounts payable and loans and financing. Transactions with derivative financial instruments contracted to hedge against market volatility, as well as forward merchandise purchase and sale transactions with Cooperativa, are also part of financial instruments’ portfolio. The following hedge instruments are used for this purpose: foreign exchange swap, transactions with NDF - Non-Deliverable Forwards, futures and options of commodities and currency.
24 Contractual commitments
Sales Considering that the Company operates mainly in the commodities market, sales are substantially made at the sales date price. However, most contracts are short-term contracts. As of March 31, 2017, sugar contracted volume is 4,045 thousand tons (4,282 thousand tons on March 31, 2016) and ethanol contracted volume is 2,969 thousand m³ as of March 31, 2017 (2,852 thousand m³ on March 31, 2016).
Purchasing In accordance with the contract entered into by the Company and its related party - Cooperativa, committed purchase volumes on March 31, 2017 were 4,513 thousand tons of sugar (4,256 thousand tons as of March 31, 2016) and 3,830 thousand m³ of ethanol (4,411 thousand m³ as of March 31, 2016).
Logistics The Company has strategic partnerships for the provision of railroad transportation services with the following suppliers:
América Latina Logística - ALL
• Provision of sugar transportation services in wagons of ALL railroad to Santos Port terminal(São Paulo State - SP), maturing in 2028.
• Ethanol transportation through ALL railroads with destination indicated by Copersucar. Thiscontract effectiveness follows ALL railroad concessions.Ferrovia Centro Atlântica - FCA.
• Transportation from Ribeirão Preto (SP) terminal to Santos Port (SP) terminal, effective until2026.

Copersucar S.A. Financial statements
March 31, 2017
55
25 Related parties
Parent company and part of the final Parent company The Company’s final parent companies are the following groups:
Shareholders - Group Number of
common shares Quantity of
preferred shares Total shares % Interest
Virgolino Oliveira 136,537,290 2 136,537,292 11.0572Zilor 136,470,950 3 136,470,953 11.0517Pedra 123,865,949 1 123,865,950 10.0310Cocal 94,710,202 1 94,710,203 7.6699Santa Adélia 83,767,543 2 83,767,545 6.7837Ipiranga 75,368,459 2 75,368,461 6.1035Viralcool 70,948,322 2 70,948,324 5.7456Balbo 67,984,431 3 67,984,434 5.5055Aralco 50,081,567 4 50,081,571 4.0557São Manoel 47,651,412 1 47,651,413 3.8589 São J. da Estiva 42,337,360 1 42,337,361 3.4286Ferrari 37,883,193 1 37,883,194 3.0679Cerradão 31,877,660 1 31,877,661 2.5815Pitangueiras 31,144,060 1 31,144,061 2.5221Furlan 30,894,483 1 30,894,484 2.5019Improvements 30,552,666 2 30,552,668 2.4742São Luiz 28,837,064 1 28,837,065 2.3353Umoe Bioenergy 26,767,961 1 26,767,962 2.1677Jacarezinho 25,569,993 1 25,569,994 2.0707Caçu 21,413,164 1 21,413,165 1.7341Santa Maria 17,824,972 1 17,824,973 1.4435Santa Lucia 15,863,888 1 15,863,889 1.2847Decal - Rio Verde 5,980,744 1 5,980,745 0.4843Other 501,150 2 501,152 0.0405
1,234,834,483 37 1,234,834,520 100.0000
Remuneration of key management personnel The Company’s key personnel are the president of the Board of Directors, the Executive president and officers of the following areas: Operations, Financial, Controllership and Relations with Plants, Legal and Governance, Human Resources and Strategic Management and Participations.
Remuneration of key management personnel includes:
Consolidated Parent company
2017 2016 2017 2016
Short-term employee benefits (a) 9,409 7,780 9,409 7,780 Post-employment benefits 2,083 1,214 2,083 1,214
Total 11,492 8,994 11,492 8,994
(a) Includes salaries, remuneration and short and long-term and post-employment benefits.

Copersucar S.A. Financial statements
March 31, 2017
56
Other related party balances
Consolidated Parent company
Note 2017 2016 2017 2016Current assets Accounts receivable Cooperativa 4,374 18,528 3,708 17,979 Companhia Auxiliar de Armazéns Gerais - - 579 11,600 Copersucar Trading A.V.V. - - 12,896 15,204 Alvean Sugar Intermediação e Agenciamento Ltda. 182 163 182 163Alvean Sugar S.L. 26,575 8,784 - 79Copersucar Armazéns Gerais S.A. - - 272 270
Total 8 31,131 27,475 17,637 45,295
Dividends receivable Companhia Auxiliar de Armazéns Gerais - - 13,765 8,387
Total - - 13,765 8,387
Advances to suppliers Companhia Auxiliar de Armazéns Gerais - - - 2 Cooperativa 271,196 213,758 - -
Total 11 271,196 213,758 - 2
Non-current assets Granted loans and others Companhia Auxiliar de Armazéns Gerais - - - 162 Sugar Express Transportes S.A. - - 4,600 13,237
Total - - 4,600 13,399Current liabilities Suppliers Cooperativa 630,708 964,176 630,708 964,176 Copersucar Trading A.V.V. - - 52,972 -Copersucar Armazéns Gerais S.A. - - 553 - Alvean Sugar S.L. 1,446 3,566 - -
Total 18 632,154 967,742 684,233 964,176
Advance from customers Alvean Sugar S.L. 21 1,310,656 873,163 - -

Copersucar S.A. Financial statements
March 31, 2017
57
Other related party transactions
Consolidated Parent company
2017 2016 2017 2016
Value of the transaction for the year Sale of products Copersucar Trading A.V.V. - - 106,469 51,509Alvean Sugar S.L. 3,360,550 3,155,226 30,267 23,343
Total 3,360,550 3,155,226 136,736 74,852
Sale of services Cooperativa 8,227 6,830 - -Alvean Sugar Intermediação e Agenciamento Ltda. 2,153 1,871 2,153 1,871Alvean Sugar S.L. 91,815 143,028 40,645 8,166
Total 102,195 151,729 42,798 10,037
Product acquisition Copersucar Trading A.V.V. - - (298,760) (41,659)Cooperativa (12,378,998) (10,817,949) (8,003,523) (7,602,321)Alvean Sugar S.L. (2,282,985) (1,787,793) - -
Total (14,661,983) (12,605,742) (8,302,283) (7,643,980)
Acquisition of Services Copersucar Armazéns Gerais S.A. - - (7,982) (4,220)
Total - - (7,982) (4,220)
Financial - Interest receivable Companhia Auxiliar de Armazéns Gerais - - - (5,997)Sugar Express Transportes S.A. - - 1,252 (1,615)
Total - - 1,252 (7,612)
Related-party transactions are transactions carried out between the Parent company and its direct and indirect subsidiaries or other related parties (Cooperativa) and refer basically to:
• Sale/Acquisition of assets and services - Products (sugar and ethanol) purchase and saletransactions and port services traded in accordance with contract entered into by the parties, atconditions similar to those agreed on with third parties, considering volumes, involved risks andcorporate policies.
• Asset values - Sale of products and services; rent of properties; and onlending of sharedexpenses.
• Liability values - Purchase of products and services.

Copersucar S.A. Financial statements
March 31, 2017
58
Supply contract with Cooperativa The Company has an exclusivity agreement over a period of three years, renewed at each year/crop.
Guarantee of products supply is linked to continuity of contract with Cooperativa. The contract also guarantees access to certain facilities that are essential to carry out the Company’s business, such as those intended for storage of ethanol and sugar deriving from Cooperativa and associated plants. Prices practiced in this contract are related to CEPEA/ESALQ index.
Pursuant to the contract, guarantors of sugar and ethanol sale transactions are plants associated to Cooperativa.
Sugar supply contract for Alvean Sugar SL The Company has a sugar supply contract through its subsidiary Copersucar Trading AVV with Alvean Sugar SL that is effective beginning as of October 2014, with no defined end date.
The purpose of this contract is to guarantee supply of sugar by Copersucar Trading AVV to Alvean Sugar SL; according to this contract, the parties agreed that Copersucar Trading AVV is committed to selling exclusively to Alvean, and to purchasing 100% of production in each crop year. Prices practiced in this contract are related to CEPEA/ESALQ index (equivalent to Dollars).
Guarantees or collateral signatures received from related parties Loans and financing listed below are collateralized by related party Cooperativa:
Borrowing company Type of financing Maturity 2017
Companhia Auxiliar de Armazéns Gerais Direct External Borrowing (in US$) 2017 24,405 (1) Copersucar S.A. Direct External Borrowing (in US$) 2017 149,164 (2) Copersucar S.A. Direct External Borrowing (in US$) 2018 441,540 (2) Copersucar S.A. Direct External Borrowing (in US$) 2017 210,608 (1) Copersucar S.A. Direct External Borrowing (in US$) 2018 32,092 (1) Copersucar S.A. Direct External Borrowing (in US$) 2017 318,207 (3) Copersucar S.A. NCE (exp. cred. notes) (USD) 2017 127,662 (4) Copersucar S.A. BNDES-CDCA (in BRL) 2017 409,546 (5) Copersucar S.A. BNDES-CDCA (in BRL) 2018 101,226 (6)
Copersucar S.A. Certificate of Receivables from Agribusiness (in Reais) 2018 301,285 (7)
Copersucar S.A. Export credit notes (BRL) 2018 95,116 (7) Copersucar S.A. Export credit notes (BRL) 2019 90,000 (7) Copersucar S.A. Export credit notes (BRL) 2020 90,000 (7) Copersucar S.A. Export credit notes (BRL) 2021 90,000 (7) Copersucar S.A. Export credit notes (BRL) 2022 90,000 (7) Copersucar S.A. BNDES - FINAME (in BRL) 2017 8,231 (8) Copersucar S.A. BNDES - FINAME (in BRL) 2018 10,888 (8) Copersucar S.A. BNDES - FINAME (in BRL) 2019 10,888 (8) Copersucar S.A. BNDES - FINAME (in BRL) 2020 10,888 (8) Copersucar S.A. BNDES - FINAME (in BRL) 2021 2,224 (8) Copersucar S.A. BNDES - FINAME (in BRL) 2022 361 (8) Copersucar S.A. BNDES - FINEM (in BRL) 2017 3,456 (9) Copersucar S.A. BNDES - FINEM (in BRL) 2018 4,526 (9) Copersucar S.A. BNDES - FINEM (in BRL) 2019 4,526 (9) Copersucar S.A. BNDES - FINEM (in BRL) 2020 4,526 (9)
2,631,365
(1) Promissory note (120%) and Cooperativa as Guarantor Guarantee by the Cooperativa/Copersucar S.A.
(2) Guarantee by Cooperativa with promissory note.
(3) Promissory note (120%) and Cooperativa as Guarantor
(4) Cooperativa as Guarantor

Copersucar S.A. Financial statements
March 31, 2017
59
(5) CPR (Rural Product Bill) issued by the Cooperativa as a guarantee.
(6) Cooperativa collateral and CPR (Rural Product Bill) issued by the Cooperative as a guarantee.
(7) Cooperativa collateral
(8) Mortgage and 2nd degree mortgage of the property located in Paulinia/SP
(9) Mortgage
Loans and financing listed below are collateralized by related party Copersucar S/A:
Borrowing company Type of financing Maturity 2017
Copersucar North América Working capital (in USD) 2018 79,210 (1) Copersucar North América Working capital (in USD) 2020 193,272 (1) Copersucar S.A. FINIMP - Import financing (in USD) 2017 52,466 (2) Copersucar Trading AVV Direct External Borrowing (in US$) 2018 455,261 (3) Copersucar Trading AVV Direct External Borrowing (in US$) 2018 64,157 (4) Copersucar Trading AVV Export prepayments (in USD) 2017 127,589 (3) Eco-Energy Global Biofuels, LLC Working capital (in USD) 2018 492,964 (1)
1,464,919
(1) Collateral - Cooperativa and Copersucar S.A.
(2) Promissory note Copersucar S.A. and guarantee of the Cooperativa.
(3) Guarantee by Copersucar S.A. with promissory note.
(4) Promissory note (100%) Copersucar S.A. and Cooperativa as guarantor (cross guarantee).
26 Shareholders’ equity The Company’s paid-in capital is R$180,300,590 on March 31, 2017 and 2016, represented by 1,234,834,520 shares, being 1,234,834,483 common shares and 37 preferred shares, all of them nominative, registered and with no par value.
The Company is authorized to increase its capital according to decision of the Board of Directors, regardless of statutory reform, up to the limit of R$ 2,500,000,000.
Legal reserve In compliance with article 193 of Law No. 6.404/76, the reserve is recorded at the rate of 5% of the adjusted net revenue for the year, up to the limit of 20% of the capital.
Revaluation reserveThe reserve for revaluation reserve includes:
• adjustments for the adoption of deemed cost of fixed assets on the transition date;
• accumulated translation adjustment included all foreign currency differences deriving from thetranslation of financial statements of foreign operations;
• Investment hedge abroad adjustment as described in Note 23 (item i a); and
• Cash flow hedge adjustment as described in Note 23 (item i b).
The amounts recorded in revaluation reserve are reclassified to the result for the year wholly orpartially, through asset impairment to which they refer.

Copersucar S.A. Financial statements
March 31, 2017
60
Proposal for allocation of income (loss) for the year 2017
Net revenue for the year attributed to controlling shareholders 254,433- Legal reserve (5%) (12,722)- Minimum mandatory dividends (1%) (2,417)- Investment reserve (239,294)
27 Operating income
Consolidated Parent company
2017 2016 2017 2016Sales of products Sugar 8,765,312 7,155,973 2,172,458 1,800,156 Ethanol 18,526,868 18,487,147 5,867,093 5,949,793 Gasoline (5,737) 42,181 - - Corn (10,168) (7,060) - - RIN_LCFS (registration of renewable fuel) 565,899 273,477 - -Realized derivative financial instrument (11,356) 20,655 6,113 1,307Rendering of services 439,075 351,633 233,499 150,422
Total 28,269,893 26,324,006 8,279,163 7,901,678
We present below the reconciliation between gross income and income presented in the statement of income for the year:
Consolidated Parent company
2017 2016 2017 2016
Tax gross income 29,214,412 27,381,037 9,195,043 8,966,727
Less: Sales tax (888,776) (1,039,100) (888,764) (1,039,072) Services taxes (31,968) (24,891) (20,810) (13,590) Returns/rebates (12,419) (13,695) (12,419) (13,694)
28,281,249 26,303,351 8,273,050 7,900,371
Realized derivative financial instrument (11,356) 20,655 6,113 1,307
Total 28,269,893 26,324,006 8,279,163 7,901,678
In the year ended March 31, 2017 the Company reclassified from the financial income (loss) to unrealized derivative financial instrument (allocated to gross income) gain of R$ 153,875 (loss of R$ 140,275 on March 31, 2016) related to exchange variations concerning hedge of commodity prices.

Copersucar S.A. Financial statements
March 31, 2017
61
28 Net financial income (loss)
Consolidated Parent company
2017 2016 2017 2016
Financial income Asset interest 82,660 50,323 76,181 54,946Asset foreign exchange fluctuation 824,369 1,459,179 213,864 427,311Transactions with derivative asset 110,255 448,110 444,619 323,741Other financial income 23 609 23 74
1,017,307 1,958,221 734,687 806,072
Financial expenses Liability interest (264,143) (249,077) (210,968) (199,202)Liability foreign exchange fluctuations (457,586) (1,711,836) - (580,858)Transactions with derivative liabilities (559,340) (255,811) (735,140) (240,067)Other financial expenses (19,486) (18,356) (16,540) (13,231)
(1,300,555) (2,235,080) (962,648) (1,033,358)
Total net financial income (283,248) (276,859) (227,961) (227,286)
A substantial portion of amounts presented in captions Asset and liability foreign exchange fluctuation is related to the Company’s hedging policies; their respective hedged contra-entries are presented in Net revenue from sales and Selling Costs, following prevailing accounting policies.
29 Expenses per type Consolidated Parent company
2017 2016 2017 2016
Cost of products, except freights, transshipment and storage (27,489,847) (25,133,327) (7,714,986) (7,425,678)Change in inventories’ fair values (356,384) 387,273 (188,788) 194,921Depreciation and amortization (58,124) (42,937) (13,648) (11,959)Personnel expenses (213,857) (164,451) (89,290) (66,187)Freights, transshipment, warehousing and shipping expenses (92,205) (92,241) (23,050) (16,040)Other expenses (189,219) (130,780) (47,841) (45,690)
Total (28,399,636) (25,176,463) (8,077,603) (7,370,633)
Classified as: Cost of sales (28,048,458) (24,836,635) (7,903,864) (7,230,754)- Administrative (226,397) (216,968) (124,502) (98,219)- Sales (124,781) (122,860) (49,237) (41,660)
Total (28,399,636) (25,176,463) (8,077,603) (7,370,633)

Copersucar S.A.
Financial statements March 31, 2017
62
30 Income tax and social contribution expense The reconciliation between the tax expense as calculated by the combined statutory rates and the income and social contribution tax expense charged to net revenue is presented below: Consolidated Parent company 2017 2016 2017 2016
Income before income and social contribution taxes 301,431 131,418
260,271 87,332Income attributable to non-controlling interest (NCI) (2,531) (12,692) - -
Adjusted income 298,900 118,726 260,271 87,332Equity in net income of subsidiaries (65,430) 67,461 (23,499) 13,487Income (loss) of company headquartered abroad (63,410) 213,262 (168,927) 217,759
Income before income and social contribution taxes 170,060 399,449
67,845 318,578Combined statutory rate 34% 34% 34% 34% Income and social contribution taxes:
Calculated at combined statutory rate (57,820) (135,812) (23,067) (108,317)
Permanent additions / exclusions:
Transfer price adjustment (6,879) - (6,879) - Fines (56) (53) (54) (51) Donations/Sponsorship (19) (296) (18) (296) Variation in interest 3,613 3,700 3,613 3,700 Other (4,259) (2,135) (668) (56) Rate differential Copersucar North America (781) (1,947) - - Profit abroad (8,718) (15,902) (8,718) (15,902) Deferred of prior year 75 221 87 212 Deferred assets of Copersucar Trading and Copersucar North America 33,127 75,613
33,127 75,613
Long-term compensation (3,469) (10,187) (3,469) (10,060) IRPJ - PAT deductions and Sponsorship 719 511 209 264
Income and social contribution taxes in the income (loss) for the year (68,874) (145,998) (30,244) (114,604)Income tax and social contribution on income abroad 24,407 59,711 24,407 59,711 Effective rate 26% 22% 9% 17% Current taxes (112,290) (32,746) (71,337) (46,154)Deferred taxes 67,823 (53,541) 65,500 (8,739)
Total (44,467) (86,287) (5,837) (54,893)
31 Employee benefits Other short and long-term benefits Based on its benefit program, the Company recorded a provision for bonus that is effective for one year, for the following professionals:

Copersucar S.A.
Financial statements March 31, 2017
63
2017 2016 Key personnel 30,522 12,242 Other executives 7,630 3,060
38,152 15,302
32 Operating leases
Leases as lessee Operating leases that cannot be cancelled are paid as follows: Consolidated Parent company 2017 2016 2017 2016 In years: Up to 1 68,841 80,182 4,363 4,343 1-5 148,397 169,393 12,381 18,241 >5 163,647 156,720 - -
Total 380,885 406,295 16,744 22,584
The Company recognized the following expenses amounts with operational leasing transactions:
2017 2016 Expense with operating lease 57,558 70,220
The Company is the lessee of an area located in Santos Port of approximately 50,392 square meters, where its facilities are built with concession contract up to 2036. All covenants of the operating lease contract are being fully complied with by the Company. Through its indirect subsidiary Eco-Energy, the Company is the lessee of equipment for ethanol and gasoline storage and moving (tank-cars, trucks, railroad wagons, tanks and transshipment equipment), and office equipment; it also rents a property in the city of Franklin, TN, USA, for administrative purposes. Leases as lessor Parent company rents its investment properties under operating leases (see Note 15) to a related party, Copersucar Armazéns Gerais. Through its indirect subsidiary Eco-Energy, the Company sub-rents tank-cars.

Copersucar S.A. Financial statements
March 31, 2017
64
Minimum future payments under non-cancelable leases are as follows:
Consolidated Parent company
2017 2016 2017 2016 In years: Up to 1 38,231 50,110 3,761 3,641 1-5 86,051 84,971 6,503 10,191 >5 35,147 13,601 - -
Total 159,429 148,682 10,264 13,832
During the year ended March 31, 2017, the amount of R$ 53,698 was recognized as income from rent in the Company’s income (loss).
2017 2016
Income from operating lease 53,698 68,920
33 Statement of added value - DVA According to the requirement of accounting practices adopted in Brazil, applicable to publicly-held companies, and as additional information for IFRS purposes, the company prepared consolidated and individual statements of added value.
This statement, supported by macro-economic concepts, is intended to present the Company’s portion in Gross Domestic Product formation by determining values added by the Company and those received from other entities; distribution of these amounts to employees, government spheres, asset leases, loan, financing and debt security creditors, controlling and non-controlling interest (NCI), and other remuneration that represents wealth transfer to third parties; said added value represents wealth created by the Company, in general, measured at income from sale of assets and from services rendered less respective inputs acquired from third parties, including value added produced by third parties and transferred to the entity.