1903è ±æ ç ä¿¡ · 7kh uhvxowv iruhfdvwv dqg iruzdug orrnlqj vwdwhphqwv lqfoxghg lq wklv...
TRANSCRIPT

1
May 9, 2019
FLASH REPORT Year ended March 31, 2019
(Results for the Period from April 1, 2018 to March 31, 2019)
Performance Outline (Consolidated) (1) Year ended March 31, 2018 and 2019(Actual result) and Year ending March 31, 2020 (Forecast)
(Billions of yen) Year ended
March 31, 2018 Results
Year ended March 31, 2019
Results Change
Year ending March 31, 2020
Forecast Change
Domestic sales 799.9 805.7 0.7% 810.0 0.5% Overseas sales 1,263.4 1,207.4 -4.4% 1,200.0 -0.6%
Sales 2,063.3 2,013.2 -2.4% 2,010.0 -0.2% Gross profit 791.0 766.8 -3.0% 780.0 1.7% Operating profit (loss) -115.6 86.8 - 100.0 15.2% Profit (loss) before income tax expenses -124.1 83.9 - 98.0 16.7% Profit (loss) attributable to owners of the parent -135.3 49.5 - 62.0 25.2%
Exchange rate (Yen/US$) 110.91 110.95 0.04 110.00 -0.95 Exchange rate (Yen/EURO) 129.67 128.46 -1.21 125.00 -3.46 Earnings per share attributable to owners of the parent-basic (yen)
-186.75 68.32 255.07 85.53 17.21
Earnings per share attributable to owners of the parent-diluted (yen)
- - - - -
Profit (loss) on equity attributable to owners of the parent (%)
-13.9 5.4 19.3 - -
Profit (loss) before income tax expenses on total assets (%)
-4.6 3.1 7.7 - -
Operating profit (loss) on sales (%) -5.6 4.3 9.9 5.0 0.7
Cash flows from operating activities 110.2 81.9 -28.3 - - Cash flows from investing activities -81.0 -45.9 35.1 - - Cash flows from financing activities 6.4 42.4 36.0 - - Cash and cash equivalents at end of year 160.5 240.0 79.5 - - Capital expenditures 72.2 72.4 0.1 74.0 1.5 Depreciation 68.4 65.4 -2.9 67.0 1.5 R&D expenditures 111.0 111.0 -0.0 112.0 0.9 Number of employee (Japan) (thousand people) 33.7 31.9 -1.8 - -
Number of employee (Overseas) (thousand people) 64.0 60.7 -3.3 - -
March 31, 2018 March 31, 2019 Change
Total assets 2,641.0 2,725.1 84.1 Equity attributable to owners of the parent 909.5 932.5 23.0 Interest-bearing debt 881.9 933.4 51.5 Equity attributable to owners of the parent ratio (%)
34.4 34.2 -0.2
Equity per share attributable to owners of the parent (yen)
1,254.79 1,286.56 31.77
Ricoh Company, Ltd.
* The results forecasts and forward-looking statements included in this document are based on information available to the Company as at the date and certain assumptions that the Company considers reasonable. The Company makes no guarantees with respect to the achievement of its results forecasts or forward-looking statements. Actual results might be significantly different from the forecasts in the document, depending on various factors. For the assumptions for forecast and other related information, please refer to “Forecast for the coming fiscal year” on page 8.

2
(2) Three months ended March 31, 2018 and 2019 (Billions of yen)
Three months ended March 31, 2018
Results
Three months ended March 31, 2019
Results Change
Domestic sales 220.6 218.0 -1.2% Overseas sales 326.4 305.6 -6.4%
Sales 547.1 523.7 -4.3% Gross profit 197.0 191.8 -2.7% Operating profit (loss) -163.7 7.6 - Profit (loss) before income tax expenses -167.3 7.0 - Loss attributable to owners of the parent -152.7 -1.1 - Exchange rate (Yen/US$) 108.44 110.22 1.78 Exchange rate (Yen/EURO) 133.23 125.16 -8.07 Earnings per share attributable to owners of the parent-basic (yen)
-210.67 -1.53 209.14
Earnings per share attributable to owners of the parent-diluted (yen)
- - -
Loss on equity attributable to owners of the parent (%)
-15.3 -0.1 15.2
Profit (loss) before income tax expenses on total assets (%)
-6.2 0.3 6.5
Operating profit (loss) on sales (%) -29.9 1.5 31.4 Capital expenditures 26.1 21.9 -4.1 Depreciation 16.8 15.8 -1.0 R&D expenditures 30.6 30.6 -0.0

3
Ricoh Company, Ltd. and Consolidated Subsidiaries Financial Highlights for the Year Ended March 31, 2019 [Prepared on the basis of International Financial Reporting Standards] 1. Results for the Period from April 1, 2018 to March 31, 2019 (1) Operating Results
(Millions of yen) Year ended
March 31, 2018 Year ended
March 31, 2019 Sales 2,063,363 2,013,228 (% change from the previous corresponding period) 1.7 -2.4 Operating profit (loss) -115,676 86,839 (% change from the previous corresponding period) - - Profit (loss) before income tax expenses -124,182 83,964 (% change from the previous corresponding period) - - Profit (loss) -129,639 55,377 (% change from the previous corresponding period) - - Profit (loss) attributable to owners of the parent -135,372 49,526 (% change from the previous corresponding period) - - Comprehensive income (loss) -112,483 36,136 (% change from the previous corresponding period) - - Earnings per share attributable to owners of the parent-basic (yen) -186.75 68.32 Earnings per share attributable to owners of the parent-diluted (yen) - - Profit (loss) on equity attributable to owners of the parent (%) -13.9 5.4 Profit (loss) before income tax expenses on total assets (%) -4.6 3.1 Operating profit (loss) on sales (%) -5.6 4.3
Notes: i. Share of profit of investments accounted for using the equity method: ¥ 492 million (¥ 202 million in previous fiscal year) ii. Earnings per share attributable to owners of the parent (basic and diluted) are based on Profit (loss) attributable to owners of the parent. (2) Financial Position
(Millions of yen) March 31, 2018 March 31, 2019 Total assets 2,641,030 2,725,132 Total equity 988,755 1,018,988 Equity attributable to owners of the parent 909,565 932,577 Equity attributable to owners of the parent ratio (%) 34.4 34.2 Equity per share attributable to owners of the parent (yen) 1,254.79 1,286.56
(3) Cash Flows
(Millions of yen) Year ended
March 31, 2018 Year ended
March 31, 2019 Cash flows from operating activities 110,288 81,947 Cash flows from investing activities -81,077 -45,931 Cash flows from financing activities 6,407 42,424 Cash and cash equivalents at end of year 160,568 240,099
2. Dividend Information
Year ended March 31, 2018
(Actual)
Year ended March 31, 2019
(Actual)
Year ending March 31, 2020
(Forecast) Cash dividends, applicable to the year (yen) 15.00 23.00 26.00 Interim (yen) 7.50 10.00 13.00 Year-end (yen) 7.50 13.00 13.00 Total annual dividends (millions of yen) 10,873 16,671 - Payout Ratio (%) - 33.7 30.4 Dividends on equity attributable to owners of the parent (%)
1.1 1.8 -

4
3. Forecast of Operating Results from April 1, 2019 to March 31, 2020 (Millions of yen)
Year ending March 31, 2020
Sales 2,010,000 (% change from the previous corresponding period) -0.2 Operating profit 100,000 (% change from the previous corresponding period) 15.2 Profit before income tax expenses 98,000 (% change from the previous corresponding period) 16.7 Profit attributable to owners of the parent 62,000 (% change from the previous corresponding period) 25.2 Earnings per share attributable to owners of the parent-basic (yen) 85.53
4. Others (1) Changes in significant subsidiaries: No (2) Changes in accounting policies and accounting estimate
(i) Changes in accounting policies required by IFRS: Yes (ii) Other changes: No (iii) Changes in accounting estimate: No
(3) Number of common stock outstanding (including treasury stock): As of March 31, 2019: 744,912,078 shares; As of March 31, 2018: 744,912,078 shares
(4) Number of treasury stock: As of March 31, 2019: 20,049,430 shares; As of March 31, 2018: 20,040,659 shares (5) Average number of common stock: Year ended March 31, 2019: 724,867,249 shares; Year ended March 31, 2018: 724,877,128 shares (Reference) Non-consolidated information Results for the period from April 1, 2018 to March 31, 2019 (1) Operating Results
(Millions of yen) Year ended
March 31, 2018 Year ended
March 31, 2019 Sales 862,291 889,341 (% change from the previous corresponding period) 0.3 3.1 Operating loss -853 -21,070 (% change from the previous corresponding period) - - Profit from ordinary operations 16,796 1,399 (% change from the previous corresponding period) -49.3 -91.7 Profit (loss) -93,519 50,958 (% change from the previous corresponding period) - - Profit (loss) per share-basic (yen) -129.01 70.30 Profit (loss) per share-diluted (yen) - -
(2) Financial Position
(Millions of yen) March 31, 2018 March 31, 2019 Total assets 1,026,776 963,455 Total equity 482,095 478,233 Equity ratio (%) 47.0 49.6 Equity per share (yen) 665.07 659.76
*Equity capital March 31, 2019: ¥478,233 million March 31, 2018: ¥482,095 million

5
1. Performance (1) Qualitative Information on Consolidated Business Results * Overview of the Year of Fiscal 2018 (April 1, 2018 – March 31, 2019) Business Environment In fiscal 2018, ended March 31, 2019, the global economy continued its recovery from a year earlier and expanded overall. Growth remained moderate in Japan and the United States. Notwithstanding uncertainties stemming from such factors as Brexit and a currency and debt crisis in Turkey, growth was generally steady in Europe. The impact of Sino-American trade friction created concerns about China, while growth in other emerging economies picked up. During this period, the average exchange rates of Japanese yen against U.S. dollar and Euro were ¥110.95 (up ¥0.04 from previous year) and ¥128.46 (down ¥1.21 from previous year) respectively. It was against this backdrop that for a second year running demand in Ricoh’s mainstay office equipment business was down slightly in developed nations but expanded in emerging markets. While demand again decreased for A3 multifunctional printers (MFPs), which accounted for 80% of demand on a revenue basis, demand for A4 models likely rose in developed and emerging nations. Consumables revenue was likely down slightly in developed countries but up in emerging markets owing to expanding hardware demand. Demand for information technology (IT) services grew solidly amid rising demand worldwide for office IT systems. Results for the Year We rolled out our Ricoh Ignite growth strategy in this second year of our 19th Mid-Term Management Plan. Efforts to ensure future expansion encompassed increasing profitability in the core Office Printing field while developing new businesses that could ultimately become key areas. At the same time, we reviewed our business management structure to build operational underpinnings for our overall growth strategies. We also stepped up business selectivity and reformed corporate governance while marshalling all employees in the drive to overhaul our business processes. In core businesses, we reassessed our copier and MFP sales and maintenance services structure and business processes, integrated or closed production sites, and narrowed our model development focus. We also deployed robotic process automation to help enhance business processes. Such efforts bore considerable fruit, driving a major turnaround of profitability in Office Printing. On the growth business front, we continued to steadily expand Office Services earnings and invested strategically to secure resources for operational expansion in the Industrial Printing and Other field. Business selectivity efforts included transferring shares in subsidiary Ricoh Logistics System Co., Ltd., (hereafter Ricoh Logistics System) to a partner whose main business is logistics, the goal being to strengthen supply chain management through collaboration with that partner. Consolidated sales for fiscal 2018 decreased 2.4%, to ¥2,013.2 billion. Sales would have decreased by 2.1% as compared to the previous corresponding period. This decline was despite gains in the Office Services, Industrial Printing and Thermal, which are growth fields, and reflected lower hardware and related consumables revenues, principally overseas from paring down deals as part of a strategic emphasis on profitable sales. Other factors in lower sales included the adoption of equity method accounting for consolidated semiconductor and logistics subsidiaries whose shares we transferred and the removal from consolidation of Ricoh India Limited (hereafter Ricoh India). Consolidated sales would have been basically unchanged after excluding the impact of these factors. In Japan, sales were up from a year earlier on steady growth, particularly in Office Services, reflecting expanded demand for IT equipment as companies overhauled work practices and higher revenues in such areas as industry solutions services. As a result, sales in the domestic market increased by 0.7% as compared to the previous corresponding period. Sales in the Americas, Europe, the Middle East, and Africa declined because of Office Printing downturns that overshadowed growth in Office Service and Commercial Printing. Sales in Americas decreased by 1.8% (a decrease of 1.8% excluding foreign currency exchange fluctuations) and sales in Europe, Middle East and Africa decreased by 3.9% (a decrease of 3.0% excluding foreign currency exchange fluctuations). Sales in Other regions, which includes China, South East Asia and Oceania, were off owing to an Office Printing drop and a decrease in Office Services from the removal from consolidation of Ricoh India. As a result, sales in Other regions decreased by 13.1% (a decrease of 11.9% excluding foreign currency exchange fluctuations). As a result, sales in the overseas market decreased by 4.4% as compared to the previous corresponding period. Excluding effects of foreign currency fluctuations, sales in overseas would have decreased by 3.9% as compared to the previous corresponding period. Gross profit was down 3.0%, to ¥766.8 billion. This was despite an improvement in Office Services. A prime factor was a decrease in Office Printing because of the impact of sales reforms implemented in the previous year, lower sales from emphasizing more profitable business deal sales, and a sales drop ahead of new MFP model launches. The changes to equity-method accounting for some consolidated subsidiaries and the removal from consolidation of Ricoh India detracted from earnings in Other segment. There were also downturns in the Industrial Printing and Thermal amid a deteriorating market climate in China. Selling, general and administrative expenses fell 9.6%, to ¥702.9 billion. This stemmed from progress in constraining expenditure through structural and business process reforms. We posted ¥19.3 billion in structural reform expenses in fiscal 2018. Structural reforms proceeded swiftly, generating savings of ¥46.9 billion. We progressed ahead of schedule in our drive to save ¥100.0 billion from structural reforms in fiscal 2017 through 2019. As a result of deciding that the credits of Ricoh India which Ricoh has at the end of the period are likely to become uncollectible, Ricoh has booked additional losses of 14.9 billion yen. Other income plunged from a year earlier owing to the transfer of Ricoh Logistics System sales. Impairment of goodwill decreased considerably, from impairment of goodwill of the previous corresponding period of ¥145.8 billion. Ricoh therefore posted ¥86.8 billion in operating profit. (Operating loss of the previous corresponding period was ¥115.6 billion). After excluding structural reform expenses, one-time income, and other transient factors, operating profit would have been ¥105.1 billion, underscoring solid progress in effectively reinforcing profitability from a year earlier. Interest expense and the foreign exchange loss were lower than a year earlier, reducing finance costs. Ricoh posted ¥83.9 billion in profit before income tax expenses (Loss before income tax expenses of the previous corresponding period was ¥124.1 billion). As a result of these factors, profit attributable to owners of the parent was ¥49.5 billion. (Loss attributable to owners of the parent of the previous corresponding period was ¥135.3 billion). Comprehensive income increased as compared to the previous corresponding period, to ¥36.1 billion due to a decrease of exchange differences on translation of foreign operations. (Comprehensive loss of the previous corresponding period was ¥112.4 billion.)

6
* Review by Business Segment Office Printing Under the 19th Mid-Term Management Plan, we have focused away from sales toward profitability in this business while strategic transforming and optimizing our structure and boosting profitability to generate new value. In January 2019, we launched the RICOH IM C series of advanced MFPs. We keep these systems constantly up to date based on a smartphone concept of remotely updating firmware and software after installation. Another benefit is that customers can use the large touch panels on their machines to choose and install corporate workflow support services. This setup enables small and medium-sized enterprises to use employ more information technology in their businesses by making it simple for them to use cloud services. Office Printing sales for the year declined 5.0%, to ¥1,086.4 billion. This was largely because we strategically prioritized profits over sales in negotiating deals, lowering hardware and consumables revenues, particularly overseas. Segment operating profit was ¥117.9 billion, from an operating loss of ¥44.3 billion a year earlier. One factor in this turnaround was the absence of the previous year’s impairment of goodwill and non-current assets. Other key contributors were sales price optimization from a profitability focus and lower operating expenses owing to structural reforms. Office Service Here, we pursue business growth by enhancing the value we offer customers, notably by leveraging our global customer base to deliver solutions services that support work practice reforms. In fiscal 2018, we captured IT demand from small and medium-sized enterprises while streamlining operations, stepping up efforts to form business and capital alliances. We endeavor to expand the value we offer in several ways. One is that we draw on our strengths in the office space to provide services that transform enterprise workflows and communications. Others are that we digitize tasks to connect workflows between companies or extend them to frontline operations. Office Services sales for the year advanced 7.5%, to ¥481.3 billion. This growth reflected gains in Japan, where demand expanded for IT equipment in line with enterprise work practice reforms and revenues grew for industry and business solutions and IT services. Overseas, we expanded customer business support services, including for document management services in the Americas. Segment operating profit was ¥14.7 billion, from an operating loss of ¥25.6 billion a year earlier. This improvement was due to higher sales and profitability improvements and the absence of impairment of goodwill and non-current assets in the previous term. Commercial Printing We expect this market to grow on the strength of the high image quality and productivity and broad paper support of our offerings and a rising need for systems that can deliver high-value-added printed materials that open doors to new business opportunities. We aim to expand our business by catering to such customer needs in commercial printing while helping customers to develop their businesses. During the year, we released the RICOH Pro C9210 series and the RICOH Pro VC70000 series of strategic products for digital and on-demand needs among commercial printing customers. The RICOH Pro 9210 series delivers production machine essentials as our flagship commercial printing model. Its image quality is comparable to that of offset printers. It also automates color and image position adjustments, thus saving labor while stabilizing print quality. The RICOH Pro VC70000 series increases customer value by delivering outstanding productivity, broadens applications with its high image quality, and is easy to install because of its compactness and low initial costs. Commercial Printing sales for the year were down 0.3%, to ¥185.2 billion. This was because revenue downturns in the first half of the year during product cycle transitions outweighed a sales acceleration in the second half from demand for new products. Segment operating profit increased 8.1%, to ¥27.2 billion, however, on new product sales growth, higher demand for consumables and Selling, general and administrative expenses decrease. Industrial Printing In this segment, we seek to capture new markets and customers based on our robust position in inkjet heads that offer superior durability and are compatible with an array of inks. We believe that we can generate new value by drawing on our printing technologies, good examples being additive manufacturing and bioprinting in 3D printers. In fiscal 2018, we pushed ahead with acquisitions and capital alliances based on our growth strategies. We reinforced our software technology capabilities in acquiring ColorGATE Digital Output Solutions GmbH. We also bought LAC Corporation to secure high-viscosity ink coating technology. Industrial Printing sales for the year rose 7.8%, to ¥20.6 billion. While Sino-American trade friction braked inkjet head sales in the Chinese market, sales of key inkjet head offerings expanded solidly in Europe and the United States. In industrial printers, which we have positioned as a new growth area, we increased sales worldwide. Segment operating loss was ¥7.1 billion, however, as inkjet head sales dwindled in China, the largest market for these offerings. Other important factors were higher product development expenses to fuel business growth and impairment of goodwill and non-current assets. (Operating loss of the previous corresponding period was ¥2.2 billion.) Thermal Media Demand has risen solidly in this segment on growth in e-commerce, which has driven demand growth worldwide for shipping labels. It is against this backdrop that we have drawn on the materials technologies that we has amassed over the years to steadily expand our business, notably by supplying thermal paper, ribbons, and other products that ensure outstanding resistance to heat and abrasion resistance and delivery superior print definition and storage capabilities. We have also endeavored to broaden new value through such offerings as our proprietary rewritable contactless laser system. Thermal Media sales for the year advanced 8.0%, to ¥66.3 billion, on steady growth in Japan and abroad. Segment operating profit decreased 15.7%, to ¥4.2 billion, however, as raw materials cost hikes increased operating expenses. Other This segment encompasses the Industrial Products business, which focuses on the automotive sector, and the Smart Vision business, which focuses on the real estate sector. This segment is expanding its customer base by drawing on our strengths in capturing and image processing technologies to supply optical devices. In Smart Vision, we launched the THETA 360.biz official partner program. Our application for virtual property tours has expanded business applications for our 360° camera and has been very well received. The Other segment also covers finance business operated by affiliates. Other segment sales for the year declined 15.5%, to ¥173.0 billion. This reflected the change to equity method accounting for consolidated semiconductor and logistics subsidiaries whose shares we transferred. In the absence of such a change to equity method accounting, revenues would have increased, including from steady growth in the domestic finance business and expanded Industrial Products sales of optical modules to the automotive sector. Segment operating profit increased 72.5%, to ¥17.3 billion, a prime driver being a gain on sales of shares in Ricoh Logistics System.

7
(2) Financial Position Assets, Liabilities, and Equity at Year-End
(Billions of yen) March 31, 2018 March 31, 2019 Change Total assets 2,641.0 2,725.1 84.1 Total equity 988.7 1,018.9 30.2 Equity attributable to owners of the parent 909.5 932.5 23.0 Equity attributable to owners of the parent ratio (%) 34.4 34.2 -0.2 points Total assets rose ¥84.1 billion from the close of fiscal 2017, to ¥2,725.1 billion. Other investments declined in line with a planned divestment of shares in Coca-Cola Bottlers Japan Holdings Inc., while cash and cash equivalents increased owing to the transfer of shares in Ricoh Logistics System. Inventories were higher, reflecting initial stockpiling for MFPs launched in the fourth quarter and additions to available supplies of consumables to cover the impact of Sino-American trade friction and the prospective exit of the United Kingdom from the European Union. As leased assets rose on the ongoing expansion of the finance business, particularly in Japan, other financial assets increased. Total liabilities were up ¥53.8 billion, to ¥1,706.1 billion. Bonds and borrowings were up from a year earlier, as we repaid long-term debt that had matured and undertook extensive reborrowing. Another factor was that debt of affiliated companies increased with finance business expansion. Retained earnings were up from the end of the previous year as a result of higher profits and changes in accounting policy. Equity attributable to owners of the parent therefore advanced ¥23.0 billion, to ¥932.5 billion. The equity attributable to owners of the parent ratio was again stable, at 34.2%. Ricoh aims to materialize new growth businesses by strengthening profitability in core businesses and investing extensively while pursuing returns that exceed capital costs to sustainably enhance corporate value. Under the 19th Mid-Term Management Plan, which ends in fiscal 2019, it is a top priority to use shareholders’ equity in running our business, and while carefully investing in growth strategies that lift corporate value over the medium and long terms we seek to boost capital efficiency. Return on equity (ROE) is a key performance indicator. Our ROE target for this final year of our 19th Mid-Term Management Plan is 6.9%. We look to lift our ROE to more than 9.0% by fiscal 2022, the final year of the successor plan. In fiscal 2018, the second year of our current mid-term management plan, we endeavored to raise ROE to more than 5.0%. Profit attributable to owners of the parent increased well beyond our initial forecast, as we strengthened profitability in core businesses and generated growth in new businesses while bearing fruit from structural reform efforts earlier than planned. Our ROE for the year thus exceeded our target, at 5.4%. (3) Cash flows
(Billions of yen) March 31, 2018 March 31, 2019 Change Cash flows from operating activities 110.2 81.9 -28.3 Cash flows from investing activities -81.0 -45.9 35.1 Cash flows from financing activities 6.4 42.4 36.0 Cash and cash equivalents at end of year 160.5 240.0 79.5 Ricoh aims to transform its business structure and generate growth over the medium and long terms by bolstering the profitability of core businesses to produce cash, using that cash to invest extensively in new businesses. In fiscal 2019, the final of three years under the 19th Mid-Term Management Plan, we target a free cash flow excluding the finance business of ¥100.0 billion for the three years of that initiative. The three-year free cash flow excluding the finance business under the next plan, ending fiscal 2022, is ¥250.0 billion. At the end of fiscal 2018, net cash provided by operating activities was ¥81.9 billion, down ¥28.3 billion. A key factor was a major earnings turnaround that stemmed from a profitability gain in the core Office Printing segment and higher income in the Office Services and other growth segments. Inventories increased from a year earlier. This reflected initial stockpiling for MFPs launched in the fourth quarter and additions to available supplies of consumables to cover the impact of Sino-American trade friction and the prospective exit of the United Kingdom from the European Union. Net cash provided by operating activities was down from a year earlier, as an increase in inventories offset higher profit. Net cash used in investing activities was ¥45.9 billion, down ¥35.1 billion. This reduction reflected income from transfers of shares in subsidiaries as a result of structural reform activities, which offset the impacts of capital investments to expand and upgrade production facilities, ongoing investments in information technology, and acquisitions to drive growth. Free cash flow (net cash provided by operating activities plus net cash used in investing activities) totaled ¥36.0 billion, up 6.8 billion, reflecting greater business profitability from structural reform initiatives and operational reviews. Free cash flow excluding the finance business was ¥85.4 billion. Consequently, we produced ¥151.3 billion in free cash flow excluding the finance business in the first two years of our current mid-term management plan, so we are well positioned to exceed or match the ¥100.0 billion targeted by the end of fiscal 2019. Net cash provided by financing activities was ¥42.4 billion, up ¥36.0 billion. On the liabilities front, we repaid long-term debt that had matured and undertook extensive reborrowing. On top of that, debt of affiliated companies increased with finance business expansion. We paid cash dividends as initially planned in light of results, cash flows, and growth investments. As a result of the above factors, cash and cash equivalents at the end of year were ¥240.0 billion, up ¥79.5 billion from a year earlier. (Reference) Cash Flow Indices
Year ended
March 31, 2016 Year ended
March 31, 2017 Year ended
March 31, 2018 Year ended
March 31, 2019 Equity attributable to owners of the parent / Total assets 38.8% 37.8% 34.4% 34.2% Market capitalization / Total assets 29.9% 24.1% 28.8% 30.8% Interest bearing debt / Operating cash flow 8.5 9.7 8.0 11.4 Operating cash flow / Interest expense 15.7 12.8 18.8 17.3
Notes: i. All indices are calculated based on consolidated data. ii. Operating cash flows is shown in consolidated statement of cash flow. Interest bearing debt includes all debt in which a fee is charged for the liability.

8
(4) Forecast for the coming fiscal year In fiscal 2017, the first year of the 19th Mid-Term Management Plan, we undertook Ricoh Resurgent initiatives that focused on structural reforms. In fiscal 2018, we embarked on the Ricoh Ignite growth strategy, with initiatives putting us on track for progress in the years ahead. In fiscal 2019, the final year of our current mid-term management plan and the second year of Ricoh Ignite, we will continue striving to strengthen the profitability of core businesses while increasing earnings from growth areas. In progressing toward Ricoh Take Off from fiscal 2020, we will continue to overhaul our business structure by implementing growth strategies, reforming corporate governance, and rolling out measures to enhance capital returns. Our performance forecast for fiscal year ending March 31, 2020 is as follows: Exchange Rate Assumptions for the full year ending March 31, 2020 US$ 1 = ¥110.00 (¥110.95 in previous fiscal year) EURO 1 = ¥125.00 (¥128.46 in previous fiscal year)
(Billions of yen)
Year ended March 31, 2019
Year ending March 31, 2020
(Forecast) Change Domestic sales 805.7 810.0 0.5% Overseas sales 1,207.4 1,200.0 -0.6%
Sales 2,013.2 2,010.0 -0.2% Gross profit 766.8 780.0 1.7% Operating profit 86.8 100.0 15.2% Profit before income tax expenses 83.9 98.0 16.7% Profit attributable to owners of the parent 49.5 62.0 25.2%
* The results forecasts and forward-looking statements included in this document are based on information available to the Company as at the date and certain assumptions that the Company considers reasonable. The Company makes no guarantees with respect to the achievement of its results forecasts or forward-looking statements. Actual results might be significantly different from the forecasts in the document, depending on various factors. Factors which may affect the actual business results include but are not limited to the economic situation in the geographic areas where Ricoh conducts business, including Japan, the Americas, Europe, Middle East, Africa, China and Asia, market environment, and currency exchange rates.
(5) Dividend Policy With regard to shareholder returns, we believe it is important to increase shareholder returns through sustainable growth that yields medium- to long-term stock price increases and stable dividends. To this end, we are working to increase profits through strategic investments for sustainable growth. We will make efforts to provide stable dividends aiming for a consolidated payout ratio of 30%, and will make final decisions by taking into comprehensive consideration our profit forecast, investment plans, and financial strength with an awareness of ratings, etc. The total dividend per share for the fiscal year ended March 31, 2019 will be ¥23.00. Taking consideration of forecast for the coming fiscal year and stable dividend, the total dividend per share for the fiscal year ending March 31, 2020 will be ¥26.00, increased by ¥3.00 as compared to previous corresponding period.

9
(6) Issues to be resolved
Changing Times
The Ricoh Group has grown with its customers since its founding in 1936 by supplying innovative products and services around the globe. We formulated the Ricoh Way based on our Founding Principles of Love your neighbor, Love your country, Love your work, as our corporate philosophy and guide to our decisions and activities. Our mission commits us to providing excellence to improve the quality of living and to drive sustainability. We have grown over the years by developing ground-breaking products and services while building an industry-leading sales and maintenance structure, deepening our relationships with customers everywhere. Customer value perceptions and demand patterns have changed dramatically, however, amid advances in digital technology and rapid technological innovations. There have been two pivotal trends on top of that. First, companies face growing pressure to help resolve social issues. No matter how profitable they may be, businesses that fail to help materialize Sustainable Development Goals* cannot hope to build their marketplace reputations or generate sustainable growth. Second, the lifestyles and values of individuals have diversified considerably. The Internet of Things and other advances have removed constraints on where people work, driving the acceleration of personalized work practices. Such changes in the operating climate have made it a pressing challenge to overhaul existing systems and business processes to align them with future business environments. Ricoh recognizes the need to transform itself for tomorrow. *Sustainable Development Goals In September 2015, the United Nations Summit adopted 17 Sustainable Development Goals and 169 targets as part of a universal agenda to ensure that nobody is left behind in the drive to free humanity from poverty and hunger and improve the human condition in such respects as health, sanitation, economic development, and the environment by 2030.
From Resurgent to Ignite
Following the global financial crisis of 2008, Ricoh failed to fully address the business climate changes described above, and its performances long languished. The resulting concerns prompted management to formulate the 19th Mid-Term Management Plan to transform the Ricoh Group over three years starting in fiscal 2017. Under this initiative, we rolled out Ricoh Resurgent in 2017 to do away with our long-held strategy of prioritizing market share and machine-in-field expansion and embark on efforts to overhaul our cost structure and boost the profitability of our office products and services. At the same time, we focused on growth areas that based on the Ricoh Group’s strengths, investing for the future and enhancing our management systems. In February 2018, we announced Ricoh Ignite as our growth strategy through fiscal 2019. The Group has accordingly embarked on materiality efforts encompassing five elements. In formulating our growth strategies, we established five materialities (to create knowledge, enhance productivity, improve the quality of life, decarbonize economies, and materialize circular economies) in recognition of our need as corporate entity to balance social issue resolution and business. We have undertaken business initiatives to contribute to progress in these five materialities and help attain Sustainable Development Goals while enhancing the Ricoh Group’s corporate value. We formulated growth strategies #0, #1, and #2 to leverage our strengths under Ricoh Ignite. Growth Strategy #0 entails expanding customer value in our core Office Printing domain and streamlining operations to become more profitable. Under Growth Strategy #1, we are combining the optical, image processing, mechanical, electrical, chemical, control, and other technologies that we have amassed in core businesses over the years to broaden the value that printing can provide. Growth Strategy #2 is about drawing on our base of 1.4 million corporate customers worldwide to cultivate fields that can become new earnings sources. By implementing these strategies and reaching its goals, the Ricoh Group seeks to deliver value in everything from regular offices to various industries and frontline sites. We accordingly created a unified global value proposition, called EMPOWERING DIGITAL WORKPLACES, which defines how we bring value to our customers. We are committed to smarter workplaces. We will deliver true value by collaborating with customers to transform workplaces through technology and service innovations. We will help resolve social issues through business by extending our efforts to society.
Preparing for Ricoh Take Off
Under the 19th Mid-Term Management Plan, we have progressed through the Resurgent and Ignite stages to strengthen profitability in core businesses and expand new businesses. For fiscal 2019, the final year of this plan, we target ¥2,200 billion in sales, ¥100 billion in operating profit, a return on equity of 6.9%, and free cash flow excluding the finance business of ¥100 billion (aggregate for fiscal 2017 through 2019). Under the next mid-term management plan starting in fiscal 2020, which is the Take Off phase, our targets for fiscal 2022 are ¥2,300 billion in sales, ¥185 billion in operating profit, a return on equity of more than 9.0%, and free cash flow excluding the finance business of ¥250 billion (aggregate for fiscal 2020 through 2022). We aim to expand in three growth areas and transform our business structure. In fiscal 2016, Growth Strategy #0 businesses (Office Printing) accounted for 53% of sales, with Growth Strategy #1 businesses (Commercial Printing, Industrial Printing, and Thermal) contributing 12% and Growth Strategy #2 businesses (Digital Business, Office Services, Industrial Products, and Smart Vision) representing 24%. Growth Strategy #0 businesses should account for 45% of sales in fiscal 2019, with businesses under Growth Strategy #1 and Growth Strategy #2 representing 17% and 27%, respectively. By fiscal 2022, the proportions should be 39% under Growth Strategy #0, 20% under Growth Strategy #1, and 31% under Growth Strategy #2. We are driving these transitions by strategically investing a total of ¥100 billion in Strategy #1 and Growth Strategy #2 businesses through fiscal 2019.
Progress during Two Years of 19th Mid-Term Management Plan and Preparations for Ricoh Take Off
In fiscal 2017, the first year of the 19th Mid-Term Management Plan, Ricoh Resurgent encompassed basic policies of undertaking structural reforms, emphasizing growth businesses, and strengthening management systems, focusing on structural reforms to eliminate all growth impediments to new growth. In our core Office Printing business in particular, we transitioned away from expanding sales to become more profit centric. We accordingly focused on changing our structure and normalizing fixed and other costs. We also integrated and shut down operations to enhance asset efficiency, stepped up business selectivity, and accelerated profitability improvements. In fiscal 2018, we greatly improved business profitability on the back of structural reforms that we initiated in the previous fiscal term. It was also in fiscal 2018 that we embarked on the Ricoh Ignite growth strategy, undertaking initiatives that put us on track for progress in the years ahead. In the core Office Printing business, in which profitability was a key focus, we made progress in strengthening profitability by managing prices and cutting fixed costs. In the Office Services business, we continued to steadily expand operations in Japan and abroad while rebuilding our sales structure and integrating or shutting down services sites. We thereby dramatically improved earnings and drove profits for the Ricoh Group overall.
10
Structural Reforms Bearing Fruit
In fiscal 2018, we continued to undertake structural forms that would properly position our copier and MFP sales and maintenance structures and business processes for the current and future business climates. In logistics, for example, we transferred our shares in subsidiary Ricoh Logistics System Co., Ltd., to SBS Holdings Co., Ltd., which focuses on logistics services. The logistics industry faces numerous challenges, notably growth in shipping volumes from the evolution of e-commerce and chronic labor shortages. After exploring ways to optimally reinforce Group logistics capabilities in view of this business climate, we concluded that we would be better off not going it alone in this area. We also undertook business process reforms, deploying robotics process automation domestically and abroad. These efforts enabled us to automate 60 processes in-house, saving 16,000 man-hours annually. We will continue pursuing progress in this area in fiscal 2019, reviewing and automating our operations. Under the 19th Mid-Term Management Plan, we sought to save a total of ¥100 billion from structural reforms during fiscal 2017 through 2019. We made some progress in that regard in fiscal 2017, undertaking relentless efforts to normalize fixed and other costs. We thereby generated structural reform savings of ¥88.5 billion by fiscal 2018.
Ricoh Ignite Growth Strategy Initiatives
In fiscal 2018, we entered the full-fledged implementation phase for the three growth strategies of Ricoh Ignite, undertaking a range of initiatives to expand our business. On top of that, we have explored new areas to create businesses that could help resolve social issues in the years ahead. Growth Strategy #0: Building the strongest possible foundations for our business Under this strategy, we are endeavoring to reinforce the profitability of our core Office Printing business. In fiscal 2018, we continued efforts from the previous year to systematically streamline operations while generating added value by combining price management and solutions to thereby boost profits on each business deal. To streamline operations, we eschewed the notion of doing everything in-house, narrowing down the number of models under development and outsourcing production to significantly enhance quality and cost competitiveness. We also set about reducing costs, so while Office Printing sales were down from a year earlier in fiscal 2018, we were able to increase operating profit from that business area. The RICOH IM C series of advanced MFPs that we launched in January 2019 stay constantly up to date based on smartphone-style remote updates of firmware and software after installation. Another benefit is that customers can use large touch panels on their machines to choose and install corporate workflow support services. This setup enables small and medium-sized enterprises to use employ more information technology in their businesses by simplifying the use of cloud services. Our MFPs also incorporate features to predict the service lives and possible failures of replaceable parts, thereby reducing equipment downtimes and helping streamline maintenance service operations. While revenues in the Office Printing business will probably continue to decline somewhat in developed nations, we expect demand to keep growing for color and A4 MFPs. It is against that backdrop that we will accelerate efforts to streamline all of our operations throughout the supply chain, from development through production, sales, and maintenance services. On top of that, we will further evolve our MFPs and provide products and services that anticipate changes in customer information technology and environments, such as in cloud computing, thereby establishing a new earnings platform. Growth Strategy #1: Driving industrial innovations through printing technologies We have amassed myriad printing technologies in our core businesses, notably in the electric photography, inkjet, and thermal areas. We will draw on these technologies to expand the scope of value that we deliver to customers beyond the office arena. In the Commercial Printing business, we envisage that demand will expand for printing on demand and digitization in analog printing, principally in offset processes. Because we anticipate that increases in the number of machines in field will drive earnings expansion, we have positioned Commercial Printing as vital to our profitability. We rolled out several highly competitive new models in April 2018. Nonetheless, sales in North America, our largest market for such machines, declined owing to inventory adjustments for preceding models. Sales have been favorable since the end of fiscal 2018, however, and we look to expand sales in fiscal 2019 by highlighting the on-demand printing advantages that digital technology can uniquely deliver. The environmental impacts of what are largely analog textile printing processes have become a social issue worldwide. Our Industrial Printing business can draw on our strengths in industrial inkjet technology to deliver digital printing solutions and thereby contribute to greater safety and reliability in the clothing, food, and housing environments. In fiscal 2018, we pushed ahead with acquisitions and capital alliances to compensate for internal capability shortfalls as our business expands. We will continue to invest in contributing to earnings in the years ahead. Our Thermal business should continue to expand solidly in view of growing demand worldwide for thermal labels used in displaying raw materials information and for shipping labels used in a growing Internet shopping market. In fiscal 2018, we increased sales and secured operating profit despite rising raw materials costs. We raised production capacity in North America and Europe to position ourselves for demand growth in the years ahead. We are building a new business structure, notably through fast laser printing systems that enable direct rewriting of labels on products as they progress through production lines. We will continue to cultivate new potential for printing in and beyond such display printing areas. Such efforts will encompass additive manufacturing that applies inkjet technology and bioprinting and other functional printing. In fiscal 2018, we pushed ahead with developing DNA standard substance manufacturing techniques employing bioprinting technology and new secondary battery production techniques that leverage inkjet technology. Growth Strategy #2: Generating value that links offices and frontlines In the Office Services business, we have captured IT investment demand among small and medium-sized enterprises while streamlining operations. We have undertaken business and capital alliances to build capacity for our business expansion. In our mainline office area, we have transformed workflows and communications in regular offices while extending our focus to business-to-business workflows and frontline needs in delivering value for digitizing site work. We will broaden the value we deliver by offering workflows that link offices and frontline tasks. Cloud-based work solutions that we provide through the RICOH IM C series are available under the RICOH Smart Integration platform. We will reinforce this platform and enhance work solutions in driving the Office Services business forward. Drawing on our strengths in capturing and image processing technologies are the Industrial Products business, which focuses largely on the automotive sector, and the Smart Vision business, which is building a customer base in the real estate industry. In the Industrial Products business, we have greatly expanded sales our stereo cameras used in automotive safety support systems. The Theta 360.biz service of the Smart Vision business has broadened the applications of our 360° cameras, and our virtual property tour application has won high regard in the marketplace. In the years ahead, we will strengthen ties with the RICOH Smart Integration platform that provides services for these businesses, expanding the number of users and making the platform even more attractive. Cultivating New Potential: Employing Ricoh’s Core Competence to Resolve Social Issues We will cultivate new businesses to ensure that we can grow over the medium and long terms. We are broadening our presence in the healthcare field by leveraging our image and data processing technologies to support the treatment of nervous system illnesses. Contributions

11
include magnetoencephalographs and spirographs and DNA standard plates that result from applying inkjet technology to precisely eject live cells. Also using our inkjet technology is the additive manufacturing (3D printing) business, through which we provide modeling services and simple prototype production to manufacturers. By materializing small lot, multi-product manufacturing at low costs, we are exploring ways to overhaul conventional manufacturing processes based on mass production approaches using molds and plates.
Corporate Governance Reforms Underpinning Our Growth Strategies
Under our 19th Mid-Term Management Plan, we have endeavored to reinforce the corporate governance underpinning our efforts to create value and drive sustainable growth. In fiscal 2017, we reviewed director terms, strengthened evaluations of the president and directors, reassessed our advisor system, and strengthened CEO succession planning. In fiscal 2018, we reviewed CEO and director appointments and dismissals by deploying two-stage evaluations every year from the perspectives of objectivity, timeliness, and transparency. Our assessments encompass major financial and nonfinancial benchmarks, as well as such investor indicators as total shareholder returns. We have additionally resolved to deploy a performance-based stock compensation plan for directors, subject to approval at an Ordinary General Meeting of Shareholders, to align the interests of directors and shareholders in building corporate value over the medium and long terms.
Ensuring a Capital Profitability Improvement-Aware Management
The Ricoh Group values stakeholder trust, and is endeavoring to sustainably enhance corporate value. It is in keeping with that approach that we aim to generate returns that exceed the cost of capital by identifying our capital costs and implementing the proper capital policies. One key benchmark is the return on equity targets that we set under the 19th Mid-Term Management Plan ending in fiscal 2019. We accordingly embarked on management reforms to further enhance capital efficiency. In fiscal 2018, we set up the investment committee to evaluate our capital efficiency while verifying the investment plans we use in our decision-making structure. We are working on deploying a specific framework for undertaking companywide PDCA cycles to drive returns on invested capital (ROIC) targets that exceed the capital costs that we have identified, in fiscal 2019, we will launch an in-house trial. Materializing Sustainable Growth
In fiscal 2018, we generated ¥2,013.2 billion in sales, ¥86.8 billion in operating profit, a return on equity of 5.4%, and ¥85.4 billion in free cash flow excluding the finance business. Our sales were lower than the initial target because of the impact of business selection, changes in the operating climate, and changes in accounting practices. At the same time, we lifted our operating profit and return on equity in view of progress in strengthening the profitability of core businesses, increasing earnings from growth businesses, and generating results from structural reforms. After excluding structural reform expenses, one-time income, and other transient factors, operating profit would have been ¥105.1 billion, underscoring solid progress in effectively reinforcing profitability from fiscal 2017. In fiscal 2019, the final year of our current mid-term management plan, we will continue striving to strengthen the profitability of core businesses while increasing earnings from growth areas. For the year, we target ¥2,010 billion in sales, ¥100 billion in operating profit and a return on equity exceeding 6.5%. While sales would not exceed initial targets, operating profit would exceed initial targets under the 19th Mid-Term Management Plan. We will continue to striving to archive a return on equity 6.9% which is a target of fiscal 2019 under the 19th Mid-Term Management Plan. We targeted ¥100 billion in free cash flow excluding the finance business for the entire three years of this mid-term management plan. We produced ¥151.3 billion in such cash flow in the first two years of that plan, and will continue endeavoring to generate cash to fund investments in growth businesses. In progressing to reach Ricoh Take Off, our next stage of change, we will continue to overhaul our business structures by implementing our growth strategies, reinforce corporate governance, and rollout measures to enhance capital returns, thereby sustainably enhancing corporate value.
2. Basic policies in selecting accounting policies
Ricoh has decided on voluntary adoption of IFRS from fiscal year ended on March 31, 2014 as Ricoh concluded that an implementation of IFRS as a global standard and unifying accounting standards across the group will enable Ricoh to enhance accuracy for the management of the entire group.

12
3. Consolidated Financial Statements (1) Consolidated Statement of Financial Position Assets
(Millions of yen) March 31, 2018 March 31, 2019 Change Current Assets Cash and cash equivalents 160,568 240,099 79,531 Time deposits 68 70 2 Trade and other receivables 589,741 604,804 15,063 Other financial assets 291,144 294,351 3,207 Inventories 180,484 207,748 27,264
Other investments 55,921 - -55,921 Other current assets 50,052 40,107 -9,945 Subtotal 1,327,978 1,387,179 59,201
Assets classified as held for sale - 2,583 2,583 Total Current Assets 1,327,978 1,389,762 61,784 Non-current assets Property, plant and equipment 250,005 250,287 282 Goodwill and intangible assets 217,130 219,806 2,676 Other financial assets 689,629 708,295 18,666 Investments accounted for using the equity method 3,703 12,521 8,818 Other investments 26,985 22,443 -4,542 Other non-current assets 36,806 38,006 1,200 Deferred tax assets 88,794 84,012 -4,782 Total Non-current Assets 1,313,052 1,335,370 22,318 Total Assets 2,641,030 2,725,132 84,102
Liabilities and Equity
(Millions of yen) March 31, 2018 March 31, 2019 Change Current Liabilities Bonds and borrowings 223,194 266,957 43,763 Trade and other payables 300,724 306,189 5,465 Other financial liabilities 453 521 68 Income tax payables 17,871 15,455 -2,416 Provisions 12,235 12,277 42 Other current liabilities 234,045 242,799 8,754 Total Current Liabilities 788,522 844,198 55,676 Non-current Liabilities Bonds and borrowings 658,707 666,462 7,755 Other financial liabilities 3,788 3,420 -368 Accrued pension and retirement benefits 104,998 105,288 290 Provisions 12,709 6,610 -6,099 Other non-current liabilities 80,174 77,619 -2,555 Deferred tax liabilities 3,377 2,547 -830 Total Non-current Liabilities 863,753 861,946 -1,807 Total Liabilities 1,652,275 1,706,144 53,869 Equity Common stock 135,364 135,364 - Additional paid-in capital 186,463 186,086 -377 Treasury stock -37,329 -37,394 -65 Other components of equity 114,954 73,645 -41,309 Retained earnings 510,113 574,876 64,763 Equity attributable to owners of the parent 909,565 932,577 23,012 Non-controlling interests 79,190 86,411 7,221 Total Equity 988,755 1,018,988 30,233 Total Liabilities and Equity 2,641,030 2,725,132 84,102

13
(2) Consolidated Statement of Profit or Loss and Consolidated Statement of Comprehensive Income Consolidated Statement of Profit or Loss Year ended March 31, 2018 and 2019
(Millions of yen) Year ended
March 31, 2018 Year ended
March 31, 2019 Change % Sales 2,063,363 2,013,228 -50,135 -2.4 Cost of sales 1,272,357 1,246,345 -26,012 -2.0 Percentage of sales (%) 61.7 61.9 Gross profit 791,006 766,883 -24,123 -3.0 Percentage of sales (%) 38.3 38.1 Selling, general and administrative expenses 777,917 702,912 -75,005 -9.6 Percentage of sales (%) 37.7 34.9 Other income 17,062 23,449 6,387 37.4
Percentage of sales (%) 0.8 1.1 Impairment of goodwill 145,827 581 -145,246 -99.6 Percentage of sales (%) 7.1 0.0 Operating profit (loss) -115,676 86,839 202,515 - Percentage of sales (%) -5.6 4.3 Finance income 4,123 4,598 475 11.5 Percentage of sales (%) 0.2 0.3 Finance costs 12,831 7,965 -4,866 -37.9 Percentage of sales (%) 0.6 0.4 Share of profit (loss) of investments accounted for using the
equity method 202 492 290 143.6
Percentage of sales (%) 0.0 0.0 Profit (loss) before income tax expenses -124,182 83,964 208,146 - Percentage of sales (%) -6.0 4.2 Income tax expenses 5,457 28,587 23,130 423.9 Percentage of sales (%) 0.3 1.4 Profit (loss) -129,639 55,377 185,016 - Percentage of sales (%) -6.3 2.8 Profit (loss) attributable to: Owners of the parent -135,372 49,526 184,898 - Percentage of sales (%) -6.6 2.5 Non-controlling interests 5,733 5,851 118 2.1 Percentage of sales (%) 0.3 0.3
Year ended March 31, 2018
Year ended March 31, 2019 Change
Earnings per share attributable to owners of the parent-basic (yen) -186.75 68.32 255.07 Earnings per share attributable to owners of the parent-diluted (yen) - - -
* Gain on sales of non-current assets and shares of Ricoh Logistics System Co., Ltd were included in “other income”. * Gain arising from the removal from consolidation of Ricoh India Limited with loss of control, provision of allowance for doubtful accounts for receivable for Ricoh India Limited and others were included in “selling, general and administrative expenses”.

14
Three months ended March 31, 2018 and 2019 (Millions of yen)
Three months ended March 31,
2018
Three months ended March 31,
2019 Change % Sales 547,163 523,777 -23,386 -4.3 Cost of sales 350,101 331,963 -18,138 -5.2 Percentage of sales (%) 64.0 63.4 Gross profit 197,062 191,814 -5,248 -2.7 Percentage of sales (%) 36.0 36.6 Selling, general and administrative expenses 219,733 183,958 -35,775 -16.3 Percentage of sales (%) 40.2 35.1 Other income 4,788 385 -4,403 -92.0
Percentage of sales (%) 0.9 0.1 Impairment of goodwill 145,827 581 -145,246 -99.6
Percentage of sales (%) 26.7 0.1 Operating profit (loss) -163,710 7,660 171,370 - Percentage of sales (%) -29.9 1.5 Finance income 1,257 2,252 995 79.2 Percentage of sales (%) 0.2 0.4 Finance costs 5,045 2,830 -2,215 -43.9 Percentage of sales (%) 0.9 0.6 Share of profit (loss) of investments accounted for using the
equity method 151 -15 -166 -
Percentage of sales (%) 0.0 -0.0 Profit (loss) before income tax expenses -167,347 7,067 174,414 - Percentage of sales (%) -30.6 1.3 Income tax expenses -15,910 6,698 22,608 - Percentage of sales (%) -2.9 1.2 Profit (loss) for the period -151,437 369 151,806 - Percentage of sales (%) -27.7 0.1 Profit (loss) attributable to: Owners of the parent -152,707 -1,107 151,600 - Percentage of sales (%) -27.9 -0.2 Non-controlling interests 1,270 1,476 206 16.2 Percentage of sales (%) 0.2 0.3
Three months ended March 31, 2018
Three months ended March 31, 2019 Change
Earnings per share attributable to owners of the parent-basic (yen) -210.67 -1.53 209.14 Earnings per share attributable to owners of the parent-diluted (yen) - - -
* Gain on sales of non-current assets and others were included in “other income”. * Provision of allowance for doubtful accounts for receivable for Ricoh India Limited and others were included in “selling, general and administrative expenses”.
15
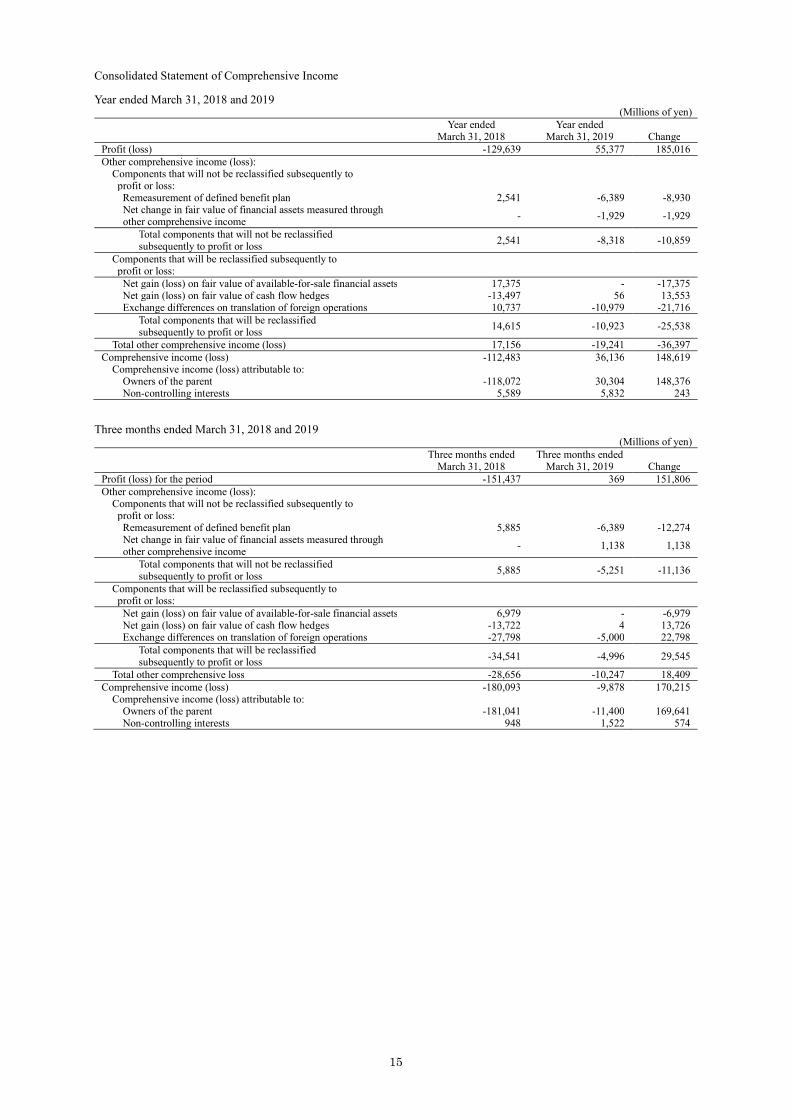
Consolidated Statement of Comprehensive Income Year ended March 31, 2018 and 2019
(Millions of yen) Year ended
March 31, 2018 Year ended
March 31, 2019 Change Profit (loss) -129,639 55,377 185,016 Other comprehensive income (loss):
Components that will not be reclassified subsequently to profit or loss: Remeasurement of defined benefit plan 2,541 -6,389 -8,930 Net change in fair value of financial assets measured through other comprehensive income - -1,929 -1,929
Total components that will not be reclassified subsequently to profit or loss 2,541 -8,318 -10,859
Components that will be reclassified subsequently to profit or loss:
Net gain (loss) on fair value of available-for-sale financial assets 17,375 - -17,375 Net gain (loss) on fair value of cash flow hedges -13,497 56 13,553 Exchange differences on translation of foreign operations 10,737 -10,979 -21,716
Total components that will be reclassified subsequently to profit or loss
14,615 -10,923 -25,538
Total other comprehensive income (loss) 17,156 -19,241 -36,397 Comprehensive income (loss) -112,483 36,136 148,619 Comprehensive income (loss) attributable to:
Owners of the parent -118,072 30,304 148,376 Non-controlling interests 5,589 5,832 243
Three months ended March 31, 2018 and 2019
(Millions of yen) Three months ended
March 31, 2018 Three months ended
March 31, 2019 Change Profit (loss) for the period -151,437 369 151,806 Other comprehensive income (loss):
Components that will not be reclassified subsequently to profit or loss:
Remeasurement of defined benefit plan 5,885 -6,389 -12,274 Net change in fair value of financial assets measured through other comprehensive income
- 1,138 1,138
Total components that will not be reclassified subsequently to profit or loss 5,885 -5,251 -11,136
Components that will be reclassified subsequently to profit or loss:
Net gain (loss) on fair value of available-for-sale financial assets 6,979 - -6,979 Net gain (loss) on fair value of cash flow hedges -13,722 4 13,726 Exchange differences on translation of foreign operations -27,798 -5,000 22,798
Total components that will be reclassified subsequently to profit or loss -34,541 -4,996 29,545
Total other comprehensive loss -28,656 -10,247 18,409 Comprehensive income (loss) -180,093 -9,878 170,215 Comprehensive income (loss) attributable to:
Owners of the parent -181,041 -11,400 169,641 Non-controlling interests 948 1,522 574

16
Consolidated Sales by Product Category Year ended March 31, 2018 and 2019
(Millions of yen) Year ended
March 31, 2018 Year ended
March 31, 2019 Change % <Office Printing> 1,144,053 1,086,428 -57,625 -5.0 Percentage of sales (%) 55.4 54.0 <Office Service> 447,973 481,392 33,419 7.5 Percentage of sales (%) 21.7 23.9 <Commercial Printing> 185,933 185,292 -641 -0.3 Percentage of sales (%) 9.0 9.2 <Industrial Printing> 19,200 20,692 1,492 7.8 Percentage of sales (%) 0.9 1.0 <Thermal Media> 61,458 66,368 4,910 8.0 Percentage of sales (%) 3.0 3.3 <Other> 204,746 173,056 -31,690 -15.5 Percentage of sales (%) 9.9 8.6 Grand Total 2,063,363 2,013,228 -50,135 -2.4 Percentage of sales (%) 100.0 100.0
Three months ended March 31, 2018 and 2019
(Millions of yen) Three months ended
March 31, 2018 Three months ended
March 31, 2019 Change % <Office Printing> 294,806 277,215 -17,591 -6.0 Percentage of sales (%) 53.9 52.9 <Office Service> 130,390 132,557 2,167 1.7 Percentage of sales (%) 23.8 25.3 <Commercial Printing> 48,136 50,145 2,009 4.2 Percentage of sales (%) 8.8 9.6 <Industrial Printing> 5,771 5,078 -693 -12.0 Percentage of sales (%) 1.1 1.0 <Thermal Media> 15,166 15,760 594 3.9 Percentage of sales (%) 2.8 3.0 <Other> 52,894 43,022 -9,872 -18.7 Percentage of sales (%) 9.7 8.2 Grand Total 547,163 523,777 -23,386 -4.3 Percentage of sales (%) 100.0 100.0
* Each category includes the following product line: Office Printing MFPs (multifunctional printers), copiers, laser printers, digital duplicators, wide format printers, facsimile machine, scanners, related parts and supplies, services, support and software Office Service Personal computers, servers, network equipment, related services, support, software and service
solutions related to documents Commercial Printing Cut sheet printers, continuous feed printers, related parts & supplies, services, support and software Industrial printing Inkjet heads, imaging systems and industrial printers Thermal Media Thermal media Other Industrial optical component/module, electronic components, precision mechanical component,
digital cameras, 3D printing, ECO, healthcare, financial services

17
Consolidated Sales by Geographic Area Year ended March 31, 2018 and 2019
(Millions of yen) Year ended
March 31, 2018 Year ended
March 31, 2019 Change % <Domestic> 799,904 805,799 5,895 0.7 Percentage of sales (%) 38.8 40.0 <Overseas> 1,263,459 1,207,429 -56,030 -4.4 Percentage of sales (%) 61.2 60.0 The Americas 577,559 567,442 -10,117 -1.8 Percentage of sales (%) 28.0 28.2 Europe, Middle East and Africa 477,554 458,856 -18,698 -3.9 Percentage of sales (%) 23.1 22.8 Other 208,346 181,131 -27,215 -13.1 Percentage of sales (%) 10.1 9.0 Grand Total 2,063,363 2,013,228 -50,135 -2.4 Percentage of sales (%) 100.0 100.0
Three months ended March 31, 2018 and 2019
(Millions of yen) Three months ended
March 31, 2018 Three months ended
March 31, 2019 Change % <Domestic> 220,699 218,094 -2,605 -1.2 Percentage of sales (%) 40.3 41.6 <Overseas> 326,464 305,683 -20,781 -6.4 Percentage of sales (%) 59.7 58.4 The Americas 145,654 147,078 1,424 1.0 Percentage of sales (%) 26.6 28.1 Europe, Middle East and Africa 129,530 118,129 -11,401 -8.8 Percentage of sales (%) 23.7 22.6 Other 51,280 40,476 -10,804 -21.1 Percentage of sales (%) 9.4 7.7 Grand Total 547,163 523,777 -23,386 -4.3 Percentage of sales (%) 100.0 100.0

18
(3) Consolidated Statement of Changes in Equity
(Millions of Yen)
Common Stock
Additional paid-in capital
Treasury stock
Other components of equity
Remeasurement of defined
benefit plan
Net gain (loss) on fair value of financial assets
measured through other
comprehensive income
Net gain (loss) on fair
value of available-for-sale financial
assets
Net gain (loss) on fair value of cash
flow hedges
Balance as of April 1, 2017
135,364 186,423 -37,318 - - 34,330 73
Profit (loss) Other comprehensive income (loss) 2,540 17,251 -13,334
Comprehensive income (loss) - - - 2,540 - 17,251 -13,334
Net change in treasury stock -11
Dividends declared and approved to owners
Transfer from other components of equity to retained earnings
-2,540
Equity transactions with non-controlling shareholders
40
Total transactions with owners
- 40 -11 -2,540 - - -
Balance as of March 31, 2018
135,364 186,423 -37,329 - - 51,581 -13,261
Other components of equity
Retained earnings
Equity attributable to owners of the
parent
Non-controlling interests
Total equity
Exchange differences on translation of
foreign operations
Total other components
of equity
Balance as of April 1, 2017
65,791 100,194 657,443 1,042,106 74,771 1,116,877
Profit (loss) -135,372 -135,372 5,733 -129,639 Other comprehensive income (loss) 10,843 17,300 17,300 -144 17,156
Comprehensive income (loss) 10,843 17,300 -135,372 -118,072 5,589 -112,483
Net change in treasury stock -11 -11
Dividends declared and approved to owners -14,498 -14,498 -954 -15,452
Transfer from other components of equity to retained earnings
-2,540 2,540 - -
Equity transactions with non-controlling shareholders
40 -216 -176
Total transactions with owners
- -2,540 -11,958 -14,469 -1,170 -15,639
Balance as of March 31, 2018
76,634 114,954 510,113 909,565 79,190 988,755

19
(Millions of Yen)
Common Stock
Additional paid-in capital
Treasury stock
Other components of equity
Remeasurement of defined
benefit plan
Net gain (loss) on fair value of financial assets
measured through other
comprehensive income
Net gain (loss) on fair
value of available-for-sale financial
assets
Net gain (loss) on fair value of cash
flow hedges
Balance as of April 1, 2018
135,364 186,463 -37,329 - - 51,581 -13,261
Cumulative effects of changes in accounting policy
- - - - 10,432 -51,581 13,293
Opening Balance reflecting changes in accounting policy
135,364 186,463 -37,329 - 10,432 - 32
Profit (loss) Other comprehensive income (loss) -6,385 -2,001 27
Comprehensive income (loss) - - - -6,385 -2,001 - 27
Net change in treasury stock
-10
Dividends declared and approved to owners
Transfer from other components of equity to retained earnings
6,385 -616
Equity transactions with non-controlling shareholders
-377
Other -55
Total transactions with owners
- -377 -65 6,385 -616 - -
Balance as of March 31, 2019
135,364 186,086 -37,394 - 7,815 - 59
Other components of equity
Retained earnings
Equity attributable to owners of the
parent
Non-controlling interests
Total equity
Exchange differences on translation of
foreign operations
Total other components
of equity
Balance as of April 1, 2018 76,634 114,954 510,113 909,565 79,190 988,755
Cumulative effects of changes in accounting policy
- -27,856 33,691 5,835 - 5,835
Opening Balance reflecting changes in accounting policy
76,634 87,098 543,804 915,400 79,190 994,590
Profit (loss) 49,526 49,526 5,851 55,377 Other comprehensive income (loss) -10,863 -19,222 -19,222 -19 -19,241
Comprehensive income (loss)
-10,863 -19,222 49,526 30,304 5,832 36,136
Net change in treasury stock
-10 -10
Dividends declared and approved to owners
-12,685 -12,685 -1,101 -13,786
Transfer from other components of equity to retained earnings
5,769 -5,769 - -
Equity transactions with non-controlling shareholders
-377 2,490 2,113
Other
-55 -55
Total transactions with owners
- 5,769 -18,454 -13,127 1,389 -11,738
Balance as of March 31, 2019 65,771 73,645 574,876 932,577 86,411 1,018,988

20
(4) Consolidated Statement of Cash Flows (Millions of yen)
Year ended March 31, 2018
Year ended March 31, 2019
I. Cash Flows from Operating Activities: Profit (loss) -129,639 55,377 Adjustments to reconcile profit to net cash provided by operating activities— Depreciation and amortization 108,327 94,288 Impairment of property, plant and equipment and intangible assets 30,140 2,138 Impairment of goodwill 145,827 581 Other income -17,062 -23,449 Share of profit (loss) of investments accounted for using the equity method -202 -492 Finance income and costs 8,708 3,367 Income tax expenses 5,457 28,587 (Increase) decrease in trade and other receivables -17,106 -6,595 (Increase) decrease in inventories 22,720 -30,097 (Increase) decrease in lease receivables -27,922 -13,527 Increase (decrease) in trade and other payables 5,215 10,024 Increase (decrease) in accrued pension and retirement benefits -11,506 -6,937 Other, net 32,808 553 Interest and dividends received 3,902 4,123 Interest paid -5,025 -5,007 Income taxes paid -44,354 -30,987 Net cash provided by (used in) operating activities 110,288 81,947 II. Cash Flows from Investing Activities: Proceeds from sales of property, plant and equipment 18,484 9,707 Expenditures for property, plant and equipment -72,285 -72,462 Proceeds from sales of intangible assets 6,554 969 Expenditures for intangible assets -34,698 -29,589 Payments for purchases of available-for-sale securities -1,005 -8,639 Proceeds from sales of available-for-sale securities 186 63,830 (Increase) decrease in time deposits 8,062 458 Purchase of business, net of cash acquired -458 -5,133 Proceeds from sales of investments in subsidiaries 7,788 10,223 Other, net -13,705 -15,295 Net cash provided by (used in) investment activities -81,077 -45,931 III. Cash Flows from Financing Activities: Net proceeds (repayments) of short-term debt -21,180 26,236 Proceeds from long-term debt 134,819 152,234 Repayments of long-term debt -109,877 -139,399 Proceeds from issuance of bonds 68,285 50,000 Repayments of bonds -50,000 -35,000 Dividends paid -14,498 -12,685 Payments for purchase of treasury stock -11 -10 Proceeds from purchase of investments in subsidiaries without change in - 3,006 scope of consolidation Other, net -1,131 -1,958 Net cash provided by (used in) financing activities 6,407 42,424 IV. Effect of Exchange Rate Changes on Cash and Cash Equivalents -1,479 1,091 V. Net Increase (decrease) in Cash and Cash Equivalents 34,139 79,531 VI. Cash and Cash Equivalents at Beginning of Year 126,429 160,568 VII. Cash and Cash Equivalents at End of Year 160,568 240,099

21
(5) Notes on premise going concern Not applicable (6) Changes in accounting policies
Significant accounting policies which apply in Condensed Consolidated Statement of Financial Position are same as previous fiscal year excepting the table below.
IFRSs Title Summaries of new IFRSs/amendments
IFRS 9 Financial instruments Classification of financial instruments, revisions concerning the measurement and recognition and adoption of provisions with regard to impairment loss based on the expected credit loss model.
IFRS 15 Revenue from contracts with customers
Presentation of a unified framework applied to accounting treatment related to revenue recognition
1. Adoption of IFRS 9 ‘Financial Instruments’ Ricoh implemented IFRS 9 ‘Financial Instruments’ as of April 1, 2018. Ricoh applied this standard in compliance with the transitional provisions, thereby recognizing the cumulative effects of adoption of this standard as an adjustment to the opening balance of retained earnings as at the beginning of the current fiscal year. Ricoh made an irrevocable election at initial recognition to present subsequent changes in fair value with regards to equity instruments previously classified as available for sale under the prior standard in other comprehensive income in principle, while part of equity instruments previously classified as available for sale under the prior standard were classified as equity instruments measured at fair value through profit and loss. As a result, ¥10,432 million was reclassified from net gain (loss) on fair value of available-for-sale financial assets to net gain (loss) on fair value of financial assets measured through other comprehensive income of other components of equity as at the beginning of the current fiscal year. In addition, ¥41,149 million was reclassified from net gain (loss) on fair value of available-for-sale financial assets to retained earnings and ¥-13,293 million was reclassified from net gain (loss) on fair value of cash flow hedges to retained earnings, it caused an increase by ¥27,856 million in retained earnings. Accordingly, the changes caused a decrease by ¥27,856 million in profit as compared to the case where the prior standard would be applied. In respect of equity instruments measured at fair value through other comprehensive income, changes in fair value are recognized as other comprehensive income. When the fair value significantly declines or the equity instruments are derecognized, accumulated other comprehensive income are reclassified to retained earnings. Impairment losses are recognized with respect to the financial assets based on the expected credit loss model. As a result, other current financial assets increased by ¥962 million and retained earnings increased by ¥661 million respectively as at the beginning of the current fiscal year. There was no material impact on profit and loss of the current fiscal year from the changes. 2. Adoption of IFRS 15 ‘Revenue from contracts with customers’ Ricoh implemented IFRS 15 ‘Revenue from contracts with customers’ as of April 1, 2018. Ricoh applied this standard in compliance with the transitional provisions, thereby recognizing the cumulative effects of adoption of this standard as an adjustment to the opening balance of retained earnings as at the beginning of the current fiscal year. Ricoh recognizes the incremental costs of obtaining a contract with a customer as an asset and amortizes subsequently in accordance with recognition of revenue. As a result, other current assets increased by ¥3,948 million, other non-current assets increased by ¥3,139 million and retained earnings increased by ¥5,174 million respectively as at the beginning of the current fiscal year in comparison with the case where the prior standard would be applied. There was no material impact on profit and loss of the current fiscal year from the changes.

22
(7) Segment Information (a) Operating Segment Information Year ended March 31, 2018 and 2019
(Millions of yen) Year ended
March 31, 2018 Year ended
March 31, 2019 Change % Office Printing: Sales: Unaffiliated customers 1,144,053 1,086,428 -57,625 -5.0 Intersegment - - - - Total 1,144,053 1,086,428 -57,625 -5.0 Operating expenses 1,188,359 968,429 -219,930 -18.5 Operating profit (loss) -44,306 117,999 162,305 - Operating profit (loss) on sales in Office Printing (%) -3.9 10.9 Office Service: Sales: Unaffiliated customers 447,973 481,392 33,419 7.5 Intersegment - - - - Total 447,973 481,392 33,419 7.5 Operating expenses 473,590 466,653 -6,937 -1.5 Operating profit (loss) -25,617 14,739 40,356 - Operating profit (loss) on sales in Office Service (%) -5.7 3.1 Commercial Printing: Sales: Unaffiliated customers 185,933 185,292 -641 -0.3 Intersegment - - - - Total 185,933 185,292 -641 -0.3 Operating expenses 160,753 158,069 -2,684 -1.7 Operating profit 25,180 27,223 2,043 8.1 Operating profit on sales in Commercial Printing (%) 13.5 14.7 Industrial Printing: Sales: Unaffiliated customers 19,200 20,692 1,492 7.8 Intersegment - - - - Total 19,200 20,692 1,492 7.8 Operating expenses 21,450 27,819 6,369 29.7 Operating loss -2,250 -7,127 -4,877 - Operating loss on sales in Industrial Printing (%) -11.7 -34.4 Thermal Media: Sales: Unaffiliated customers 61,458 66,368 4,910 8.0 Intersegment - - - - Total 61,458 66,368 4,910 8.0 Operating expenses 56,442 62,138 5,696 10.1 Operating profit 5,016 4,230 -786 -15.7 Operating profit on sales in Thermal Media (%) 8.2 6.4 Other: Sales: Unaffiliated customers 204,746 173,056 -31,690 -15.5 Intersegment 71,240 45,024 -26,216 -36.8 Total 275,986 218,080 -57,906 -21.0 Operating expenses 265,954 200,775 -65,179 -24.5 Operating profit 10,032 17,305 7,273 72.5 Operating profit on sales in Other (%) 3.6 7.9 Corporate and Eliminations: Sales: Intersegment -71,240 -45,024 26,216 Total -71,240 -45,024 26,216 - Operating expenses: Intersegment -71,240 -45,024 26,216 Corporate 83,731 87,530 3,799 Total 12,491 42,506 30,015 - Operating loss -83,731 -87,530 -3,799 - Consolidated: Sales: Unaffiliated customers 2,063,363 2,013,228 -50,135 -2.4 Intersegment - - - - Total 2,063,363 2,013,228 -50,135 -2.4 Operating expenses 2,179,039 1,926,389 -252,650 -11.6 Operating profit (loss) -115,676 86,839 202,515 - Operating profit (loss) on consolidated sales (%) -5.6 4.3

23
(Supplemental information) Finance business included in the above is as follows:
(Millions of yen) Year ended
March 31, 2018 Year ended
March 31, 2019 Change % Sales 149,252 159,192 9,940 6.7 Operating expenses 118,286 127,547 9,261 7.8 Operating profit 30,966 31,645 679 2.2 Operating profit on sales in Finance Business (%) 20.7 19.9

24
Three months ended March 31, 2018 and 2019 (Millions of yen)
Three months ended March 31, 2018
Three months ended March 31, 2019 Change %
Office Printing: Sales: Unaffiliated customers 294,806 277,215 -17,591 -6.0 Intersegment - - - - Total 294,806 277,215 -17,591 -6.0 Operating expenses 427,693 249,464 -178,229 -41.7 Operating profit (loss) -132,887 27,751 160,638 - Operating profit (loss) on sales in Office Printing (%) -45.1 10.0 Office Service: Sales: Unaffiliated customers 130,390 132,557 2,167 1.7 Intersegment - - - - Total 130,390 132,557 2,167 1.7 Operating expenses 153,000 127,230 -25,770 -16.8 Operating profit (loss) -22,610 5,327 27,937 - Operating profit (loss) on sales in Office Service (%) -17.3 4.0 Commercial Printing: Sales: Unaffiliated customers 48,136 50,145 2,009 4.2 Intersegment - - - - Total 48,136 50,145 2,009 4.2 Operating expenses 42,954 43,158 204 0.5 Operating profit 5,182 6,987 1,805 34.8 Operating profit on sales in Commercial Printing (%) 10.8 13.9 Industrial Printing: Sales: Unaffiliated customers 5,771 5,078 -693 -12.0 Intersegment - - - - Total 5,771 5,078 -693 -12.0 Operating expenses 6,243 9,206 2,963 47.5 Operating loss -472 -4,128 -3,656 - Operating loss on sales in Industrial Printing (%) -8.2 -81.3 Thermal Media: Sales: Unaffiliated customers 15,166 15,760 594 3.9 Intersegment - - - - Total 15,166 15,760 594 3.9 Operating expenses 14,790 14,168 -622 -4.2 Operating profit 376 1,592 1,216 323.4 Operating profit on sales in Thermal Media (%) 2.5 10.1 Other: Sales: Unaffiliated customers 52,894 43,022 -9,872 -18.7 Intersegment 19,523 9,888 -9,635 -49.4 Total 72,417 52,910 -19,507 -26.9 Operating expenses 68,090 52,668 -15,422 -22.6 Operating profit 4,327 242 -4,085 -94.4 Operating profit on sales in Other (%) 6.0 0.5 Corporate and Eliminations: Sales: Intersegment -19,523 -9,888 9,635 Total -19,523 -9,888 9,635 - Operating expenses: Intersegment -19,523 -9,888 9,635 Corporate 17,626 30,111 12,485 Total -1,897 20,223 22,120 - Operating loss -17,626 -30,111 -12,485 - Consolidated: Sales: Unaffiliated customers 547,163 523,777 -23,386 -4.3 Intersegment - - - - Total 547,163 523,777 -23,386 -4.3 Operating expenses 710,873 516,117 -194,756 -27.4 Operating profit (loss) -163,710 7,660 171,370 - Operating profit (loss) on consolidated sales (%) -29.9 1.5

25
(Supplemental information) Finance business included in the above is as follows:
(Millions of yen) Three months ended
March 31, 2018 Three months ended
March 31, 2019 Change % Sales 40,018 43,790 3,772 9.4 Operating expenses 32,441 36,212 3,771 11.6 Operating profit 7,577 7,578 1 0.0 Operating profit on sales in Finance Business (%) 18.9 17.3

26
(b) Per share data
(Yen) Year ended
March 31, 2018 Year ended
March 31, 2019 Equity per share attributable to owners of the parent 1,254.79 1,286.56 Earnings per share attributable to owners of the parent-basic -186.75 68.32 Earnings per share attributable to owners of the parent-diluted - -
A reconciliation of the numerator and the denominators of the basic and diluted per share computations for profit is as follows:
(Millions of yen) Year ended
March 31, 2018 Year ended
March 31, 2019 Profit (loss) attributable to owners of the parent -135,372 49,526
Effect of dilutive securities - - Diluted profit (loss) attributable to owners of the parent -135,372 49,526
(Shares)
Year ended March 31, 2018
Year ended March 31, 2019
Weighted average common shares outstanding 724,877,128 724,867,249 Effect of dilutive securities - -
Diluted common shares outstanding 724,877,128 724,867,249
(c) Subsequent events
Not applicable

27
-APPENDIX- Year ended March 31, 2019 1. Consolidated Quarterly Performance Outline (1) Financial Statements Summary (Quarterly)
(Billions of yen) Q1 Q2 Q3 Q4 Change (%) Sales 490.9 497.3 501.1 523.7 -4.3 Gross profit 194.4 189.4 191.1 191.8 -2.7 Operating profit 19.7 32.2 27.1 7.6 - Profit before income tax expenses 17.9 32.1 26.8 7.0 - Profit (loss) attributable to owners of the parent 9.2 26.7 14.5 -1.1 - Earnings per share attributable to owners of the parent-basic (yen).
12.81 36.92 20.13 -1.53 -
Earnings per share attributable to owners of the parent-diluted (yen).
- - - - -
Total assets 2,671.3 2,699.6 2,662.0 2,725.1 - Equity attributable to owners of the parent 916.0 962.6 944.0 932.5 - Equity attributable to owners of the parent per share (yen) 1,263.74 1,328.08 1,302.33 1,286.56 - Cash flows from operating activities 21.5 5.9 9.0 45.3 - Cash flows from investing activities 27.1 -18.2 -14.7 -40.1 - Cash flows from financing activities 13.8 -11.0 6.8 32.8 - Cash and cash equivalents at end of period 224.2 203.0 201.2 240.0 -
(2) Capital expenditures and Depreciation
(Billions of yen) Q1 Q2 Q3 Q4 Capital expenditures 14.4 21.1 14.8 21.9 Depreciation 17.6 16.5 15.4 15.8
(3) R&D Expenditures
(Billions of yen) Q1 Q2 Q3 Q4 R&D expenditures 25.5 29.7 25.0 30.6 R&D expenditures/ Total Sales (%) 5.2 6.0 5.0 5.9
(4) Exchange Rate
Q1 Q2 Q3 Q4 Exchange rate (Yen/US$) 109.14 111.53 112.87 110.22 Exchange rate (Yen/EURO) 130.14 129.68 128.82 125.16

28
2. Consolidated Sales by Product Category Year ended March 31, 2018 and 2019
(Millions of yen) Year ended
March 31, 2018 Year ended
March 31, 2019 Change % Change excluding exchange impact %
<Office Printing> Office Printing 1,144,053 1,086,428 -57,625 -5.0 -53,199 -4.7 Percentage of sales (%) 55.4 54.0 Domestic 351,926 346,032 -5,894 -1.7 -5,894 -1.7 Overseas 792,127 740,396 -51,731 -6.5 -47,305 -6.0 The Americas 348,674 331,007 -17,667 -5.1 -17,780 -5.1 Europe, Middle East and Africa 321,426 299,841 -21,585 -6.7 -18,762 -5.8 Other 122,027 109,548 -12,479 -10.2 -10,763 -8.8 <Office Service> Office Service 447,973 481,392 33,419 7.5 34,331 7.7 Percentage of sales (%) 21.7 23.9 Domestic 243,058 272,644 29,586 12.2 29,586 12.2 Overseas 204,915 208,748 3,833 1.9 4,745 2.3 The Americas 104,544 111,218 6,674 6.4 6,635 6.3 Europe, Middle East and Africa 77,031 80,250 3,219 4.2 3,976 5.2 Other 23,340 17,280 -6,060 -26.0 -5,866 -25.1 <Commercial Printing> Commercial Printing 185,933 185,292 -641 -0.3 70 0.0 Percentage of sales (%) 9.0 9.2 Domestic 24,544 25,896 1,352 5.5 1,352 5.5 Overseas 161,389 159,396 -1,993 -1.2 -1,282 -0.8 The Americas 97,311 96,761 -550 -0.6 -575 -0.6 Europe, Middle East and Africa 51,424 50,172 -1,252 -2.4 -782 -1.5 Other 12,654 12,463 -191 -1.5 75 0.6 <Industrial Printing> Industrial Printing 19,200 20,692 1,492 7.8 1,511 7.9 Percentage of sales (%) 0.9 1.0 Domestic 2,773 2,819 46 1.7 46 1.7 Overseas 16,427 17,873 1,446 8.8 1,465 8.9 The Americas 5,230 6,127 897 17.2 893 17.1 Europe, Middle East and Africa 3,774 5,134 1,360 36.0 1,382 36.6 Other 7,423 6,612 -811 -10.9 -810 -10.9 <Thermal Media> Thermal Media 61,458 66,368 4,910 8.0 5,288 8.6 Percentage of sales (%) 3.0 3.3 Domestic 13,012 13,658 646 5.0 646 5.0 Overseas 48,446 52,710 4,264 8.8 4,642 9.6 The Americas 18,362 19,461 1,099 6.0 1,092 5.9 Europe, Middle East and Africa 16,339 17,800 1,461 8.9 1,629 10.0 Other 13,745 15,449 1,704 12.4 1,921 14.0 <Other> Other 204,746 173,056 -31,690 -15.5 -31,669 -15.5 Percentage of sales (%) 9.9 8.6 Domestic 164,591 144,750 -19,841 -12.1 -19,841 -12.1 Overseas 40,155 28,306 -11,849 -29.5 -11,828 -29.5 The Americas 3,438 2,868 -570 -16.6 -565 -16.4 Europe, Middle East and Africa 7,560 5,659 -1,901 -25.1 -1,860 -24.6 Other 29,157 19,779 -9,378 -32.2 -9,403 -32.2 Grand Total 2,063,363 2,013,228 -50,135 -2.4 -43,668 -2.1 Percentage of sales (%) 100.0 100.0 Domestic 799,904 805,799 5,895 0.7 5,895 0.7 Percentage of sales (%) 38.8 40.0 Overseas 1,263,459 1,207,429 -56,030 -4.4 -49,563 -3.9 Percentage of sales (%) 61.2 60.0 The Americas 577,559 567,442 -10,117 -1.8 -10,300 -1.8 Percentage of sales (%) 28.0 28.2 Europe, Middle East and Africa 477,554 458,856 -18,698 -3.9 -14,417 -3.0 Percentage of sales (%) 23.1 22.8 Other 208,346 181,131 -27,215 -13.1 -24,846 -11.9 Percentage of sales (%) 10.1 9.0
* Each category includes the following product line: Office Printing MFPs (multifunctional printers), copiers, laser printers, digital duplicators, wide format printers, facsimile machine, scanners, related parts and supplies, services, support and software Office Service Personal computers, servers, network equipment, related services, support, software and service
solutions related to documents Commercial Printing Cut sheet printers, continuous feed printers, related parts & supplies, services, support and software Industrial printing Inkjet heads, imaging systems and industrial printers Thermal Media Thermal media Other Industrial optical component/module, electronic components, precision mechanical component,
digital cameras, 3D printing, ECO, healthcare, financial services

29
Three months ended March 31, 2018 and 2019
(Millions of yen) Three months ended
March 31, 2018 Three months ended
March 31, 2019 Change % Change excluding exchange impact %
<Office Printing> Office Printing 294,806 277,215 -17,591 -6.0 -13,552 -4.6 Percentage of sales (%) 53.9 52.9 Domestic 89,871 90,353 482 0.5 482 0.5 Overseas 204,935 186,862 -18,073 -8.8 -14,034 -6.8 The Americas 88,003 85,840 -2,163 -2.5 -3,440 -3.9 Europe, Middle East and Africa 87,744 76,885 -10,859 -12.4 -6,252 -7.1 Other 29,188 24,137 -5,051 -17.3 -4,342 -14.9 <Office Service> Office Service 130,390 132,557 2,167 1.7 3,069 2.4 Percentage of sales (%) 23.8 25.3 Domestic 76,538 80,568 4,030 5.3 4,030 5.3 Overseas 53,852 51,989 -1,863 -3.5 -961 -1.8 The Americas 26,380 27,563 1,183 4.5 744 2.8 Europe, Middle East and Africa 20,901 20,785 -116 -0.6 1,118 5.3 Other 6,571 3,641 -2,930 -44.6 -2,823 -43.0 <Commercial Printing> Commercial Printing 48,136 50,145 2,009 4.2 2,535 5.3 Percentage of sales (%) 8.8 9.6 Domestic 6,468 6,434 -34 -0.5 -34 -0.5 Overseas 41,668 43,711 2,043 4.9 2,569 6.2 The Americas 24,719 26,709 1,990 8.1 1,624 6.6 Europe, Middle East and Africa 13,721 13,545 -176 -1.3 585 4.3 Other 3,228 3,457 229 7.1 360 11.2 <Industrial Printing> Industrial Printing 5,771 5,078 -693 -12.0 -689 -11.9 Percentage of sales (%) 1.1 1.0 Domestic 669 796 127 19.0 127 19.0 Overseas 5,102 4,282 -820 -16.1 -816 -16.0 The Americas 1,431 1,588 157 11.0 125 8.7 Europe, Middle East and Africa 1,144 1,120 -24 -2.1 11 1.0 Other 2,527 1,574 -953 -37.7 -952 -37.7 <Thermal Media> Thermal Media 15,166 15,760 594 3.9 953 6.3 Percentage of sales (%) 2.8 3.0 Domestic 2,984 3,166 182 6.1 182 6.1 Overseas 12,182 12,594 412 3.4 771 6.3 The Americas 4,428 4,748 320 7.2 242 5.5 Europe, Middle East and Africa 4,223 4,504 281 6.7 555 13.1 Other 3,531 3,342 -189 -5.4 -26 -0.7 <Other> Other 52,894 43,022 -9,872 -18.7 -9,798 -18.5 Percentage of sales (%) 9.7 8.2 Domestic 44,169 36,777 -7,392 -16.7 -7,392 -16.7 Overseas 8,725 6,245 -2,480 -28.4 -2,406 -27.6 The Americas 693 630 -63 -9.1 -69 -10.0 Europe, Middle East and Africa 1,797 1,290 -507 -28.2 -439 -24.4 Other 6,235 4,325 -1,910 -30.6 -1,898 -30.4 Grand Total 547,163 523,777 -23,386 -4.3 -17,482 -3.2 Percentage of sales (%) 100.0 100.0 Domestic 220,699 218,094 -2,605 -1.2 -2,605 -1.2 Percentage of sales (%) 40.3 41.6 Overseas 326,464 305,683 -20,781 -6.4 -14,877 -4.6 Percentage of sales (%) 59.7 58.4 The Americas 145,654 147,078 1,424 1.0 -774 -0.5 Percentage of sales (%) 26.6 28.1 Europe, Middle East and Africa 129,530 118,129 -11,401 -8.8 -4,422 -3.4 Percentage of sales (%) 23.7 22.6 Other 51,280 40,476 -10,804 -21.1 -9,681 -18.9 Percentage of sales (%) 9.4 7.7
* Each category includes the following product line: Office Printing MFPs (multifunctional printers), copiers, laser printers, digital duplicators, wide format printers, facsimile machine, scanners, related parts and supplies, services, support and software Office Service Personal computers, servers, network equipment, related services, support, software and service
solutions related to documents Commercial Printing Cut sheet printers, continuous feed printers, related parts & supplies, services, support and software Industrial printing Inkjet heads, imaging systems and industrial printers Thermal Media Thermal media Other Industrial optical component/module, electronic components, precision mechanical component,
digital cameras, 3D printing, ECO, healthcare, financial services

30
3. Forecast of Consolidated Sales by Product Category (Billions of yen)
Year ended March 31,
2019 Year ending March 31, 2020
Results Forecast Change
%
Forecast excluding exchange
impact
Change %
<Office Printing> 1,086.4 1,056.7 -2.7 1,068.3 -1.7 Domestic 346.0 343.1 -0.8 343.1 -0.8 Overseas 740.3 713.6 -3.6 725.2 -2.1 The Americas 331.0 322.8 -2.5 325.6 -1.6 Europe, Middle East and Africa 299.8 283.8 -5.3 291.7 -2.7 Other 109.5 107.0 -2.3 107.9 -1.5 <Office Service> 481.3 496.7 3.2 500.2 3.9 Domestic 272.6 281.1 3.1 281.1 3.1 Overseas 208.7 215.6 3.3 219.1 5.0 The Americas 111.2 114.6 3.0 115.6 3.9 Europe, Middle East and Africa 80.2 83.2 3.7 85.5 6.5 Other 17.2 17.8 3.0 18.0 4.2 <Commercial Printing> 185.2 188.3 1.6 190.6 2.9 Domestic 25.8 26.7 3.1 26.7 3.1 Overseas 159.3 161.6 1.4 163.9 2.8 The Americas 96.7 97.8 1.1 98.6 1.9 Europe, Middle East and Africa 50.1 51.2 2.0 52.6 4.8 Other 12.4 12.6 1.1 12.7 1.9 <Industrial Printing> 20.6 25.6 23.7 25.9 25.2 Domestic 2.8 4.1 45.4 4.1 45.4 Overseas 17.8 21.5 20.3 21.8 22.0 The Americas 6.1 7.1 15.9 7.2 17.5 Europe, Middle East and Africa 5.1 6.0 16.9 6.2 20.8 Other 6.6 8.4 27.0 8.4 27.0 <Thermal Media> 66.3 73.7 11.0 74.6 12.4 Domestic 13.6 14.9 9.1 14.9 9.1 Overseas 52.7 58.8 11.6 59.7 13.3 The Americas 19.4 21.6 11.0 21.8 12.0 Europe, Middle East and Africa 17.8 17.9 0.6 18.4 3.4 Other 15.4 19.3 24.9 19.5 26.2 <Other> 173.0 169.0 -2.3 169.3 -2.2 Domestic 144.7 140.1 -3.2 140.1 -3.2 Overseas 28.3 28.9 2.1 29.2 3.2 The Americas 2.8 2.9 1.1 2.9 1.1 Europe, Middle East and Africa 5.6 5.9 4.3 6.1 7.8 Other 19.7 20.1 1.6 20.2 2.1 Grand Total 2,013.2 2,010.0 -0.2 2,028.9 0.8 Domestic 805.7 810.0 0.5 810.0 0.5 Overseas 1,207.4 1,200.0 -0.6 1,218.9 1.0 The Americas 567.4 566.8 -0.1 571.7 0.8 Europe, Middle East and Africa 458.8 448.0 -2.4 460.5 0.4 Other 181.1 185.2 2.2 186.7 3.1
Reference: Exchange rate
Year ended March 31, 2019
Year ending March 31, 2020
US$ 1 ¥110.95 ¥110.00 EURO 1 ¥128.46 ¥125.00