1842 ieee transactions on human-machine systems,...
TRANSCRIPT

1842 IEEE TRANSACTIONS ON HUMAN-MACHINE SYSTEMS, VOL. 42, NO. 6, NOVEMBER 2012
Cost Analysis of WDM and TDM Fiber-to-the-Home(FTTH) Networks: A System-of-Systems Approach
Theodore Rokkas, Ioannis Neokosmidis, Dimitris Katsianis, and Dimitris Varoutas, Senior Member, IEEE
Abstract—A system-of-systems (SoS) approach for wavelength-division multiplexing (WDM) and time-division multiplexing(TDM) fiber-to-the-home (FTTH) telecommunication networks ispresented. Cost evolution curves for individual systems as well forwhole FTTH WDM and TDM networks are presented. The anal-ysis can be exploited for a fast and accurate analysis of FTTHdeployment costs in dense urban, urban, and suburban areas fromthe technoeconomic point of view, which is of paramount impor-tance for telecom operators, equipment vendors, regulators, andpolicy makers. The impact of delaying the deployments or adopt-ing different rollout strategies is also investigated and presented.The SoS emergent behavior is further revealed using exploratorymodeling. The results reveal that in all cases, the WDM solutionis more expensive than TDM. The total cost for suburban areas isalmost six times higher than in dense urban areas and four timesthan urban areas.
Index Terms—Cost learning curves, fiber-to-the-home (FTTH),optical communications, system-of-systems (SoS), technoeco-nomics, telecommunications, time-division multiplexing (TDM)SoS, wavelength-division multiplexing (WDM) SoS.
I. INTRODUCTION
OVER the past few years, a trend in society and mainlyin industry for system integration is observed. Illustrative
examples are the aerospace and defense industry. However, formany industries, the effort for integration and holistic systemanalysis and design constitutes a key part in drawing up theirbusiness strategies. This trend mainly comes from consumers’need for systems that provide advanced features. This effort,which is known as "system of systems" (SoS), is an emergingand multidisciplinary research area.
Although the concept of SoS is not new, it has gained in-creased attention in the last decade. This research area is still inembryonic stage which is also illustrated by the lack of a precisedefinition [1], [2]. An SoS can be described as a set or arrange-ment of interdependent systems that are related or connected toprovide a given capability [3]. Furthermore, the components ofthe SoS are themselves autonomous embedded complex systems
Manuscript received January 23, 2011; revised September 12, 2011, March 3,2012, and August 12, 2012; accepted October 28, 2012. Date of current versionDecember 17, 2012. This paper was recommended by Associate Editor J. Chen.
The authors are with the Technoeconomic Group of Optical Communica-tions and Broadband Access Laboratory, Faculty of Informatics and Telecom-munications, School of Science, University of Athens, GR15784 Athens,Greece (e-mail: [email protected]; [email protected]; [email protected];[email protected]).
Color versions of one or more of the figures in this paper are available onlineat http://ieeexplore.ieee.org.
Digital Object Identifier 10.1109/TSMCC.2012.2227999
that can be diverse in technology, context, operation, geography,and conceptual frame [4].
System-of-Systems Engineering (SoSE) is a field that dealswith the complexity and problems of SoS. Reference to SoSEbegan in the late 1990s. An important barrier to this effort isthe lack of specific and general approaches and methods to ad-dress the practical difficulties in SoS. Unfortunately, traditionalsystems engineering is not applicable in the case of SoS mainlybecause they have not been developed to address high levels ofambiguity and uncertainty [4].
The present state of SoSE can be divided into two paths.The first mainly deals with technical issues (interoperability,net-centricity, and integration) [5], while the second is domi-nated by concerns with human/social, contextual, and higherlevel inquiry to produce purposeful responses to complex sys-tem problems [4]. The above separation reveals the multidi-mensional nature of these problems. It is then evident that themain goal of the various research teams, that is to develop uni-fied SoSE techniques and generate solutions in a formalized,repeatable manner, can only be accomplished by incorporat-ing epistemological, methodological, and ontological aspects.It should be noted that the latter gives to SoSE a multidisci-plinary character [6]. However, the degree to which, and how,multiple disciplines can be combined must be investigated.
The design and construction of a fiber-to-the-home (FTTH)network rests on both paths of the SoSE. On the one side, issuessuch as marketing, demand, and adoption of the network arerelated to the social and humanitarian nature of the problems ofthe FTTH network. On the other hand, the construction, dimen-sioning, operation, and maintenance of the network deal withtechnical issues such as selection, integration, and interoperabil-ity of the various components of the network.
However, to the best of authors’ knowledge, the design, man-ufacture, and provision of a telecommunication network such asof the FTTH networks have not attracted the interest of SoSEexperts and have not yet been studied in the light of an SoS,although such networks meet the aforementioned criteria. Sofar in the literature, various networks and sets have been in-vestigated in the form of SoS. However, these studies mainlyconcerns maritime transportation systems [7], disaster and dam-age situations [8]–[10], defense systems [11], [12], global earthobservation systems [13], health systems [14], etc.
Due to the increasing interest on the FTTH networks andtheir deployment strategies, a new approach incorporating allaspects of network development, administration, and operationis required. To this end, an SoS approach is proposed, aiming toexploit the benefits of SoS methodologies in this critical issuefor the development of telecommunications. This methodology
1094-6977/$31.00 © 2012 IEEE

ROKKAS et al.: COST ANALYSIS OF WDM AND TDM FIBER-TO-THE-HOME (FTTH) NETWORKS: A SYSTEM-OF-SYSTEMS APPROACH 1843
is valuable because it helps basically decision makers to perceivenotions of underlying costs associated with technical, economic,and even social issues and thus, derive strategies for resource al-locations, and infrastructure investments using concepts such asemergent behaviors of the users and interdependences betweenthe complex system integrations required [15].
In order to implement the proposed methodology, appropri-ate models and tools have been developed. The application oftraditional technoeconomic models [16]–[18] in such a complexenvironment would lead to time-consuming procedures, and inmany cases, it is difficult to be interpreted by nonexperts. How-ever, advanced models can enhance the design of such systemswith valuable information improving the process and minimiz-ing the risk of being consumed at inappropriate options. In thisperspective, SoS engineering methodologies and tools can bemore than valuable to such complex engineering issues as thosearisen from FTTH debate.
In detail, in this paper, the notion of SoS in telecommunica-tions and especially in FTTH networks is introduced. Metricsassociated with first installation costs in the case of a greenfieldoperator as well as the incremental cost for the completion ofthe FTTH SoS deployment are provided. Multiple paths pro-viding numerous possible SoS realizations are given throughexploratory modeling [19], [20].
The remainder of this paper is organized as follows. InSection II-A, the SoS nature of a passive optical network(PON) is depicted. Topology and area characteristics are givenin Section II-B. The system under consideration and the costmodel are presented in Sections II-C and II-D, respectively. InSection III, learning curves for telecommunication componentsare illustrated. The results obtained by the cost analysis ofthe SoS are illustrated in Section IV. Concluding remarks areprovided in Section V.
II. SYSTEM-OF-SYSTEMS APPROACH FOR FIBER-TO-THE-HOME
TIME-DIVISION MULTIPLEXING AND WAVELENGTH-DIVISION
MULTIPLEXING NETWORKS
A. System-of-Systems Approach for Fiber-to-the-Home
Using the definitions that have been proposed by variousresearchers in the past, a set of systems can be characterized asan “SoS” if it fulfills the following features [21].
1) An SoS involves the integration of multiple, potentiallypreviously independent, systems into a higher level system(metasystem) to perform a mission/purpose for which eachmember plays an integral role.
2) An SoS generates capabilities beyond which any of theconstituent member (sub) systems is independently capa-ble of producing.
3) Integration into an SoS evokes some degree of constraint(surrender of autonomy) for previously independentsystems.
4) An SoS is a complex system and as such exhibits dy-namic and emergent behavior, is difficult to grasp, and isproblematic to engineer.
5) An SoS is characterized by the geographical distributionof its component systems.
Fig. 1. SoS approach of an FTTH network.
The increased complexity of SoS is mainly due to the ca-pability of the constituent systems to operate independently.Hence, apart from cooperating, the systems could also competefor subtasks. Another factor leading to the complexity is theinability to predict the operation of an SoS since the latter isusually occurred in uncertain environments. Finally, the SoS isa dynamic entity as new systems are added and current systemsare replaced or removed.
Because of these unique features, the development of suitablemethods is required to study an SoS and predict its eventual be-havior as the individual systems change, causing changes in thelarger SoS. Several methods such as agent-based modeling [22],metasynthesis [23], and systemigrams [24] have been proposedin the literature. In fact, the study of complex problems un-der the SoS perspective is equivalent to finding an equilibriumpoint between the individual systems characteristics. In this pa-per, the investigation of time-domain multiplexing (TDM) andwavelength-domain multiplexing (WDM) technologies adop-tion under different policies as well as exploratory modelinghave been proposed as tools to study the SoS emergent char-acteristics. Numerical evaluations of model outcomes across alarge set of possible SoS representations are performed giv-ing the “whole picture” of SoS in a time sequence of differentperiods.
To begin with, one should initially identify the constituent sys-tems of the SoS under consideration. In fact, the whole processof designing, constructing, and maintaining an FTTH networkconsists of many independent components that are combined toprovide very high data rate in low cost to the end user, as shownin Fig. 1. These components can be characterized as systemsmainly due to their increased complexity as well as their non-linear behavior and their operation in uncertain environments.In order to reveal the system nature of the components, the struc-ture of the Central Office (CO) is described as a representativeexample.
As shown in Fig. 2, the CO is a complex system becauseof its dimensions, that is, the large number of heterogeneouselements that comprise it. Specifically, under the term CO, onecan incorporate the air condition which ensures the proper op-eration of the devices, the power supply unit (PSU), batteriesfor uninterrupted operation of the CO, the switches, the optical

1844 IEEE TRANSACTIONS ON HUMAN-MACHINE SYSTEMS, VOL. 42, NO. 6, NOVEMBER 2012
Fig. 2. System nature of the CO.
distribution frame (ODF), and the optical line terminal (OLT).The key element of the CO is the OLT, which is the endpointof the service provider of a PON. Furthermore, one should alsoadd the abundance of line cards that can be installed in the OLTcorresponding to different functions and network interfaces. Fi-nally, the aforementioned devices are integrated into the CO inorder to connect the backbone network to the access networkand thus provide services to the end users. However, integrationand interoperability of these elements is not easy, taking into ac-count the complexity of these elements, the fast developmentsin these technologies, as well as legacy systems and backwardscompatibility requirements. In the same sense, the reader caneasily expand the system nature of each part of illustrated inFig. 1.
It should be noted that a communication medium is of greatimportance for the proper operation of a next-generation net-work. In fact, such a medium is required so that the componentsof the SoS can collaborate and communicate with each other.Without the existence of a communication medium, which is anoptical fiber in the case of a PON, the study of the SoS would notbe feasible. As this medium of communication has interfaceswith each of the individual systems, it clearly plays a key rolein their operation affecting the performance of the whole SoS.
Before proceeding in such an analysis, the question whetherthe design, construction, and maintenance of an FTTH networkis in fact an SoS should be answered. Hence, one should inves-tigate if the design, construction, and maintenance of an FTTHnetwork meet the characteristics of an SoS, as defined in theliterature.
It should be noted that each of the constituent systems playsits own significant role in the provision of high data rates. Simul-taneously, an FTTH network is constructed in order to supplyadvanced services that would not be available from each of theconstituent systems. On the other hand, the integration of dif-ferent parts of an FTTH network in an SoS structure restrictstheir characteristics. The optical fiber which is one of the keyparts of the network is designed to support very long distances.However, in an FTTH network, the optical fiber is essentiallyforced to be limited to the short distances of the network cov-erage. Additionally, in the design, manufacture, and provisionof such a network, as well as during its operation various fac-tors such as selection of appropriate components and interfaces,
geographical and morphological characteristics as well as de-mand should be taken into account. The multitude of thesefactors increases the complexity of the system imposing theinvolvement of experts apart from engineers.
Another feature of an SoS is the differences in geographiclocation of the member systems [15], [25]. It is worth notingthat this is a common characteristic of PONs, where the dis-tances between the CO and the intermediate node as well asbetween the intermediate node and the end users are few tens ofkilometers. The information is transmitted from one system toanother providing the desired services to end users. This featureis further enhanced by the construction and maintenance parts ofthe proposed SoS. It is interesting to note that both can performeither centralized of distributed operations. For example, dur-ing the maintenance process, several problems can be addressedcentrally from the CO using proper software platforms. On theother hand, more serious problems such as damages should beaddressed in the field by several workshops which are usuallyindependent and physically dispersed.
At the same time, the uncertainty of demand and price evolu-tion, as well as the variety of architectures suitable for an FTTHnetwork, enhances the SoS nature of this network. In the caseof an access network, the network operator constructs a systemto meet the requirements of users in order to minimize the totalcost of the network and, therefore, to maximize profitability. Theproblem of building such a network is mainly an optimizationproblem that includes variables like geographical distribution inaddition to the cost of various components, the cost of wiring,the installation cost, as well as the cost of maintenance.
By incorporating in the system design the variety of networkarchitectures and technologies that can be selected, as well asthe uncertainty regarding the demand, the SoS character of theproblem is enhanced. The solution to this nonlinear problem canhighlight the advantageous architecture for the network underconsideration, facilitating the decision making process of thenetwork operator.
It is widely accepted that the construction, dimensioning,operation, and maintenance of the FTTH network deal withtechnical issues such as selection, integration, and interoper-ability of the various components and systems of the networkdeployment and operation. In addition, social and economicfactors such as cost of capital, marketing, demand forecast, andepidemic adoption are also related to the FTTH services andstrategies. Therefore, it can be concluded that an FTTH net-work rests on both paths of the SoSE and such a notion can beused in order to provide useful insights about the complexity ofnetwork systems deployment and operations. In the followingparagraphs, this notion is used in order to provide such insightsabout the technoeconomic aspects of the SoS FTTH network,by calculating cost figures which can be exploited by telecomoperators, vendors, regulators, and policy makers.
B. Topology and Area Characteristics
In this study, three areas are considered and described interms of subscribers’ density, loop lengths, and geographical and
ROKKAS et al.: COST ANALYSIS OF WDM AND TDM FIBER-TO-THE-HOME (FTTH) NETWORKS: A SYSTEM-OF-SYSTEMS APPROACH 1845
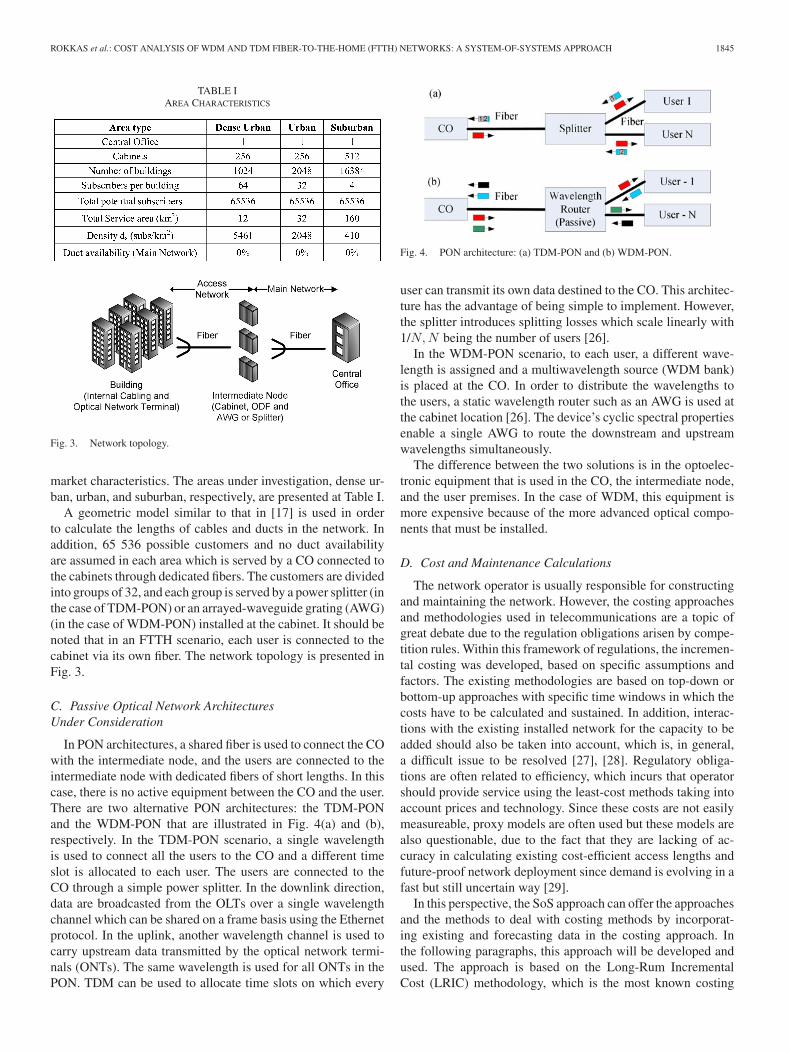
TABLE IAREA CHARACTERISTICS
Fig. 3. Network topology.
market characteristics. The areas under investigation, dense ur-ban, urban, and suburban, respectively, are presented at Table I.
A geometric model similar to that in [17] is used in orderto calculate the lengths of cables and ducts in the network. Inaddition, 65 536 possible customers and no duct availabilityare assumed in each area which is served by a CO connected tothe cabinets through dedicated fibers. The customers are dividedinto groups of 32, and each group is served by a power splitter (inthe case of TDM-PON) or an arrayed-waveguide grating (AWG)(in the case of WDM-PON) installed at the cabinet. It should benoted that in an FTTH scenario, each user is connected to thecabinet via its own fiber. The network topology is presented inFig. 3.
C. Passive Optical Network ArchitecturesUnder Consideration
In PON architectures, a shared fiber is used to connect the COwith the intermediate node, and the users are connected to theintermediate node with dedicated fibers of short lengths. In thiscase, there is no active equipment between the CO and the user.There are two alternative PON architectures: the TDM-PONand the WDM-PON that are illustrated in Fig. 4(a) and (b),respectively. In the TDM-PON scenario, a single wavelengthis used to connect all the users to the CO and a different timeslot is allocated to each user. The users are connected to theCO through a simple power splitter. In the downlink direction,data are broadcasted from the OLTs over a single wavelengthchannel which can be shared on a frame basis using the Ethernetprotocol. In the uplink, another wavelength channel is used tocarry upstream data transmitted by the optical network termi-nals (ONTs). The same wavelength is used for all ONTs in thePON. TDM can be used to allocate time slots on which every
Fig. 4. PON architecture: (a) TDM-PON and (b) WDM-PON.
user can transmit its own data destined to the CO. This architec-ture has the advantage of being simple to implement. However,the splitter introduces splitting losses which scale linearly with1/N,N being the number of users [26].
In the WDM-PON scenario, to each user, a different wave-length is assigned and a multiwavelength source (WDM bank)is placed at the CO. In order to distribute the wavelengths tothe users, a static wavelength router such as an AWG is used atthe cabinet location [26]. The device’s cyclic spectral propertiesenable a single AWG to route the downstream and upstreamwavelengths simultaneously.
The difference between the two solutions is in the optoelec-tronic equipment that is used in the CO, the intermediate node,and the user premises. In the case of WDM, this equipment ismore expensive because of the more advanced optical compo-nents that must be installed.
D. Cost and Maintenance Calculations
The network operator is usually responsible for constructingand maintaining the network. However, the costing approachesand methodologies used in telecommunications are a topic ofgreat debate due to the regulation obligations arisen by compe-tition rules. Within this framework of regulations, the incremen-tal costing was developed, based on specific assumptions andfactors. The existing methodologies are based on top-down orbottom-up approaches with specific time windows in which thecosts have to be calculated and sustained. In addition, interac-tions with the existing installed network for the capacity to beadded should also be taken into account, which is, in general,a difficult issue to be resolved [27], [28]. Regulatory obliga-tions are often related to efficiency, which incurs that operatorshould provide service using the least-cost methods taking intoaccount prices and technology. Since these costs are not easilymeasureable, proxy models are often used but these models arealso questionable, due to the fact that they are lacking of ac-curacy in calculating existing cost-efficient access lengths andfuture-proof network deployment since demand is evolving in afast but still uncertain way [29].
In this perspective, the SoS approach can offer the approachesand the methods to deal with costing methods by incorporat-ing existing and forecasting data in the costing approach. Inthe following paragraphs, this approach will be developed andused. The approach is based on the Long-Rum IncrementalCost (LRIC) methodology, which is the most known costing

1846 IEEE TRANSACTIONS ON HUMAN-MACHINE SYSTEMS, VOL. 42, NO. 6, NOVEMBER 2012
TABLE IIMAINTENANCE MATERIAL CLASSIFICATIONS
approach in telecommunications investments. The methodol-ogy aims in a long-run time window to measure the change inthe total costs of the telecom operator that arises from an in-crease or decrease in the telecom output by a substantial anddiscrete increment considering, in the long-run, all costs vari-able. It should be denoted that the use of incremental method-ology for cost analysis should be carefully considered since ittolerates strong assumptions, which need to be usually evalu-ated and eventually restated [30], [31]. In addition, as the costof bandwidth is nowadays lower than the cost of maintainingand operating the network, the measurement of Operation, Ad-ministration, and Maintenance cost is not a trivial issue sinceseveral nontypical factors are significant. In [32], some of thesefactors such as technology mix and capacity usage have beendiscussed in the case of US telecom industry.
However, the LRIC method, enhanced with the SoSE con-cept, may overcome the shortcomings of existing approachesand provide useful information about the actual costs of telecom-munication networks. For the analysis presented hereafter, it hasbeen assumed that no infrastructure is present in the areas underinvestigation. This represents a “Greenfield” case, which can beexploited from policy makers, regulators, and new entrants intelecom market as a proxy model for decision making. It canalso be used to calculate state-aid subsidization or to benchmarkcross-subsidies between elements and services.
In order to estimate the required number of network compo-nents throughout the study period, broadband access forecastsare carried out according to the methodology described in [33].For each component as will be described in Section III, a pricecurve is calculated representing the component’s cost through-out the study period. The maintenance costs for the total net-work are estimated from the cost of each of its constitutive partsbased on the appropriate architectural model. The maintenancecost Mi for each of the installed network elements is calculatedaccording to equation:
Mi =Vi−1 + Vi
2
(Pi · Rclass + Plabor
MTTRMTBR
)(1)
where Plabor is the cost of the work hour (in€ /hour), and MTBRand MTTR stand for mean time between repairs (in years) andmean time to repair (in hours) for each cost component, respec-tively. Vi is the equipment volume in year i, Pi is the price ofcost item in year i, and Rclass is the maintenance cost percentage(defined by choosing maintenance material class for every costcomponent as per Table II).
In more detail, the maintenance cost is comprised with twocost elements. The term Pi · Rclass reflects an annual fixed costover component cost which is irrelevant to component failures.This cost item might be charged by vendors or not. The second
term in parenthesis PlabourMTTRMTBR reflects the annual equivalent
cost in case of failures or unavailability. The cost items should besummed up over the total numbers of components/subsystemsavailable in the network. However, since this number is chang-ing, the average number of specific components over the pasttwo years is used instead.
The cost of the whole system as presented later on is calcu-lated by summing up all the individual costs plus the mainte-nance costs for all the required subsystems.
E. Demand Model
A four-parameter logistic model [33], [34] was used to makebroadband subscription forecasts. These models are recom-mended and used for long-term forecasts even in light of theintroduction of new services. The aggregated demand for sub-scriptions is given by [33]
Yt =M
(1 + eα+βt)γ (2)
where Yt is the demand (subscriptions) at time t,M is the sat-uration level or total market potential, and α, β, and γ areparameters, which can be estimated by a regression analysisusing historical data of existing broadband connections.
III. LEARNING CURVES FOR TELECOM COMPONENTS
The rollout of an FTTH network includes several investmentsin specific telecommunications components used in order toprovide end-to-end connections with fiber. These componentsare often new in the market, and the majority of them havebeen invented and constructed specifically in order to provideFTTH solutions. The industry behind these equipments is quitenew, and the cost evolution of them follows the evolution of thetelecommunication market and is related to particular learningcurves.
Learning curves are used in the industry to predict reductionin production time or production cost as a function of producedvolume. The causes of cost reductions are better control of theproduction process, new production methods, new technology,redesign of the product, standardization, and automatization.
Learning curves present the relationship between cost (ortime) and level of activity on the basis of the effect of learning.An early study by Wright [35] disclosed the "80% learning"effect, which indicates that a given operation is subject to a20% productivity improvement each time the activity level orproduction volume doubles.
Learning curve can serve as a predictive tool to obtain timeestimates for tasks that are repeated within a project life cycle.Several alternate models of learning curves have been presentedin the literature. Some of the classical models are as follows[36]:
1) Log-linear model;2) S-curve model;3) Stanford-B model;4) DeJong’s learning formula;5) Levy’s adaptation function;6) Glover’s learning formula;

ROKKAS et al.: COST ANALYSIS OF WDM AND TDM FIBER-TO-THE-HOME (FTTH) NETWORKS: A SYSTEM-OF-SYSTEMS APPROACH 1847
TABLE IIIVARIATION IN nr (0) AND ΔT FOR EACH VOLUME CLASS
7) Pegels’ exponential function;8) Knecht’s upturn model;9) Yelle’s product model.The basic log-linear model is the most popular learning
curve model. It expresses a dependent variable (e.g., productioncost) in terms of some independent variable (e.g., cumulativeproduction).
In some later work [37] which is related to telecommunicationcomponents, Wright and Crawford’s learning curve [35], [38]models for cost predictions were examined. The models for costpredictions were extended not only to estimate the costs as afunction of number of produced units, but also as a functionof time. The cost prediction of each network component is de-scribed by expansion of the learning curve given as a functionof the several parameters. Therefore, the price P (t) of eachnetwork element is assumed to follow the extended learningcurve [37] :
P (t) = P (0)[nr (0)−1
{1 + eln[nr (0)−1 −1]− 2 ln 9
Δ T t}−1
]log2 K
(3)where P (0) is the price in the reference year 0, nr (0) is therelative accumulated production volume in year 0, (units soldin this year), ΔT is the time for the total production volumeto grow from 10% to 90% of its maximum value, and K isthe learning curve coefficient and reflects the price reductionexperienced when the production volume is doubled.
In cases where historical data are available, the parameters Kand ΔT can be determined using a standard regression analysis.
In the analysis presented hereafter, the parameters of thelearning curve are stored in a database built within the tech-noeconomic tool, which contains more than 1000 different net-work components [30], [39]. The components and subsystemsare grouped in several volume classes. Example values used forthe various volume classes are shown in Table III. In the sameway, the K parameter is estimated based on type of componentor subsystem, reflecting the learning process from other similarcomponents or systems. Fig. 5 presents the effect of ΔT for agiven nr (0), while Fig. 6 presents the effect of nr (0) for a givenΔT for a component with initially cost of 1000€ .
In the cost database, all components and subsystems are listedwith a given nr (0), ΔT, and K value in addition to the esti-mated cost P (0) in year 0. Then, the extended learning curve isuniquely defined and the prediction of the costs is determined.
Fig. 5. Effect of Δτ for given nr (0) = 0.5 for a component with initially cost1000€ .
Fig. 6. Effect of nr (0) for given Δτ = 10 for a component with initially cost1000€ .
In addition, the volume classes are chosen to cover the twoaspects of cost components: the type and maturity of cost com-ponents. The definition Old, Mature, etc., stands for the yearsthat the specific components offered in the market. The def-inition Fast, Medium, etc., stands for time in years to growthe total production volume from 10% to 90% of its maximumvalue. For example, for the components used in the analysis pre-sented herein, the installation or civil work costs are part of thestraight line class, fiber cables costs are in the mature mediumclass, lasers are new slow class components, switches belong tothe new medium class and new optoelectronic devices used atthe PON architectures under study are emerging medium classcomponents.
In case the components are new and no historical costs ex-ist, a priori values have to be chosen. Examples are shown inTables III and IV. Typical values of the learning curve coefficientare from 1 (100%) (Meaning no cost reduction) to 0.7 (70%),giving 30% reduction for doubling of production volume. Anadditional doubling of the production will reduce the cost by51%.
Fig. 7 illustrates the curve prices for some of network keycomponents normalized at 1000€ initial cost. It should be noted

1848 IEEE TRANSACTIONS ON HUMAN-MACHINE SYSTEMS, VOL. 42, NO. 6, NOVEMBER 2012
TABLE IVK Values for Component Groups
Fig. 7. Cost curves for some components used normalized at initially cost of1000€ .
Fig. 8. SoS incremental cost of WDM and TDM for dense urban area.
that the actual cost prices for the components used in the studyare mostly different than those presented in Fig. 7.
IV. RESULTS AND DISCUSSION
A. System-of-Systems Incremental Cost
Fig. 8 illustrates the SoS incremental cost (cost per user andthe total cost of the network installation) for both TDM andWDM PON technologies for the dense urban area. The WDMsolution appears more expensive than TDM due to the mostexpensive equipment used at customer premises and network.
Fig. 9. Cost per user for various demand models in the case of TDM.
The cost per user is initially high due to large investments andlow initial utilization of the network. As the rollout of the FTTHnetwork is proceeding and more customers are connected to thenetwork, the SoS incremental cost (per user) reduces yieldingin the area of 2000€ and 2500€ for TDM and WDM solutions,respectively. The shape of the cost per user function is similarto price curves figures illustrating the additional cost for theimplementation of the FTTH SoS.
In order to estimate the impact of user distribution and adop-tion in terms of homes connected throughout the years to thecost per user, the demand has been modeled using three differentways: the original S-curve described in (2), the slight modifiedS-curve with the saturation point M reached before the end ofthe study period and a simplified linear one. All three modelshave the same initial and end values, and the difference amongthem is that in the linear model, more subscribers are connectedearlier in the FTTH period that the two other ones. The originalmodel described in (2) can be seen as a typical intermediatemodel in contradiction to the other two alternatives. Fig. 9 illus-trates the cost per user that is calculated for the case of TDM indense urban areas for all three demand models.
It can be observed that there are no significant differences byusing three different demand models other than that the S-curvemodel that reaches saturation earlier has slightly lower costprices. In this case, it can be concluded that an increased rateas in the S-curve model leads to a reduction in the connectioncost per user by 10%. This result can be exploited by policymakers and regulators aiming to boost FTTH deployment bysubsidizing the deployment cost. However, for the rest of theanalysis, the original model for the demand has been used asdescribed in (2). This is due to the fact that it reflects a rathertypical technology adoption curve, and it is generic enough toreflect the different adoption strategies worldwide.
Fig. 10 illustrates the SoS incremental cost (cost per userand total cost) for both alternative PON technologies for allthree examined areas. The solid lines present the total costs(right Y -axis), while the dotted ones the cost per user (leftY -axis). The solid dots represent WDM and the open onesTDM, while the square, triangle, and circle symbols representdense urban, urban, and suburban areas, respectively. In all areas,

ROKKAS et al.: COST ANALYSIS OF WDM AND TDM FIBER-TO-THE-HOME (FTTH) NETWORKS: A SYSTEM-OF-SYSTEMS APPROACH 1849
Fig. 10. Cost per user and total cost of WDM and TDM for all examinedareas.
WDM is more expensive than TDM, and in suburban areas,the costs are significantly higher than dense urban and urbanareas due to the lower subscriber’s density leading to higherduct and fiber length deployments that are the major part of theinvestments. The SoS incremental cost (per user) reaches almost12 500€, while in the urban areas, the cost is below 3500€(dense urban 2000€ ). The total SoS cost for the suburban areasis around six times larger than in dense urban areas and aroundfour times from urban. This explains the operators willingnessto announce investment plans for FTTH in dense urban areas,and the discussion follows about the public state aid, in termsof regulation measures or subsidization procedures for the restof the areas [40].
B. Time-Division Multiplexing and Wavelength-DivisionMultiplexing Adoption Under Different Policies
Nowadays, several FTTH projects have been announced es-pecially in Europe [41], but the vast majority have been delayed.The impact of delaying the WDM deployment in a dense urbanarea from one to three years have been studied and presentedhereafter in order to incorporate this decision alternative in theanalysis. For simplicity, it has been assumed that no other al-ternative networks are implemented in the same area. Fig. 11reveals that the SoS cost per user varies significantly when theoperator suspends the introduction of FTTH for one year: thecost per user reduces to almost 35%, while the delay for two andthree years leads to a 23% and 16% reduction, respectively, forthe WDM solution. For the case of TDM, the reduction is 30%for one year delay, and 21% and 14% for two and three years,respectively. This variance is due to the fact that the operatorsare benefitted from the increasing demand in these areas and thecost reduction of the individual components and subsystems.
Fig. 12 illustrates the total cumulative investments cost forWDM and TDM cases (dense urban area) for different FTTHlaunch year. The delay in the rollout leads to a reduction ofabout 1M€ per year for WDM and 0.4M€ for TDM of suspen-sion due to the reduced price of the necessary components andsystems, as described in Section III. Furthermore, the operatorcan benefit from the time value of the money (distribution of the
Fig. 11. Impact of delay at cost per user for TDM and WDM in dense urbanareas.
Fig. 12. Impact of delay at total cost for TDM and WDM in dense urban areas.
costs within the rollout). For example, the total cost for cover-ing the expected subscriber with no delay in the rollout of theproject reaches 32M€ for the first four years (Y0 : 15.5M€ , Y1 :4.5M€ , Y2 : 5.5M€ , and Y3 : 6.5M€ , respectively) for WDM.For three years of suspension, the operator should invest 29M€.In case of TDM, the total investment for the first four years is26M€ , and with three years delay, it is 25M€ .
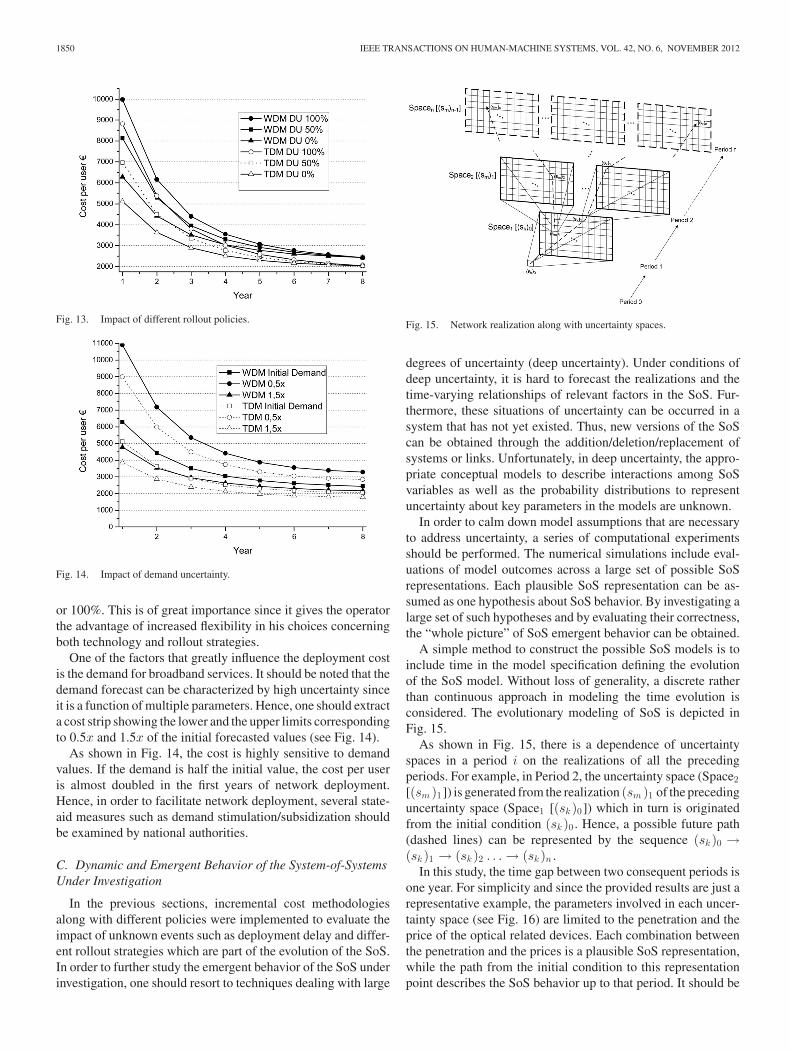
In the previous simulations, there was a gradually increasingrollout starting from 0% and achieving 100% at the final (8)year of the deployment. Alternative an operator can build theentire necessary infrastructure in the area in the first year ofdeployment (initial rollout at 100%). A mediocre solution is tobegin from 50% and achieve 100% at the end year. These threepolicies have been examined, and the results are presented inFig. 13 for both TDM and WDM cases.
From Fig. 13, it can be deduced that in the case of 100% initialrollout, the cost in the first years is almost doubled and the pricesconverge after five years in each technology. Furthermore, it isinteresting to note that in contrast with the previous obtainedresults, there are cases in which WDM is preferred against TDM.For example, the cost per user of WDM with initial deploymentof 0% is lower than that of TDM with initial deployment of 50%
1850 IEEE TRANSACTIONS ON HUMAN-MACHINE SYSTEMS, VOL. 42, NO. 6, NOVEMBER 2012
Fig. 13. Impact of different rollout policies.
Fig. 14. Impact of demand uncertainty.
or 100%. This is of great importance since it gives the operatorthe advantage of increased flexibility in his choices concerningboth technology and rollout strategies.
One of the factors that greatly influence the deployment costis the demand for broadband services. It should be noted that thedemand forecast can be characterized by high uncertainty sinceit is a function of multiple parameters. Hence, one should extracta cost strip showing the lower and the upper limits correspondingto 0.5x and 1.5x of the initial forecasted values (see Fig. 14).
As shown in Fig. 14, the cost is highly sensitive to demandvalues. If the demand is half the initial value, the cost per useris almost doubled in the first years of network deployment.Hence, in order to facilitate network deployment, several state-aid measures such as demand stimulation/subsidization shouldbe examined by national authorities.
C. Dynamic and Emergent Behavior of the System-of-SystemsUnder Investigation
In the previous sections, incremental cost methodologiesalong with different policies were implemented to evaluate theimpact of unknown events such as deployment delay and differ-ent rollout strategies which are part of the evolution of the SoS.In order to further study the emergent behavior of the SoS underinvestigation, one should resort to techniques dealing with large
Fig. 15. Network realization along with uncertainty spaces.
degrees of uncertainty (deep uncertainty). Under conditions ofdeep uncertainty, it is hard to forecast the realizations and thetime-varying relationships of relevant factors in the SoS. Fur-thermore, these situations of uncertainty can be occurred in asystem that has not yet existed. Thus, new versions of the SoScan be obtained through the addition/deletion/replacement ofsystems or links. Unfortunately, in deep uncertainty, the appro-priate conceptual models to describe interactions among SoSvariables as well as the probability distributions to representuncertainty about key parameters in the models are unknown.
In order to calm down model assumptions that are necessaryto address uncertainty, a series of computational experimentsshould be performed. The numerical simulations include eval-uations of model outcomes across a large set of possible SoSrepresentations. Each plausible SoS representation can be as-sumed as one hypothesis about SoS behavior. By investigating alarge set of such hypotheses and by evaluating their correctness,the “whole picture” of SoS emergent behavior can be obtained.
A simple method to construct the possible SoS models is toinclude time in the model specification defining the evolutionof the SoS model. Without loss of generality, a discrete ratherthan continuous approach in modeling the time evolution isconsidered. The evolutionary modeling of SoS is depicted inFig. 15.
As shown in Fig. 15, there is a dependence of uncertaintyspaces in a period i on the realizations of all the precedingperiods. For example, in Period 2, the uncertainty space (Space2[(sm )1]) is generated from the realization (sm )1 of the precedinguncertainty space (Space1 [(sk )0]) which in turn is originatedfrom the initial condition (sk )0 . Hence, a possible future path(dashed lines) can be represented by the sequence (sk )0 →(sk )1 → (sk )2 . . . → (sk )n .
In this study, the time gap between two consequent periods isone year. For simplicity and since the provided results are just arepresentative example, the parameters involved in each uncer-tainty space (see Fig. 16) are limited to the penetration and theprice of the optical related devices. Each combination betweenthe penetration and the prices is a plausible SoS representation,while the path from the initial condition to this representationpoint describes the SoS behavior up to that period. It should be

ROKKAS et al.: COST ANALYSIS OF WDM AND TDM FIBER-TO-THE-HOME (FTTH) NETWORKS: A SYSTEM-OF-SYSTEMS APPROACH 1851
Fig. 16. SoS plausible representation for different combinations of penetrationand price.
Fig. 17. One of the possible SoS representations after eight years in the caseof TDM.
Fig. 18. One of the possible SoS representations after eight years in the caseof WDM.
noted that the results obtained in previous sections correspondto specific paths of SoS exploratory representations.
In Figs. 17 and 18, one of the possible representations of SoSat the uncertainty space 7 (after eight years) is illustrated as acolor map. Different colors correspond to different cost valuesper user in the case of TDM and WDM for the dense urbanareas estimated using the methodologies described in previoussections. It should be highlighted that the penetration-price pairsused for the path up to this space is identical to that of Fig. 8.
Using the color map of Figs. 17 and 18, one can predict theimpact of possible changes by estimating the cost values anddetermine the emergent behaviors of the SoS by exploring thecorresponding paths.
In a next step, decision criteria can also be incorporated inorder to determine whether a certain investment is economicallypossible according to expected budget and will, therefore, fa-cilitate the investors. Hence, at the end of investment life (e.g.,eight years), the performance of the investment must be su-perior (i.e., minimum cost). In this case, a criterion for a costbelow the average cost of all SoS representations is assumed (seeFigs. 19 and 20).
Fig. 19. Average cost as a decision criterion in the case of TDM.
Fig. 20. Average cost per user as a decision criterion in the case of TDM.
V. CONCLUSION
In this paper, an SoS approach for telecommunications andespecially FTTH networks has been introduced and illustrated.The characteristics of the SoS have been studied by investigat-ing different adoption strategies for TDM and WDM technolo-gies. The SoS evolution, that is, SoS changes stemming fromlink/system addition/replacement, was investigated through ex-ploratory modeling. The installation costs of these networks inrelation with several key parameters like geographical distri-bution and the year of introduction have been investigated anddiscussed. The cost per additional user follows the price curveshape, and it is of major importance for the decision process fora greenfield operator in order to estimate the maximum financeneeded for the implementation. It should be also denoted thateven the technology choice could be of minor importance forthe incremental cost, at least from the SoS point of view, if theoverall project is postponed for some years until the market andthe main components are mature enough.
ACKNOWLEDGMENT
The authors would like to acknowledge the long-lasting fruit-ful collaboration with the partners of the IST-TONIC [31] andCELTIC-ECOSYS [42] technoeconomic projects, which of-fered methodologies, tools, and research ideas for the evaluationof telecommunications networks deployment strategies. Theywould also like to thank the associate editor and the anony-mous reviewers for the fruitful comments which considerablyimproved this paper.

1852 IEEE TRANSACTIONS ON HUMAN-MACHINE SYSTEMS, VOL. 42, NO. 6, NOVEMBER 2012
REFERENCES
[1] A. Gorod, B. Sauser, and J. Boardman, “System-of-systems engineeringmanagement: A review of modern history and a path forward,” IEEE Syst.J., vol. 2, no. 4, pp. 484–499, Dec. 2008.
[2] W. C. Baldwin and B. Sauser, “Modeling the characteristics of systemof systems,” in Proc. IEEE Int. Conf. Syst. Syst. Eng., May/Jun. 2009,pp. 1–6.
[3] SoS and FoS FAQ, Office of the Under Secretary of Defense for Acquisi-tion Technology and Logistics.
[4] C. Keating, R. Rogers, R. Unal, D. Dryer, A. Sousa-Poza, R. Safford,W. Peterson, and G. Rabadi, “System of systems engineering,” Eng. Man-age. J., vol. 15, p. 36, Sep. 2003.
[5] P. Chen and J. Clothier, “Advancing systems engineering for systems-of-systems challenges,” vol. 6, pp. 170–183, 2003.
[6] A. Sousa-Poza, S. Kovacic, and C. Keating, “System of systems engineer-ing: an emerging multidiscipline,” Int. J. Syst. Syst. Eng., vol. 1, pp. 1–17,2008.
[7] M. Mansouri, B. Sauser, and J. Boardman, “Applications of systems think-ing for resilience study in maritime transportation system of systems,” inProc. 3rd Annu. IEEE Syst. Conf., 2009, pp. 211–217.
[8] N. Khabarov, E. Moltchanova, and M. Obersteiner, “Valuing weatherobservation systems for forest fire management,” IEEE Syst. J., vol. 2,no. 3, pp. 349–357, Sep. 2008.
[9] R. C. Byrd, J. M. Moss, W. C. Priedhorsky, C. A. Pura, G. W. Richter,K. J. Saeger, W. R. Scarlett, S. C. Scott, and R. L. Wagner, Jr., “Nucleardetection to prevent or defeat clandestine nuclear attack,” IEEE SensorsJ., vol. 5, no. 4, pp. 593–609, Aug. 2005.
[10] K. Daniel, B. Dusza, A. Lewandowski, and C. Wietfeld, “AirShield: Asystem-of-systems MUAV remote sensing architecture for disaster re-sponse,” in Proc. 3rd Annu. IEEE Syst. Conf., 2009, pp. 196–200.
[11] I. Melgar, J. Fombellida, A. Jevtic, and J. Seijas, “Swarm architectures forground-based air defense systems of systems,” presented at the 7th IEEEInt. Conf. Ind. Informat., Cardiff, U.K., 2009.
[12] T. Ender, R. Leurck, B. Weaver, P. Miceli, W. D. Blair, P. West, andD. Mavris, “Systems-of-systems analysis of ballistic missile defense ar-chitecture effectiveness through surrogate modeling and simulation,” inProc. Annu. IEEE Syst. Conf., 2008, pp. 1–8.
[13] S. S. Durbha, R. L. King, and N. H. Younan, “An information semanticsapproach for knowledge management and interoperability for the globalearth observation system of systems,” IEEE Syst. J., vol. 2, no. 3, pp. 358–365, Sep. 2008.
[14] Y. Hata, S. Kobashi, and H. Nakajima, “Human health care system ofsystems,” IEEE Syst. J., vol. 3, no. 2, pp. 231–238, Jun. 2009.
[15] M. Jamshidi, Systems of Systems Engineering : Principles and Applica-tions. Boca Raton, FL: CRC Press, 2009.
[16] T. Rokkas, D. Katsianis, and D. Varoutas, “Techno-economic evaluationof FTTC/VDSL and FTTH roll-out scenarios: Discounted cash flows andreal option valuation,” IEEE/OSA J. Opt. Commun. Netw., vol. 2, no. 9,pp. 760–772, Sep. 2010.
[17] T. Monath, N. K. Elnegaard, P. Cadro, D. Katsianis, and D. Varoutas,“Economics of fixed broadband access network strategies,” IEEE Com-mun. Mag., vol. 41, no. 9, pp. 132–139, Sep. 2003.
[18] B. T. Olsen, D. Katsianis, D. Varoutas, K. Stordahl, J. Harno,N. K. Elnegaard, I. Welling, F. Loizillon, T. Monath, and P. Cadro, “Tech-noeconomic evaluation of the major telecommunication investment op-tions for European players,” IEEE Netw., vol. 20, no. 4, pp. 6–15, Jul./Aug.2006.
[19] D. B. Agusdinata and D. DeLaurentis, “Specification of system-of-systems for policymaking in the energy sector,” Integr. Assess. J., vol. 8,pp. 1–24, 2008.
[20] S. Bankes, “Exploratory modeling for policy analysis,” Oper. Res., vol. 41,pp. 435–449, 1993.
[21] M. Jamshidi, System of Systems Engineering: Innovations for the 21stCentury. Hoboken, NJ: Wiley, 2009.
[22] Y. Ke-Wei, C. Ying-Wu, L. Yan-Jing, and Z. Qing-Song, “The study ofguided emergent behavior in system of systems requirement analysis,” inProc. 5th Int. Conf. Syst. Syst. Eng., Jun. 2010, pp. 1–5.
[23] J. Gu and X. Tang, “Meta-synthesis approach to complex system model-ing,” Eur. J. Operational Res., vol. 166, pp. 597–614, 2005.
[24] C. D. Blair, J. T. Boardman, and B. J. Sauser, “Communicating strategicintent with systemigrams: Application to the network-enabled challenge,”Syst. Eng., vol. 10, pp. 309–322, 2007.
[25] D. DeLaurentis and R. K. Callaway, “A system-of-systems perspectivefor public policy decisions,” Rev. Policy Res., vol. 21, pp. 829–837, 2004.
[26] C.-H. Lee, W. V. Sorin, and B. Y. Kim, “Fiber to the home using a PONinfrastructure,” J. Lightw. Technol., vol. 24, no. 12, pp. 4568–4583, Dec.2006.
[27] W. H. Melody, Telecom Reform: Principles, Policies and Regulatory Prac-tices. Kongens Lyngby, Denmark: Tech. Univ. Denmark, 1997.
[28] EURESCOM-P901, European Institute for Research and Strategic Studiesin Telecommunications GmbH, Heidelberg, Germany, 2001.
[29] C. M. Dippon and K. E. Train, “The cost of the local telecommunicationnetwork: A comparison of minimum spanning trees and the HAI model,”Telecommun. Policy, vol. 24, pp. 253–262, 2000.
[30] L. Ims, Broadband Access Networks Introduction Strategies and Techno-economic Evaluation. London, U.K.: Chapman & Hall, 1998.
[31] TONIC/IST-25172, “Techno-economics of IP Optimised Networks andServices,” 2000.
[32] R. D. Banker, H.-H. Chang, and S. K. Majumdar, “Economies of scope inthe U.S. telecommunications industry,” Inf. Econ. Policy, vol. 10, pp. 253–272, 1998.
[33] K. Stordahl and K. O. Kalhagen, “Broadband access forecasts for theEuropean market,” Telektronikk, vol. 98, pp. 21–32, 2002.
[34] C. Michalakelis, D. Varoutas, and T. Sphicopoulos, “Diffusion models ofmobile telephony in Greece,” Telecommun. Policy, vol. 32, pp. 234–245,Apr./May 2008.
[35] T. P. Wright, “Factors affecting the cost of airplanes,” J. Aeronaut. Sci.,vol. 3, pp. 122–128, 1936.
[36] A. B. Badiru and A. O. Ijaduola, “Half-life theory of learning curves forsystem performance analysis,” IEEE Syst. J., vol. 3, no. 2, pp. 154–165,Jun. 2009.
[37] B. T. Olsen and K. Stordahl, “Models for forecasting cost evolution ofcomponents and technologies,” Telektronikk, vol. 4, pp. 138–148, 2004.
[38] J. R. Crawford, Learning Curve, Ship Curve, Ratios, Related Data, Lock-heed Aircraft Corp., Burbank, CA, 1944.
[39] D. Katsianis, I. Welling, M. Ylonen, D. Varoutas, T. Sphicopoulos,N. K. Elnegaard, B. T. Olsen, and L. Budry, “The financial perspectiveof the mobile networks in Europe,” IEEE Pers. Commun., vol. 8, no. 6,pp. 58–64, Dec. 2001.
[40] European Commission, “i2010 A European Information Soci-ety for Growth and Employment: Extended Impact Assess-ment,” Brussels, Belgium: Commission of European Communities,(2005). [Online]. Available: http://ec.europa.eu/dgs/information_society/evaluation/data/pdf/ia/i2010extended_impact_assessment.pdf
[41] Fiber to the Home Council Europe. [Online]. Available: http://www.ftthcouncil.eu/
[42] CELTIC-ECOSYS “Technoeconomics of Integrated CommunicationSystems and Services,” (2002). [Online]. Available: http://www.celtic-initiative.org/Projects/Celtic-projects/Call1/ECOSYS/ecosys-default.asp
Theodore Rokkas received the B.Sc. degree inphysics, the M.Sc. degree in electronics and radiocommunications, and the Ph.D. degree in techno-economic evaluation of next-generation networksfrom the University of Athens, Athens, Greece.
He is currently with the University of Athens.He has actively participated in several technoeco-nomic activities for telecommunications, networks,and services, and in several European and nationalR&D projects. His research interests include tech-noeconomic evaluation of network architectures and
services, mobile communication systems, broadband and wireless systems andnetworks, and methodologies for network design.
Ioannis Neokosmidis received the Physics degree,the M.Sc. degree in radioelectrology and electronics,and the Ph.D. diploma in optical nonlinear networksfrom the University of Athens, Athens, Greece.
He is currently a Research Associate and AdjunctLecturer with the University of Athens. He partici-pated in European and National projects. He has morethan 30 publications with two best paper awards andmore than 100 citations. His research interests in-clude system of systems, deep uncertainties, opticalcommunications, and technoeconomics. He serves as
reviewer in leading IEEE/OSA Journals and conferences. His biography is listedin Marquis and Hubners Blaues Who’s Who.

ROKKAS et al.: COST ANALYSIS OF WDM AND TDM FIBER-TO-THE-HOME (FTTH) NETWORKS: A SYSTEM-OF-SYSTEMS APPROACH 1853
Dimitris Katsianis received the Informatics degree,the M.Sc. degree in signal processing and computa-tional systems, and the Ph.D. diploma in network de-sign with technoeconomics aspects from the Depart-ment of Informatics and Telecommunications, Uni-versity of Athens, Athens, Greece.
He is a Senior Research Fellow with the Opti-cal Communications Group, University of Athens,participating in several European and national R&Dprojects. He has worked as an Expert Scientific Advi-sor with several firms in the field of technoeconomic
and network design including national activities for technoeconomic evaluationof telecommunication strategies and regulation policies. He has more than 60publications in journals and conferences in the field of technoeconomics andtelecommunication network design.
Dimitris Varoutas (M’98–SM’11) received thePhysics degree, and the M.Sc. and Ph.D. degrees incommunications and technoeconomics from the Uni-versity of Athens, Athens, Greece.
He is currently an Assistant Professor with theDepartment of Informatics and Telecommunications,University of Athens. He has contributed to more than100 publications in refereed journals and conferencesin telecommunications, optoelectronics, and tech-noeconomics, including leading IEEE journals andconferences.
Dr. Varoutas is a Senior Member of the photonics (formerly LEOS), commu-nications, education, and engineering management societies of the IEEE, andserves as a reviewer in several journals and conferences, including those of theIEEE. Since 2007, he has been a member of the BOG of ADAE, the NationalAuthority for Communications Security and Privacy.