18 jan 05 - international energy agency · and extensive knowledge of oil demand patterns will be...
TRANSCRIPT

www.oilmarketreport.org
Next Issue: 10 February 2005
IN TERNATIO N AL ENERG Y AGEN CY
AGENCE INTERNATIONALE DE L’ENERGIE
18 January 2005
HIGHLIGHTS
• Crude oil prices were extremely volatile at the turn of the year.
Benchmark NYMEX light crude fell by $10 in early December to $40.25 but an early January rally has since pushed prices back up over $48/bbl. Non-OPEC supply problems, proposed OPEC production cuts and forecasts of colder weather have underpinned prices.
• OECD industry total oil stocks rose by 1.4 mb/d in November 2004,
or about 42 mb, closing 81 mb above year-ago levels. Crude stocks increased 22 mb while gains in products, led by distillate fuels, came to 18 mb. Forward demand cover was flat in November at 52 days, one day above that of 2003.
• World oil supply averaged 84.4 mb/d in December, down by 45 kb/d
from November. Non-OPEC output fell 165 kb/d due to disruptions in Norway and Canada and lower Russian output. Non-OPEC supply is revised down by 160 kb/d for 2005, growth averaging 1.1 mb/d versus 1.0 mb/d in 2004. OPEC other liquids growth remains at 450 kb/d.
• OPEC crude supply was level at 29.5 mb/d, higher Iraq and UAE
volumes offsetting lower supply from Nigeria and others. OPEC-10 agreed to cut production by 1.0 mb/d from January, bringing output closer to the 27.0 mb/d target. Winter revisions raise the call on OPEC crude and stock change to 28 mb/d for 2005, near the 2004 average.
• Global oil demand growth is roughly unchanged for 2004, at
2.65 mb/d, but has been slightly raised for 2005, to 1.44 mb/d. Fourth-quarter demand was stronger than expected in North America, Europe and China but weaker in OECD Asia, India and the FSU. Growth is set to slow in 2005, but will still be led by China and non-OECD Asia.

Letter from the Editor Staff Changes:
After four years working at the IEA’s Oil Industry and Markets Division, Antoine Halff will be returning to industry. Antoine’s work on the Oil Market Report began with Price analysis, but his main contribution has been on the Demand side. His insights and extensive knowledge of oil demand patterns will be sorely missed by the Agency and by his colleagues. As Antoine leaves for new horizons, all of us at the IEA wish him well in his new endeavours. At the same time, I am pleased to welcome Dr. Jeffery Brown to the IEA. Jeff comes to us after a successful career in research and consulting focused on Asia and global energy markets. He will assume responsibility for demand analysis and can be reached at +33 (0)1 40 57 65 93. After five years, I too am leaving the IEA with effect from this Report. I would like to thank the IEA and my colleagues, past and present for their friendship, confidence and support over the years. I would also like to extend my gratitude to you, our readers, and to the broader analytical community, for your critical insights and encouragement and I hope you will, in due course, extend similar courtesies to my successor. With warm regards, Klaus Rehaag Editor – Oil Market Report

CONTENTS
HIGHLIGHTS...................................................................................................................................1
A CAUTIONARY NOTE..................................................................................................................4
DEMAND .........................................................................................................................................5 Summary .......................................................................................................................................5 OECD............................................................................................................................................6
Early Indications of Current Demand .........................................................................................6 Pacific........................................................................................................................................7 North America ...........................................................................................................................8 Europe .......................................................................................................................................9
Non-OECD.................................................................................................................................. 10 China ....................................................................................................................................... 10 FSU ......................................................................................................................................... 11 Other Non-OECD .................................................................................................................... 11
SUPPLY.......................................................................................................................................... 13 Summary ..................................................................................................................................... 13 OPEC .......................................................................................................................................... 14 OECD.......................................................................................................................................... 17
North America ......................................................................................................................... 17 High Prices Not Driving A Surge in Investment - Yet .................................................................. 18
North Sea................................................................................................................................. 19 Former Soviet Union (FSU) ......................................................................................................... 20 Other Non-OPEC......................................................................................................................... 21
OECD STOCKS.............................................................................................................................. 23 Summary ..................................................................................................................................... 23 OECD Industry Stock Changes in November 2004....................................................................... 24 Revisions to Preliminary OECD Stocks and Inventory Position at End-November........................ 24 OECD Regional Stock Developments .......................................................................................... 25
North America ......................................................................................................................... 25 Europe ..................................................................................................................................... 26 Pacific...................................................................................................................................... 26
Singapore Stock Developments in December ............................................................................... 27
PRICES AND REFINERY ACTIVITY........................................................................................... 29 Summary ..................................................................................................................................... 29 Overview..................................................................................................................................... 30 Crude Oil Prices........................................................................................................................... 30
Spot Crude Prices and Differentials.......................................................................................... 30 Crude Futures .......................................................................................................................... 31 Delivered Crude Prices in October ........................................................................................... 32
Product Prices.............................................................................................................................. 32 Spot Product Prices .................................................................................................................. 32 Product Futures........................................................................................................................ 35 End-User Product Prices in December ...................................................................................... 37
Freight ......................................................................................................................................... 37 Refining Margins ......................................................................................................................... 38 Refinery Throughput.................................................................................................................... 40
A Look at 2005 Refining Issues ............................................................................................... 40
TABLES ......................................................................................................................................... 42
OIL MARKET REPORT CONTACTS

MARKET OVERVIEW INTERNATIONAL ENERGY AGENCY - MONTHLY OIL MARKET REPORT
4 18 JANUARY 2005
A CAUTIONARY NOTE WTI NYMEX averaged $41.47 in 2004, 33% over the 2003 average and almost 60% higher than 2002, as global product demand raced ahead of supply. Demand growth was largely unexpected in its magnitude and surged ahead by 2.6 mb/d, or 3.3%, in 2004, more than twice the rate anticipated at this time last year. This represents the highest rate of demand growth since 1976, when demand soared by a staggering 3.3 mb/d. Meanwhile, supply growth disappointed, with a string of late-year disruptions cutting the annual gain in non-OPEC crude and liquids output to 1.4 mb/d, compared to a year-earlier forecast of 1.9 mb/d.
Most forecasters, the IEA included, expect oil demand growth to slow in 2005 from the torrid pace of 2004. But what happens if it doesn’t? Given that last year’s demand growth came as a complete surprise to market participants, how can one dismiss concerns that demand growth might once again be underestimated? At the same time, further supply disruptions cannot be ruled out in an environment marked by geopolitical uncertainty. If oil consumption were to surge in 2005 as fast as in 2004, would producers be able to rise to the challenge?
Although the unanticipated surge in 2004 oil demand caught the market by surprise, OPEC producers did eventually respond by maximizing production. Key producers have indicated that they will increase exploration and development activity to maintain a sizeable level of spare capacity. But bringing this new capacity on line will take time and requires huge capital investments, money which could otherwise be earmarked for social and economic programs. Major expenditure programs are already required to offset depletion. International oil companies have also increased their exploration and development budgets. But years of cost-cutting have taken their toll on the service industry and constrain its ability to mobilize the rigs and manpower to meet demand. Even if producers can meet the quantity challenge, can they deliver on quality in line with seasonal peak demand?
But the problem of addressing capacity constraints is not limited to the upstream. Given huge reserves in key producing regions, ramping up output to meet surging demand may be a lesser challenge than overcoming midstream and downstream bottlenecks. It takes ever longer to expand refinery, pipeline and related shipping infrastructure. More stringent regulations and environmental standards impose new constraints on potential investors and increase their risk. These days, years are needed to plan, engineer and construct a new grassroots refinery – if it is possible at all. And ship construction yards are booked out years in advance.
In response to soaring demand, upstream, midstream and downstream operating levels in 2004 were stretched to the limit. Running with limited surplus capacity contributed to excess volatility and pressured prices as the threat of even a minor supply disruption could test the market in geopolitically uncertain times. Hence, unanticipated production outages due to weather (hurricanes in the US Gulf of Mexico) or unforeseen maintenance (North Sea platforms) caused prices to spiral upwards.
Oil demand and prices tend to be inversely correlated with a variable lag, but in 2004, demand failed to respond to price signals. This was due to a dramatic surge in economic activity, combined with low interest rates, which overwhelmed the negative impact of prices and pushed oil demand higher. With reduced global economic activity, lagged price effects should assert themselves in 2005 to slow demand. If not, oil demand will continue to run ahead of supply, pressuring prices and heightening volatility. With continued geopolitical uncertainty surrounding Russia, Iraq, Iran, Nigeria etc. it is all the more important that investment in supply and infrastructure anticipate and meet growing demand.
Global Oil Demand Growth vs. GDP Growth
-4
-2
0
2
4
6
8
1972 1976 1980 1984 1988 1992 1996 2000 2004
%
Global Oil Demand Growth GDP Growth (IMF)
Global Oil Demand Growth vs. Oil Price
0.0
0.5
1.0
1.5
2.0
2.5
3.0
1985 1988 1991 1994 1997 2000 2003
US$/bbl
0
5
10
15
20
25
30
35
40
45
mb/d
Global Oil Demand Growth NYMEX WTI

INTERNATIONAL ENERGY AGENCY - MONTHLY OIL MARKET REPORT DEMAND
18 JANUARY 2005 5
DEMAND Summary • The assessment of global oil product demand growth for 2004 is roughly unchanged at 2.65 mb/d.
Although upward adjustments to fourth-quarter demand have marginally increased the 2004 average, revisions to German demand for 2003 have raised the reference period estimate by a comparable amount.
Global Oil Demand from 2003 to 2005
Annual Change*
Demand (mb/d) (%) (mb/d)
Changes from last month’s Report
(mb/d)
1Q03 80.4 3.2 2.5 0.1 2Q03 77.3 1.5 1.1 0.1 3Q03 79.4 2.2 1.7 - 4Q03 82.1 2.5 2.0 -
1Q04 82.4 2.6 2.1 -
2Q04 81.2 5.0 3.9 - 3Q04 81.9 3.3 2.6 - 4Q04 84.2 2.5 2.0 0.2
1Q05 84.2 2.1 1.7 0.2 2Q05 82.4 1.5 1.2 0.2 3Q05 83.3 1.7 1.4 0.1 4Q05 85.6 1.7 1.4 0.1
2003 79.8 2.4 1.9 - 2004 82.4 3.3 2.7 0.1 2005 83.9 1.7 1.4 0.1
* year-on-year change
• The assessment of fourth-quarter demand has been increased by close to 200 kb/d. Upward
adjustments in North American demand, led by substantial revisions to preliminary US data for October, account for the bulk of the change. Smaller cuts to the OECD Asia-Pacific estimate were partly offset by increases in Europe.
• In contrast, the estimate of non-OECD demand for the fourth quarter is steady from last month’s
Report. Lower-than-expected demand in India and Brazil and lower apparent demand in the FSU offset a November spike in Chinese implied demand. Whether the latter will prove temporary or signal a return to the double-digit demand growth rates of the first half of 2004 is unclear, but anecdotal reports suggest Chinese oil imports eased in December and January from very high November levels.
Estimated Annual World Oil Demand Growth 2000-2005
(million barrels per day)
00-99 01-00 02-01 03-02 04-03 05-04
North America 0.26 -0.06 0.10 0.47 0.57 0.23 Latin America 0.00 0.00 -0.04 -0.09 0.16 0.10 FSU 0.08 0.00 -0.20 0.12 0.11 0.14 Europe -0.12 0.21 0.00 0.20 0.26 0.10 OECD Pacific -0.04 -0.07 -0.04 0.14 -0.13 -0.07 China 0.26 0.12 0.30 0.55 0.85 0.36 Other Asia 0.09 0.18 0.27 0.22 0.44 0.21
Subtotal, Asia 0.31 0.23 0.53 0.91 1.16 0.51 Middle East 0.12 0.17 0.17 0.20 0.32 0.26 Africa 0.00 0.13 0.08 0.04 0.07 0.09 World 0.66 0.67 0.63 1.85 2.65 1.44
• The 2005 demand forecast has been raised by 60 kb/d, to 1.44 mb/d. North America and the FSU
account for the bulk of this marginal increase. Adjustments for North America reflect the expected demand impact of continued growth in both industrial output and trade activity. In the FSU, on the

DEMAND INTERNATIONAL ENERGY AGENCY - MONTHLY OIL MARKET REPORT
6 18 JANUARY 2005
other hand, cuts in apparent demand for December were deemed a one-off dip and the 2005 forecast has been kept flat, resulting in a slightly higher year-on-year growth projection.
Global Oil Demand by Region
(million barrels per day)
Demand Annual Change Annual Change (%)
2004 2003 2004 2005 2003 2004 2005
North America 25.14 0.47 0.57 0.23 1.9 2.3 0.9 Europe 16.47 0.20 0.26 0.10 1.2 1.6 0.6 OECD Pacific 8.65 0.14 -0.13 -0.07 1.7 -1.4 -0.8 China 6.37 0.55 0.85 0.36 11.0 15.4 5.7 Other Asia 8.54 0.22 0.44 0.21 2.8 5.4 2.5 Subtotal Asia 23.56 0.91 1.16 0.51 4.2 5.2 2.2
FSU 3.69 0.12 0.11 0.14 3.5 3.1 3.9
Middle East 5.88 0.20 0.32 0.26 3.7 5.7 4.5 Africa 2.81 0.04 0.07 0.09 1.7 2.4 3.3 Latin America 4.89 -0.09 0.16 0.10 -1.9 3.5 2.1
World 82.45 1.85 2.66 1.44 2.4 3.3 1.7
• While it is still too early to tell with certainty, the tsunami that struck parts of Southeast Asia on
26 December appears to have had little significant impact on regional oil demand. Despite the massive loss of life and destruction of coastal infrastructure, regional air and road transport demand appears largely unaffected. While Thai tourism may be adversely impacted in the short term, there have been no reports of significant flight cancellations. Requirements for repair and reconstruction work, including a temporary surge in transport needs for relief missions in the Indian Ocean and the Pacific, may offset any such loss as may be experienced from reduced tourist demand.
OECD Early Indications of Current Demand Preliminary oil delivery data for the nine largest OECD consumer economies confirm expectations of a pick-up in the pace of oil demand growth in November, following relatively flat growth in October. For those economies, including all three North American economies, Japan, Korea, France, Germany, Italy and the UK, aggregate year-on-year demand growth for November looks to have slightly exceeded 1.4 mb/d. For the OECD as a whole, November growth is assessed at a provisional 1.6 mb/d. Admittedly, this figure is somewhat inflated by a short-lived contraction in the 2003 reference period. Even so, November demand growth was robust, and exceeded expectations. At the same time, steep upward revisions to preliminary US estimates have substantially boosted the October demand assessment. On aggregate, the latter now points to subdued growth, rather than contraction as in last month‘s Report. All in all, the estimate of OECD demand for the fourth quarter has been raised by close to 200 kb/d.
As the table below illustrates, aggregate strength in November deliveries conceals sharp regional contrasts, with extremely buoyant demand growth in Europe and North America set against contraction in Northeast Asia. Mild winter weather was clearly the leading factor behind the demand
OECD Oil Products Demand Growth 12-Month Moving Average (kb/d)
-200 -100 0 100 200 300 400
LPG
Naphtha
RFO
Heating Oil
Diesel
Jet/Kero
Gasoline
Other
OECD Oil Demand Growth 12-Month Moving Average (kb/d)
-300 -150 0 150 300 450 600
North America
Pacific
Other Europe
Greece/Turkey
Spain/Portugal
Scandinavia
Benelux
Euro 4

INTERNATIONAL ENERGY AGENCY - MONTHLY OIL MARKET REPORT DEMAND
18 JANUARY 2005 7
drop in Japan and Korea: while deliveries there contracted across the board, the fall was especially steep for kerosene and heating oil. Residual fuel oil demand also contracted sharply, signalling not only a recovery in Japanese nuclear power generation output amid relatively low heating demand, but also fuel switching out of oil in Korea for power generation.
Preliminary Inland Deliveries – November 20041
Gasoline Jet/Kerosene Diesel Other Gasoil RFO Other2 Total Products Mb/d % pa mb/d % pa mb/d % pa mb/d % pa mb/d % pa mb/d % pa mb/d % pa
United States3 9.15 2.3 1.64 -2.8 3.02 10.3 1.11 3.0 0.75 6.2 4.93 4.6 20.60 3.7 Canada 0.70 3.2 0.11 7.9 0.46 11.4 0.09 -1.1 0.19 9.1 0.27 10.5 1.83 6.9 Mexico 0.66 11.0 0.06 7.7 0.32 8.4 0.00 na 0.41 46.8 0.40 1.3 1.84 14.2
Japan 1.01 -1.8 0.50 -17.6 0.66 -0.3 0.47 -3.7 0.44 -15.9 1.58 -1.3 4.66 -5.1 Korea 0.16 -6.5 0.03 -56.1 0.41 -6.0 0.12 -32.4 0.29 -10.4 1.12 3.6 2.13 -5.5
France 0.25 3.9 0.12 1.4 0.62 8.5 0.31 17.1 0.05 -26.9 0.49 6.9 1.85 6.8 Germany 0.57 -0.8 0.15 -7.0 0.64 6.3 0.60 29.7 0.12 0.8 0.52 0.6 2.60 6.8 Italy 0.32 -2.6 0.07 6.2 0.52 11.9 0.13 -1.7 0.17 -15.9 0.43 18.6 1.64 5.4 UK 0.43 -0.8 0.32 1.0 0.43 18.3 0.14 8.6 0.05 1.2 0.36 11.5 1.74 7.1
Total 13.25 1.9 2.98 -5.6 7.09 8.2 2.99 5.2 2.47 1.0 10.10 4.2 38.88 3.1 Sources: US EIA, Statistics Canada, Mexico PEMEX, Japan METI, Korea KNOC, France CPDP, Germany MWV, Italy Ministry of Industry, UK PIA 1 excludes refinery fuel and bunkers (except US) 2 includes direct use of crude oil 3 fifty states only. Diesel's share of total distillate is estimated. Percentage change is calculated versus the previous year.
In contrast, North American and European demand expanded briskly, led primarily by diesel and, in the US, gasoline and residual fuel oil. Unlike in Korea, where LNG prices lag oil prices and look attractive in an oil rally, in North America high natural gas prices have clearly favoured fuel switching into oil for power generation and industrial use at the margin. US gasoline demand was remarkably-and unseasonably-robust throughout the fourth quarter and, according to preliminary weekly reports, was roughly on par in December with the highs reached at the peak of the summer driving season. In addition to unseasonably mild weather, a dip in product prices may have played a role in this, as consumers may have seized on the opportunity to refill their tanks after holding back earlier.
Moving Annual Average Change in Oil Demand* – November 2004
LPG Naphtha Gasoline
Jet/
Kerosene Diesel
Other Gasoil
RFO Other Total kb/d
US 4.0% 5.2% 1.4% 2.5% 6.4% -3.8% 1.6% 3.6% 2.5% 498 Canada** 5.4% 11.2% 1.3% 7.3% -3.6% 8.5% 0.3% 7.5% 4.1% 88 Mexico 1.9% -24.4% 6.0% 7.4% 2.7% 2.7% -5.3% 4.6% 1.7% 34 Japan -4.1% 0.9% 1.9% -3.2% 0.3% -4.2% -10.7% -6.1% -2.7% -150 Korea -1.2% 4.3% -6.1% -11.6% 2.9% -12.8% -2.6% -17.0% -1.2% -27 France 2.5% -2.6% -5.1% 2.9% 2.0% -0.3% -0.8% 2.8% 0.2% 3 Germany 0.5% 4.7% -2.9% 0.3% 2.2% -11.7% -0.4% 30.3% -1.0% -26 Italy 2.7% 3.2% -1.9% 2.6% 5.6% 6.1% -7.1% 13.9% 1.6% 31 UK 19.1% -7.8% -1.2% 7.3% 9.3% 5.4% 19.3% 23.7% 7.7% 133 Total 2.9% 2.5% 1.0% 0.9% 4.4% -3.0% -3.3% 4.5% 1.5% 584 kb/d 149 67 136 30 271 -106 -108 174 584
* defined as the percentage change between the demand average for the 12 months up to November and that of the same period a year earlier ** near-month data are estimated
Pacific Oil product demand in the Asia-Pacific region contracted sharply in October and November, by roughly 200 kb/d and nearly 300 kb/d, respectively. Two main factors led the decline, namely a sustained recovery in Japanese nuclear power generation and unseasonably mild fourth-quarter temperatures in Northeast Asia. Of those two factors, the latter is inherently transient, while the other will likely exert a longer effect on oil demand. The impact of the weather in October and November is clearly visible in the breakdown of the demand contraction by country and product: total demand contracted as fast in percentage terms, and even slightly faster, in Korea than in Japan, and for jet fuel/kerosene, a major heating fuel, than for residual fuel oil, used as boiler fuel in oil-fired power plants. In both countries, jet fuel/kerosene

DEMAND INTERNATIONAL ENERGY AGENCY - MONTHLY OIL MARKET REPORT
8 18 JANUARY 2005
demand contracted by about 40 kb/d in October and 90 kb/d in November, or an aggregate of 80 kb/d and 180 kb/d. However deep that contraction may appear, it is more circumstantial than structural, and the onset of colder temperatures in late December and January will likely set the stage for a return to stronger demand (although kerosene is slowly being replaced by natural gas and LNG as a regional heating fuel).
In contrast, OECD Asia-Pacific demand for residual fuel oil contracted by an aggregate 110 kb/d in October and 90 kb/d in November, led by Japan. Lower Japanese demand reflected a recovery in nuclear power generation, reducing the need for oil-fired power generation capacity. This is likely to be a lasting factor, as safety concerns brought by a controversy over inspection records at Tokyo Electric Power Co. (Tepco) in late 2002 and an accident at a Kansai Electric Power Co. (Kepco) facility last year have receded. However, the decline may not be completely steady. Japanese nuclear power output fell back in December as more plants were once again taken off-line, presumably for routine maintenance and inspections. In late December/early January, as many as nine Tepco plants were out of operation, up from six a month earlier, while three Kepco plants were also idled, compared to two in mid-December. Nuclear power plant problems in Korea have not boosted oil demand for power generation, however, as competitive LNG pricing has favoured LNG over oil as boiler fuel. LNG consumption was up by about 20% in Korea in recent months. Although Korean LNG prices are linked to oil prices, they lag oil prices and the formula typically has only an 85% crude oil price linkage. All indications are that the substitution of gas for petroleum products will continue, price permitting. North America Major revisions to US preliminary demand estimates for October, the effect of which was compounded by upward adjustments in Canada and Mexico for November, have helped raise the assessment of fourth-quarter North American demand by 220 kb/d. Provisional US demand estimates for October were raised by nearly 400 kb/d, with the broad ‘other product’ category used in preliminary oil statistics (including LPG, naphtha and the narrower ‘other product’ category as defined in OECD Monthly Oil Statistics surveys) accounting for more than two thirds of the increase. Gasoline demand was revised upwards by 90 kb/d, and residual fuel oil demand by 50 kb/d. Aggregate distillate demand was little changed, with a 140 kb/d cut in the assessment for heating oil offset by a 120 kb/d increase in diesel. In addition, preliminary data for November point to higher demand than expected in Mexico and Canada. Mexican demand for November has been adjusted upwards by 160 kb/d, nearly all in residual fuel oil (a 30 kb/d increase in gasoline was offset by smaller cuts in naphtha and other product demand). A 100 kb/d increase in Canada spans most of the demand barrel, but remains subject to revisions. US demand for November was roughly unchanged.
Japan Oil DemandChange in 12-month moving average
-300
-200
-100
0
100
200
300
Jan-01 Jan-02 Jan-03 Jan-04
kb/d
LP G/ N aphtha Gas,Jet / Kero ,D ies.Other Gaso il R F O Other
Korea Oil DemandChange in 12 month moving average
-100
-50
0
50
100
150
200
Jan-01 Jan-02 Jan-03 Jan-04
kb/d
LP G/ Naphtha Gas,Jet /Kero ,D ies.Other Gaso il RF O Other
US Oil DemandChange in 12-month moving average
-600
-400
-200
0
200
400
600
800
1000
Jan-01 Jan-02 Jan-03 Jan-04
kb/d
LPG/Naphtha Gas,Jet/Kero,Dies.Other Gasoil RFO Other

INTERNATIONAL ENERGY AGENCY - MONTHLY OIL MARKET REPORT DEMAND
18 JANUARY 2005 9
In aggregate, November OECD demand expanded at the fastest pace for 2004, rising by 4.5%, or nearly 1.1 mb/d, from a year earlier. November demand surged at double digit rates in Mexico and a robust 3.6% in the US and 5.8% in Canada. Transportation fuel demand led the growth in the US in November and throughout the fourth quarter. Gasoline demand was unseasonably robust, reaching a provisional 9.24 kb/d in December, just shy of the summer’s highs. For the fourth quarter as a whole, US gasoline demand is now estimated at 9.16 mb/d, a hair’s width from the 9.17 mb/d high of the third-quarter peak driving demand season, and within reach of the record high of 9.18 mb/d touched in the third quarter of 2003. The rise in gasoline demand seemingly belies reports of falling sales of relatively fuel-inefficient Sports Utility Vehicle. While driving demand may have been spurred by mild fourth-quarter temperatures and easing gasoline prices, it is also likely that a marked tilting of vehicle sales towards more fuel-efficient cars will take time to translate into moderating gasoline consumption.
US diesel sales remained also exceptionally robust throughout the fourth quarter. Diesel demand growth rebounded to a provisional 190 kb/d for the quarter, from 140 kb/d in the third quarter, a trend seemingly consistent with a corresponding pick-up in US container trade. Container traffic at the ports of Long Beach and Los Angeles in California, a proxy for total US trade, expanded briskly in the fourth quarter, with surging traffic at Long Beach more than offsetting a slowdown at Los Angeles. There is a close empirical correlation between US demand for diesel and US trade and container traffic. In addition, weakness in the US currency has spurred growth in exports and a late-year pick-up in industrial output, following a more sluggish third quarter. That has brought further support to both diesel demand for trucking and residual fuel oil for power generation and industrial use. Europe The estimate of European demand is roughly unchanged for October but has been adjusted upwards by 190 kb/d for November, a gain more than offset by a larger cut in the Asia-Pacific region. Italy and the UK account for the bulk of the November revision. On a year-on-year basis, November marks an anticipated rebound (albeit above forecast) from demand contraction of nearly 200 kb/d in October. November growth, totalling about 830 kb/d, was led by a 580 kb/d increase in gasoil deliveries, including a 140 kb/d gain in German heating oil, as residential users refilled as expected their largely depleted tanks. German heating oil deliveries were actually mildly below forecast in November, though that was partly offset by slightly stronger German diesel and other product deliveries. The adjustment for November makes what already looked like relatively robust European demand growth for 2004 appear even stronger. On average, regional 2004 demand looks to have expanded by about 240 kb/d, or 1.6%. That is the steepest annual gain in European demand since 1998. Remarkably, more than half of that growth is accounted for by the UK alone, followed by a combination of the Netherlands, Turkey, the Czech Republic and Poland. In contrast, demand in mature economies such as France and Germany edged downwards. Italian demand growth advanced at a brisk pace in the fourth quarter, but was comparatively sluggish the rest of the year.
Total Cargo Taffic* at the ports of Long Beach and Los Angeles
(TEUs/Day)
15000
20000
25000
30000
35000
40000
Jan Mar May Jul Sep Nov Jan1999 2000 20012002 2003 2004
Source: Ports of Los Angeles and Long Beach
Californian Cargo Traffic* vs. US Diesel Demand (kb/d)
(1Q99-4Q04)
2000
2200
2400
2600
2800
3000
3200
20000 25000 30000 35000 40000
* Measured in 20 foot eqivalent units per day at the Ports of Los Angeles and Long Beach. December estimated for Los Angeles

DEMAND INTERNATIONAL ENERGY AGENCY - MONTHLY OIL MARKET REPORT
10 18 JANUARY 2005
Europe (Major 4) Oil DemandChange in 12-month moving average
-300
-100
100
300
Jan-01 Jan-02 Jan-03 Jan-04
kb/d
LPG/Naphtha Gas,Jet/Kero,Dies.Other Gasoil RFO Other
China Oil DemandChange in 12-month moving average
-1000
100200300400500600700800900
Jan-01 Jan-02 Jan-03 Jan-04
kb/d
LPG Jet,Kero Gasoline
Diesel RFO Other
Is such a growth rate sustainable? Central and Eastern Europe, where the economy has benefited from a manufacturing boom partly spurred by EU accession, seems likely to see further gains, albeit from a relatively low base. In Western Europe, the contrast between demand in the UK and the other leading economies seems to correlate loosely with their diverse economic performances. But while growth prospects in the eurozone seem at threat from the effect of a high euro on transatlantic exports, in the UK a recent slide in the property market raises concerns about the sustainability of strong consumer demand. The odds seem to favour a slowing of regional demand growth in 2005. Separately, the European demand estimate for 2003 has been raised by an average 40 kb/d, reflecting revisions to historical German demand. Naphtha accounted for the bulk of the revisions, due to both an increase in observed values and a decrease in backflow data. Motor gasoline, residual fuel oil and gasoil data were also slightly revised. Adjustment factors for 2004 have yet to be adjusted and will be reviewed once annual statistical information is finalised. Non-OECD China Chinese apparent demand, defined as the sum of domestic refinery output and net product imports (plus adjustment factors for direct crude burn, smuggling and unreported refinery output) rebounded sharply in November, to a new record high of 6.72 mb/d, up from 6.35 mb/d in October. This represents a year-on-year gain of nearly 16%. Given the general uncertainty surrounding the outlook for Chinese oil consumption and the recent impact of Chinese demand growth on the global market, the November performance, following four months of robust but comparatively milder gains, raises questions: has Chinese demand growth returned to the double-digit rates of the first half of 2004, or was the surge in implied demand temporary? We suggest that it probably is a little bit of both. Broken down into its main components, the surge in November demand represents both a spike in net product imports and a jump in reported refinery throughputs. The jump in imports is deemed to be something of a one-off. Net imports for the month hit close to 820 kb/d, up from 600 kb/d in October. This marks the fourth highest net import figure on record, following spikes to 990 kb/d and 830 kb/d in April and June of 2004. The next highest imports on record were in December 1993, when they reached about 910 kb/d. As earlier in 2004, residual fuel oil led the import growth. Official fuel imports were the second highest on record at nearly 660 kb/d in November, up from 650 kb/d in June but down from 780 kb/d in April. Crude imports were also extremely high in November (see table below). But anecdotal reports suggest Chinese crude and product imports have since eased. The jump in November imports might have reflected some stock rebuilding following a dip in international prices, which improved both product imports and refining margins for imported crude. Higher imports might also have been needed to fill new storage capacity along the coast. In contrast, the rise in refinery runs may have more of a lasting impact. After hovering around a 5.05 mb/d plateau from May to October, throughputs at Sinopec and Petrochina refineries suddenly jumped to nearly 5.29 mb/d in November, a 250 kb/d increase. Estimates by the National Bureau of Statistics, which are understood to be more comprehensive, peg November throughputs at 5.74 mb/d, up from about 5.47 mb/d-5.48 mb/d in the previous six to seven months. That would mark a 260 kb/d-270 kb/d boost. While some of the gain might reflect a temporary surge in refinery margins which would have led to higher refinery utilisation rates, it is also likely the sign of an increase in refining capacity. Although no major refinery expansion project is known to have been implemented

INTERNATIONAL ENERGY AGENCY - MONTHLY OIL MARKET REPORT DEMAND
18 JANUARY 2005 11
in the last few months, refinery creep could have been achieved through routine maintenance and de-bottlenecking projects. Such a gain would then presumably set a new plateau for Chinese refining activity.
FSU FSU apparent demand contracted in December for the first time since the first-quarter months of 2004, as production growth tapered off somewhat while export growth recovered from a November slowdown. Exports surged by 835 kb/d on the year, outpacing supply gains of 620 kb/d by roughly 215 kb/d. At 3.58 mb/d, December implied demand was significantly below the level of the last five years. But the dip was offset by robust second- and third-quarter apparent demand. Unseasonably mild winter weather, which allowed higher waterborne shipments than is typically the case at that time of year, is the most likely explanation for the growth in exports. That weather pattern may not be repeated this year, leading to correspondingly higher apparent demand growth for 2005 that had been previously expected. Yet it is worth noting that the slowdown in fourth-quarter implied demand, following a similar trend in the first quarter, repeats pattern of the previous year. It is therefore possible that the combination of contra-seasonably high FSU exports in the winter months, combined with relatively weak exports in the second and third quarters, reflect structural changes in the FSU demand barrel as much as one-off weather conditions. Such changes could include both a decline in winter heating demand for heavy products, associated with fuel switching into natural gas for heating and power generation, and an offsetting by an increase in transportation and agricultural demand in the peak sowing, driving and harvesting demand seasons. Other Non-OECD Indian demand shifted into contraction in November, bringing fourth-quarter projected demand growth to 1.3% , versus 3% in the third quarter and 8.8% in the second quarter. The dip was led by a sharp drop in diesel, compounded by declines in naphtha and gasoline.
China Crude & Product Trade (thousand barrels per day)
Latest month vs. 2002 2003
4Q03 1Q04 2Q04 3Q04
Sep 04 Oct 04 Nov 04
Oct 04 Nov 03
Net Imports/(Exports) of: Crude Oil 1247 1664 1716 2290 2371 2232 2413 2117 2699 583 1045 Products & Feedstocks 361 442 445 600 849 545 586 598 819 220 405
Gasoil/Diesel -16 -28 -9 22 50 21 32 39 80 41 94 Gasoline -142 -175 -151 -95 -141 -146 -138 -102 -113 -11 16 Heavy Fuel Oil 281 407 361 448 653 412 364 425 658 233 293 LPG 197 202 203 172 227 222 255 201 205 3 37 Naphtha -16 -22 -24 -21 -11 -48 -48 -20 -73 -53 -49 Jet & Kerosene 9 1 -6 21 15 19 53 13 14 1 15 Other 48 58 70 54 56 64 68 43 48 5 -1
Total 1609 2106 2161 2890 3220 2777 2998 2715 3518 803 1450 Sources: China Oil, Gas and Petrochemicals plus IEA estimates
FSU Apparent Oil Demand
2750
3000
3250
3500
3750
4000
4250
4500
Jan Mar May Jul Sep Nov Jan
kb/d
2001 2002 2003 2004

DEMAND INTERNATIONAL ENERGY AGENCY - MONTHLY OIL MARKET REPORT
12 18 JANUARY 2005
India Crude & Product Trade (thousand barrels per day)
Latest month vs. 2002 2003 4Q03 1Q04 2Q04 3Q04 Aug 04 Sep 04 Oct 041 Sep 04 Oct 03
Net Imports/(Exports) of:
Crude Oil na 1863 1943 1938 2090 2013 1953 2075 1903 -173 -126
(by Public Oil Cos) 1088 1243 1379 1105 1312 1214 1214 1154 1206 53 -93 Products & Feedstocks -83 -152 -91 -132 -173 -178 -164 -201 -192 9 -107
Gasoil/Diesel -53 -119 -99 -137 -135 -122 -110 -188 -156 32 -46 Gasoline -48 -72 -62 -77 -67 -75 -77 -63 -86 -22 -15 Heavy Fuel Oil 6 5 -8 -12 13 -5 -9 3 -7 -10 -20 LPG 22 55 79 90 39 86 80 118 119 1 63 Naphtha 4 -1 30 19 10 -29 -26 -21 -13 8 -64 Jet & Kerosene 10 -22 -42 -29 -44 -43 -35 -66 -62 4 -32 Other -23 1 11 14 12 9 13 15 12 -3 7
Total 1005 1712 1852 1807 1917 1834 1789 1875 1711 -164 -233 1 Preliminary Sources: Indian Ministry of Commerce, Indian Port Authorities and IEA estimates Yearly data for net imports of crude oil for 2002 are unavailable. For 2002, ‘Total’ indicates the sum of net crude oil imports by public oil companies and net products & feedstock by public, private and joint-venture companies.
India Oil Demand
2000
2100
2200
2300
2400
2500
2600
2700
Jan Mar May Jul Sep Nov Jan
kb/d
2001 2002 2003 2004
Brazil Oil Demand
1900
1950
2000
2050
2100
2150
2200
2250
2300
Jan Mar May Jul Sep Nov Jan
kb/d
2001 2002 2003 2004

INTERNATIONAL ENERGY AGENCY - MONTHLY OIL MARKET REPORT SUPPLY
18 JANUARY 2005 13
SUPPLY Summary • World oil supply fell by 45 kb/d in December, to just under 84.4 mb/d, thereby ending three
months of rising supply. Lower OECD October output, but higher than expected November non-OECD supply, point to November production rising by 170 kb/d, versus the modest fall estimated for November last month. OPEC crude supply remained unchanged in December at 29.5 mb/d, while OPEC other supplies were up by 120 kb/d. Non-OPEC supply fell by 165 kb/d. Total OPEC liquids stood 2.0 mb/d above December 2003 levels, although disrupted OECD output put non-OPEC production barely 175 kb/d above those of a year ago.
• Non–OPEC supply fell by 165 kb/d in December as disruptions hit Norwegian fields, and
Canadian syncrude and offshore operations. Lower Russian output also countered an increase from Latin America, while rebound in US Gulf of Mexico supply slowed. Overall, 4Q 2004 output is revised down by 200 kb/d and 1Q 2005 by 300 kb/d. Much of this output will recover in coming months, but expectations for the North Sea, Canada, Latin America and Asia, have been revised down by 160 kb/d for 2005. Non-OPEC growth in 2005 is now 1.1 mb/d, after 1.0 mb/d in 2004 and 850 kb/d in 2003. OPEC other liquids show healthy growth in 2005, at some 450 kb/d.
• OPEC crude supply for December is estimated unchanged from November’s 29.5 mb/d.
Disruptions continued to plague the oil sector in Iraq, although higher southern exports resulted in a 160 kb/d rise in total December supply. The UAE also increased production by 100 kb/d. However, supply fell by 50-100 kb/d each for Saudi Arabia, Nigeria and Iran. Effective spare capacity (excluding Iraq, Nigeria, Venezuela and Indonesia) remained around 1.0 mb/d.
• OPEC-10 supply (excluding Iraq) was down by 160 kb/d from November, and averaged 27.6 mb/d
compared to 1 November’s target of 27.0 mb/d. An Extraordinary Meeting of the OPEC Conference on 10 December in Cairo agreed to maintain the current production ceiling and individual quotas. However, the Organisation decided to curb over-production by a collective 1.0 mb/d, effective 1 January 2005 and will meet again on 30 January in Vienna.
• The ‘call on OPEC crude and stock change’ is revised up by 100 kb/d for 2004 and by 300 kb/d
for 2005, averaging 28.1 mb/d and 28.0 mb/d respectively. Adjustments are concentrated in the current two winter quarters, with the call revised up 400-500 kb/d from last month’s Report, as OECD supply disruptions combine with stronger winter demand. As a result, the first quarter call, at 28.6 mb/d, averages within 900 kb/d of apparent December OPEC production.
All world oil supply figures for December discussed in this Report are IEA estimates. Estimates for OPEC countries, Alaska, Egypt, Oman, Peru and Russia are supported by preliminary December crude supply data.
OPEC Crude and Non-OPEC Oil Supply 1
January 2002 to December 2005
22
24
26
28
30
32
34
36
Jan-02 Jul-02 Jan-03 Jul-03 Jan-04 Jul-04 Jan-05 Jul-05
mb/d
42
44
46
48
50
52
54
56
58mb/d
OPEC (left scale) Non-OPEC (right scale)
1 Non-OPEC Oil Supply includes OP EC NGLs, condensate and non-conventional oil

SUPPLY INTERNATIONAL ENERGY AGENCY - MONTHLY OIL MARKET REPORT
14 18 JANUARY 2005
Note: Random events present downside risk to the non-OPEC production forecast contained in this Report. These events can include accidents, unplanned or unannounced maintenance, technical problems, labour strikes, political unrest, guerrilla activity, wars and weather-related supply losses. No contingency allowance for random events is subtracted from the supply forecast. Although upside variations can occur, experience in recent years indicates that, roughly speaking, the random events listed above may cause supply losses of between 300 kb/d and 400 kb/d for non-OPEC supply each year. OPEC December crude supply from OPEC was unchanged from an upwardly-revised November figure of 29.5 mb/d. This took total production to 28.7 mb/d for the year, a rise of 2 mb/d from 2003 and the highest OPEC annual average since 1979. Iraq boosted net production by 160 kb/d in December to 1.95 mb/d as southern exports increased by nearly 300 kb/d, offsetting lower domestic crude use and heavily disrupted exports via the Turkish port of Ceyhan. Production from the UAE also rebounded by 100 kb/d, close to the Emirates’ 2.55 mb/d capacity levels. Elsewhere, lower production was concentrated amongst Saudi Arabia, Nigeria and Iran, each seeing supply down by 50-100 kb/d. Nigeria’s cut resulted from localised protests over development and employment which impinged on Shell and ChevronTexaco production. Output from Qatar, and conventional crude supply from Venezuela, fell by 20 kb/d each. The only change to assessed OPEC production capacity this month is a 50 kb/d increase for Algeria. Capacity here is set at 1.35 mb/d as the recently-started ROD complex builds up supplies. Capacity for Iran is maintained at 4.0 mb/d, despite an export-driven surge in supply to 4.05 mb/d in November. New production due onstream at end-2004 from the Soroush and Nowruz fields has been delayed, although Iran appears to have held output close to 4.0 mb/d for December and January, un-constrained by production cuts pledged by other producers. Effective OPEC spare capacity (excluding Iraq, Nigeria, Venezuela and Indonesia, which have suffered from long-standing supply disruptions or field decline in recent months) remained low. Taking account of a range between 0.5 and 1.0 mb/d for Saudi Arabia, effective spare capacity based on December output was in the range 0.75-1.25 mb/d. New investments coming onstream in 2005 could, on their own, push the spare capacity cushion closer to 2.0 mb/d later in the year. Evidence of supply cuts from OPEC members would further add to spare capacity, but could at the same time undermine overall supply flexibility by cutting into, recently more comfortable, consumer country inventory levels.
OPEC Crude Production (million barrels per day)
1 Nov 2004 Target
Dec 2004 Production
Sustainable Production Capacity1
Spare Capacity vs. Dec 2004 Production
Production vs. Target
Algeria 0.86 1.29 1.35 0.06 0.43 Indonesia 1.40 0.98 1.00 0.03 -0.42 Iran 3.96 4.00 4.00 0.00 0.04 Kuwait2 2.17 2.44 2.50 0.06 0.27 Libya 1.45 1.61 1.62 0.01 0.17 Nigeria 2.22 2.27 2.40 0.13 0.05 Qatar 0.70 0.78 0.80 0.02 0.08 Saudi Arabia2, 3 8.78 9.45 10.0-10.5 0.55-1.05 0.67 UAE 2.36 2.52 2.55 0.04 0.16 Venezuela4 3.11 2.23 2.25 0.02 -0.88
Subtotal 27.00 27.56 28.47-28.97 0.91-1.41 0.56
Iraq 1.95 2.50 0.56
Total 29.51 30.97-31.47 1.47-1.97 (excluding Iraq, Nigeria, Venezuela, Indonesia) 0.73-1.23)
1. Capacity levels can be reached within 30 days and sustained for 90 days 2. Includes half of Neutral Zone Production 3. Saudi Arabian capacity shown as a range since a delay may be incurred before higher level can be achieved 4. Excludes upgraded Orinoco extra-heavy oil which averaged 493 kb/d in November

INTERNATIONAL ENERGY AGENCY - MONTHLY OIL MARKET REPORT SUPPLY
18 JANUARY 2005 15
Although high crude prices are leading to modest increases in upstream expenditures generally (see text box below), a series of political, technical, institutional and economic factors will likely limit OPEC upstream capacity expansion at least in the short term. Concerns persist over decline rates amongst several OPEC producers and barriers to entry remain for foreign company equity participation and expertise. Uncertainty over future demand prospects is also a factor, and one that was raised in talks during January between OPEC producers and Asian consumer interests. Several speakers from the producer side indicated that new upstream capacity investment was likely to be dependent upon clear signs of strong and sustainable demand growth. Such thinking could result in capacity expansion continuing to lag rather than lead demand growth. Crude supply from the OPEC-10 (excluding Iraq) averaged 27.6 mb/d in December, a drop of 160 kb/d from November and around 600 kb/d above the 27.0 mb/d target in place since November. December therefore saw only limited advance moves towards the production cuts agreed at OPEC’s 10 December Cairo meeting. OPEC’s communiqué cited lower prices, more normal stocks and what they saw as a generally well supplied market, signalling an intention to maintain the existing 27.0 mb/d production ceiling and the individual quotas associated with it. From 1 January actual production was to be curbed by 1.0 mb/d, spread between Saudi Arabia, Kuwait, UAE, Nigeria, Libya, Algeria and Qatar. Recognising at-quota or below-quota production from Iran, Indonesia and Venezuela, those producers were to be spared cuts for now.
The curbs in production were widely seen as being aimed at preventing a build-up of crude in consuming markets from March onwards. They were also seen as signalling OPEC’s preparedness to defend higher prices and to re-establish some control over the market after several months in which quotas had to all intents and purposes been suspended. Saudi Arabia, Kuwait and UAE account for 75% of the proposed cuts and, as producers of deeply discounted heavy crude, would seem to have most to gain from the narrowing price differentials which production cuts would imply. Having apparently cut production only modestly in December, signalled term lifting schedules suggest the Saudis are spreading their cuts over January and February, although Saudi sources have been saying through January that production has already been reduced to 9.0 mb/d. Kuwait appears to be cutting refinery runs and product exports in Q1 but has said it will not export incremental crude freed up by lower refinery runs. Abu Dhabi meanwhile has maintenance work involving the Murban field which will likely also focus their production curbs in February. Initial indications are that production cuts so far in December and January may amount to 50-60% of the pledged 1.0 mb/d. While further reductions may materialise from the Gulf producers in February, there may be less incentive for OPEC’s three producers of high-value African grades to actively curb production. Questions of both revenue and, for now deferred, target re-allocation would suggest less willingness from these producers to comply in full with proposed cuts. Also, Nigeria will be keen to make up for recent losses incurred due to disrupted production from Shell and ChevronTexaco facilities. Production from Iraq (net of field injection and deliveries into storage) increased by 160 kb/d in December to average 1.95 mb/d. Total exports were up by 210 kb/d to 1.55 mb/d, but local consumption lost around 55 kb/d as pipelines feeding the northern Baiji and Daura refineries were repeatedly disrupted. Pipeline outages in December resulted in crude having to be trucked to Daura, while a 23 December attack on pipelines feeding Kirkuk crude to Baiji kept the line out of operation until the second week of January. Crude production, exports and refinery operations are seen as susceptible to increasing levels of insurgent activity in the run-up to 30 January elections.
OPEC Crude Oil Production
23
24
25
26
27
28
29
30
31
Jan Mar May Jul Sep Nov Jan
mb/d
2002 2003 2004
Quarterly Call on OPEC Crude + Stock Change
23
24
25
26
27
28
29
30
1Q 2Q 3Q 4Q
mb/d
2003 2004 2005

SUPPLY INTERNATIONAL ENERGY AGENCY - MONTHLY OIL MARKET REPORT
16 18 JANUARY 2005
December’s supply increase derived from higher exports from Basrah Oil Terminal. In total, southern exports are assessed at 1.46 mb/d, up from November’s 1.17 mb/d. Weather-related tanker loading delays were less pronounced than in November. There was a surge in liftings in excess of 2 mb/d in the second week of December, partly reflecting cargoes deferred from the November programme. However, southern exports tailed off as December progressed amidst attacks on the electric power grid and renewed loading problems due to weather. Any upside from December southern export levels during the first half of 2005 now seems unlikely. Iraq’s State Oil Marketing Organisation (SOMO) has cut Basrah Light term contract volumes by 10%, or 160 kb/d, for February through June. Exports of Kirkuk crude from Ceyhan in December were limited to two tanker liftings and a partial batch of term crude sent by pipeline to Turkish refiner Tupras. These totalled a combined 75 kb/d, half the November level. There have been no pipeline shipments from northern Iraq to Ceyhan since an attack on the line cut flows on 18 December. At the time of writing the pipeline was not expected to resume shipments before late-January. With practically no oil in storage at Ceyhan, outstanding term lifting volumes from December have been cancelled. Any shipments achieved from Ceyhan during the rest of January will reportedly be diverted via pipeline to Tupras refineries. Without a significant improvement of security around oil installations, sustaining 2-2.5 mb/d production for Iraq, let alone achieving the Ministry’s 3.0 mb/d 2005 target, could prove difficult.
The decision taken by OPEC on 10 December to curb over-production versus target came too late to significantly affect Saudi Arabian production and exports for the month as a whole. Announced term volumes were held steady at November levels. Although not necessarily indicative of an increase in export volumes, a surge in spot tanker chartering for December was evident compared to the lull seen in November. Notwithstanding, modest cuts in supply are believed to have begun to materialise late in the month, a prelude to the near-500 kb/d cuts agreed for January. Overall Saudi December output is estimated at 9.45 mb/d, 100 kb/d below November. December saw formal inauguration of new facilities serving the Qatif and Abu Safah fields, representing 650 kb/d of new production for the Kingdom. The next major increment in productive capacity from Saudi Arabia occurs in mid-2007 when work to de-mothball 500 kb/d of production at the Abu Hadriyah, Fadhili and Khursaniyah fields is completed. Civil unrest in Rivers State in the southeast of Nigeria contributed to an overall 80 kb/d reduction in the country’s December production. Flow stations operated by Shell and ChevronTexaco began to be shut-in from 5 December and peak disruption amounted to 120 kb/d. The outages forced Shell to declare force majeure on liftings of Bonny Light from 22 December. Early January saw the resumption of ChevronTexaco’s 20 kb/d of affected production. Shell was also gradually resuming output, but at the time of writing some 30-40 kb/d of production had still not been re-activated. Nigeria was scheduled to voluntarily cut 120 kb/d of production from 1 January under the terms of the Cairo agreement. However, NNPC announced in early January that no voluntary cuts were yet underway due to the outages suffered in December/January by the two majors. Venezuelan conventional crude oil production (net of output from the synthetic crude plants serving the Orinoco tar sands) nudged lower by 20 kb/d in December. Earlier, limited volumes of un-upgraded, extra-heavy oil came onto the market in October/November while the Sincor upgrader was
Estimated Iraqi Supply 2004
-500
0
500
1000
1500
2000
2500
August September October November December
kb/d
Production North Production SouthRe-injection/Stock Change ExportsLocal Use
1640
2245
1785
2215
Net Production
1945

INTERNATIONAL ENERGY AGENCY - MONTHLY OIL MARKET REPORT SUPPLY
18 JANUARY 2005 17
offline for maintenance, but these volumes were effectively removed from the conventional oil pool in December as upgrader operations resumed. But December’s decline in conventional crude was limited since two new wells, brought into operation by PDVSA at the Tomoporo field in the Lake Maracaibo region, added some 16 kb/d. Recent months have seen a stabilising of conventional production after declines seen through 2003 and early-2004. Venezuelan synthetic crude production (counted in this Report under the OPEC NGL, condensate, other oils category) is in the process of building from a prevailing 400 kb/d, to nearly 600 kb/d as early as February. Production from the Hamaca upgrader began in October, and is due to reach 180 kb/d this month. The Sincor plant was down for maintenance in October/November but should resume full operations at increased 180 kb/d capacity by February. OECD North America US – December Alaska actual, others estimated: US production estimates are again revised down in light of the most recent data (state-wise production for August, provisional monthly totals for October and weekly indications for November/December). The net result is downward adjustments to US crude supply of 15 kb/d for 3Q 2004, 60 kb/d for 4Q 2004 and 40 kb/d in 1Q 2005. However, downward adjustments are concentrated in the early part of 2005, and total US crude supply is seen rising by 100 kb/d in 2005 to 5.53 mb/d. The bulk of the downward adjustment, but also the basis for 2005’s output recovery, is again in the Gulf of Mexico (GOM). The October to January period has seen start-up of incremental production from the Ursa, Mad Dog, Holstein, Front Runner and Magnolia fields but we have shaved down the contribution expected in the first few months of operation. Aggregate data suggest a delayed and slower build-up from these new fields entering service in GOM towards end-2004. Also, not un-related, is the fact that the after-effects of Hurricane Ivan have been more profound than had been anticipated. In December, 165 kb/d of production remained offline, compared to our early-month estimate of 100 kb/d. We have assumed 100 kb/d remaining out of action in January, tapering off to 75 kb/d in February/March and 50 kb/d in 2Q. The pace and extent of GOM recovery remains a key uncertainty for the 2005 US forecast.
December saw Alaskan crude production largely stable at 950 kb/d. Colder temperatures, which aid re-injection processes, might have been expected to boost production levels modestly, but this was offset by outages at Endicott and Northstar. This Report now envisages a 20 kb/d decline from Alaska for 2005 after the 60 kb/d decline seen for 2004. Last year’s drop was exaggerated by extended maintenance work in preparation for upcoming modernisation of the Trans Alaska Pipeline. Canada – October actual: October saw a sharp rebound in Canadian conventional crude supply after four months of decline. However, the recovery proved short lived, with output likely slipping below 1.8 mb/d once more during the November-January period as prolonged outages due to leaks have affected the 150 kb/d Terra Nova field offshore Newfoundland. At the same time, production of non-conventional oil from Canada’s three main synthetic crude units, normally the source of some 650 kb/d of output, has suffered a catalogue of scheduled and unscheduled outages, culminating this month in an estimated loss of some 200 kb/d.
Alaska Crude Oil Production
0.65
0.75
0.85
0.95
1.05
Jan Mar May Jul Sep Nov Jan
mb/d
2003 20042004 est. 2005
Lower 48 Crude Oil Production
4.10
4.30
4.50
4.70
4.90
Jan Mar May Jul Sep Nov Jan
mb/d
2003 20042004 est. 2005

SUPPLY INTERNATIONAL ENERGY AGENCY - MONTHLY OIL MARKET REPORT
18 18 JANUARY 2005
Extended maintenance and start-up problems at the Shell Scotford plant are estimated to have cut output to around 100 kb/d for the October through January period. The Syncrude plant suffered reduced production from mid-December through early-January as the result of a power outage. Finally, a fire at the 230 kb/d Suncor facility on 4 January has halved production and with proposed September maintenance brought forward, reduced output is assumed to persist for January and February. These early-year outages and indications that expansion work is unlikely to be completed before 2006/2007 result in a reduced profile for syncrude in 2005, now unchanged from 2004 at just over 600 kb/d. Total Canadian oil output also remains largely unchanged in 2005 at 3.1 mb/d. Mexico – November actual: Crude production dropped by 85 kb/d in November to 3.36 mb/d after outages affecting offshore heavy crude supply. Exports were less sharply affected, falling by 30 kb/d to 1.95 mb/d from October levels. Shipments destined for Europe rose by 35 kb/d but were countered by a 65 kb/d drop in those targeting Asia and other non-Atlantic Basin markets. Crude production
High Prices Not Driving A Surge in Investment - Yet A number of recent industry surveys suggest that major oil companies’ are not yet banking on the sustainability of recent high prices and that, consequently, a cautious approach is being taken towards boosting capital expenditure in 2005, notably on exploration and production (E&P).
Biannual surveys from Lehman Brothers and Citigroup suggest worldwide expenditure in the upstream will grow by less than 6% in 2005. This represents a slow-down from double digit growth recorded in 2004. Spending growth will exceed the average however in North America, on offshore projects and amongst the independent upstream operators. Also, despite the apparent investment slow-down, it is worth noting that 2004 spending expectations showed a marked increase as the year progressed against a back-drop of high prices. Lehman for example began the year forecasting 4% E&P growth for 2004, revised this up to 8.8% at mid-year, while companies now estimate last year’s investment to have grown by over 12%. A similar trend may emerge over the course of this year. Interestingly though, only one third of companies surveyed by Lehman this time around said they would boost spending over and above current plans if prices remain around $40/bbl in 2005.
The surveys suggest that, generally, companies are now working on an assumption of $35/bbl crude for 2005. But the major international oil companies (IOCs) still seem to be budgeting for $20-$25/bbl. Operating under what amounts to capital rationing, it is no coincidence that IOC E&P spending growth comes in at less than 5% for 2005. ChevronTexaco and ConocoPhillips are the exceptions, with 10-15% growth expected for 2005. Separate data covering oil price assumptions used in the budgets of the National Oil Companies (NOCs) and producer governments also show only a gradual rise. A figure of $25/bbl for 2005 appears to be the norm, compared to $20/bbl for 2004.
There remain competing claims for recently-inflated cash flow, both amongst the IOCs and NOCs. For the majors, short term returns to shareholders remain a priority, as do mandatory environmental spending, refinery upgrading and gas projects. The IOCs are particularly concerned about the rise in costs in mature producing areas and the trend towards offloading non-core assets in mature areas to independent operators will likely continue. Rather, the majors would prefer to concentrate longer term on accessing a limited portfolio of world-scale projects. Here too however, shortages of qualified project staff, raw materials and drilling equipment are also driving up costs and setting a ceiling on overall investment plans.
For the NOCs and producer governments, much of the recent surge in income is being diverted to social programmes. At the same time, producer governments in areas with substantial untapped reserves, such as Russia, Kazakhstan and Venezuela, have used higher prices as a signal to tighten fiscal and contract terms for foreign companies active in their upstream sectors. At the margin this too may come to stem new investment.
A trend away from exploration spending in the past decade has seen reduced company reserve replacement levels. Corporate re-structuring after a spate of merger and acquisition activity in the late-1990s in part explains the trend. But increasingly the majors now cite lack of access to new exploration opportunities under conducive terms, particularly in the Middle East. If sustained, the trend towards higher crude prices and a growing role for independent upstream operators should boost industry investment levels, shore up reserve levels and boost productive capacity. But for now the industry seems to be taking a wait-and-see attitude.

INTERNATIONAL ENERGY AGENCY - MONTHLY OIL MARKET REPORT SUPPLY
18 JANUARY 2005 19
from Mexico is forecast to remain fairly stable in 2005 at 3.4 mb/d, with decline expected at the baseload Cantarell field from 2006 onwards. In 2005 state Pemex expects to replace 50% of production via new discoveries, a figure low by international standards and a ratio which is unlikely to improve so long as private capital is precluded from the exploration and production sector. North Sea UK – October actual: UK offshore crude production rebounded after September maintenance, reaching 1.75 mb/d in October, although this remained some 150 kb/d below levels seen early in 2004. Government data on a field-by-field basis through August suggests that this Report’s earlier expectations for late-2004 production from a number of fields, including Heather, Caledonia, Skene and Ardmore were too high. Downward adjustments have been made accordingly. In all, 4Q 2004 output is revised down by 50 kb/d and this reduction is extended through 2005. In total, UK offshore crude is seen declining by 180 kb/d to 1.64 mb/d in 2005 after a drop of 200 kb/d in 2004. This is despite around 10 new field start-ups or expansion projects coming to fruition during second half 2004 and in 2005. Onshore crude and NGLs take the 2005 total oil figure to 1.9 mb/d, the first time UK production has dipped below 2.0 mb/d on an annual basis since 1992. Partly offsetting this somewhat disappointing prognosis for 2005, BP in December won development approval for the 20 kb/d Farragon field which is due for start-up in late-2005. Also, December saw reports that ChevronTexaco’s Rosebank/Lochnagar discovery west of Shetland could contain up to 500 mb of oil. If confirmed, this would place the field in an equivalent class to the Buzzard discovery, which is due to be producing up to 200 kb/d by late-decade.
Norway – October actual, November provisional: Latest data for Norway covering October and November confirm expected crude production levels of just under 2.8 mb/d. Furthermore, latest field-by-field data suggest upward revisions to 2005 production from the Ekofisk and Haltenbanken areas. However, production is thought to have fallen to less than 2.6 mb/d for December as the re-start at the Snorre and Vigdis fields, shut-in since late-November due to a gas leak, was deferred until mid-January. Normal production from Snorre and Vigdis is around 300 kb/d but is estimated at only 80 kb/d for December and 180 kb/d in January. Overall crude supply recovery in January was limited to around 2.65 mb/d as poor weather delayed repair work on damaged loading equipment at the
Canada Crude Oil Production
1.70
1.75
1.80
1.85
1.90
Jan Mar May Jul Sep Nov Jan
mb/d
2003 20042004 est. 2005
Mexico Crude Oil Production
3.25
3.30
3.35
3.40
3.45
3.50
Jan Mar May Jul Sep Nov Jan
mb/d
2003 20042004 est. 2005
UK Crude Oil Production
1.50
1.70
1.90
2.10
2.30
Jan Mar May Jul Sep Nov Jan
mb/d
2003 20042004 est. 2005
Norway Crude Oil Production
2.40
2.50
2.60
2.70
2.80
2.90
3.00
3.10
Jan Mar May Jul Sep Nov Jan
mb/d
2003 20042004 est. 2005

SUPPLY INTERNATIONAL ENERGY AGENCY - MONTHLY OIL MARKET REPORT
20 18 JANUARY 2005
Draugen field. Output began to be affected in early-January and was shut-in completely on 7 January when platform storage tanks became full. Total Norwegian oil production, including NGL and condensates is now expected to fall by 40 kb/d in 2005 to 3.13 mb/d, after losing 85 kb/d in 2004. For 2005 the decline is driven by crude, as condensate supplies from fields such as Tune, Mikkel, Kvitebjorn and Kristin are expected to add over 50 kb/d. Despite a sharp increase in drilling scheduled for the Norwegian shelf, from a low of 16 wells in 2004 to 40 in 2005, the Norwegian Petroleum Directorate in January revised down its expectations for crude production in 2005, now envisaging a modest fall from 2004 levels. Former Soviet Union (FSU) Russia – November final, December provisional: Both November and December saw modest month-on-month decline in Russian oil output, a drop of 10 kb/d in November being followed by a 60 kb/d decline to 9.4 mb/d in December. 2004 production averaged 9.2 mb/d compared to 8.5 mb/d in 2003, although year-on-year growth was heavily skewed, averaging 10.5% at the start of the year but nearer 7% by the end of the year. This Report sees Russian growth continuing to slow on an annual basis, reaching 430 kb/d in 2005 for total output of 9.65 mb/d. Export capacity constraints remain one reason for the slow-down, and company production growth plans themselves for 2005 are tending to come in lower than for 2004. TNK-BP sees 8% growth for 2005 after 16% for 2004 while Tatneft has trimmed growth prospects to 1% this year after 1.6% in 2004. Notably, the December output reduction exactly matches that of the country’s hitherto number one producer Yukos. The company’s 1.0 mb/d production subsidiary Yuganskneftegaz was auctioned off on 19 December. US legal action dissuaded prospective buyer, state-controlled Gazprom, from taking part in the auction. Yuganskneftegaz assets ended up in the hands of Rosneft which had in turn bought the original winner of the auction, Baikal Finance Group. Whether Rosneft, itself the target of a buy-out by Gazprom, retains control over Yuganskneftegaz, or rumoured Chinese and Indian buyers take a stake remains uncertain. Nor is it yet clear what impact there will be on short-term supply levels, although for now this Report assumes output from erstwhile Yukos assets remaining largely flat at just over 1.7 mb/d in 2005. Nonetheless, the affair has added an extra element of uncertainty to the longer-term investment environment in Russia. Political and legislative uncertainty for potential investors in production capacity may come to take over from export capacity constraints as the main impediment to longer-term Russian supply growth. Although export bottlenecks on some routes persist, recent weeks have seen progress towards expanding export capacity on a number of fronts, with: ▪ approval of the plan for a 1.6 mb/d export pipeline from east Siberia to Nakhodka on the Pacific; ▪ the start of long-delayed shipments of some 100 kb/d of Russian crude via the CPC pipeline; ▪ approval of expansion plans for Transneft’s Baltic Pipeline System which could raise throughput
from 1.0 mb/d to 1.2 mb/d within 12 months; ▪ progress towards go-ahead for an export route from the Black Sea to the Mediterranean, by-
passing the congested Turkish Straits and; ▪ plans for increased export shipments by-passing the Transneft system, including by rail to China
and via Russia’s Arctic ports. Other FSU: November data for production from Kazakhstan, Azerbaijan and Turkmenistan result in only modest changes to expected supply for 2004 and 2005. These three producers are on course for 2004 oil production of 1.17 mb/d, 315 kb/d and 200 kb/d respectively. Production from Kazakhstan is seen rising by 80 kb/d in 2005 after an increase of 145 kb/d in 2004. After three years of fairly static production, Azerbaijan should increase supply by around 90 kb/d in 2005. Output from the offshore ACG group of fields is seen rising from a current 150 kb/d to some 350 kb/d by end-2005. This derives from the imminent start-up of the 1.0 mb/d Baku-Tbilisi-Ceyhan (BTC) pipeline, with first export cargoes likely to be lifted from Ceyhan in Turkey in the second half of 2005.
Russia Crude Oil Production
7.30
7.80
8.30
8.80
9.30
9.80
Jan Mar May Jul Sep Nov Jan
mb/d
2003 2004
2004 est. 2005

INTERNATIONAL ENERGY AGENCY - MONTHLY OIL MARKET REPORT SUPPLY
18 JANUARY 2005 21
FSU Net Exports of Crude & Petroleum Products (million barrels per day)
Revised Prelim. Latest month vs.
2003 2004
1Q04 2Q04 3Q04 4Q04
Oct 04 Nov 04 Dec 04 Nov 04 Dec 03
Black Sea Exports 2.79 2.84 2.81 2.75 2.87 2.91 2.99 2.67 3.07 0.40 0.30
Baltic/Arctic Exports 2.41 3.05 3.00 3.11 3.11 2.98 2.99 2.95 3.00 0.05 0.37
Total Seaborne 5.20 5.89 5.80 5.87 5.98 5.90 5.98 5.62 6.07 0.45 0.67
Druzhba Pipeline 1.06 1.07 1.08 1.04 1.08 1.10 1.08 1.11 1.11 0.00 0.03 Other 0.49 0.54 0.47 0.53 0.55 0.61 0.55 0.64 0.64 0.00 0.14
Total Exports 6.75 7.51 7.36 7.43 7.62 7.60 7.61 7.37 7.83 0.45 0.84
Imports 0.02 0.01 0.01 0.01 0.02 0.01 0.01 0.01 0.01 0.00 0.00
Total Net Exports 6.73 7.49 7.35 7.42 7.61 7.60 7.60 7.37 7.82 0.45 0.84
Crude 4.70 5.24 5.08 5.18 5.26 5.42 5.49 5.22 5.54 0.32 0.59 of which: Russian Crude 3.48 3.76 3.61 3.82 3.71 3.91 3.89 3.85 3.99 0.14 0.49 Products 2.05 2.27 2.28 2.25 2.36 2.19 2.12 2.15 2.28 0.13 0.25
Sources: Petro-Logistics, IEA estimates Preliminary data for FSU seaborne oil exports via the Transneft system in December show a sharp 450 kb/d rebound after a 360 kb/d decline in November. Having borne the brunt of reduced deliveries in November, Black Sea shipments surged in excess of 3.0 mb/d in December as weather conditions improved, allowing loadings from Novorossiysk and shipments transiting the Turkish Straits to proceed unhindered. Few indications were available at the time of writing concerning exports via other routes, although CPC pipeline exports of Russian crude are believed to have risen from 60 kb/d in November to 94 kb/d in December. Taken alongside declining production levels, export data suggest a sharp fall in implied FSU demand in December, perhaps reflecting in part the markedly milder-than-normal weather seen so far this winter. Other Non-OPEC Brazil – October & November actual: Brazilian crude production declined by 20 kb/d in October and by 50 kb/d in November as Campos Basin maintenance curbed supplies. However, crude output is thought to have recovered by 90 kb/d in December, nudging above 1.5 mb/d as maintenance ended and with start-up of the 150 kb/d FPSO at the Barracuda field. This is likely to be followed by first production from the Caratinga field in January and the Albacore Leste project in February. In all, deepwater Campos Basin production offshore Rio de Janeiro is expected to increase by 225 kb/d in 2005, reaching 1.44 mb/d. Last year was the first since 1991 to witness a decline in Brazilian oil output, as extended outages from the Campos Basin, together with delays to new field start-ups there, underpinned the province’s key role in driving national supply.
Angola – November actual: Angolan supply increased by 10 kb/d in November. With preliminary reports of a relatively unchanged 1.1 mb/d in December, production was on course to average 985 kb/d for 2004, a 105 kb/d increase from 2003. First oil production from the Bomboco field, part of the offshore Sanha project, was announced by ChevronTexaco in early-January. The complex is seen likely to be producing around 30 kb/d of liquids by end-2004 and peak at 100 kb/d in 2007. This
Brazil Crude Oil Production
1.30
1.40
1.50
1.60
1.70
1.80
1.90
Jan Mar May Jul Sep Nov Jan
mb/d
2003 20042004 est. 2005
Angola Crude Oil Production
0.80
0.90
1.00
1.10
1.20
1.30
Jan Mar May Jul Sep Nov Jan
mb/d
2003 20042004 est. 2005

SUPPLY INTERNATIONAL ENERGY AGENCY - MONTHLY OIL MARKET REPORT
22 18 JANUARY 2005
represents a slower build-up than assumed in earlier issues of this Report and Angolan 2005 production is revised down by 15 kb/d as a result. Nonetheless, total production is seen rising by 165 kb/d in 2005, averaging 1.15 mb/d. Sanha, and an increased contribution at the Kizomba A field, account for the increase. Revisions to other non-OPEC estimates: Revised data for June-November 2004 suggest lower prevailing output from Argentina. A 20 kb/d downward adjustment is made for 4Q 2004 and for 2005. National production drops by 40 kb/d in 2005 to 735 kb/d, after falling 50 kb/d in 2004. Total Egyptian output for 2005 is now projected at 715 kb/d, largely unchanged from 2004, but 15 kb/d below earlier estimates. Ongoing crude decline counters higher NGL supply in 2005. The delayed start of the Angostura project in Trinidad occurred in early January. Peak production this year is now expected to be 60 kb/d, less than our prior estimate and a 20 kb/d downward adjustment to 4Q 2005 Trinidad output has been made. But aggregate 2004 and 2005 production levels are only revised down 5 kb/d. Assessed production from Congo is revised up by 20 kb/d for 2003 and 2004 and by 45 kb/d for 2005. Production at the N’Kossa field in particular now appears to be running higher than estimated previously. A number of field expansion schemes now look likely to stem the decline in national production evident over 2001-2004.
Revisions to Non-OPEC Oil Supply (million barrels per day)
Last month's OMR This month's OMR This month vs. last month 2004 2005 05 vs. 04 2004 2005 05 vs. 04 2004 2005 05 vs. 04
North America 14.63 14.85 0.22 14.60 14.78 0.18 -0.03 -0.08 -0.04 Europe 6.09 5.89 -0.20 6.07 5.87 -0.21 -0.02 -0.02 -0.01 Pacific 0.58 0.54 -0.04 0.57 0.53 -0.04 0.00 -0.01 0.00
Total OECD 21.30 21.28 -0.01 21.24 21.18 -0.07 -0.05 -0.11 -0.05
Former USSR 11.17 11.77 0.60 11.18 11.78 0.60 0.01 0.01 0.00 Europe 0.17 0.16 -0.01 0.17 0.16 -0.01 0.00 0.00 0.00 China 3.49 3.53 0.03 3.49 3.53 0.03 0.00 0.00 0.00 Other Asia 2.74 2.73 -0.01 2.74 2.71 -0.04 0.00 -0.02 -0.02 Latin America 4.04 4.35 0.30 4.03 4.30 0.27 -0.01 -0.05 -0.03 Middle East 1.89 1.84 -0.05 1.89 1.84 -0.05 0.00 0.00 0.00 Africa 3.41 3.71 0.30 3.43 3.72 0.29 0.02 0.01 -0.01
Total Non-OECD 26.92 28.08 1.16 26.94 28.03 1.10 0.01 -0.05 -0.06
Processing Gains 1.83 1.86 0.03 1.83 1.86 0.03 0.00 0.00 0.00
Total Non-OPEC 50.05 51.23 1.17 50.01 51.07 1.05 -0.04 -0.16 -0.12 OMR = Oil Market Report

INTERNATIONAL ENERGY AGENCY - MONTHLY OIL MARKET REPORT OECD STOCKS
18 JANUARY 2005 23
OECDIndustry Crude Oil Stocks
800
850
900
950
1000
Jan Mar May Jul Sep Nov Jan
mb
Range 1998-20032003 2004
OECDIndustry Middle Distillates Stocks
400420440460480500520540560
Nov-02 May-03 Nov-03 May-04 Nov-04
mb
-80
-60
-40
-20
0
20
Dif ference to 5 year average (right axis)Middle Distillates
OECD STOCKS Summary • OECD industry total oil stocks rose 1.4 mb/d in November or about 42 mb. The rise in commercial
inventories followed from large gains in both crude and product stocks, mainly in the Pacific region. Gains in the main product categories were dominated by builds in distillates fuels. At 2663 mb, OECD industry oil stocks closed 81 mb above year-ago levels. The rise in crude oil helped to keep forward demand cover by total oil stocks at 52 days, a day above that in 2003.
Preliminary Industry Stock Change in November 2004 and Third Quarter 2004
(million barrels per day)
November (preliminary) Third Quarter 2004
North America Europe Pacific Total North America Europe Pacific Total
Crude Oil 0.19 0.11 0.44 0.74 -0.27 -0.07 -0.09 -0.42 Gasoline 0.17 0.02 0.04 0.23 -0.01 0.02 -0.01 0.01 Distillates 0.13 -0.05 0.31 0.39 0.19 0.15 0.16 0.50 Residual Fuel Oil 0.19 -0.03 0.09 0.25 -0.04 0.00 -0.01 -0.05 Other Products -0.27 -0.02 0.02 -0.27 0.22 0.04 0.02 0.28
Total Products 0.22 -0.08 0.46 0.60 0.36 0.22 0.15 0.73 Other Oils1 0.00 -0.02 0.10 0.08 0.23 0.00 0.04 0.27
Total Oil 0.42 0.01 1.00 1.42 0.32 0.14 0.11 0.57 1 Other oils includes NGLs, feedstocks and other hydrocarbons
• OECD industry crude stocks rose 740 kb/d in November or 22 mb. Most of the build came in the
Pacific region, where imports from key term suppliers in the Middle East were particularly high. Korean inventories rose 11 mb and onshore stocks in Japan by 2 mb, albeit Japanese stocks are expected to be revised higher. Industry stocks in the US-50 posted a build of about 5 mb in November, rising on relatively high imports and a slow resumption in refinery activity. European inventories closed at the top of their five-year range.
• OECD industry distillate stocks increased 390 kb/d in November or about 12 mb. Pacific stocks led
the build with kerosene rising on weak demand in Japan and diesel increasing in Korea on refinery output gains. Distillates stocks went both ways across the Atlantic Basin from an upward revised October base. Europe saw a marginal decline, although a deeper draw was expected due to peak refinery maintenance cutting into product output and strong diesel demand. In the US, stocks of distillates (diesel and heating oil) ended marginally higher. Although domestic production rose, additions to storage were limited by strong demand and product exports from the US Gulf Coast.
• OECD industry gasoline stocks built 230 kb/d in November or 7 mb. Most of the build came in the
US in spite of buoyant demand as finished gasoline production was firm and imports of conventional material rose. Europe’s industry gasoline stocks edged higher in November, while those in independent storage in the Amsterdam-Rotterdam-Antwerp (ARA) area closed at seasonal highs. With closed spot arbitrage to the US, weak demand and steady refinery output due to rising naphtha reforming, it is likely that the marginal build in European industry stocks may be revised higher.

OECD STOCKS INTERNATIONAL ENERGY AGENCY - MONTHLY OIL MARKET REPORT
24 18 JANUARY 2005
OECD Industry Stock Changes in November 2004 OECD industry oil stocks rose by 42 mb in November, reaching an estimated 2663 mb and closing 81 mb above year-ago levels. The build was essentially driven by a rise in crude and product inventories in the Pacific and to a lesser extent in North America and Europe. Middle distillate fuels led the gains in the major product categories. The rise in OECD industry oil stocks during October-November nears 1 mb/d, in contrast with a five-year average draw of 940 kb/d observed in the fourth quarter. Days of forward demand cover by oil stocks came to 52 days, flat from October and a day above that in 2003. OECD industry crude stocks rose 22 mb, reflecting higher global supplies. The Pacific led the build with Korea adding 11 mb to storage in spite of crude runs reaching seasonal peaks. Crude imports from key Middle Eastern term suppliers rebounded strongly on the month. Onshore Japanese crude stocks gained 2 mb, but the overall build is expected to be higher once volumes held in tankers at ports are taken into account in next month’s Report. The US-50 added about 5 mb to crude stocks in November as imports were high and post maintenance refinery runs were slow to recover. Most the inventory gain came on the US Gulf Coast. US crude stocks fell back in December and into early January. Refinery runs remained high to maximise distillate output but imports fell below 10 mb/d. The drop in arrivals partly reflected intended postponement of crude deliveries until January for tax reasons and partly weather-related delays in the Houston shipping canal. But crude price differentials in the US cash market versus WTI for December-January delivery were not indicative of a lack of supply. Stocks at Cushing, the delivery point for NYMEX WTI futures were high, supporting a contango in the near delivery months, albeit at an unusually high absolute price level. European crude stocks rose in November, against expectations of a draw and closed at comfortable levels. Preliminary indications for Europe point to a sharp draw in December. And although forward Brent prices shifted temporarily into backwardation in December, heavy volumes of Urals out of the Baltics but also the Black Sea at end-month caution against a dramatic fall. Atlantic Basin gasoline stocks rose nearly 6 mb in November on gains in US inventories. US gasoline output kept relatively high as product yield only belatedly switched to distillate. While US gasoline deliveries grew through December, domestic supplies and relatively high imports through the period allowed stocks to rise. European stocks rose from an upward revised October base but the build came below expectations in November. While refinery runs were lower due to maintenance, gasoline output was less affected than that of distillate. The need for hydrogen for desulphurisation led to greater reforming of naphtha and consequently gasoline production. Combined with structurally weak demand and closed spot arbitrage to the US, stocks were expected to mirror the marked upward trend in ARA independent storage. OECD industry distillate stocks rose 12 mb in November, ending on a par with 2003. The build came mainly in the Pacific region where refiners maximised distillate output and mild temperatures curbed heating demand. This allowed Japanese kerosene inventories to rise rapidly, but gains were also supported by higher diesel stocks in both Japan and Korea. US-50 distillate stocks (heating oil and diesel) managed to close marginally higher in November in spite of strong diesel demand growth and slowly rising output. In December, US stocks rose on diesel gains, closing within their average range as distillate yields reached record levels. The main consuming Northeast area saw a small seasonal draw in heating oil stocks as distillate production began to match muted demand due to mild temperatures. US distillate stock builds were also partly limited by reported gasoil shipments of Gulf Coast supplies to Europe. Mild temperatures into mid-January suggest that heating oil stocks are better positioned when winter demand sets in. While US refinery maintenance in the first quarter may curtail output, imports are expected to fill the gap. In this respect, Europe is well supplied to provide product, given upward revisions to October figures. The return of refiners from maintenance, inflows of Russian gasoil, and weak heating demand lifted European stocks. Revisions to Preliminary OECD Stocks and Inventory Position at End-November
Revisions Versus 10 December 2004 Oil Market Report (million barrels)
North America Europe Pacific OECD
Sep 04 Oct 04 Sep 04 Oct 04 Sep 04 Oct 04 Sep 04 Oct 04
Crude Oil 2.0 0.1 2.5 -3.1 0.0 -0.8 4.5 -3.8 Gasoline -1.1 -5.9 0.0 4.6 0.0 -0.6 -1.1 -1.9 Distillates -1.1 4.6 0.2 6.6 0.0 0.0 -0.9 11.2 Residual Fuel Oil -1.0 -0.5 0.1 -2.2 0.0 0.3 -0.9 -2.4 Other Products -3.6 -2.2 0.0 0.2 0.0 1.1 -3.7 -1.0
Total Products -6.8 -4.0 0.2 9.1 0.0 0.9 -6.6 5.9 Other Oils1 0.0 0.1 1.1 2.3 0.0 0.2 1.1 2.5
Total Oil -4.8 -3.8 3.8 8.2 -0.1 0.2 -1.0 4.6 1 other oils includes NGLs, feedstocks and other hydrocarbons

INTERNATIONAL ENERGY AGENCY - MONTHLY OIL MARKET REPORT OECD STOCKS
18 JANUARY 2005 25
EIA Weekly US PADD II + PADD III Crude Oil Stocks
185190195200205210215220225230
Nov-03 Feb-04 May-04 Aug-04 Nov-04
mb EIA Weekly US-50Distillate Stocks
90
100
110
120
130
140
150
Nov-03 Feb-04 May-04 Aug-04 Nov-04
mb
OECD total oil stocks closed November at 2663 mb, or 81 mb above 2003. All OECD regions saw comfortable crude inventory positions, with stocks at the top or above their five-year range. Days of forward demand cover by OECD oil stocks held flat overall in November at 52 days. Cover in North America came to 49 days, 60 days in Europe and 49 days in the Pacific.
Year-on-Year Industry Stock Comparisons for November 2004
(million barrels) (Days of Forward Demand)
North America Europe Pacific Total North America Europe Pacific Total Crude Oil 16.7 8.9 29.6 55.2 Total Oil 0.9 -0.1 3.7 1.1 Total Products 12.3 2.5 5.5 20.3 Versus 2002 -0.4 1.1 6.7 1.5 Other Oils1 8.0 -2.8 0.9 6.0 Versus 2001 -4.8 1.4 -1.4 -2.2
Total Oil 36.9 8.6 36.0 81.5 Total Products 0.2 -0.2 0.6 0.1 Versus 2002 33.9 32.1 45.2 111.2 Versus 2002 -0.5 -0.4 2.3 0.2 Versus 2001 -21.2 41.5 -9.5 10.7 Versus 2001 -2.7 0.1 -1.6 -1.6
1 other oils includes NGLs, feedstocks and other hydrocarbons
OECD Regional Stock Developments North America US-50 crude stocks rose by about 5 mb in November to nearly 294 mb or 12 mb above 2003. Gains were centred on the Gulf Coast (PADD III), but stocks at Cushing in the Mid-continent (PADD II), the delivery point for NYMEX’s crude futures, also posted a build. Crude imports were relatively high while refinery runs got off to a slow start at the end of seasonal maintenance, utilisation rates reaching 94% only by end-month. December saw crude stocks decline 2 mb as imports fell under 10 mb/d in the second half of the month and refinery runs edged higher to maximise distillate production. The draw was centred on the Gulf Coast, but stocks elsewhere posted increases. Inventories in Cushing continued to rise in December, helping to maintain NYMEX WTI futures in a contango in the near-traded months, albeit one at a surprisingly high outright level. The weakness of cash differentials for domestic grades against WTI in December (for crude delivered in January) suggests relatively ample crude supply in January, aided by deliveries delayed from year-end arrival due to tax-related considerations.
In product stocks, increases were seen in gasoline despite buoyant demand. In contrast to 2003, average gasoline deliveries rose from November to December, but higher demand met with strong domestic production and average imports that were more typical of levels seen during the summer driving season. A late jump in distillate yields, prompted by a protracted period of maintenance, allowed to maintain firm levels of gasoline production. This was seen in high output levels of conventional and reformulated gasoline, particularly in December. And with NYMEX gasoline futures holding in contango, surplus product moved into storage. Gasoline stocks ended December at 214 mb, or about 7 mb above 2003. Distillate stocks (diesel and heating oil) posted a modest 3 mb gain for November-December. Demand growth implied by weekly numbers was robust, and in absence of higher imports, kept pace with a rebound in domestic output. Although demand strength was concentrated in diesel, heating oil stocks failed to post a significant rise in December despite mild temperatures and a financial incentive for storage offered by a contango in futures markets. Stocks in the main consuming Central Atlantic states have stagnated at close to 18 mb. Though supplies were building on the Gulf Coast, pipeline constraints and high domestic freight rates limited product movement north. Instead, with limited storage capacity on the Gulf Coast, distillates, in a reversal of usual arbitrage patterns, were reportedly shipped to Europe. Mild temperatures into early January, output matching demand and potentially higher imports on recent strengthening of New York Harbour prices differentials to Europe favour a build in distillate stocks through mid-January before refinery maintenance begins to reduce runs.

OECD STOCKS INTERNATIONAL ENERGY AGENCY - MONTHLY OIL MARKET REPORT
26 18 JANUARY 2005
OECD PacificIndustry Middle Distillate Stocks
50
60
70
80
90
100
Jan Mar May Jul Sep Nov Jan
mb
Range 1998-20032003 2004
OECD EuropeIndustry Middle Distillates Stocks
200210220230
240250260270
Nov-02 May-03 Nov-03 May-04 Nov-04
mb
-30
-20
-10
0
10
20
Dif ference to 5 year average (right axis)Middle Distillates
Weekly ARA Independent StorageGasoil
5000
7000
9000
11000
13000
15000
Jan Apr Jul Oct
Source: PJK International
kb
2002 20032004 2005
Europe European industry crude inventories rose in November by about 3 mb, closing at 339 mb, 9 mb over 2003 and above their five-year range. The gain was mostly due to a build of 4 mb in Italy and 3 mb in the Netherlands which was partially offset by a decline in Norway. Yet, the increase appears counter-intuitive in a period of heavy maintenance where crude demand slackens and inventories tend to fall. As such, the build in Italy can be thought to be subject to revision. The gain in the Netherlands, where several storage hubs receive crude for re-export, is also unlikely in light of reduced refinery activity and arbitrage opportunities re-opening for Brent-related crudes. Preliminary indications for December point to a sharp drawdown in European crude stocks. The temporary shift in the forward Brent market from contango to backwardation in December reflects tightening supplies, in part due to production losses in the North Sea. And while a rebound in crude runs in December puts downward pressure on stocks, the reported sharp decline in December needs to be weighed against ample sour volumes in the region, particularly Russian supplies through the Baltics and the Black Sea.
Industry gasoline stocks in November came in marginally higher, and according to preliminary indications have fallen in December. While European runs were low due to ongoing maintenance, gasoline output remained fairly steady from October. Demand continued to reflect structural weakness, and the modest rise in stocks may be understated. Recent upward revisions to industry stocks of gasoline and rising independent storage through December in the ARA area due to closed spot arbitrage to the US, would suggest greater availability than implied by preliminary numbers. Industry middle distillate stocks fell a modest 1.4 mb in November from an upward revised October base. Inventories closed at 246 mb or 7 mb above a year-ago. In contrast to gasoline, the reduction in November refinery runs was expected to prompt a deeper draw in stocks, given strong diesel demand and an uptick in heating oil deliveries to traditional barge markets in Northwest Europe. Germany and the Netherlands changed surprisingly little in this context. Conversely, steady cargo deliveries to France and Spain, where re-stocking was taking place ahead of lower mandated sulphur specification in the EU, likely helped to keep inventories flat. December preliminary figures point to a further reduction in distillate stocks by another 3 mb. However, higher crude runs, the inflow of Russian gasoil both from the Baltics and the Black Sea, weakness in heating oil demand due to mild temperatures and a well supplied jet fuel market would tend to mitigate such a development. Gasoil stocks in independent storage in ARA built through December on increased Baltic inflows meeting closed arbitrage to the US for most of the month, weak heating oil demand and low Rhine water levels hampering trade. Pacific Pacific crude stocks rose 13 mb in November on an 11 mb build in Korea where imports reached record levels. Onshore Japanese stocks built by 2 mb. Yet given a low level of oil on tankers at Japanese ports at the end of October and full allocations from Mideast term suppliers, it is likely that the Japanese tanker volumes at end-November rose from October and that the crude stock build will be revised upwards. In products stocks, distillates returned within their normal range. The build was driven by gains in kerosene in Japan where very mild temperatures kept in check a rise in heating demand. In Korea, diesel stocks built with weaker than expected industry demand, lower exports and refinery output maximised over kerosene.

INTERNATIONAL ENERGY AGENCY - MONTHLY OIL MARKET REPORT OECD STOCKS
18 JANUARY 2005 27
Singapore Product StocksMiddle Distillates
4000
6000
8000
10000
12000
14000
Jan Apr Jul Oct
Source: International Enterprise
kb
4000
6000
8000
10000
12000
14000
Range 1999-2003
2004 2004 (4 w k avg)
Singapore Product StocksResidues
4000
6000
8000
10000
12000
14000
16000
Jan Apr Jul Oct
Source: International Enterprise
kb
4000
6000
8000
10000
12000
14000
16000
Range 1999-2003
2004 2004 (4 w k avg)
Singapore Stock Developments in December Total product stocks in Singapore, surveyed by International Enterprise, declined in December, as inventories of light products (naphtha and gasoline) and fuel oil fell. In contrast, middle distillates gained some ground as regional supply, notably of kerosene, outpaced demand. A contango in Singapore forward month prices of gasoil in November allowed growing prompt supplies of distillates to move into storage. While regional refiners maximised distillate output and kept runs high, demand in the region weakened. Interest in kerosene, used as a heating fuel in Northeast Asia, was weaker as mild temperatures and high domestic supplies in key markets moderated the seasonal uptick in import demand. Jet fuel availability rose with closed arbitrage to the US West Coast while trade of the product was may have been affected by financial troubles at China Aviation Oil, which supplies most of China’s jet imports. Gains in gasoil were likely more limited than those in jet/kerosene. Gasoil demand was comparatively stronger, and with reduced exports from Korea, gasoil traded temporarily at an unusual premium to jet fuel in December. Distillates are likely to trend upwards in January with rising gasoil supplies as Chinese buying ahead of the Lunar New Year holiday fell below expectations.
Residual fuel oil stocks fell back slightly in December but remained at high levels. The market was oversupplied as reflected in the deep contango for benchmark Singapore swap prices for 180cst material. Arbitraged supplies of high viscosity product into the region from Europe and the Caribbean added to flows from India and the Middle East. However, Chinese buyers showed muted interest, turning instead to straight-run Russian material to use as refinery feedstock. The mismatch of product quality on offer and demand was seen in the heavy cash discounts of 380cst fuel oil prices versus 180cst product. Inventories should stay at these high levels in the absence of renewed Chinese demand. In addition, European supplies into Singapore will be facing greater competition from Korean cargoes as the country is expected to substantially step-up export volumes above its usual monthly volumes during January. Light product stocks fell back, with the likelihood of comparatively higher draws in naphtha than gasoline. Petrochemical demand was strong with deliveries to Japan and Taiwan while spot supplies from India fell back. Gasoline remained well supplied, despite lower exports from China, keeping gasoline’s usual premium to naphtha modest. Deliveries from Singapore were made to Malaysia and Vietnam, but seasonal demand from Australia proved disappointing. Light product stocks are likely to remain high. While January gasoline demand from Indonesia, Australia and New Zealand is seen rising, availability of naphtha is reportedly high, supported by the arrival of arbitraged material from Europe.
Singapore Crude & Product Trade (thousand barrels per day)
Latest month vs. Net Imports/(Exports) of: 2002 2003 4Q03 1Q04 2Q04 3Q04
Sep 04 Oct 04 Nov 04
Oct 04 Nov 03
Crude Oil 819 755 654 777 696 727 874 1303 1139 -164 593 Products & Feedstocks -35 -96 -18 -64 -150 -118 -12 -107 -216 -109 -201
Gasoil/Diesel -154 -170 -161 -133 -206 -181 -146 -181 -180 1 -70 Gasoline -81 -83 -96 -88 -119 -79 -66 -128 -104 24 -19 Heavy Fuel Oil 334 320 341 304 289 238 228 371 195 -176 -78 LPG -19 -22 -19 -24 -21 -20 -17 -24 -24 1 -4 Naphtha 6 13 49 38 24 42 26 33 26 -8 -27 Jet & Kerosene -65 -99 -77 -99 -50 -92 -106 -110 -67 43 7 Other -57 -55 -54 -62 -67 -26 68 -68 -61 7 -8
Total 784 659 636 713 546 609 862 1196 923 -273 392 Source: International Enterprise, IEA estimates

OECD STOCKS INTERNATIONAL ENERGY AGENCY - MONTHLY OIL MARKET REPORT
28 18 JANUARY 2005
Regional OECD End-of-Month Industry Stocks(in days of forward demand and millions barrels of total oil)
Days1 Million Barrels
1. Days of forward demand are based on average demand over the next three months.
North America
1050
1100
1150
1200
1250
1300
Jan Mar May Jul Sep Nov Jan
mb
2001 2002 2003 2004
Europe
840
860
880
900
920
940
960
980
Jan Mar May Jul Sep Nov Jan
mb
2001 2002 2003 2004
Pacific
380
400
420
440
460
480
500
Jan Mar May Jul Sep Nov Jan
mb
2001 2002 2003 2004
North America
44
46
48
50
52
54
56
Jan Mar May Jul Sep Nov Jan
days
2001 2002 2003 2004
Europe
56
58
60
62
64
66
Jan Mar May Jul Sep Nov Jan
days
2001 2002 2003 2004
Pacific
40
42
44
46
48
50
52
54
56
58
60
Jan Mar May Jul Sep Nov Jan
days
2001 2002 2003 2004

INTERNATIONAL ENERGY AGENCY - MONTHLY OIL MARKET REPORT PRICES AND REFINERY ACTIVITY
18 JANUARY 2005 29
PRICES AND REFINERY ACTIVITY
Summary • Benchmark NYMEX light crude fell by $10 in early December to $40.25/bbl but an early
January rally has since pushed prices close to $48/bbl. Production problems in the North Sea, Nigeria and Iraq together with the slow recovery of output in the Gulf of Mexico, OPEC target cuts and of course cold weather have underpinned prices. A collapse of the record freight rates in early December has helped reduce costs to importing countries, but has also contributed to volatility.
• Product differentials to crude narrowed sharply in December as US distillate stocks returned to
the lower-end of their normal range, Japanese kerosene stocks moved above year-ago levels and Europe saw the smooth early transition to lower sulphur fuels. However, cold weather has returned to the US Northeast in January and parts of Asia. Should lower temperatures prove protracted, full pipelines, transportation economics and planned maintenance could make it difficult to swiftly increase supplies to areas in need.
• Light/sweet-heavy/sour spreads continued to narrow in early December, following higher sour
crude demand in Europe and pledged OPEC production cuts. But, tightness in light sweet crudes re-emerged towards the end of the month as Asian and US traders took advantage of lower freight rates to buy spot crudes. Upward price pressures were compounded as production problems emerged in the North Sea and Nigeria. Sweet crude demand is expected to remain firm during first quarter refinery maintenance.
• Freight rates plunged in early December as crude buying tempered ahead of the New Year.
Chinese interest appeared to slow following heavy imports in November, while US refiners were reducing activity ahead of the year-end and maintenance-reduced first quarter requirements.
• Refinery margins broadly fell in December as previously wide light product differentials to crude
narrowed. European and Asian margins slumped at the end of December, early January, pressured by the strength of Brent crude and a well-supplied product market in Asia. US margins bucked the downward trend as sporadic cold weather returned in late December and product differentials rose ahead of maintenance.
• OECD refinery throughput rose by 1.2 mb/d in November to 39.53 mb/d from 38.34 mb/d in
October. The end of heavy fourth quarter maintenance was reflected in provisional data indicating higher runs in December. Early indications suggest that first quarter maintenance in the US should be up to 300 b/d lower than 2004, with a lighter burden seen in Europe in the March to May period.
Spot Benchmark Crude Prices
30
35
40
45
50
55
Jul-04 Sep-04 Nov-04 Jan-05
$/bbl
WTI Cush M1(Adj) Brent Dated Dubai M1(Adj)

PRICES AND REFINERY ACTIVITY INTERNATIONAL ENERGY AGENCY - MONTHLY OIL MARKET REPORT
30 18 JANUARY 2005
Overview The sharp fall in crude prices since their record October peak has injected additional uncertainty into many areas of the oil market. Traders held back from buying crude and products in early December, fearing further falls. This, together with announced cuts in term deliveries by some OPEC countries had a knock-on effect on freight, with rates crashing from record highs at the start of last month. A mild start to winter and high levels of refinery throughput contributed to significant stock builds in the fourth quarter. This left consuming countries better positioned ahead of up-coming refinery maintenance in the US and Europe. However, stocks-to-consumption data are less comfortable and reports of refinery run cuts in the US Gulf Coast after a small weather-related delay highlights that improved inventories are not yet industry-wide. Cold weather arrived in China, Japan, South Korea, and the US North East in mid-January. OPEC has announced output cuts and will review its position at the end of January. Production problems since the beginning of December have dogged the North Sea, Iraq, West Africa and Canada while post-Ivan restarts in the Gulf of Mexico are slower than expected. Crude prices have rebounded as a result of the higher potential for improved winter demand and recent supply disruptions. And the near-term price outlook remains unclear. Temperatures remain an important factor. The past two years have shown that US heating oil stocks can be drawn down very sharply should cold weather prove protracted. Also, it should be noted that upward revisions to demand and downward revisions to supply have lifted the 2005 “call” on OPEC in line with last year’s levels. Refinery maintenance in both Europe and the US is expected to be relatively light in the first half of the year, and the transition to 50 ppm sulphur transportation fuels in Europe from 1 January appears to have proceeded without disruption. However, while additions of desulphurisation equipment should increase the flexibility of the crude input stream, there remains a lack of upgrading capacity and an abundant supply of fuel oil. This complicates refining economics and should continue to support demand for light/sweet crudes over heavy/sours. Crude Oil Prices Spot Crude Prices and Differentials Atlantic Basin supply disruptions, ongoing problems in Iraq, reductions in over-target production by OPEC, falling freight rates and pre-maintenance and tax related year-end stock reductions influenced regional crude prices over the past six weeks.
Supply disruptions, predominantly in the Norwegian sector of the North Sea kept transatlantic arbitrage opportunities marginal through December and early January. Sharply lower freight rates and a fall in the WTI-dated Brent spread (to nearly $2.00 from nearly $7.00 at the end of November)
Spot Crude Oil Prices and Differentials* (monthly and weekly averages, $/bbl)
Dec-Nov Week Commencing: Oct 04 Nov 04 Dec 04
Change % 13 Dec 20 Dec 27 Dec 03 Jan 10 Jan
Crudes Brent Dated 49.64 42.84 39.53 -3.31 -7.7 40.08 41.21 39.15 41.28 44.39 WTI Cushing 1 month (adjusted) 53.24 48.44 43.20 -5.24 -10.8 43.48 44.75 42.52 44.01 45.49 Urals (Mediterranean) 42.34 38.24 36.17 -2.07 -5.4 36.33 37.67 36.32 37.96 40.47 Dubai 1 month (adjusted) 37.54 34.87 34.20 -0.67 -1.9 34.30 35.79 33.58 34.86 36.74 Tapis 52.99 47.08 39.03 -8.05 -17.1 38.09 40.53 38.77 42.31 45.68
Differential to Dated Brent WTI Cushing 1 month (adjusted) 3.60 5.59 3.67 -1.93 3.40 3.53 3.37 2.74 1.09 Urals (Mediterranean) -7.30 -4.60 -3.36 1.24 -3.75 -3.54 -2.83 -3.32 -3.92 Dubai -12.10 -7.97 -5.33 2.64 -5.78 -5.43 -5.57 -6.42 -7.65 Tapis 3.35 4.24 -0.50 -4.74 -2.00 -0.69 -0.38 1.03 1.28
Prompt Month Differential Brent 1mth-2mth (adjusted) 0.56 -0.38 -0.23 0.15 -0.29 -0.35 0.06 0.18 0.18 WTI Cushing 1mth-2mth (adjusted) 0.58 -0.09 -0.30 -0.20 -0.18 -0.19 -0.20 -0.20 -0.20
* Weekly data for Brent and WTI 1st month and 2nd month are unadjusted

INTERNATIONAL ENERGY AGENCY - MONTHLY OIL MARKET REPORT PRICES AND REFINERY ACTIVITY
18 JANUARY 2005 31
were not enough to open the transatlantic arbitrage. Weak early December refining margins also kept US crude demand relatively weak until the end of December. Urals crude differentials to dated Brent were volatile throughout December, oscillating between $3 and $6/bbl. Disruptions to northern Iraqi flows put upward pressure on price, as did relatively attractive hydroskimming margins in Northwest Europe until early January. However the differential between Urals cargoes from the Baltic and Black Sea pushed over $3 in mid-December reflecting a sharp increase in freight rates in the Mediterranean region and strong demand and sharply rising exports from northern ports. Asian buying of West African crude for January increased from a relatively light 1.0 mb/d in December. Signs of a price floor in mid-December once more accompanied by low freight rates helped to trigger sustained January buying. US demand for spot West African cargoes also improved, aided by firm refinery margins towards the end of the month. Arbitrage economics for spot West African crudes were also more attractive than those of Brent. Ethnic problems once more disrupted Nigerian output, helping to tighten Bonny light supplies, however differentials to dated Brent were largely unaffected due to simultaneous production problems in the North Sea. US Light Louisiana Sweet returned to a premium over WTI in early January as Canadian syncrude production problems increased the demand for pipeline crude into the US mid-continent. Weak pre-maintenance and lower tax-related year-end demand is evident in the reduction in US crude imports by 700 kb/d since mid-December compared with the prior three weeks. Lower demand from US refiners contributed to the $10 fall in price in WTI between end-November and mid-December. An increase in end-January US refining margins together with a relatively high level of catalytic cracker capacity maintenance in the first quarter has increased the demand for light sweet crudes. Heavier sour crudes have also held their own, with Mars and WTS returning to their early December highs against WTI as coker margins remain firm. Heavy sour crude discounts to light sweet crudes however remain high by historical standards: although considerable investment in desulphurising equipment has been made, large heavy sulphur crude discounts are needed to encourage investment in refinery upgrading units. OPEC market management might cause temporary dislocations in this trend, but ultimately a tightening of heavy sour supplies will be reflected in higher light sweet crude prices. Indications of reduced OPEC term supplies helped to narrow differentials of regional Asian crudes to dated Brent from early December. Colder weather also entered parts of China, Japan and Korea. Minas and Cinta differentials narrowed to their lowest level since the end of October as Middle Eastern term supplies to the region were reduced. Crude Futures North Sea and West African supply disruptions contributed to the early January shift of IPE Brent into backwardation for the 1M-2M and 2M-3M futures spreads for the first time since early November. A deterioration in sour crude refining margins improved refiner demand for sweet crude in Europe, but with margins for sweet and sour crudes both falling sharply recently this was a relatively minor supply-side consideration. Despite the volatility at the front-end, the average 12-month forward curve remains flat.
Ur a ls S pre ads to Da ted Br ent
-8.0
-6.0
-4.0
-2.0
0.0
2.0
4.0
No v-04 De c-04
Urals NWE - Dtd Brent
Urals M ed - Dtd Brent
Urals M ed- Urals NWE
As ia n Sprea ds to Da te d Bre nt
-15 .0
-10 .0
-5 .0
0 .0
5 .0
No v-04 De c-04M inas - Dtd Brent Tapis - B rentCinta - Dtd Brent

PRICES AND REFINERY ACTIVITY INTERNATIONAL ENERGY AGENCY - MONTHLY OIL MARKET REPORT
32 18 JANUARY 2005
In contrast to IPE Brent, NYMEX WTI average 12 month forward curves have remained in a modest backwardation, despite the post-October slump in crude prices. Although the 1M-2M spread remains in contango, the further forward spreads are in a steeper backwardation than IPE Brent. This is more a function of forward pricing relationships relative to product prices than an indication of relative market tightness Delivered Crude Prices in October Sharp rises in delivered crude prices were seen in IEA Europe and North America in October 2004 lifting total IEA prices by $3.55 to $44.32/bbl. North American prices rose by $4.72 to $44.76, while in Europe they rose to 46.04, a rise of $4.88. Pacific prices however actually fell by 46 cents to $40.76/bbl. Although Pacific prices generally lag spot crude price moves, and the dip in October import prices is redolent of the slight spot price fall in September. European and US refiners are also likely to have used a greater proportion of higher-priced light sweet crudes during the maintenance period.
Product Prices Spot Product Prices Steep falls in gasoline prices and differentials against crude were seen in all key regions in December, with percentage losses in NWE more than double those of dated Brent. The falls in middle distillate differentials were not quite so steep, but outpaced declines in benchmark crudes in all but the US. Fuel oil differentials narrowed on average over December, in what was more a reflection of the low
Monthly Average Crude Oil Prices and Differentials to Dated Brent - December 2004
BrentIPE Brent Brent 1 mth
$2.98 $40.28 $40.02 -$4.58
NYMEX WTI $43.26 $35.44 Oman$0.06 IPE Brent $0.75 $1.24
WTI Cushing $43.20 NYMEX WTI $3.72 Brent 1 mth $0.49 Oman -$4.09 $34.20 Dubai$0.05 WTI Cushing $3.67 Dubai -$5.33 -$0.69
LLS $43.15 LLS $3.62 Minas -$4.64 $34.89 Minas$3.69 WTS -$0.07 Tapis -$0.50 -$4.14
WTS $39.46 HLS $2.22 Dated Brent $39.03 Tapis-$2.30 $39.53
HLS $41.76
$2.86
Forcados -$0.39 Es Sider -$1.25
$2.61 Bonny Light -$0.30 Suez Blend -$6.89
Cabinda -$5.71 Iran Light -$4.75
Brass River -$0.26 Iran Heavy -$7.79
Urals -$3.36 $36.17 Urals$4.43
Forcados $39.15 $31.74 Iran Heavy-$0.08 -$3.04
$39.23 $5.41 $33.82 -$5.45 $39.27 $0.99 $38.28 $5.64 $32.64 -$2.14 $34.78
Bonny Light Cabinda Brass River Es Sider Suez Blend Iran Light
Mediterranean
Atlantic Basin
Pacific Basin
NYM EX W TI Front M onth Spre a ds
-1.0
-0.5
0.0
0.5
Nov-04 Dec-04
$/b b l
NYM EX WTI M th1(adj)-M th2(adj)NYM EX WTI M th2(adj)-M th3(adj)NYM EX WTI Average 12 M th spread
IP E Bre nt Front M onth S pre a ds
-3.0
-2.0
-1.0
0.0
1.0
No v-04 De c-04
$/b b l
IPE Brent M th1(adj)-M th2(adj)IPE Brent M th2(adj)-M th3(adj)IPE Brent Average 12 M th spread

INTERNATIONAL ENERGY AGENCY - MONTHLY OIL MARKET REPORT PRICES AND REFINERY ACTIVITY
18 JANUARY 2005 33
nominal price of residuals than an improvement in the market balance. By early January, high sulphur fuel oil differentials had returned to their average November levels of close to $20 in the Atlantic Basin. Ample gasoline supplies in Europe contributed to the build up of material in the region, ultimately leading to the sporadic opening of the transatlantic arbitrage window as US gasoline prices strengthened. Gasoline output was partly related to strong demand for ultra low sulphur diesel. Traders noted that refiners were desulphurising Russian gasoil, and were running naphtha through reformers to generate the hydrogen needed for the process.
In the US, gasoline differentials to WTI improved towards the end of December due to refinery disruptions on the Gulf Coast and concern that a projected high level of maintenance on catalytic crackers in the first quarter would result in reduced supplies. Price effects swiftly encouraged arbitrage movement, an increase in blending activity and a rise in price of blendstocks such as MTBE. In Asia, signs that China was stepping up January gasoline exports to the highest level since August resulted in a sharp fall in regional prices relative to the Atlantic Basin. High levels of Chinese refinery throughput and reduced ex-refinery selling prices have made Chinese exports more attractive. High run rates have also led to an improvement in the regional supply position, although good demand is reported from Vietnam and Indonesia. Indian refiners are also reported to be looking to replace lower grade material with material that meets local fuel specifications.
Spot Product Prices (monthly and weekly averages, $/bbl)
Dec-Nov Week Commencing:
Oct Nov Dec Change % 13 Dec 20 Dec 27 Dec 03 Jan 10 Jan
Oct Nov Dec
Rotterdam, Barges FOB Differential to Brent
Premium Unleaded (Cargo) 56.72 51.53 43.30 -8.23 -16.0 44.01 42.31 41.48 45.43 46.74 7.08 8.69 3.77 Regular Unleaded 56.06 50.87 42.61 -8.25 -16.2 43.31 41.63 40.81 44.71 46.00 6.42 8.03 3.08 Naphtha 51.50 47.54 42.24 -5.29 -11.1 42.59 42.72 40.08 42.12 42.97 1.86 4.70 2.71 Jet/Kerosene 66.09 60.47 54.20 -6.27 -10.4 55.47 54.46 50.99 51.81 54.67 16.45 17.63 14.67 Gasoil 64.06 57.79 52.07 -5.72 -9.9 53.50 53.70 49.20 49.79 52.24 14.41 14.95 12.54 Fuel Oil 1.0%S 29.22 26.22 25.95 -0.28 -1.1 26.02 27.07 26.34 26.14 27.36 -20.42 -16.62 -13.59 Fuel Oil 3.5% 26.98 22.41 21.82 -0.58 -2.6 21.95 22.34 21.99 22.71 23.43 -22.66 -20.44 -17.71
Mediterranean – Basis Italy, Cargoes FOB Differential to Urals Premium Leaded (0.15 g/l) 56.13 50.29 41.15 -9.14 -18.2 41.08 41.71 39.64 43.66 45.15 13.79 12.05 4.98 Premium Unleaded 55.41 49.57 40.43 -9.14 -18.4 40.37 40.99 38.92 42.94 44.43 13.07 11.33 4.26 Naphtha 50.41 45.37 39.71 -5.66 -12.5 40.05 40.37 37.78 40.28 41.53 8.07 7.13 3.54 Jet/Kerosene 63.15 57.48 51.04 -6.44 -11.2 52.58 52.34 48.61 49.87 53.09 20.81 19.25 14.87 Gasoil 61.74 57.36 51.56 -5.80 -10.1 53.61 52.83 47.16 48.24 50.69 19.40 19.12 15.39 Fuel Oil 1.0%S 30.18 27.78 26.67 -1.11 -4.0 26.85 27.84 26.98 27.92 28.62 -12.16 -10.46 -9.50 Fuel Oil 3.5%S 25.23 19.45 19.42 -0.04 -0.2 19.74 20.56 19.82 20.60 21.26 -17.11 -18.79 -16.76
NY Harbour, Barges Differential to WTI
Super Unleaded * 60.10 54.70 46.60 -8.11 -14.8 46.90 47.87 45.65 51.03 52.06 6.86 6.27 3.40 Regular Unleaded * 57.88 53.33 44.87 -8.46 -15.9 45.24 46.08 43.60 48.54 49.97 4.64 4.89 1.67 Jet/Kerosene 66.13 59.23 54.46 -4.77 -8.0 56.65 57.59 52.16 53.51 57.57 12.89 10.79 11.27 No.2 Heating Oil 62.40 58.18 53.45 -4.72 -8.1 55.69 56.63 51.23 51.60 53.67 9.16 9.74 10.26 Fuel Oil 1.0%S (Cargo) 33.17 28.78 25.22 -3.56 -12.4 25.13 27.81 27.38 27.28 28.13 -20.07 -19.65 -17.98 Fuel Oil 3.0%S (Cargo) 30.92 24.31 22.46 -1.85 -7.6 22.78 25.84 24.28 24.34 26.13 -22.32 -24.13 -20.74
Singapore, Cargoes Differential to Dubai Premium Unleaded 95 54.73 52.45 44.81 -7.63 -14.6 44.31 44.61 43.08 43.07 45.46 17.18 17.58 10.61 Naphtha 48.81 47.46 42.78 -4.68 -9.9 42.38 43.08 39.92 39.21 40.69 11.27 12.59 8.58 Jet/Kerosene 61.25 57.64 50.07 -7.57 -13.1 49.30 52.26 48.25 47.39 49.91 23.71 22.77 15.86 Gasoil 56.94 55.22 49.25 -5.97 -10.8 50.04 51.33 46.48 46.93 48.66 19.39 20.35 15.05 LSWR (0.3%S) 42.90 34.59 25.65 -8.93 -25.8 25.30 27.16 24.79 27.39 30.75 5.36 -0.28 -8.55 HSFO (3.5%S 180cst) 32.05 30.53 27.59 -2.94 -9.6 27.95 28.39 26.64 26.54 27.81 -5.50 -4.34 -6.62 HSFO 4%S 31.39 29.34 25.16 -4.18 -14.2 25.40 25.74 24.16 24.66 27.18 -6.15 -5.53 -9.05
* From 1 November, assessments for NYH are for Max 0.3% MTBE

PRICES AND REFINERY ACTIVITY INTERNATIONAL ENERGY AGENCY - MONTHLY OIL MARKET REPORT
34 18 JANUARY 2005
The European naphtha market remains mixed. Although there is more throughput of reformer grade naphtha for gasoline and hydrogen production, the low relative price of LPG is prompting petrochemical manufacturers to substitute where possible. However, the strong reformer demand has helped push Northwest European naphtha prices to a premium to Singapore, where prices have been under pressure from a weaker gasoline market and incoming cargoes from India and the Middle East. The focus on diesel and naphtha production has cut into jet/kerosene output in Europe, but seasonally weak demand has acted as a partial offset. However, in the US, the focus on diesel and heating oil supplies has restricted jet output, which together with improved gasoline economics and strong airline demand has tightened jet supplies. New York Harbour prices have moved to a strong premium to both European and Singapore prices as a result. Concerns about Asian kerosene supplies for heating have however abated as Japanese kerosene stocks moved above year ago levels at the end of December. While refiner focus will soon switch to pre-maintenance and spring supply needs, healthy middle distillate cracks will continue to favour distillate production over gasoline. Recent cold weather in northern China, Japan and Korea is likely to improve demand, but the vast price spread between US and Asian prices is likely to lead to some shipments out of the region. The smooth transition to 50 ppm sulphur content in diesel at the start of the year adds weight to the anecdotal trade reports that material was being stockpiled ahead of the switch. Refinery problems in Northwest Europe had however led to strong premiums for 10 ppm ultra low sulphur diesel in December. Although the refinery issues were largely resolved, the premiums persisted. Higher-than-expected Russian gasoil shipments, due to an exceptionally mild winter, and strong economics encouraged desulphurisation. Russian distillates were also shipped to the US in December, but overall the transatlantic arbitrage was only sporadically open. US distillate demand remained strong, predominately led by the strong diesel transportation market. Early winter heating oil demand was lacklustre due to mild temperatures. Colder temperatures emerged sporadically at the end of December in the US Northeast, early January was very mild, but temperatures have recently dipped and there are forecasts that suggest it will remain cool for the rest of this month. Although speculative activity is biased towards lower prices in heating oil, refiners continue to lift distillate yields. US refinery data also show that refineries moved to record distillate yields in late December and early January. US distillate stocks, now at the lower end of the normal range, also remain low on a days/demand basis. Experience over the last few years also shows a sustained bout of cold weather can draw down stocks very quickly, and with pipelines full, transportation logistics could prove a market issue. Singapore gasoil prices remain below those in the Atlantic Basin as high refinery throughput and a mild first half of the winter enabled stocks in Singapore and Japan to build. High refinery runs in China, together with lower refinery sales prices have resulted in lacklustre import demand. WEPEC, China’s leading export refinery, indicated that it was temporarily resuming diesel exports in January and February following a one-year cessation of exports. China oil and Unipec have (so far) shown no interest in importing diesel cargoes in January. This follows from trade estimates of a sharp decline in diesel imports in December to around 160,000 tonnes from around 355,000 tonnes in November. Recent reports suggest that up to 100,000 tonnes of Asian gasoil would move to Europe in January to take advantage of strong IPE prices, which coupled with recent cold weather, should help to tighten the market. The recent deterioration in Asian refining margins could also, if protracted, lead to a reduction in refinery activity. Fuel oil cracks showed a modest recovery in December following a limited response to the sharp fall in crude and product prices. With fuel oil prices so low, an equal percentage price drop between crude and product prices naturally results in a lower nominal price fall. Intuitively, with fuel oil prices near $20/bbl, it is clear that a $20 slide in the price of crude would not lead to the maintenance
Unl. Ga s oline Spre a ds to Rotte rda m
-4
-2
0
2
4
6
No v-04 De c-04 Unleaded NYH Barge
Prem Unl M ed FOB Cargo
Prem Unl Singapore

INTERNATIONAL ENERGY AGENCY - MONTHLY OIL MARKET REPORT PRICES AND REFINERY ACTIVITY
18 JANUARY 2005 35
of a $20 discount of fuel oil to crude. However, the lack of refinery upgrading capacity that has led to the over-supplied fuel oil market is not going to go away swiftly, and steep fuel oil discounts relative to other products are likely to persist in 2005.
The biggest shift in the fuel oil market was a sharp increase in US fuel oil differentials to WTI in early December. Colder weather stimulated utility offtake, but the rise in price combined with lower freight rates also attracted imports and together with higher refinery activity, led to an increase in stocks. This could however be mitigated by the current drop in temperatures. Falling fuel oil prices in Singapore also resulted in a build up of material in Europe. Europe’s surplus has been largely managed through exports to the premium Asian market, but increased competition from Indian and Middle Eastern refineries, coupled with higher Asian throughput has made trade harder. Product Futures IPE and NYMEX gasoil futures saw sharp front-month falls since early December, but there was very little movement eight to 12 months out, leading to a sharp flattening of the spread. While some of this flattening is due merely to contract roll-over, forward curves for both contracts have less seasonality than would normally be the case. The lack of movement at the tail of the contract has to be interpreted cautiously. Liquidity is often limited in the back months, and pricing is generally related to the seasonality of the forward crack spread (simplistic futures proxy for refining margins). Therefore there is often a lagged response along the curve to a fall in prices at the front end. While speculators held minimal net long positions in NYMEX light crude and gasoline, fears of a winter price spike in heating oil would, at first glance, appear to have dissipated. Non-commercial longs started to liquidate their positions from mid-October as crude prices peaked, reducing them from 36,015 lots to the current 10,816 lots. Non-commercial short positions however moved from 23,833 lots to 24,395 lots respectively. While this move appears to anticipate the end to refinery maintenance in the US and the subsequent increase in distillate stocks, it has to be noted that there could be a broader explanation only partly related to peak winter issues. Petroleum prices broadly move in unison, but that each component can move by a certain differential to the price of crude. It is rational therefore that speculators should turn to the market with the greatest potential for price swings. Understandably, when heating oil stocks were low, heating oil was a preferred vehicle for those expecting prices to rise, while last spring there was concern over gasoline supplies, which led to a large net-long bias in the NYMEX gasoline contract. As heating oil stocks have risen, these positions have been reversed to net short reflecting expectations of an end-season dip in prices.
Monthly Average Spot Product Prices and Differentials - December 2004
NYH Mediterranean
Unleaded $45.08 Prem. Unl $40.43
Jet/Kero $54.46 Naphtha $39.71
No. 2 $53.45 Gasoline $2.47 Gasoline -$2.18 Jet/Kero $51.04
LSFO 1% $25.22 Jet/Kero $0.26 Naphtha -$2.54 Gasoil $51.56
No.6 3% $22.46 Gasoil $1.38 Jet/Kero -$3.16 LSFO 1% $26.67
LSFO -$0.72 Gasoil -$0.52 HSFO 3.5 % $19.06
Gasoline -$0.92 HSFO $0.63 NWE LSFO $0.72
Gasoil $2.15 Unleaded $42.61 HSFO -$2.76
LSFO $5.97 Naphtha $42.24
HSFO -$0.76 Jet/Kero $54.20 Gasoline -$4.38
Gasoil 0.2% $52.07 Naphtha -$3.08
LSFO 1% $25.95 Jet/Kero $0.97
USGC HSFO 3.5 % $21.82 Gasoil $2.30
Unleaded $44.16 LSFO $1.02
No.2 $55.61 HSFO -$6.10
LSFO 1% $31.19
HSFO 3.5 % $21.70
Singapore
Gasoline -$4.21 Prem. Unl $44.81
LSFO $1.67 Naphtha $42.78
Jet/Kero $50.07
USWC Gasoline -$3.56 Gasoil 0.5% $49.25Unleaded $48.37 Jet/Kero -$3.12 LSWR Crk $25.65
Jet/Kero $53.19 LSFO -$3.86 HSFO 4% $25.16
LSFO 1% $29.52
NYH Spread to NWE
M editerranean Spread to Singapore
M ed Spread to NWE
Singapore Spread to USWC
USGC Spread to NWE
USGC Spread to USWC

PRICES AND REFINERY ACTIVITY INTERNATIONAL ENERGY AGENCY - MONTHLY OIL MARKET REPORT
36 18 JANUARY 2005
Ro tte rd a m S p o t P ro d uct P rice s
2 0
3 0
4 0
5 0
6 0
7 0
Nov-0 4 De c -04 J an-0 5
$/bb l
Premium Unleaded Jet/KeroGasoil LSFO 1% HSFO 3.5%
S in ga p o re S p o t P ro du ct P rice s
2 0
3 0
4 0
5 0
6 0
Nov-0 4 De c -04 J an-0 5
$/bb l
Premium Unleaded Jet/Kero Gasoil .5% LSWR Cracked HSFO 4%
Ro tte rd a m S p re a d s to Da te d Bre nt
-25
-15
-5
5
15
25
Nov-04 De c-0 4 Ja n-0 5
$/b b l
Premium Unleaded Jet/Kero Gasoil .2% LSFO 1% HSFO 3.5%
Ne w Yo rk Ha rb o ur S p re a d s to W TI
-30
-20
-10
0
10
Nov-04 De c-0 4 Ja n-0 5
$/b b l
Unleaded Jet/Kero Gasoil
LSFO 1% HSFO 3%
S in g a p ore S pre a d s to Dub a i
-15
-5
5
15
25
Nov-04 De c-0 4 Ja n-0 5
$/b b l
Premium Unleaded Jet/Kero GO .5% LSWR Cracked HSFO 4%
Ne w Yo rk Ha rb ou r S po t P rod u ct P rice s
2 0
3 0
4 0
5 0
6 0
7 0
Nov-0 4 De c -04 J an-0 5
$/bb l
Unleaded Jet/Kero Gasoil
LSFO 1% HSFO 3%

INTERNATIONAL ENERGY AGENCY - MONTHLY OIL MARKET REPORT PRICES AND REFINERY ACTIVITY
18 JANUARY 2005 37
Perhaps more indicative of the level of speculative interest in oil whole is that the combined non-commercial short and long position for crude, gasoline and heating oil is at its lowest level for 14 months, and has been broadly net short since early December.
End-User Product Prices in December Retail prices for all petroleum products fell in national currencies with the exception of diesel prices in Italy. The peak of petroleum prices came in October, but large falls in product differentials to crude came in December, which means that this downward trend should continue in January. Gasoline prices saw steep falls in ex-tax dollar terms in Germany, Canada and the US, as supply improved following maintenance. A similar pattern was seen in these countries in diesel, but was less marked in heating oil. In the UK, a strong pound helped to lower dollar denominated prices, but the speed of the currency move means that the full benefit might not have been felt in product trade. A mild winter, coupled with the end to seasonal maintenance contributed to a more comfortable stock position in heating oil, and was reflected in European retail prices. A glance at the change of end user prices for gasoline, diesel and heating oil in terms shows gains of 19% to 59% over a year ago. However, while lighter fuels have been at a premium, the lack of refinery upgrading capacity has led to a glut of fuel oil. Fuel oil prices for European industry have risen by 7% to 20.2% in ex-tax dollar terms year-on-year, but delivered prices fell by 1.7% in Germany in euro-terms, with rises of less than 3% for all but Italy. Freight Freight rates plunged in early December in unison with crude prices. While some of the weakness was related to concerns (borne out) that OPEC would cut overproduction and therefore term loadings, there were other factors at play. Freight rates fell sharply for large tonnage, with VLCC routes to Asia particularly badly hit. Freight rates from the Middle East Gulf to Japan fell from their mid-November peak of WS 315 to WS75 in early January. The falls in midsized tankers were more restrained as traders stood back from the market waiting for a price floor, preferring smaller cargoes where necessary. Freight rates have been volatile all year, as strong demand and an unusual confluence of supply side factors pull against each other. The shift towards double-hulled tankers has led to a large number of tankers being earmarked for scrap. Steel prices have also been at record levels, giving fleet owners an incentive to scrap. But, demand has also been strong, and shipyard order books are full.
N YM EX H e a t in g O il P r ic e C u r ve
8 0
1 0 0
1 2 0
1 4 0
1 6 0
M 1 2 3 4 5 6 7 8 9 1 0 1 1 1 2
c /g a l
05-Jan-04 30-N o v-0415-D ec-04 07-Jan-05
IPE Gas oil Pr ic e Curve
240
290
340
390
440
M 1 2 3 4 5 6 7 8 9 10 11
$/T o n n e
05-Jan-04 30-Nov-0415-Dec-04 07-Jan-05
Weekly Crude Oil Tanker Voyage Freight Rates
0
10
20
30
40
50
Apr-04 Jul-04 Oct-04
US$ per Tonne
80,000 N o rth Sea-N W Euro pe130,000 W.A f rica-USA CVLC C M E Gulf-Japan

PRICES AND REFINERY ACTIVITY INTERNATIONAL ENERGY AGENCY - MONTHLY OIL MARKET REPORT
38 18 JANUARY 2005
The sharp rise and fall in freight rates in the fourth quarter 2004 would appear to be indicative of both a tight underlying market, and a certain degree of panic as oil prices rose in early October. However, as fundamentals shifted in favour of charterers and owners competed for a reduced tonnage the market fell back almost as swiftly as it rose. Congestion in the Turkish straits appears to have been less of a problem this winter, although recently there have been some weather-related delays in Black Sea loadings. Russia has avoided congestion problems by moving volumes northward, and the imminent start-up of the BTC pipeline is also likely to help reduce congestion in the future Refining Margins Refining margins pushed lower in all regions covered in December and the exceptional returns that were seen earlier in 2004 have diminished. Recent activity shows a diverging pattern, with US Gulf Coast and West Coast margins outperforming those in Europe and Asia. These moves can broadly be attributed to diverging gasoline and fuel oil prices and the strength of dated Brent.
In the US Gulf Coast, North Sea production problems and the ensuing price strength kept Brent (full cost) cracking margins in negative territory. Brent margins have been broadly negative since the summer, with LLS and Mars offering more attractive regional options. Coking margins continue to offer attractive returns due to the persistent weakness of fuel oil and strong light/sweet-heavy/sour differentials. The recent strength in gasoline prices has helped to improve cracking economics in this key refining region. Refining margins have deteriorated sharply in Europe following the end of heavy fourth quarter 2004 maintenance and the smooth transition to 50 ppm sulphur fuels at the start of 2005. Strong regional crudes have had a significant impact, with Brent strength supplemented by strong Urals crude, particularly in the Med, due to Black Sea loading difficulties and a reduced flow of Iraqi material.
Key Refining Margins in Major Refining Centres ($/bbl)
Monthly Average Change Week Ending:
Oct 04 Nov 04 Dec 04 Dec-Nov 04 10 Dec 17 Dec 24 Dec 31 Dec 07 Jan
NW Europe Brent (Cracking) 3.16 5.03 2.91 -2.12 4.22 1.31 1.66 0.23 -1.13 Brent (Hydroskimming) -1.81 0.78 -0.26 -1.04 0.73 -1.60 -1.28 -2.72 -4.44
Mediterranean Urals (Cracking) 8.75 7.99 4.66 -3.33 5.50 4.95 3.11 1.87 1.21 Urals (Hydroskimming) 0.99 0.54 -0.98 -1.51 -0.04 -0.70 -2.61 -3.28 -4.54
US Gulf Coast Brent (Cracking) -2.64 -1.80 -3.17 -1.37 -4.34 -4.26 -1.48 -2.64 -1.82 LLS (Cracking) -0.36 -0.46 -1.46 -1.00 -1.74 -2.21 0.00 -0.53 1.12
Maya (Coking) 7.84 10.93 9.65 -1.29 10.19 7.65 10.13 9.65 11.91 US West Coast ANS (Cracking) 6.82 5.50 3.22 -2.28 3.59 2.03 4.15 4.02 2.51
Oman (Cracking) 9.58 3.19 -1.62 -4.82 -3.96 -0.97 0.72 1.76 0.56 Kern (Coking) 16.55 13.42 10.62 -2.80 8.54 12.51 12.29 12.37 11.28 Singapore
Tapis (Hydroskimming) -3.69 -1.23 0.13 1.35 0.45 0.83 -0.29 -1.49 -5.67 Dubai (Hydrocracking) 8.22 7.99 3.54 -4.45 3.44 3.89 3.48 3.65 2.15 Tapis (Hydrocracking) -1.69 1.77 3.35 1.57 3.72 4.04 2.82 1.55 -3.27
China* Cabinda (Hydroskimming) -3.28 -0.79 -2.95 -2.15 -2.75 -4.08 -2.94 -4.48 -2.19 Daqing (Hydrocracking) 0.15 7.18 1.14 -6.04 5.61 2.05 -0.81 -0.96 -2.53
For the purposes of this Report, refining margins are calculated for various complexity configurations, each optimised for processing the specific crude in a specific refining centre on a 'full cost' basis. Consequently, reported margins should be taken as an indication, or proxy, of changes in profitability for a given refining centre. No attempt is made to model or otherwise comment upon the relative economics of specific refineries running individual crude slates and producing custom product sales, nor are these calculations intended to infer the marginal values of crudes for pricing purposes.
* The China refinery margin calculation represents a model based on spot product import/export parity, and does not reflect internal pricing regulations. A full list of refining margins and gross product worth can be found in table 15 on www.oilmarketreport.org.
Sources: IEA, Purvin & Gertz Inc.

INTERNATIONAL ENERGY AGENCY - MONTHLY OIL MARKET REPORT PRICES AND REFINERY ACTIVITY
18 JANUARY 2005 39
USWC Margins
-5
0
5
10
15
20
25
Sep 04 Nov 04 Jan 05
$/bbl
ANS (Cracking) Kern (Coking)
Kern (Cracking) Oman (Cracking)
NWE Margins
-5
0
5
10
Sep 04 Nov 04 Jan 05
$/bbl
Brent (Cracking)Brent (Hydroskimming)Urals (Hydroskimming)Urals (Cracking)
USGC Margins
-6
-3
0
3
6
9
12
Sep 04 Nov 04 Jan 05
$/bbl
Maya (Coking) LLS (Cracking)Mars (Coking) Mars (CrackingBrent (Cracking)
China Margins
-8
-4
0
4
8
12
Sep 04 Nov 04 Jan 05
$/bbl
Cabinda (Hydroskimming)Daqing (Hydrocracking)Daqing (Hydroskimming)Dubai (Hydrocracking)Dubai (Hydroskimming)
Mediterranean Margins
-5
0
5
10
Sep 04 Nov 04 Jan 05
$/bbl
Urals (Cracking)Urals (Hydroskimming)Es Sider (Cracking)Es Sider (Hydroskimming)
Singapore Margins
-6
-3
0
3
6
9
12
Sep 04 Nov 04 Jan 05
$/bbl
Dubai (Hydrocracking)Dubai (Hydroskimming)Tapis (Hydrocracking)Tapis (Hydroskimming)

PRICES AND REFINERY ACTIVITY INTERNATIONAL ENERGY AGENCY - MONTHLY OIL MARKET REPORT
40 18 JANUARY 2005
Singaporean and Chinese margins deteriorated sharply towards the end of December and early January, in line with the weakening gasoline market and a resurgence in crude prices. A mild first half of winter resulted in a falling low sulphur waxy residue prices and an improved kerosene inventory position. Ample gasoline availability also contributed to improved regional product supplies. Tapis margins posted moderate gains on average in December, the only calculation in the six regions covered to have shown a monthly increase. However, Nigerian and North Sea production problems have prompted Asian buyers of light sweet crude to look at regional supplies. Refinery Throughput OECD refinery throughput rose by 1.2 mb/d in November to 39.53 mb/d from a slightly upwardly revised 38.34 mb/d in October. OECD October output was originally reported as 38.29 mb/d, but this small increase masks some large regional divergences. US throughput was revised 112 kb/d higher and Canada was 81.2 kb/d higher, more than offsetting 76.8 kb/d and 71.8 kb/d downward revisions to OECD Europe and Pacific regions respectively.
A Look at 2005 Refining Issues The 2.65 mb/d increase in global demand in 2004 vastly offset the modest 700 kb/d increase in global refining capacity last year, leading to a sharp rise in capacity utilisation and refining margins throughout the year. Further product tightness was caused by a heavy maintenance schedule throughout the year as refiners undertook investment to meet lower sulphur fuel specifications, resulting in tight distillate and light sweet crude markets.
Provisional numbers identify projects accounting for over 1 mb/d of new capacity additions in 2005. Adjustments for unidentified projects and debottlenecking are likely to be offset by the failure of some projects to materialise, leading to a further modest tightening in global refinery capacity this year.
There are also regional issues. Expansions in China and other Asian countries of nearly 750 kb/d have the potential to outpace regional demand growth by nearly 200 kb/d, while projected North American and European demand growth of 310 kb/d will marginally exceed capacity expansions of 245,000 b/d
Refinery maintenance schedules were heavy in 2004, particularly in the US and Europe, and early indications suggest that US and European programmes will be lighter than normal this year. However, estimates for many countries are uncertain at this time of year, and more detailed information will be available as the quarter progresses.
In the US, the typical maintenance schedule has been shifted slightly. Average workload on primary distillate capacity over the first quarter is expected to be around 300 kb/d per month lower than last year at around 750 kb/d. However, the work will spill into April, a month which saw minimal levels of maintenance in 2004. Overall the January-April maintenance burden is likely to be around 90 kb/d lower than last year’s 810 mb/d. However there is a lot of cracker maintenance being undertaken over the period, which is likely to lead to an increase in demand for sweet crude in coming weeks.
In Europe, the maintenance situation remains relatively opaque, but as a guide, identified projects in OECD Europe are around half of the volume detailed at this time last year. On average around 500kb/d of capacity per month is taken down over this period with the work concentrated between March, April and May. Relatively light work loads are seen in January and February.
The anticipated lower first quarter maintenance burden and recent start-up of a considerable quantity of desulphurisation units mean a replication of 2004’s high refinery margins are unlikely. However, capacity utilisation will still be high, and delays to expansion plans shutdowns or unplanned maintenance could still tighten product markets.
However, while US and European data suggest a lighter-than-normal maintenance crude distillation programme in the first half of this year, the trend towards lower sulphur products is increasing.
Around 950,000 b/d of desulphurisation and hydrotreating capacity was installed last year, and identified projects suggest a similar treatment capacity installation in 2005 of 850,000 b/d globally. This would in turn suggest that globally in 2005 maintenance activity will not be dramatically lower than last year, probably concentrated in the second/third quarter in Asia and in the autumn for the US and Europe.

INTERNATIONAL ENERGY AGENCY - MONTHLY OIL MARKET REPORT PRICES AND REFINERY ACTIVITY
18 JANUARY 2005 41
US refinery throughput moved sharply higher in November as refineries moved out of maintenance. Provisional data show this trend continuing through December with weekly numbers showing average throughput of 15.7 mb/d. Refiners have also been moving to maximise distillate output, ahead of refinery shutdowns for first quarter maintenance.
Refinery Crude Throughput and Utilisation in OECD Countries million barrels per day Change from Nov 03 Utilisation rate2
Jun 04 Jul 04 Aug 04 Sep 04 Oct 04 Nov 04 mb/d % Nov 04 Nov 03
OECD North America US3 16.24 16.14 16.14 14.98 14.95 15.58 0.13 0.8 92.3 92.2 Canada 1.71 1.88 1.88 1.90 1.80 1.75 -0.01 -0.8 88.3 89.2 Mexico 1.29 1.30 1.27 1.23 1.11 1.16 0.00 0.1 69.0 72.0
Total 19.24 19.31 19.28 18.11 17.86 18.50 0.11 0.6 90.0 90.0
OECD Europe France 1.64 1.81 1.78 1.77 1.76 1.71 -0.15 -8.0 87.7 97.7 Germany 2.25 2.39 2.36 2.29 2.40 2.23 -0.11 -4.7 88.2 92.6 Italy 1.86 1.84 1.95 1.93 1.81 1.69 -0.25 -12.8 73.2 84.4 Netherlands 1.13 1.11 1.08 0.93 0.82 0.93 0.01 0.6 76.3 76.7 Spain 1.22 1.21 1.23 1.17 1.12 1.15 0.00 -0.3 90.7 87.6 UK 1.60 1.76 1.73 1.66 1.75 1.76 0.17 10.4 96.9 89.2 Other OECD Europe 4.16 4.14 4.13 4.09 4.00 4.10 -0.07 -1.6 87.8 89.4
Total 13.87 14.26 14.25 13.84 13.65 13.59 -0.41 -2.9 86.1 89.0
OECD Pacific Japan 3.36 3.88 4.24 3.73 3.72 4.24 0.14 3.5 90.2 85.9 Korea 2.10 1.92 2.18 2.20 2.35 2.46 0.15 6.7 96.9 90.2 Other OECD Pacific 0.70 0.79 0.74 0.74 0.75 0.74 0.06 9.0 85.7 70.8
Total 6.16 6.60 7.17 6.68 6.82 7.44 0.36 5.1 91.8 85.5
OECD Total 39.26 40.17 40.70 38.63 38.34 39.53 0.07 0.2 88.9 88.8 1 Estimate 2 Based on crude throughput and current operable refining capacity 3 US50
In Europe, refinery throughput remained at a reduced level in November, reflecting the end of heavy fourth quarter 2004 maintenance. Provisional December numbers showed a recovery in runs close to September levels, but with problems at a key northern European refinery persisting until end December and a downturn in margins, a return to 14 mb/d was not expected. Japanese and South Korean refiners bolstered runs in November to take advantage of strong local markets and to bolster kerosene stocks ahead of the winter. Korean throughput of 2.46 mb/d was the highest run level for over four years.
OECD North AmericaCrude Throughput
16.0
16.5
17.0
17.5
18.0
18.5
19.0
19.5
Jan Mar May Jul Sep Nov Jan
mb/d
Range 1999-20032003 2004
OECD EuropeCrude Throughput
12.0
12.5
13.0
13.5
14.0
14.5
Jan M ar M ay Jul Sep Nov Jan
m b/d
Range 1999-20032003 2004

TABLES INTERNATIONAL ENERGY AGENCY - MONTHLY OIL MARKET REPORT
42 18 JANUARY 2005
Table 1WORLD OIL SUPPLY AND DEMAND
(million barrels per day)
2001 2002 1Q03 2Q03 3Q03 4Q03 2003 1Q04 2Q04 3Q04 4Q04 2004 1Q05 2Q05 3Q05 4Q05 2005
OECD DEMANDNorth America 24.0 24.1 24.5 24.2 24.8 24.9 24.6 25.0 24.9 25.2 25.5 25.1 25.2 25.0 25.5 25.7 25.4Europe 15.3 15.3 15.5 15.2 15.5 15.8 15.5 15.8 15.4 15.7 16.1 15.7 15.8 15.5 15.9 16.1 15.8Pacif ic 8.7 8.6 9.8 8.2 8.0 9.2 8.8 9.4 8.0 8.3 9.0 8.7 9.3 7.9 8.1 9.0 8.6
Total OECD 48.0 48.1 49.8 47.6 48.3 49.8 48.9 50.2 48.3 49.2 50.5 49.5 50.4 48.5 49.4 50.8 49.8
NON-OECD DEMANDFSU 3.7 3.5 3.8 3.2 3.4 3.9 3.6 3.5 3.7 3.7 3.8 3.7 3.8 3.7 3.8 4.0 3.8
Europe 0.7 0.7 0.8 0.7 0.7 0.7 0.7 0.8 0.7 0.7 0.7 0.7 0.8 0.7 0.7 0.7 0.7
China 4.7 5.0 5.2 5.2 5.8 5.9 5.5 6.2 6.5 6.2 6.5 6.4 6.6 6.7 6.7 6.8 6.7
Other Asia 7.6 7.9 8.0 7.9 8.0 8.5 8.1 8.5 8.6 8.4 8.8 8.5 8.7 8.8 8.6 9.0 8.8Latin America 4.9 4.8 4.5 4.7 4.8 4.9 4.7 4.7 4.9 5.0 5.0 4.9 4.8 5.0 5.1 5.1 5.0Middle East 5.2 5.4 5.5 5.3 5.7 5.7 5.6 5.8 5.8 6.0 5.9 5.9 6.1 6.1 6.2 6.2 6.1Africa 2.6 2.7 2.8 2.8 2.7 2.8 2.7 2.8 2.8 2.7 2.9 2.8 2.9 2.9 2.8 2.9 2.9
Total Non-OECD 29.3 29.9 30.6 29.7 31.1 32.3 30.9 32.3 32.9 32.7 33.6 32.9 33.7 33.9 33.9 34.8 34.1
Total Demand1 77.3 77.9 80.4 77.3 79.4 82.1 79.8 82.4 81.2 81.9 84.2 82.4 84.2 82.4 83.3 85.6 83.9
OECD SUPPLYNorth America 14.4 14.5 14.6 14.4 14.6 14.7 14.6 14.8 14.7 14.4 14.5 14.6 14.7 14.8 14.8 14.8 14.8
Europe 6.7 6.6 6.7 6.2 6.0 6.4 6.3 6.4 6.2 5.7 6.0 6.1 6.0 5.8 5.7 5.9 5.9
Pacif ic 0.8 0.8 0.7 0.7 0.7 0.6 0.7 0.6 0.6 0.6 0.6 0.6 0.6 0.5 0.5 0.5 0.5
Total OECD 21.8 21.8 22.1 21.3 21.3 21.8 21.6 21.8 21.5 20.7 21.1 21.2 21.3 21.1 21.0 21.3 21.2
NON-OECD SUPPLYFSU 8.6 9.4 9.9 10.1 10.5 10.7 10.3 10.8 11.1 11.4 11.4 11.2 11.5 11.6 11.9 12.1 11.8
Europe 0.2 0.2 0.2 0.2 0.2 0.2 0.2 0.2 0.2 0.2 0.2 0.2 0.2 0.2 0.2 0.2 0.2
China 3.3 3.4 3.4 3.4 3.4 3.4 3.4 3.4 3.5 3.5 3.5 3.5 3.6 3.5 3.5 3.5 3.5
Other Asia 2.4 2.5 2.6 2.6 2.6 2.7 2.6 2.7 2.7 2.7 2.8 2.7 2.8 2.7 2.7 2.7 2.7
Latin America 3.8 4.0 4.0 3.9 4.0 4.1 4.0 4.0 4.0 4.1 4.1 4.0 4.2 4.3 4.3 4.3 4.3
Middle East 2.1 2.1 2.0 2.0 2.0 2.0 2.0 1.9 1.9 1.9 1.9 1.9 1.9 1.8 1.8 1.8 1.8
Africa 2.8 3.0 2.9 3.0 3.1 3.3 3.1 3.3 3.4 3.5 3.6 3.4 3.6 3.7 3.8 3.8 3.7
Total Non-OECD 23.2 24.5 25.1 25.3 25.7 26.3 25.6 26.4 26.7 27.2 27.5 26.9 27.7 27.9 28.2 28.4 28.0
Processing Gains2 1.7 1.8 1.8 1.8 1.8 1.8 1.8 1.9 1.8 1.8 1.9 1.8 1.9 1.9 1.8 1.9 1.9
Total Non-OPEC 46.8 48.1 48.9 48.3 48.8 49.9 49.0 50.0 50.0 49.7 50.4 50.0 50.9 50.9 51.0 51.5 51.1
OPECCrude3 27.0 25.1 26.7 26.1 26.6 27.6 26.8 27.9 28.1 29.2 29.6 28.7NGLs 3.4 3.7 3.5 3.9 4.0 4.2 3.9 4.3 4.3 4.3 4.4 4.3 4.7 4.7 4.8 4.9 4.8Total OPEC 30.4 28.8 30.2 30.0 30.6 31.8 30.7 32.2 32.3 33.5 34.0 33.0
Total Supply4 77.2 76.9 79.1 78.3 79.4 81.7 79.6 82.2 82.4 83.2 84.4 83.0
STOCK CHANGES AND MISCELLANEOUSReported OECDIndustry 0.3 -0.4 -0.6 1.3 0.5 -0.8 0.1 -0.6 0.8 0.6Government 0.0 0.2 0.2 0.0 0.2 0.3 0.2 0.1 0.1 0.1
Total 0.3 -0.3 -0.5 1.4 0.7 -0.5 0.3 -0.5 0.9 0.6
Floating Storage/Oil in Transit -0.1 0.0 0.3 0.1 0.0 0.3 0.2 -0.2 -0.1 0.2
Miscellaneous to balance5 -0.4 -0.7 -1.1 -0.4 -0.7 -0.3 -0.6 0.5 0.4 0.4
Total Stock Ch. & Misc -0.1 -1.0 -1.2 1.0 0.0 -0.5 -0.1 -0.2 1.2 1.3 0.2 0.6
Memo items:Call on OPEC crude + Stock ch.6 27.2 26.1 27.9 25.1 26.6 28.1 26.9 28.2 26.9 27.9 29.4 28.1 28.6 26.8 27.5 29.2 28.0Total Demand ex. FSU 73.6 74.5 76.5 74.1 75.9 78.3 76.2 79.0 77.5 78.2 80.3 78.7 80.3 78.7 79.6 81.5 80.0Total demand exc. FSU (% ch)7 0.0 1.1 0.0 0.0 0.0 0.0 2.3 3.2 4.6 3.0 2.6 3.3 1.7 1.6 1.8 1.5 1.61 M easured as deliveries from refineries and primary stocks, comprises inland deliveries, international marine bunkers, refinery fuel, crude for direct burning, o il from non-conventional sources and o ther sources o f supply2 Net vo lumetric gains and losses in the refining process (excludes net gain/loss in former USSR, China and non-OECD Europe) and marine transportation losses3 Upgraded Venezuelan Orinoco extra-heavy production is classified as non-conventional crude.4 Comprises crude o il, condensates, NGLs, o il from non-conventional sources and other sources o f supply5 Includes changes in non-reported stocks in OECD and non-OECD areas6 Equals the arithmetic difference between to tal demand minus to tal non-OPEC supply minus OPEC NGLs7 Year on year % growth in global o il demand excluding FSU

INTERNATIONAL ENERGY AGENCY - MONTHLY OIL MARKET REPORT TABLES
18 JANUARY 2005 43
Table 1AWORLD OIL SUPPLY AND DEMAND: CHANGES FROM LAST MONTH'S TABLE 1
(million barrels per day)
2001 2002 1Q03 2Q03 3Q03 4Q03 2003 1Q04 2Q04 3Q04 4Q04 2004 1Q05 2Q05 3Q05 4Q05 2005
OECD DEMANDNorth America - - - - - - - - - - 0.2 0.1 - - 0.1 0.2 0.1Europe - - 0.1 - - - - - - - 0.1 - - - - - -Pacific - - - - - - - - - - -0.1 - - - - -0.1 -
Total OECD - - 0.1 - - - - - - - 0.2 0.1 - 0.1 0.1 0.2 0.1
NON-OECD DEMANDFSU - - - - - - - - - - -0.1 - - - - - -Europe - - - - - - - - - - - - - - - - -China - - - - - - - - - - 0.1 - 0.1 0.1 - - -Other Asia - - - - - - - - - - - - - - - - -Latin America - - - - - - - - - - - - - - - - -Middle East - - - - - - - - - - - - - - - - -Africa - - - - - - - - - - - - - - - - -
Total Non-OECD - - - - - - - - - - - - 0.1 0.1 - -0.1 -
Total Demand - - 0.1 0.1 - - - - - - 0.2 0.1 0.2 0.2 0.1 0.1 0.1
OECD SUPPLYNorth America - - - - - - - - - - -0.1 - -0.2 -0.1 - - -0.1Europe - - - - - - - - - - -0.1 - -0.1 - - - -Pacific - - - - - - - - - - - - - - - - -
Total OECD - - - - - - - - - - -0.2 -0.1 -0.3 -0.1 - - -0.1
NON-OECD SUPPLYFSU - - - - - - - - - - - - - - - - -Europe - - - - - - - - - - - - - - - - -China - - - - - - - - - - - - - - - - -Other Asia - - - - - - - - - - - - - - - - -Latin America - - - - - - - - - - -0.1 - - - - -0.1 -Middle East - - - - - - - - - - - - - - - - -Africa - - - - - - - - - - - - - - - - -
Total Non-OECD - - - - - - - - - - - - - - - -0.1 -0.1
Processing Gains - - - - - - - - - - - - - - - - -
Total Non-OPEC - - - - - - - - - - -0.2 - -0.3 -0.1 -0.1 -0.1 -0.2
OPECCrude - - - - - - - - - -NGLs - - - - - - - - - - - - - - - - -
Total OPEC - - - - - - - - - -
Total Supply - - - - - - - - - -
STOCK CHANGES AND MISCELLANEOUSREPORTED OECDIndustry - - - - - - - - -0.1 0.1Government - - - - - - - - - -
Total - - - - - - - - -0.1 0.1
Floating Storage/Oil in Transit - - - - - - - - - -Miscellaneous to balance - - -0.1 - - - - - 0.1 -0.1
Total Stock Ch. & Misc - - -0.1 - - - - - - -0.1
Memo items:Call on OPEC crude + Stock ch. - - 0.1 - - - - - - 0.1 0.4 0.1 0.5 0.3 0.1 0.2 0.3Total Demand ex. FSU - - 0.1 0.1 - - 0.1 - - - 0.3 0.1 0.2 0.1 0.1 0.1 0.1When submitting their monthly oil statistics, OECD Member countries periodically update data for prior periods. Similar updates to non-OECD data can occur.
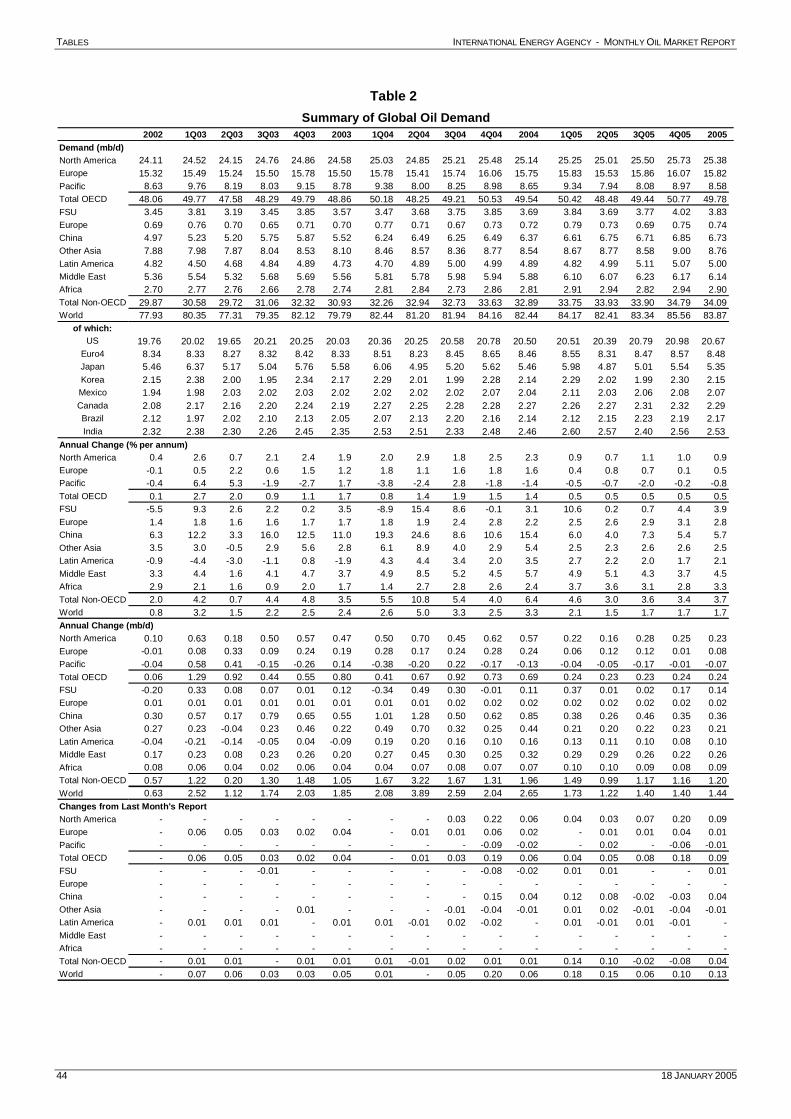
TABLES INTERNATIONAL ENERGY AGENCY - MONTHLY OIL MARKET REPORT
44 18 JANUARY 2005
Table 2
Summary of Global Oil Demand2002 1Q03 2Q03 3Q03 4Q03 2003 1Q04 2Q04 3Q04 4Q04 2004 1Q05 2Q05 3Q05 4Q05 2005
Demand (mb/d)North America 24.11 24.52 24.15 24.76 24.86 24.58 25.03 24.85 25.21 25.48 25.14 25.25 25.01 25.50 25.73 25.38Europe 15.32 15.49 15.24 15.50 15.78 15.50 15.78 15.41 15.74 16.06 15.75 15.83 15.53 15.86 16.07 15.82Pacific 8.63 9.76 8.19 8.03 9.15 8.78 9.38 8.00 8.25 8.98 8.65 9.34 7.94 8.08 8.97 8.58Total OECD 48.06 49.77 47.58 48.29 49.79 48.86 50.18 48.25 49.21 50.53 49.54 50.42 48.48 49.44 50.77 49.78FSU 3.45 3.81 3.19 3.45 3.85 3.57 3.47 3.68 3.75 3.85 3.69 3.84 3.69 3.77 4.02 3.83Europe 0.69 0.76 0.70 0.65 0.71 0.70 0.77 0.71 0.67 0.73 0.72 0.79 0.73 0.69 0.75 0.74China 4.97 5.23 5.20 5.75 5.87 5.52 6.24 6.49 6.25 6.49 6.37 6.61 6.75 6.71 6.85 6.73Other Asia 7.88 7.98 7.87 8.04 8.53 8.10 8.46 8.57 8.36 8.77 8.54 8.67 8.77 8.58 9.00 8.76Latin America 4.82 4.50 4.68 4.84 4.89 4.73 4.70 4.89 5.00 4.99 4.89 4.82 4.99 5.11 5.07 5.00Middle East 5.36 5.54 5.32 5.68 5.69 5.56 5.81 5.78 5.98 5.94 5.88 6.10 6.07 6.23 6.17 6.14Africa 2.70 2.77 2.76 2.66 2.78 2.74 2.81 2.84 2.73 2.86 2.81 2.91 2.94 2.82 2.94 2.90Total Non-OECD 29.87 30.58 29.72 31.06 32.32 30.93 32.26 32.94 32.73 33.63 32.89 33.75 33.93 33.90 34.79 34.09World 77.93 80.35 77.31 79.35 82.12 79.79 82.44 81.20 81.94 84.16 82.44 84.17 82.41 83.34 85.56 83.87
of which:US 19.76 20.02 19.65 20.21 20.25 20.03 20.36 20.25 20.58 20.78 20.50 20.51 20.39 20.79 20.98 20.67
Euro4 8.34 8.33 8.27 8.32 8.42 8.33 8.51 8.23 8.45 8.65 8.46 8.55 8.31 8.47 8.57 8.48Japan 5.46 6.37 5.17 5.04 5.76 5.58 6.06 4.95 5.20 5.62 5.46 5.98 4.87 5.01 5.54 5.35Korea 2.15 2.38 2.00 1.95 2.34 2.17 2.29 2.01 1.99 2.28 2.14 2.29 2.02 1.99 2.30 2.15Mexico 1.94 1.98 2.03 2.02 2.03 2.02 2.02 2.02 2.02 2.07 2.04 2.11 2.03 2.06 2.08 2.07Canada 2.08 2.17 2.16 2.20 2.24 2.19 2.27 2.25 2.28 2.28 2.27 2.26 2.27 2.31 2.32 2.29Brazil 2.12 1.97 2.02 2.10 2.13 2.05 2.07 2.13 2.20 2.16 2.14 2.12 2.15 2.23 2.19 2.17India 2.32 2.38 2.30 2.26 2.45 2.35 2.53 2.51 2.33 2.48 2.46 2.60 2.57 2.40 2.56 2.53
Annual Change (% per annum)North America 0.4 2.6 0.7 2.1 2.4 1.9 2.0 2.9 1.8 2.5 2.3 0.9 0.7 1.1 1.0 0.9Europe -0.1 0.5 2.2 0.6 1.5 1.2 1.8 1.1 1.6 1.8 1.6 0.4 0.8 0.7 0.1 0.5Pacific -0.4 6.4 5.3 -1.9 -2.7 1.7 -3.8 -2.4 2.8 -1.8 -1.4 -0.5 -0.7 -2.0 -0.2 -0.8Total OECD 0.1 2.7 2.0 0.9 1.1 1.7 0.8 1.4 1.9 1.5 1.4 0.5 0.5 0.5 0.5 0.5FSU -5.5 9.3 2.6 2.2 0.2 3.5 -8.9 15.4 8.6 -0.1 3.1 10.6 0.2 0.7 4.4 3.9Europe 1.4 1.8 1.6 1.6 1.7 1.7 1.8 1.9 2.4 2.8 2.2 2.5 2.6 2.9 3.1 2.8China 6.3 12.2 3.3 16.0 12.5 11.0 19.3 24.6 8.6 10.6 15.4 6.0 4.0 7.3 5.4 5.7Other Asia 3.5 3.0 -0.5 2.9 5.6 2.8 6.1 8.9 4.0 2.9 5.4 2.5 2.3 2.6 2.6 2.5Latin America -0.9 -4.4 -3.0 -1.1 0.8 -1.9 4.3 4.4 3.4 2.0 3.5 2.7 2.2 2.0 1.7 2.1Middle East 3.3 4.4 1.6 4.1 4.7 3.7 4.9 8.5 5.2 4.5 5.7 4.9 5.1 4.3 3.7 4.5Africa 2.9 2.1 1.6 0.9 2.0 1.7 1.4 2.7 2.8 2.6 2.4 3.7 3.6 3.1 2.8 3.3Total Non-OECD 2.0 4.2 0.7 4.4 4.8 3.5 5.5 10.8 5.4 4.0 6.4 4.6 3.0 3.6 3.4 3.7World 0.8 3.2 1.5 2.2 2.5 2.4 2.6 5.0 3.3 2.5 3.3 2.1 1.5 1.7 1.7 1.7Annual Change (mb/d)North America 0.10 0.63 0.18 0.50 0.57 0.47 0.50 0.70 0.45 0.62 0.57 0.22 0.16 0.28 0.25 0.23Europe -0.01 0.08 0.33 0.09 0.24 0.19 0.28 0.17 0.24 0.28 0.24 0.06 0.12 0.12 0.01 0.08Pacific -0.04 0.58 0.41 -0.15 -0.26 0.14 -0.38 -0.20 0.22 -0.17 -0.13 -0.04 -0.05 -0.17 -0.01 -0.07Total OECD 0.06 1.29 0.92 0.44 0.55 0.80 0.41 0.67 0.92 0.73 0.69 0.24 0.23 0.23 0.24 0.24FSU -0.20 0.33 0.08 0.07 0.01 0.12 -0.34 0.49 0.30 -0.01 0.11 0.37 0.01 0.02 0.17 0.14Europe 0.01 0.01 0.01 0.01 0.01 0.01 0.01 0.01 0.02 0.02 0.02 0.02 0.02 0.02 0.02 0.02China 0.30 0.57 0.17 0.79 0.65 0.55 1.01 1.28 0.50 0.62 0.85 0.38 0.26 0.46 0.35 0.36Other Asia 0.27 0.23 -0.04 0.23 0.46 0.22 0.49 0.70 0.32 0.25 0.44 0.21 0.20 0.22 0.23 0.21Latin America -0.04 -0.21 -0.14 -0.05 0.04 -0.09 0.19 0.20 0.16 0.10 0.16 0.13 0.11 0.10 0.08 0.10Middle East 0.17 0.23 0.08 0.23 0.26 0.20 0.27 0.45 0.30 0.25 0.32 0.29 0.29 0.26 0.22 0.26Africa 0.08 0.06 0.04 0.02 0.06 0.04 0.04 0.07 0.08 0.07 0.07 0.10 0.10 0.09 0.08 0.09Total Non-OECD 0.57 1.22 0.20 1.30 1.48 1.05 1.67 3.22 1.67 1.31 1.96 1.49 0.99 1.17 1.16 1.20World 0.63 2.52 1.12 1.74 2.03 1.85 2.08 3.89 2.59 2.04 2.65 1.73 1.22 1.40 1.40 1.44Changes from Last Month's ReportNorth America - - - - - - - - 0.03 0.22 0.06 0.04 0.03 0.07 0.20 0.09Europe - 0.06 0.05 0.03 0.02 0.04 - 0.01 0.01 0.06 0.02 - 0.01 0.01 0.04 0.01Pacific - - - - - - - - - -0.09 -0.02 - 0.02 - -0.06 -0.01Total OECD - 0.06 0.05 0.03 0.02 0.04 - 0.01 0.03 0.19 0.06 0.04 0.05 0.08 0.18 0.09FSU - - - -0.01 - - - - - -0.08 -0.02 0.01 0.01 - - 0.01Europe - - - - - - - - - - - - - - - -China - - - - - - - - - 0.15 0.04 0.12 0.08 -0.02 -0.03 0.04Other Asia - - - - 0.01 - - - -0.01 -0.04 -0.01 0.01 0.02 -0.01 -0.04 -0.01Latin America - 0.01 0.01 0.01 - 0.01 0.01 -0.01 0.02 -0.02 - 0.01 -0.01 0.01 -0.01 -Middle East - - - - - - - - - - - - - - - -Africa - - - - - - - - - - - - - - - -Total Non-OECD - 0.01 0.01 - 0.01 0.01 0.01 -0.01 0.02 0.01 0.01 0.14 0.10 -0.02 -0.08 0.04World - 0.07 0.06 0.03 0.03 0.05 0.01 - 0.05 0.20 0.06 0.18 0.15 0.06 0.10 0.13

INTERNATIONAL ENERGY AGENCY - MONTHLY OIL MARKET REPORT TABLES
18 JANUARY 2005 45
Table 3WORLD OIL PRODUCTION
(million barrels per day)
2003 2004 2005 3Q04 4Q04 1Q05 2Q05 3Q05 Oct 04 Nov 04 Dec 04
OPECCrude Oil Saudi Arabia 8.48 8.75 9.12 9.23 9.30 9.25 9.15 Iran 3.78 3.93 3.89 3.97 3.87 4.05 4.00 Iraq 1.33 1.99 1.92 1.98 2.22 1.79 1.95 UAE 2.29 2.35 2.44 2.45 2.43 2.42 2.52 Kuwait 1.87 2.05 2.07 2.14 2.15 2.14 2.14 Neutral Zone 0.60 0.60 0.61 0.60 0.60 0.61 0.60 Qatar 0.72 0.78 0.80 0.79 0.80 0.80 0.78 Nigeria 2.15 2.33 2.35 2.33 2.37 2.35 2.27 Libya 1.42 1.55 1.59 1.61 1.61 1.61 1.61 Algeria 1.11 1.21 1.24 1.28 1.27 1.29 1.29 Venezuela 2.01 2.21 2.21 2.24 2.25 2.25 2.23 Indonesia 1.01 0.97 0.96 0.97 0.97 0.97 0.98
Total Crude Oil 26.77 28.70 29.19 29.62 29.83 29.51 29.51 Total NGLs1 3.90 4.32 4.77 4.32 4.38 4.67 4.70 4.84 4.31 4.35 4.47
Total OPEC 30.67 33.02 33.51 33.99 34.14 33.85 33.98
NON-OPEC2
OECDNorth America 14.61 14.60 14.78 14.39 14.51 14.75 14.78 14.77 14.33 14.59 14.62 United States 7.82 7.67 7.81 7.50 7.62 7.83 7.83 7.81 7.40 7.71 7.75 Mexico 3.79 3.84 3.87 3.82 3.85 3.87 3.87 3.85 3.89 3.80 3.87 Canada 3.00 3.08 3.10 3.07 3.04 3.05 3.09 3.12 3.04 3.07 3.01 Europe 6.34 6.07 5.86 5.71 5.99 6.00 5.83 5.68 5.99 6.08 5.90 UK 2.28 2.05 1.88 1.89 1.99 1.99 1.86 1.82 1.91 2.03 2.04 Norway 3.26 3.17 3.13 2.97 3.14 3.16 3.13 3.01 3.21 3.19 3.01 Others 0.80 0.85 0.85 0.85 0.86 0.85 0.85 0.85 0.86 0.85 0.86 Pacific 0.65 0.57 0.53 0.59 0.55 0.56 0.53 0.52 0.52 0.57 0.57 Australia 0.61 0.53 0.49 0.54 0.51 0.52 0.48 0.47 0.47 0.53 0.53 Others 0.05 0.04 0.04 0.04 0.04 0.04 0.04 0.04 0.04 0.04 0.04
Total OECD 21.59 21.25 21.17 20.68 21.05 21.30 21.14 20.97 20.83 21.24 21.09
NON-OECD
Former USSR 10.31 11.18 11.78 11.35 11.45 11.48 11.64 11.89 11.45 11.49 11.39 Russia 8.49 9.23 9.66 9.40 9.41 9.45 9.58 9.74 9.43 9.43 9.37 Others 1.82 1.95 2.12 1.95 2.04 2.03 2.06 2.14 2.02 2.07 2.03
Asia 6.03 6.24 6.24 6.25 6.36 6.33 6.26 6.20 6.28 6.40 6.39 China 3.41 3.49 3.53 3.54 3.54 3.57 3.54 3.52 3.47 3.57 3.57 Malaysia 0.83 0.86 0.82 0.86 0.87 0.86 0.83 0.81 0.89 0.88 0.86 India 0.79 0.80 0.78 0.77 0.81 0.80 0.79 0.78 0.81 0.82 0.81 Others 1.01 1.09 1.10 1.09 1.14 1.11 1.10 1.09 1.12 1.14 1.15
Europe 0.17 0.17 0.16 0.17 0.17 0.16 0.16 0.16 0.17 0.17 0.17
Latin America 4.00 4.03 4.30 4.06 4.07 4.22 4.30 4.33 4.09 3.99 4.11 Brazil 1.77 1.77 2.00 1.80 1.79 1.94 1.99 2.03 1.79 1.74 1.83 Argentina 0.83 0.77 0.73 0.78 0.76 0.75 0.74 0.73 0.78 0.73 0.77 Colombia 0.55 0.54 0.52 0.55 0.54 0.53 0.53 0.52 0.54 0.54 0.54 Ecuador 0.43 0.53 0.57 0.54 0.54 0.55 0.57 0.58 0.54 0.54 0.55 Others 0.42 0.42 0.47 0.41 0.44 0.45 0.48 0.48 0.44 0.44 0.43
Middle East3 1.99 1.89 1.84 1.88 1.86 1.85 1.84 1.84 1.87 1.86 1.86 Oman 0.82 0.76 0.74 0.76 0.75 0.75 0.74 0.74 0.75 0.75 0.75 Syria 0.53 0.51 0.48 0.50 0.50 0.49 0.48 0.47 0.50 0.50 0.49 Yemen 0.44 0.42 0.43 0.42 0.42 0.42 0.42 0.43 0.42 0.42 0.42
Africa 3.07 3.43 3.72 3.48 3.56 3.63 3.70 3.77 3.57 3.58 3.54 Egypt 0.75 0.71 0.71 0.71 0.70 0.71 0.72 0.72 0.71 0.70 0.68 Angola 0.88 0.99 1.15 0.99 1.10 1.14 1.16 1.16 1.10 1.11 1.10 Gabon 0.24 0.24 0.24 0.23 0.23 0.23 0.23 0.24 0.23 0.23 0.23 Others 1.20 1.50 1.62 1.56 1.54 1.55 1.58 1.66 1.54 1.54 1.54
Total Non-OECD 25.58 26.94 28.03 27.20 27.46 27.67 27.89 28.18 27.43 27.49 27.46
Processing Gains4 1.80 1.83 1.86 1.81 1.85 1.88 1.85 1.84 1.85 1.85 1.85
TOTAL NON-OPEC 48.97 50.02 51.06 49.69 50.37 50.85 50.89 51.00 50.12 50.58 50.41
TOTAL SUPPLY 79.64 83.03 83.20 84.36 84.25 84.43 84.39 1 Includes condensates reported by OPEC countries, oil from non-conventional sources, e.g. Orimulsion Orinoco extra-heavy oil, and non-oil inputs to Saudi Arabian MTBE2 Comprises crude oil, condensates, NGLs and oil from non-conventional sources3 Includes small amounts of production from Israel, Jordan and Bahrain4 Net volumetric gains and losses in refining (excludes net gain/loss in FSU, China and non-OECD Europe) and marine transportation losses

TABLES INTERNATIONAL ENERGY AGENCY - MONTHLY OIL MARKET REPORT
46 18 JANUARY 2005
OECD INDUSTRY STOCKS1 AND QUARTERLY STOCK CHANGES
RECENT MONTHLY STOCKS2 PRIOR YEARS' STOCKS2STOCK CHANGES
in Million Barrels in Million Barrels in mb/d
Jul2004 Aug2004 Sep2004 Oct2004 Nov2004* Nov2001 Nov2002 Nov2003 4Q2003 1Q2004 2Q2004 3Q2004
North AmericaCrude 409.4 393.8 393.4 411.3 417.0 422.6 399.8 400.3 -0.16 0.32 0.08 -0.27 Motor Gasoline 242.7 240.3 237.5 235.5 240.6 243.7 236.3 232.7 0.06 -0.02 0.07 -0.01 Middle Distillate 192.7 205.3 199.7 196.4 200.3 213.7 200.1 209.4 0.04 -0.44 0.14 0.19 Residual Fuel Oil 42.5 44.6 41.4 45.0 50.7 48.1 44.9 44.0 0.05 0.02 -0.03 -0.04 Total Products3 657.1 673.6 667.7 661.8 668.6 684.7 657.3 656.3 -0.11 -0.52 0.41 0.36
Total4 1219.9 1228.7 1226.4 1234.5 1247.1 1268.3 1213.2 1210.1 -0.52 -0.22 0.57 0.32
EuropeCrude 328.3 328.6 334.9 335.3 338.6 313.7 314.3 329.7 0.01 0.26 -0.03 -0.07 Motor Gasoline 110.1 114.8 112.2 115.0 115.5 116.9 113.7 114.7 0.07 0.00 -0.06 0.02 Middle Distillate 241.8 256.2 246.8 247.7 246.3 218.6 242.3 239.3 -0.14 -0.24 0.18 0.15 Residual Fuel Oil 77.8 77.4 76.6 75.3 74.4 75.0 81.1 76.9 0.08 -0.04 0.01 0.00 Total Products3 532.7 552.7 538.0 541.6 539.2 525.9 536.9 536.7 0.01 -0.33 0.14 0.22
Total4 930.3 947.7 943.3 947.7 947.9 906.4 915.7 939.3 -0.01 -0.01 0.06 0.14
PacificCrude 182.7 167.5 168.7 177.1 190.2 176.9 159.7 160.6 -0.04 -0.06 0.02 -0.09 Motor Gasoline 23.6 23.3 23.9 23.3 24.6 24.6 24.4 23.1 -0.02 0.03 -0.01 -0.01 Middle Distillate 62.6 69.6 74.8 75.0 84.2 90.4 73.1 82.0 -0.10 -0.21 0.06 0.16 Residual Fuel Oil 22.3 23.3 21.3 21.1 23.7 24.6 22.2 22.9 0.00 -0.03 0.03 -0.01 Total Products3
174.4 182.2 186.2 188.8 202.5 216.0 189.3 197.0 -0.22 -0.28 0.15 0.15
Total4 429.1 421.6 429.6 438.0 467.9 477.4 422.7 431.9 -0.26 -0.38 0.21 0.11
Total OECDCrude 920.5 890.0 897.0 923.6 945.9 913.2 873.9 890.7 -0.20 0.52 0.07 -0.42 Motor Gasoline 376.4 378.4 373.6 373.7 380.8 385.1 374.5 370.5 0.11 0.02 0.00 0.01 Middle Distillate 497.1 531.1 521.2 519.1 530.8 522.7 515.5 530.7 -0.21 -0.89 0.37 0.50 Residual Fuel Oil 142.6 145.3 139.3 141.3 148.8 147.8 148.2 143.8 0.13 -0.05 0.02 -0.05 Total Products3 1364.2 1408.5 1391.9 1392.2 1410.2 1426.6 1383.5 1389.9 -0.33 -1.14 0.70 0.73
Total4 2579.3 2598.0 2599.3 2620.2 2662.8 2652.1 2551.6 2581.3 -0.79 -0.62 0.84 0.57
OECD GOVERNMENT-CONTROLLED STOCKS5,6 AND QUARTERLY STOCK CHANGES
RECENT MONTHLY STOCKS2 PRIOR YEARS' STOCKS2STOCK CHANGES
in Million Barrels in Million Barrels in mb/d
Jul2004 Aug2004 Sep2004 Oct2004 Nov2004* Nov2001 Nov2002 Nov2003 4Q2003 1Q2004 2Q2004 3Q2004
North AmericaCrude 665.7 669.0 670.3 670.3 672.5 547.3 595.9 633.6 0.15 0.15 0.11 0.09 Products7 2.0 2.0 2.0 2.0 2.0 2.0 2.0 2.0 0.00 0.00 0.00 0.00
EuropeCrude 157.9 158.0 157.8 158.8 158.8 142.4 155.7 154.0 0.07 0.01 0.00 0.00 Products 205.6 205.9 205.4 202.9 202.9 206.5 192.6 208.9 0.04 -0.03 -0.05 0.00
PacificCrude 386.7 386.7 384.9 382.5 382.5 372.6 379.6 382.8 0.02 0.02 0.00 -0.02 Products 11.0 11.2 11.2 11.2 11.2 7.3 8.9 10.7 0.01 0.00 0.00 0.00
Total OECDCrude 1210.3 1213.6 1213.0 1211.6 1213.8 1062.3 1131.2 1170.3 0.24 0.18 0.11 0.06 Products 218.6 219.1 218.6 216.0 216.0 215.8 203.5 221.6 0.05 -0.03 -0.05 0.01
Total4 1429.9 1433.7 1432.6 1428.6 1430.8 1279.1 1335.7 1392.9 0.29 0.15 0.06 0.07
* estimated1 Stocks are primary national territory stocks on land (excluding utility stocks and including pipeline and entrepot stocks where known) and include stocks held by industry to meet IEA, EU and national emergency reserve commitments and are subject to government control in emergencies. 2 Closing stock levels.3 Total products includes gasoline, middle distillates, fuel oil and other products. 4 Total includes NGLs, refinery feedstocks, additives/oxygenates and other hydrocarbons. 5 Includes government-owned stocks and stock holding organisation stocks held for emergency purposes.
Table 4

INTERNATIONAL ENERGY AGENCY - MONTHLY OIL MARKET REPORT TABLES
18 JANUARY 2005 47
Table 5TOTAL STOCKS ON LAND IN OECD COUNTRIES1
('millions of barrels' and 'days')
3
Stock Days Fwd2 Stock Days Fwd Stock Days Fwd Stock Days Fwd Stock Days FwdLevel Demand Level Demand Level Demand Level Demand Level Demand
North AmericaCanada 176.6 79 174.6 77 170.4 76 168.8 74 189.9 -Mexico 41.4 20 39.0 19 38.9 19 39.5 20 41.4 -United States4 1600.0 79 1570.3 77 1568.2 77 1630.9 79 1645.3 -
Total5 1840.1 74 1806.1 72 1799.6 72 1861.3 74 1898.7 75
PacificAustralia 36.0 40 32.4 37 33.8 39 34.9 39 34.3 -Japan 653.6 114 636.3 105 614.4 124 622.0 120 632.0 -Korea 154.5 66 154.5 67 142.9 71 152.9 77 152.1 -New Zealand 8.5 58 7.9 49 7.5 48 7.7 50 7.3 -Total 852.6 93 831.1 89 798.5 100 817.4 99 825.7 92
Europe6
Austria 20.3 69 20.9 80 23.2 80 23.0 78 21.0 -Belgium 29.1 45 27.7 42 24.6 42 24.7 42 24.8 -Czech Republic 13.4 69 16.4 95 15.6 74 15.9 70 16.9 -Denmark 16.3 86 16.8 87 15.9 88 15.8 90 19.4 -Finland 23.2 101 26.5 120 27.8 133 23.4 108 24.0 -France 179.2 85 185.3 87 176.4 90 183.5 92 188.5 -Germany 266.4 100 272.6 103 269.8 106 266.9 98 264.3 -Greece 30.9 66 27.5 57 29.4 77 30.8 78 34.1 -Hungary 18.3 122 16.8 143 19.5 153 20.1 153 18.7 -Ireland 11.9 66 12.0 63 11.5 69 10.7 63 11.1 -Italy 140.7 74 135.2 72 135.6 73 134.6 71 138.7 -Luxembourg 0.8 16 1.0 17 0.8 13 1.0 16 0.9 -Netherlands 111.1 116 100.1 105 108.2 111 102.3 108 110.2 -Norway 23.1 93 27.2 99 28.5 116 30.0 118 23.3 -Poland 26.9 53 28.7 64 29.7 62 30.1 59 31.1 -Portugal 25.6 79 25.3 81 24.4 74 26.2 76 25.0 -Slovak Republic 4.8 62 5.4 79 5.8 82 6.5 87 5.6 -Spain 121.4 77 122.4 78 123.5 79 127.3 82 126.8 -Sweden 34.1 99 35.9 101 31.8 89 31.1 91 31.5 -Switzerland 37.4 141 36.1 138 35.4 149 37.5 144 37.8 -Turkey 54.3 83 54.9 84 54.9 79 54.8 77 55.2 -United Kingdom 98.0 56 101.9 55 100.7 54 97.6 53 98.7 -
Total 1287.4 82 1296.5 82 1292.9 84 1293.9 82 1307.5 81Total OECD 3980.0 80 3933.7 78 3890.9 81 3972.6 81 4031.9 80
DAYS OF IEA Net Imports7 - 116 - 112 - 111 - 113 - 1141 Total Stocks are industry and government-controlled stocks (see breakdown in table below). Stocks are primary national territory stocks on land (excluding utility stocks and including pipeline and entrepot stocks where known) they include stocks held by industry to meet IEA, EU and national emergency reserves commitments and are subject to government control in emergencies.2 Note that days of forward demand represent the stock level divided by the forward quarter average daily demand and is very different from the days of net imports used for the calculation of IEA Emergency Reserves.3 End September 2004 forward demand figures are IEA Secretariat forecasts. 4 US figures exclude US territories.5 Total includes US territories.6 Data not available for Iceland.7 Reflects stock levels and prior calendar year's net imports adjusted according to IEA emergency reserve definitions. Net exporting IEA countries are excluded.
TOTAL OECD STOCKS
CLOSING STOCKS Total Industry Total Industry
3Q2001 3930 1266 2664 81 26 554Q2001 3918 1285 2632 81 27 541Q2002 3912 1304 2609 84 28 562Q2002 3969 1316 2654 83 27 553Q2002 3899 1321 2579 79 27 524Q2002 3824 1344 2480 77 27 501Q2003 3789 1359 2430 80 29 512Q2003 3913 1362 2551 81 28 533Q2003 3980 1380 2600 80 28 524Q2003 3934 1407 2527 78 28 501Q2004 3891 1421 2470 81 29 512Q2004 3973 1426 2547 81 29 523Q2004 4032 1433 2599 80 28 511 Includes government-owned stocks and stock holding organisation stocks held for emergency purposes.2 Days of forward demand calculated using actual demand except in 2Q2004 (when latest forecasts are used).
End September 2004End December 2003 End September 2003 End March 2004 End June 2004
Millions of Barrels
Government1
controlledGovernment1
controlledDays of Fwd. Demand 2

TABLES INTERNATIONAL ENERGY AGENCY - MONTHLY OIL MARKET REPORT
48 18 JANUARY 2005
Table 6IEA Member Country Destinations of Selected Crude Streams1
(million barrels per day)
Year Earlier2001 2002 2003 4Q03 1Q04 2Q04 3Q04 Aug 04 Sep 04 Oct 04 Oct 03 change
Saudi Light & Extra LightNorth America 0.69 0.70 0.64 0.66 0.55 0.56 0.56 0.64 0.53 0.58 0.82 -0.24Europe 0.92 0.92 1.00 0.95 0.96 1.05 1.04 0.93 1.07 1.05 1.04 0.01Pacific 1.22 1.22 1.18 1.12 1.14 1.13 1.23 1.16 1.28 1.34 0.99 0.35
Saudi MediumNorth America 0.73 0.86 0.83 0.71 0.72 0.73 0.86 0.93 0.80 0.78 0.75 0.04Europe 0.15 0.11 0.11 0.07 0.08 0.07 0.11 0.11 0.16 0.12 0.09 0.03Pacific 0.17 0.16 0.24 0.30 0.31 0.20 0.18 0.20 0.19 0.23 0.28 -0.05
Saudi HeavyNorth America 0.21 0.20 0.30 0.19 0.19 0.14 0.30 0.33 0.29 0.31 0.17 0.14Europe 0.14 0.09 0.19 0.16 0.16 0.26 0.31 0.32 0.28 0.23 0.19 0.05Pacific 0.15 0.12 0.16 0.15 0.13 0.13 0.16 0.13 0.18 0.15 0.12 0.03
Iraqi Basrah Light2
North America 0.65 0.35 0.44 0.82 0.75 0.74 0.68 0.86 0.72 0.65 1.01 -0.36Europe 0.15 0.08 0.09 0.15 0.22 0.27 0.21 0.20 0.19 0.10 0.09 0.01Pacific 0.01 0.02 0.03 0.11 0.14 0.08 0.12 0.14 0.10 0.21 .. ..
Iraqi KirkukNorth America 0.09 0.14 0.06 .. .. 0.04 0.01 .. 0.03 0.03 .. ..Europe 0.31 0.32 0.12 .. 0.04 0.07 0.03 0.03 0.07 0.09 .. ..Pacific 0.01 0.00 .. .. .. .. .. .. .. .. .. ..
Iranian LightNorth America .. .. .. .. .. .. .. .. .. .. .. ..Europe 0.16 0.17 0.19 0.18 0.20 0.23 0.23 0.24 0.25 0.36 0.19 0.17Pacific 0.13 0.12 0.17 0.17 0.18 0.13 0.16 0.13 0.17 0.14 0.16 -0.02
Iranian Heavy3
North America .. .. .. .. .. .. .. .. .. .. .. ..Europe 0.53 0.44 0.59 0.55 0.50 0.61 0.65 0.69 0.67 0.56 0.58 -0.02Pacific 0.63 0.54 0.69 0.74 0.73 0.65 0.58 0.60 0.57 0.65 0.75 -0.10
Venezuelan Light & MediumNorth America 0.61 0.68 0.69 0.84 0.63 0.78 0.64 0.62 0.66 0.53 0.91 -0.38Europe 0.07 0.08 0.02 0.01 .. 0.02 0.02 0.01 0.01 0.02 0.02 0.00Pacific 0.00 0.00 0.00 0.00 .. .. .. .. .. .. 0.00 ..
Venezuelan 22 API and heavierNorth America 0.65 0.55 0.60 0.73 0.81 0.91 0.86 0.90 0.75 0.88 0.67 0.21Europe 0.07 0.05 0.06 0.09 0.05 0.07 0.06 0.06 0.04 0.05 0.07 -0.02Pacific .. .. .. .. .. .. .. .. .. .. .. ..
Mexican MayaNorth America 0.77 0.92 1.32 1.37 1.31 1.43 1.34 1.38 1.33 1.45 1.29 0.16Europe 0.14 0.17 0.16 0.13 0.14 0.19 0.20 0.18 0.21 0.15 0.14 0.01Pacific 0.01 0.00 0.00 .. 0.01 .. .. .. .. .. .. ..
Mexican IsthmusNorth America 0.04 0.01 0.00 .. .. .. .. .. .. .. .. ..Europe 0.03 0.01 0.00 0.00 .. .. .. .. .. 0.03 0.00 0.03Pacific 0.01 0.01 0.00 .. 0.01 .. .. .. .. .. .. ..
Russian UralsNorth America .. 0.03 0.14 .. 0.01 0.14 0.12 0.06 0.02 0.20 .. ..Europe 1.10 1.32 1.62 1.75 2.14 1.98 1.78 1.93 1.55 1.49 1.46 0.04Pacific 0.01 0.01 0.00 0.01 0.00 0.01 0.01 .. .. .. .. ..
Nigerian Light4
North America 0.50 0.39 0.63 0.67 0.80 0.90 0.78 0.78 0.79 0.68 0.73 -0.05Europe 0.38 0.32 0.41 0.38 0.32 0.22 0.30 0.26 0.29 0.32 0.38 -0.07Pacific 0.02 0.06 0.08 0.09 0.12 0.10 0.09 0.10 0.08 0.06 .. ..
Nigerian MediumNorth America 0.31 0.16 0.17 0.21 0.26 0.21 0.22 0.24 0.16 0.24 0.22 0.02Europe 0.10 0.06 0.06 0.09 0.03 0.04 0.05 0.03 0.09 0.01 0.10 -0.10Pacific 0.00 0.01 0.01 .. 0.02 .. .. .. .. .. .. ..
1 Data based on monthly submissions from IEA countries to the crude oil import register (in '000 bbl), subject to availability. May differ from Table 8 of the Report. IEA North America includes United States and Canada. IEA Europe includes all countries in OECD Europe except Hungary, Poland and the Slovak Republic. IEA Pacific data includes Australia, New Zealand, Korea and Japan.2 Iraqi Total minus Kirkuk.3 Iranian Total minus Iranian Light.4 33 API and lighter (e.g., Bonny Light, Escravos, Qua Iboe and Oso Condensate).

INTERNATIONAL ENERGY AGENCY - MONTHLY OIL MARKET REPORT TABLES
18 JANUARY 2005 49
Table 7Regional OECD Imports1,2
(thousand barrels per day)
Year Earlier2001 2002 2003 4Q2003 1Q2004 2Q2004 3Q2004 Aug-04 Sep-04 Oct-04 Oct-03 % change
Crude Oil North America 8020 7584 8031 8013 8027 8557 8548 8968 7968 8354 8434 -1%Europe 8691 8725 9087 9155 9394 9566 9627 9589 9690 9653 9456 2%Pacific 6895 6422 6711 6683 7011 6170 6457 6391 6415 6745 5994 11%
Total OECD 23605 22731 23828 23851 24431 24293 24632 24948 24073 24752 23884 4%
LPGNorth America 28 39 27 33 29 10 25 39 31 32 34 -6%Europe 252 226 197 226 253 195 215 149 262 274 195 29%
Pacific 546 553 541 523 550 585 469 475 439 570 446 22%Total OECD 825 818 764 782 832 790 709 664 732 876 675 23%
NaphthaNorth America 59 42 68 64 53 49 96 116 122 151 73 52%Europe 298 298 311 322 310 321 238 216 205 243 392 -61%Pacific 647 705 770 761 782 761 787 798 791 715 815 -14%
Total OECD 1004 1045 1149 1148 1145 1131 1121 1130 1118 1110 1280 -15%
Gasoline3
North America 673 680 697 569 673 896 852 798 776 833 608 27%Europe 131 150 145 153 218 157 148 190 135 289 175 39%
Pacific 36 58 70 75 105 118 90 80 103 86 62 28%Total OECD 840 889 911 797 996 1171 1090 1068 1013 1208 845 30%
Jet & KeroseneNorth America 139 97 98 67 45 102 90 140 59 114 97 15%Europe 247 217 210 226 173 236 307 262 315 228 241 -6%Pacific 73 97 102 132 92 60 52 33 62 95 105 -11%
Total OECD 459 411 410 425 310 397 449 435 435 438 444 -1%
Gasoil/DieselNorth America 186 102 128 87 199 92 108 138 66 85 110 -30%Europe 575 655 652 629 679 654 779 755 777 921 509 45%
Pacific 31 53 73 73 56 92 79 74 85 62 73 -18%Total OECD 791 810 853 789 934 838 967 967 927 1068 693 35%
Heavy Fuel OilNorth America 314 237 325 323 364 317 347 357 351 585 334 43%Europe 397 471 394 446 366 431 447 398 499 448 435 3%Pacific 81 89 88 80 76 77 87 82 90 65 76 -17%
Total OECD 793 797 807 850 806 824 882 837 940 1098 845 23%
Other ProductsNorth America 703 689 701 618 869 701 950 987 931 725 552 24%Europe 736 735 684 702 666 701 708 717 684 780 683 12%Pacific 218 256 236 218 249 266 261 262 287 224 238 -6%
Total OECD 1657 1680 1620 1537 1783 1668 1919 1966 1902 1729 1473 15%
Total ProductsNorth America 2103 1887 2043 1762 2233 2165 2468 2576 2335 2525 1809 28%Europe 2636 2751 2592 2705 2664 2695 2844 2687 2878 3183 2629 17%Pacific 1631 1811 1879 1862 1910 1960 1825 1804 1856 1817 1815 0%
Total OECD 6369 6449 6514 6328 6807 6819 7136 7067 7068 7526 6254 17%
Total OilNorth America 10122 9471 10074 9775 10260 10722 11016 11544 10303 10879 10243 6%Europe 11326 11476 11679 11859 12057 12260 12470 12275 12567 12836 12085 6%Pacific 8526 8233 8590 8545 8921 8130 8282 8195 8270 8562 7810 9%
Total OECD 29974 29179 30342 30179 31238 31112 31768 32015 31141 32278 30137 7%
1 Based on Monthly Oil Questionnaire data submitted by OECD countries in tonnes and converted to barrels.
2 Excludes intra-regional trade
3 Includes additives

© OECD/IEA. All Rights Reserved
The International Energy Agency’s (‘IEA’) makes every attempt to ensure, but does not guarantee, the accuracy and completeness of the information or the clarity of content of the Oil Market Report (hereafter the ‘OMR’). The IEA shall not be liable to any party for any inaccuracy, error or omission contained or provided in this OMR or for any loss, or damage, whether or not due to reliance placed by that party on information in this OMR. The Executive Director and Secretariat of the IEA are responsible for the publication of the OMR. Although some of the data are supplied by IEA Member-country governments, largely on the basis of information they in turn receive from oil companies, neither these governments nor these oil companies necessarily share the Secretariat's views or conclusions as expressed in the OMR. The OMR is prepared for general circulation and is distributed for general information only. Neither the information nor any opinion expressed in the OMR constitutes an offer, or an invitation to make an offer, to buy or sell any securities or any options, futures or other derivatives related to such securities. The OMR is copyrighted by the IEA. The user may reference or copy this OMR for personal, non-commercial use provided that there be a specific written reference to the IEA as the source of the material. No part of the OMR may be copied, reproduced, republished, displayed, distributed or posted on servers in any manner for commercial purposes or for compensation of any kind without the prior written permission of the IEA ([email protected]).

www.oilmarketreport.org
OIL MARKET REPORT CONTACTS
Editor Klaus Rehaag (+33) 0*1 40 57 65 90
e-mail: [email protected] Demand Antoine Halff
(+33) 0*1 40 57 65 93 e-mail: [email protected]
Supply David Fyfe
(+33) 0*1 40 57 65 94 e-mail: [email protected]
OECD Stocks Harry Tchilinguirian
(+33) 0*1 40 57 65 22 e-mail: [email protected]
Prices and Refinery Activity Lawrence Eagles
(+33) 0*1 40 57 66 58 e-mail: [email protected]
Statistical Support Toril Ekeland
(+33) 0*1 40 57 66 36 e-mail: [email protected]
Administrative Support Anne Mayne
(+33) 0*1 40 57 65 96 e-mail: [email protected]
Brid Deely
(+33) 0*1 40 57 67 31 e-mail: [email protected]
Fax: (+33) 0*1 40 57 65 99/40 57 65 09
* 0 only within France
Users’ Guide to the IEA Oil Market Report Readers are referred to the Users’ Guide, published in conjunction with the Annual Statistical Supplement (current issue dated 11 August 2004), for information on the data sources, definitions, technical terms and general approach used in preparing the Report. It should be noted that the spot crude and product price assessments are based on daily Platt’s prices, converted when appropriate to US$ per barrel according to the Platt’s specification of products (©2005 Platt’s - a division of McGraw-Hill Inc.).
For all Subscription and Delivery Enquiries please contact:
International Energy Agency Attn: Ms. Sandra Coleman Oil Market Report Subscriptions BP 586-75726 Paris Cedex 15, France
Tel. +33 (0) 1 40 57 65 57 Fax. +33 (0) 1 40 57 65 59
E-mail: [email protected]
The monthly Oil Market Report is published on the responsibility of the Executive Director and Secretariat of the International Energy Agency. Although some of the data are supplied by Member Governments, largely on the basis of information received from oil companies, neither governments nor companies necessarily share the Secretariat’s views or conclusions as expressed therein. ©OECD/IEA2005