document17
DESCRIPTION
oTRANSCRIPT

Middle-East Journal of Scientific Research 12 (6): 870-877, 2012ISSN 1990-9233© IDOSI Publications, 2012DOI: 10.5829/idosi.mejsr.2012.12.6.2743
Corresponding Author: S.M. Irfan, COMSATS, Institute of Information Technology, Lahore, Pakistan.
870
Patient Satisfaction and Service Quality of PublicHospitals in Pakistan: An Empirical Assessment
S.M. Irfan, Aamir Ijaz and M.M. Farooq1, 2 1
COMSATS, Institute of Information Technology, Lahore, Pakistan1
Institute of Quality and Technology Management, University of the Punjab, Lahore, Pakistan2
Abstract: Quality is one of the key parameter in order to measure the performance of a product or service andultimately it referred to organizational performance. Customers are the key player, who played a significant roleto measure the quality of the product or services. However, to measure the quality of services is quite difficultas compare to the product quality due to its intangible nature. This study is intended to investigate the levelof quality of healthcare services delivered to patients by the public hospitals in Pakistan. Currently, healthcaresystem in Pakistan is comprised of public hospitals, healthcare units and dispensaries, which are not sufficientto meet the healthcare requirements of 169.9 million people. This study aims to investigate, quality of servicesdelivered to patients by public hospitals in Pakistan. For this purpose, a questionnaire was developed basedon modified ‘SERVQUAL’ using five service quality dimensions, namely; empathy, tangibles, timeliness,responsiveness and assurance. A total of 369 responses were collected from the patients availing services fromthe public hospitals located in Lahore, Pakistan. Data was analyzed using structural equation modelingtechnique (SEM) and results of this study indicate that public hospitals are not making visible efforts to deliverquality of services to their patients and are not making any visible efforts to meet patient’s needs and wants.
Key words: Service Quality Public Hospitals Patient Satisfaction Pakistan Structural EquationModeling (SEM)
INTRODUCTION and fast growing service industry [11]. Customers are the
Quality has become an icon for both the quality of services or product. In healthcare sectormanufacturer or service providers and the customers. customers are the patients and their perceptions areDuring the last couple of decades, there is a rapid considered be the main indicator while assessing thegrowth in the service sector around the globe. Service service quality [12, 13]. Patient satisfactions areorganizations like other manufacturing organizations are depending on their perceptions during the utilization ofalso focusing to deliver the services that meet customer healthcare services [14-16]. On the other hand, it is alsoneeds in order to make their customer happy. Earlier evident that hospitals are providing same type of servicesstudies on service quality provides evidence that there is to their patients but are not able to deliver same qualitya significant relationship between service quality and of services [17]. Similarly andaleeb [18] expressed thatcustomer satisfaction [1-3] and benefited the firms in patient’s perception about the service quality of aterms of retention of customers [4], gain customer loyalty healthcare organization helps to shape up their[5], cost reduction[6], boost profitability [7, 8], service confidence and behavior for selecting a healthcare facilityguarantees [9], financial performance [10] and competitive either from public or private hospital and patients availadvantage. this facility only as a measure of last alternative. To get
Healthcares sector is considered to be the major relief, sometimes patients had to travel long distancesservice sector for a country as it plays a vital role to within the country or sometimes to other countries todevelop and maintain a healthy human capital to achieve avail best healthcare services to such hospitals thatnational goals. In many countries around the globe, provide them assurance, comforts and relief from sicknesshealthcare sector has also become a highly competitive and injuries [11, 18].
key evaluator that plays a significant role in measuring the

Middle-East J. Sci. Res., 12 (6): 870-877, 2012
871
In developing countries, majority of the population Literature Review: Services are intangible in nature andis deprived of fundamental right, especially theun-availability of the basic healthcare facilities. Lack ofgovernment commitment towards the development ofhealthcare facilities could place adverse effects on othersectors of economy ‘mean an ailing nation equates to anailing economy’ [19]. Therefore, to assure the quality ofhealthcare services delivered to the people requiresstrong government commitment and positive efforts byallocating sufficient budget for the growth anddevelopment of healthcare institutions.
According to statistics division of Pakistan (2010),the population of the country is 169.6 billion and Pakistanis the 6 largest populated country of the world andth
having highest growth rate. Therefore, to provide thehealthcare facilities to this fastest growing population, itrequires concurrent planning, developing strategies andallocation of sufficient budget by the governmentagencies to promote the healthcare system. In Pakistan,majority of the population is living in rural areas whereasa small proportion of the people are living in urban areas.In Pakistan, majority of the public hospitals are located inthe urban areas and mostly are situated in big cities.
People living in the rural areas are unable to availfacilities from the hospitals and they are bound to availfacilities from the basic healthcare units and dispensaries.Due to lack of financial support, infrastructure, doctors,nurses, qualified supporting staff, labs and machinery,these healthcare units are unable to provide even thebasic healthcare facilities to patients.
Due to this reason the patients have to travel longdistances to gain hope, relief and the cheap healthcarefacilities from the public hospitals. This also causes tooverburden the public hospitals in big cities. In Pakistan,the total expenditures on the healthcare are still lowest ascompare to the same income level countries in the regionwhich was 0.54 percent during this year. Currenthealthcare facilities are given in Table 1.
Therefore, the objective of this study is to investigatethe patient perceptions about the service quality of majorpublic sector hospitals in Lahore, city of Pakistan.
Table 1: Healthcare FacilitiesHealth Manpower 2007-2008 2008-2009 2009-2011Registered Doctors 128,093 133,984 139,555Registered Dentists 8,215 9,013 9,822Registered Nurses 62,651 65,387 69,313Population per Doctor 1,245 1,212 1,183Population per Dentist 1,9417 18,010 16,914Population per Bed 1,544 1,575 1,592Source: Ministry of Health Pakistan(2010-2011),
thus it is difficult to assess and measure as compare to theproducts as it is an elusive and abstract concept [20] andthus same for the service quality. Service quality can bedefined as “conformance to customer specification” [21].According to Gronroos [22], service quality is measuredas technical and functional quality. According toParasuraman, Zeithaml [23], service quality is thedifference between customer perceptions andexpectations. Whereas Zeithaml [24] believes that servicequality is based on customer perception about theservices delivered by the service provider and how theseservices meets or exceed their expectations and it is purelybased on customer judgment. Expectations for the highquality of services had increased in the lives of the peopledue to increase of economic share of service sector inalmost all the economies of the world and it hasreached to half sum of Gross National Product’s (GNP’s)[12]. The key strategy for survival and success of anyindustry or any business is aimed to deliver superiorquality of services to their customers [23, 24].
Servqual: Due to intangible in nature service quality isdifficult to measure and defining the parameter to evaluatethe quality of services delivered to the customer was themajor issue in the beginning. The first service qualitymodel was presented by Parasuraman, Zeithaml [23] andauthors explored that customer perception about theservice quality is influenced by 5 ‘gaps’ and it is alsoknown as ‘gap’ model. Gap 1 shows the differencebetween customer expectations and managementperception of customer expectations. Gap 2 is thedifference between management perceptions aboutservice quality and service quality specifications. Gap 3 isthe difference between service quality specifications andservice quality delivery. Gap 4 is the difference betweenservice delivery and external communication to customersand gap 5 is the difference between expected andperceived service quality.
SERVQUAL model is based on gap 5 that wasinfluenced by first four gaps. Earlier, service quality wasmeasured by comparing customer expectations withcustomer perceptions on the basis of ten dimensionswhich includes; reliability, tangibility, communication,security, credibility, competence, understanding, access,understanding/knowing customers, responsiveness [23].Further this model was refined by Parasuraman, Berry [25]and service quality can be measured on the basis of fivedimensions; reliability, tangible, responsiveness,assurance and empathy and these five dimensions werefurther assessed by 22 items.

Middle-East J. Sci. Res., 12 (6): 870-877, 2012
872
Empathy is about the individual attention and care H : There is an association among timeliness and patientprovided to the customers by the service providerand its human resource. Tangible is about the physical facilities likeinfrastructure, labs, equipment and human resourcesinvolved in delivering the services.Assurance is about knowledge, skills and expertiseof the employees involved in delivering services andthe ability to create trust and confidence among thecustomers.Reliability is the ability to execute the promisedservices consistently and accurately.Responsiveness is the degree of willingness to helpand facilitate the customers by providing promptservices to the customers.
A comprehensive literature review about the servicequality was done by Seth, Deshmukh [26] and pointed out20 service quality models to measure the service qualitywhich includes: Gronroos [22] “technical and functionalquality model”, Cronin Jr and Taylor [12] “performanceonly model (SERVPERF)” and Parasuraman, Zeithaml[23]“Gap Model” are frequently found in the literature.However, among all these service quality models,SERVQUAL models was the only model that is frequentlyused in almost all type of service industries; like banksand credit cards companies [27], hospitality industry [28],airline industry [29], libraries [30] and healthcare sector[31-34]. It has been observed from the literature thatSERVQUAL is also considered as most adoptable modelin order to measure the service quality of healthcaresector [13, 18, 35].
On the basis of above discussion, the following nullhypothesis were developed.
H : There is an association between empathy and patient11
satisfactionH : There is a no association between empathy and01
patient satisfactionH : There is a an association between assurance and12
patient satisfactionH : There is a no association between assurance and02
patient satisfactionH : There is a an association among responsiveness and13
patient satisfactionH : There is a no association among responsiveness and03
patient satisfactionH : There is an association among tangibles and patient14
satisfactionH : There is a no association among tangibles and04
patient satisfaction
15
satisfactionH : There is a no association among timeliness and05
patient satisfaction
Methodology: This study is aimed to measure theservice quality of public hospitals based on patient’sperceptions. Although SERVQUAL is one of the mostpopular instrument used to measure the service quality,however, this instrument was criticized from both theoperational and conceptual perspectives [10]. Majorcriticism on this instrument was the usage of gapanalysis; the difference between expectations andperceptions while measuring the service quality [13].According to Cronin Jr and Taylor [13], comparison ofexpectation and perceptions gaps should be measuredbased only on customer perceptions and they named itSERVPERF. Cronin Jr and Taylor [13] stated thatmeasuring the service quality based on perception is quiteenough.
Therefore, a questionnaire was developed usingmodified SERVQUAL instrument in order to measure thequality of healthcare services delivered to patients bypublic hospitals in Pakistan solely on patient perceptions.This study includes five service quality dimensions;empathy, tangible, assurance, timeliness andresponsiveness. A total of 22 items representing the fivedimensions of service quality and are considered asconstructs in order to obtained results through mostadvance data analysis technique structure equationmodeling (SEM). This study was conducted in 2 largestnd
city, Lahore of Pakistan. The participant of this study wasthe patients who are availing services from these publichospitals and they are supported by their respectivegovernment originations. These respondents wereworking at officer’s level and availing services from thesepublic hospitals either for general consultation orinpatient. A total 500 questionnaire were distributedamong the respondent and 369 questionnaires werereceived back and thus representing a very goodresponse rate of 73.8%. Responses were evaluated on fivepoint Likert scale from strongly agree [5] to stronglydisagree [1]. Tables 2 and 3 provides the descriptivestatistics of the study.
Table 2 shows the frequency distribution of thegender comprised of male and female. There were 369participants in this study and 293 participants were malerepresenting 79.4% of the total population and 76participants were female representing 20.6% of the totalpopulation.

Middle-East J. Sci. Res., 12 (6): 870-877, 2012
873
Table 2: Frequency Distribution of Gender
Frequency Percent Valid Percent Cumulative Percent
Valid Male 293 79.4 79.4 79.4
Female 76 20.6 20.6 100.0
Total 369 100.0 100.0
Table 3: Frequency Distribution of Qualification
Frequency Percent Valid Percent Cumulative Percent
Valid Graduate 80 21.7 21.7 21.7
Master 289 78.3 78.3 100.0
Total 369 100.0 100.0
Table 3 shows the frequency distribution ofqualification of the respondent. Out of 369 respondents,21.7% of the respondents were graduates and theremaining 78.3% were having masters’ degree.
RESULTS
Most frequently used statistical software SPSS16.0 and Amos 16.0 for windows was used in order toevaluate the level of quality services delivered to patients.The five dimensions are considered as constructs.
To measure the reliability of the SERVQUAL instrumentused in this study, Cronbach Alpha was calculated.In empirical studies reliability and validity of theinstrument plays a significant role while performingstatistical analysis and it also helps to providesconsistency in the results [36] and the Cronbach alphahelps to measure the reliability of the data[37] andacceptable values of Cronbach Alpha should be greaterthan 0.70 [38].
Cronbach Alpha for this study is 0.892 provides anacceptable values. Similarly, the values of measurementcoefficient Cronbach Alpha of each of five constructsprovide acceptable values which are greater than 0.80 inall cases. Cronbach Alpha for the construct empathy is(0.81), tangible (0.90), assurance (0.83), timeliness (0.79)and responsiveness also provides an acceptable value ofCronbach Alpha (0.87).
Table 4 provides the list of 22 variables used in thisstudy representing five service quality constructs and thedescriptive statistics of the each of these variables.
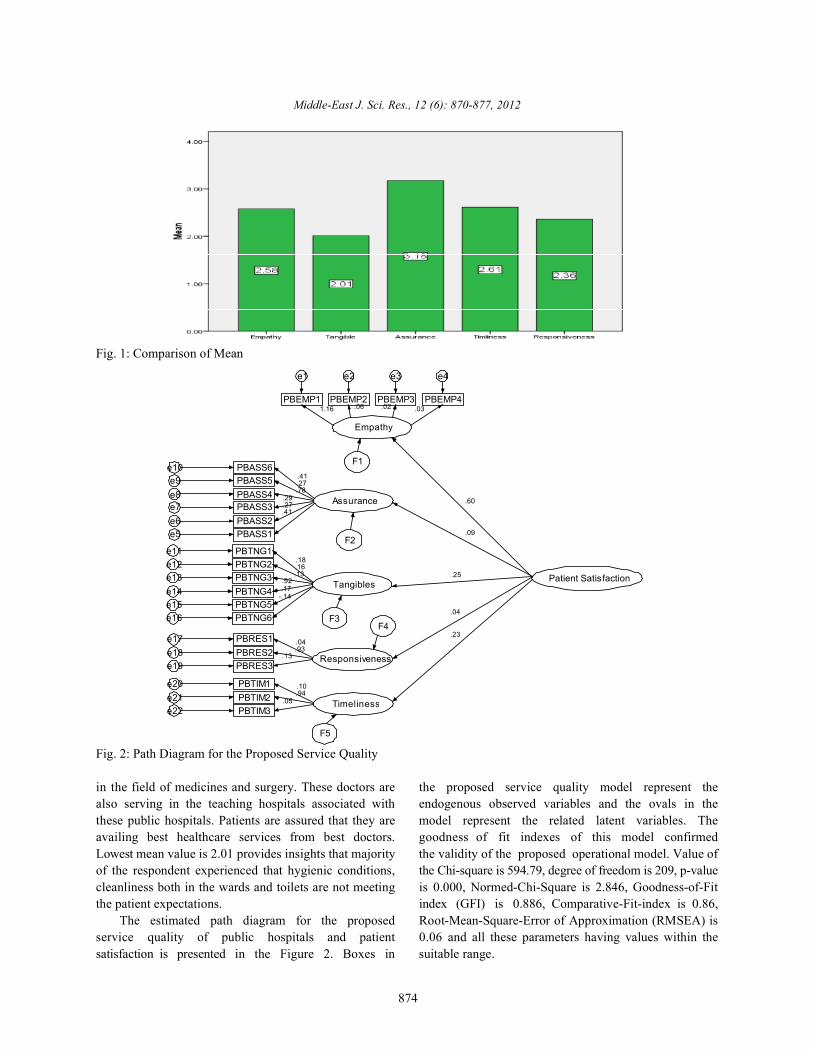
Figure 1 provides a comparison of mean value of thefive constructs. Majority of the respondents believe thatassurance level in the public hospitals is high as thepublic hospitals have employed most capable and expert
Table 4: Descriptive Statistics of the Service Quality ConstructsVariables and Constructs Mean S.DEmpathy (a =0.81) 2.5812 .70686
PBEMP1 Doctors have genuine concern about patients 2.6625 1.00243PBEMP2 Doctor care their patients 2.6187 1.00234PBEMP3 Staff and nurses care the patient 3.7125 1.00559PBEMP4 provide comfort to patients 2.1812 1.05730
Tangible ( =0.90) 2.0094 .54729PBTNG1 Hygienic conditions at hospital 3.7500 1.66519PBTNG2 Waiting facilities for attendants and patients 2.4312 1.06766PBTNG3 Healthy environment at hospital 2.4312 1.02560PBTNG4 Cleanliness of toilets/bathrooms 2.9000 1.08853PBTNG5 Cleanliness in wards/rooms (sheets, floor) 3.1938 1.12433PBTNG6 Lab and pharmacy facilities within the hospital 3.1812 0.96345
Assurance ( =0. 83) 3.1781 .67374PBASS1 Doctor’s expertise and skills 2.5062 0.98413PBASS2 Thorough investigations of the patient 3.2250 1.01529PBASS3 Doctors almost make right diagnoses 2.2750 1.03371PBASS4 Doctors go for expert opinion in critical cases 2.8562 1.05119PBASS5 Accuracy in lab reports 1.8250 0.90804PBASS6 Special attention to emergency patients 2.2625 0.955488
Timeliness ( =0.79) 2.6146 .75286PBTIM1 Patients are observed according to appointment 2.9062 1.00812PBTIM2 In time delivery of reports/services 2.4375 1.07976PBTIM3 Doctors/Staff observe the promised time 2.2375 0.87945
Responsiveness ( =0.87) 2.3583 .68685PBRES1 Doctors/staff efficiently respond to the patients 2.4062 0.92006PBRES2 Doctors/Staff are willing to help/facilitate the patients 2.5312 0.97724PBRES3 Feedback mechanism 2.5125 0.99044
Empathy
PBEMP1
e1
1.16PBEMP2
e2
.06PBEMP3
e3
.02PBEMP4
e4
.03
AssurancePBASS4e8PBASS3e7PBASS2e6PBASS1e5
.78.29.27.41
PBASS5e9 .27
PBASS6e10.41
TangiblesPBTNG4e14PBTNG3e13PBTNG2e12PBTNG1e11
PBTNG5e15PBTNG6e16
.92.13.16.18
.17-.14
ResponsivenessPBRES3e19PBRES2e18PBRES1e17
.13.93.04
TimelinessPBTIM3e22PBTIM2e21PBTIM1e20
.05.94.10
Patient Satisfaction
.60
.09
.25
.04
.23
F1
F2
F3F4
F5
Middle-East J. Sci. Res., 12 (6): 870-877, 2012
874
Fig. 1: Comparison of Mean
Fig. 2: Path Diagram for the Proposed Service Quality
in the field of medicines and surgery. These doctors are the proposed service quality model represent thealso serving in the teaching hospitals associated with endogenous observed variables and the ovals in thethese public hospitals. Patients are assured that they are model represent the related latent variables. Theavailing best healthcare services from best doctors. goodness of fit indexes of this model confirmedLowest mean value is 2.01 provides insights that majority the validity of the proposed operational model. Value ofof the respondent experienced that hygienic conditions, the Chi-square is 594.79, degree of freedom is 209, p-valuecleanliness both in the wards and toilets are not meeting is 0.000, Normed-Chi-Square is 2.846, Goodness-of-Fitthe patient expectations. index (GFI) is 0.886, Comparative-Fit-index is 0.86,
The estimated path diagram for the proposed Root-Mean-Square-Error of Approximation (RMSEA) isservice quality of public hospitals and patient 0.06 and all these parameters having values within thesatisfaction is presented in the Figure 2. Boxes in suitable range.

Middle-East J. Sci. Res., 12 (6): 870-877, 2012
875
Table 5: Correlations among Service Quality ConstructsEmpathy Tangible Assurance Timeliness Responsiveness
Empathy Pearson Correlation 1 .640 .590 .583 .591** ** ** **
Sig. (2-tailed) .000 .000 .000 .000N 369 369 369 369 369
Tangible Pearson Correlation .640 1 .557 .624 .517** ** ** **
Sig. (2-tailed) .000 .000 .000 .000N 369 369 369 369 369
Assurance Pearson Correlation .590 .557 1 .527 .372** ** ** **
Sig. (2-tailed) .000 .000 .000 .000N 369 369 369 369 369
Timeliness Pearson Correlation .583 .624 .527 1 .540** ** ** **
Sig. (2-tailed) .000 .000 .000 .000N 369 369 369 369 369
Responsiveness Pearson Correlation .591 .517 .372 .540 1** ** ** **
Sig. (2-tailed) .000 .000 .000 .000N 369 369 369 369 369
**. Correlation is significant at the 0.01 level (2-tailed).
The above path diagram represented in Figure 2 working environment. It helps to create motivationshows that the entire service quality construct among the doctors and the other people involved in(latent variables) had a standardized regression hospital operations and will be willing to provideweights less than 0.5 except empathy. First construct individual attentions to the patients. This factor alsoempathy shows that employees involved in hospital helps to create satisfaction among the patients about theoperation including doctors, nurses and management services delivered to them. It is also observed from thestaff do not provide individual concern to the patient above table that the p-value between these twoas the p-value for (empathy-patient satisfaction) is constructs is 0.000, so we can say that at 1% level of0.3071 which is greater than 0.05. Therefore, our null significant, the correlation between tangible and empathyhypothesis H is accepted. Similarly, the relationship is significant and the strongest correlation among these01
among, tangibles and patient satisfaction has variables. The weakest correlation is responsiveness andp-value 0.563 and thus accepting our null hypothesis assurance which is 37.2%. However, the correlationH . Timeliness and patient satisfaction also has among all the service quality constructs is positive and04
insignificant p-value 0.222 which also shows that our the p-value among these variables is 0.000 indicating anull hypothesis H is accepted. Only, assurance has a significant correlation among them at 1% level of05
significant impact on patient satisfaction as the significant.p-value is 0.02 shows that our hypothesis H is12
accepted and null hypothesis H is rejected. Major CONCLUSION02
reason is that majority of the studied public hospital areassociated with the medical college and highly qualified From the above results it shows that patientand well known professors are associated with these availing facilities from the public hospitals perceivehospitals, so the patient hopes that they will be treated by that public hospitals are not making visible effort inbest doctors. order to deliver better quality of services to their
Table 5 provides the correlation among the variables patients. The studied service quality construct does notand it is observed that highest correlation occurs between have a significant impact on patient satisfactionthe empathy and tangibles and lowest correlations are except assurance. It is also observed from this studyfound among assurance and responsiveness. All the that patient satisfaction is a latent exogenousvariables are significantly correlated with each other at variable, which is represented by five observed0.01 significance levels. endogenous variables namely, ‘empathy’, ‘tangible’,
The above results showed that the highest ‘assurance’, ‘timeliness’ and ‘responsiveness’. Results ofcorrelation exists among the constructs empathy and the five factors showed that the measurement model fortangibles which is 64.0%, showing that with the service quality constructs had a good fit and the model isdevelopment of tangibles helps to create a healthy valid and reliable.

Middle-East J. Sci. Res., 12 (6): 870-877, 2012
876
Major reasons for delivering the poor quality of the REFERENCESservices to patients is that majority of the public hospitalsare in the province Punjab of Pakistan which are located 1. Boulding, W., et al., 1993. A dynamic process modelin big cities like, Lahore, Rawalpindi and Multan etc. of service quality: from expectations to behavioralThe people living in the rural areas are lacking from the intentions. Journal of Marketing Research,basic health facilities and whenever they have any health 30(1): 7-27.problem they have only opportunity to visit these public 2. Johns, N., T. Avci and O.M. Karatepe, 2004.hospitals located in these big cities. Public hospitals are Measuring service quality of travel agents: evidencethe only source for the patients, in Pakistan for availing from Northern Cyprus. The Service Industriescheap healthcare facilities. This also makes the public Journal, 24(3): 82-100.hospitals overcrowded and the management is unable to 3. Kara, A., et al., 2005. A paradox of service quality inmanage the large number of patients. This is the major Turkey: The seemingly contradictory relativereason that doctors and staff are unable to provide importance of tangible and intangible determinantsindividual attentions to patients. of service quality. European Business Review,
Hygienic conditions, cleanliness in the wards and in 17(1): 5-20.the hospital that makes the hospital environment healthy 4. Reichheld, F.F. and W.E. Sasser Jr, 1990. Zeroare also very poor in the public hospitals as the lower defections: quality comes to services. Harvardstaff that is associated to maintain cleanliness is always Business Review, 68(5): 105.waiting for the bukhshish from patient as mentioned by 5. Boshoff, C. and B. Gray, 2004. The relationshipsAndaleeb [18], as one dimension of service quality while between service quality, customer satisfaction andstudying the public hospitals of Bangladesh. The above buying intentions in the private hospital industry.results indicate that patients perceive that public South African Journal of Business Management,hospitals in Lahore, the second largest city of Pakistan are 35(4): 27-37.not delivering quality of services to their patients. It is 6. Wilson, A., et al., 2008. Services Management, 2008,evident from the literature that public hospitals in Egypt McGraw-Hill Education: Berkshire.are delivering poor quality of services to their patients as 7. Rust, R.T. and A.J. Zahorik, 1993. Customercompare to private hospitals [39]. Similarly, another study satisfaction, customer retention and market share.conducted on this topic by Andaleeb [19], provides Journal of Retailing, 69(2): 193-215.insights that private hospitals in Bangladesh are 8. Zeithaml, V.A., L.L. Berry and A. Parasuraman, 1996.providing better healthcare services as compare to public The behavioral consequences of service quality. Thehospitals and services of foreign hospitals are far better Journal of Marketing, pp: 31-46.than public and private hospitals. Another study 9. Kandampully, J. and L. Butler, 2001. Serviceconducted by Ye ilada and Direktör [40], concluded that guarantees: a strategic mechanism to minimisepublic hospitals seems to provide insignificant customers’ perceived risk in service organisations.relationship with the service quality dimensions as Managing Service Quality, 11(2): 112-121.compare to private hospitals in Turkey. These results also 10. Buttle, F., 1996. SERVQUAL: review, critique,validate our study, that patients perceive that public research agenda. European Journal of Marketing,hospitals in Pakistan are not delivering quality of 30(1): 8-32.healthcare services to the patients. 11. Jabnoun, N. and M. Chaker, 2003. Comparing the
Major reason of this poor quality is due to lack of quality of private and public hospitals. Managingimplementation of quality management systems in the Service Quality, 13(4): 290-299.healthcare sector. Total quality management (TQM) has 12. Cronin Jr, J.J. and S.A. Taylor, 1992. Measuringbeen widely implemented as a strategic tool to gain service quality: a reexamination and extension.competitive edge and Pakistan is still lagging behind to The Journal of Marketing, pp: 55-68.adopt TQM in almost all the sectors but public healthcare 13. Cronin Jr, J.J. and S.A. Taylor, 1994. SERVPERFsector is among the most ignored sector [41]. Therefore, versus SERVQUAL: reconciling performance-basedit is the need of hour that healthcare sector should adopt and perceptions-minus-expectations measurementTQM philosophy to deliver superior quality of service to of service quality. The Journal of Marketing,boost their service quality and gain customer satisfaction. pp: 125-131.

Middle-East J. Sci. Res., 12 (6): 870-877, 2012
877
14. Sitzia, J. and N. Wood, 1997. Patient satisfaction: a 28. Saleh, F. and C. Ryan, 1991. Analysing servicereview of issues and concepts. Social Science & quality in the hospitality industry using theMedicine, 45(12): 1829-1843. SERVQUAL model. Service Industries Journal,
15. Baker, R. and J. Streatfield, 1995. What type of 11(3): 324-345.general practice do patients prefer? Exploration of 29. Frost, F.A. and M. Kumar, 2001. Service qualitypractice characteristics influencing patient between internal customers and internal suppliers insatisfaction. The British journal of general practice, an international airline. International Journal of45(401): 654. Quality & Reliability Management, 18(4): 371-386.
16. Baltussen, R., et al., 2005. 4.4 Perceived quality of 30. Nitecki, D.A., 1996. Changing the concept andcare of primary health care services in Burkina Faso. measure of service quality in academic libraries.Health Research in Developing Countries: A The journal of academic Librarianship, 22(3): 181-190.collaboration between Burkina Faso and Germany, 31. Carman, J.M., 1990. Consumer perceptions of service17(1): 183. quality: An assessment of the SERVQUAL
17. Youssef, F.N., 1996. Health care quality in NHS dimensions. Journal of Retailing.hospitals. International Journal of Health Care 32. Headley, D.E. and S.J. Miller, 1993. MeasuringQuality Assurance, 9(1): 15-28. Service Quality and its Relationship to. Journal of
18. Andaleeb, S.S., 2001. Service quality perceptions Health Care Marketing, 13(4): 32-41.and patient satisfaction: a study of hospitals in a 33. Lam, S.S.K., 1997. SERVQUAL: a tool for measuringdeveloping country. Social science & Medicine, patients' opinions of hospital service quality in Hong52(9): 1359-1370. Kong. Total Quality Management, 8(4): 145-152.
19. Andaleeb, S.S., 2000. Public and private hospitals in 34. Kilbourne, W.E., et al., 2004. The applicability ofBangladesh: service quality and predictors of SERVQUAL in cross-national measurements ofhospital choice. Health Policy and Planning, health-care quality. Journal of Services Marketing,15(1): 95-102. 18(7): 524-533.
20. Lee, H., et al., 2000. Methods of measuring 35. Babakus, E. and W.G. Mangold, 1992. Adapting thehealth-care service quality. Journal of Business SERVQUAL scale to hospital services: an empiricalResearch, 48(3): 233-246. investigation. Health Services Research, 26(6): 767.
21. Berry, L.L., E.F. Lefkowith and T. Clark, 1988. In 36. Gatewood, R., H.S. Feild and M. Barrick, 2010. Humanservices, what's in a name. Harvard business review, resource selection 2010: South-Western Pub.66(5): 28-30. 37. Green, S.B., N.J. Salkind and T.M. Jones, 1996. Using
22. Gronroos, C., 1993. A service quality model and its SPSS for Windows; analyzing and understandingmarketing implications. European Journal of data 1996: Prentice Hall PTR.Marketing, 18(4): 36-44. 38. Nunnally, J.C., 1978. Psychometric theory, 1978, New
23. Parasuraman, A., V.A. Zeithaml and L.L. Berry, 1985. York: McGraw-Hill.A conceptual model of service quality and its 39. Mostafa, M.M., 2005. An empirical study of patients'implications for future research. The Journal of expectations and satisfactions in Egyptian hospitals.Marketing, pp: 41-50. International Journal of Health Care Quality
24. Zeithaml, V.A., 1990. Delivering Quality Service, Assurance, 18(7): 516-532.Free Press. 40. Ye ilada, F. and E. Direktör, 2010. Health care service
25. Parasuraman, A., L.L. Berry and V.A. Zeithaml, 2004. quality: A comparison of public and privateRefinement and reassessment of the SERVQUAL hospitals. African Journal of Business Management,scale. Journal of Retailing, 67(4): 114. 4(6): 962-971.
26. Seth, N., S. Deshmukh and P. Vrat, 2005. Service 41. Irfan, S., et al., 2012. Improving Operationalquality models: a review. International Journal of Performance of Public Hospital in Pakistan: A TQMQuality & Reliability Management, 22(9): 913-949. Based Approach. World Applied Sciences Journal,
27. Jabnoun, N. and H.A.H. Al-Tamimi, 2003. Measuring 19(6): 904-913.perceived service quality at UAE commercial banks.International Journal of Quality & ReliabilityManagement, 20(4): 458-472.