17 th miller/spoolman living in the environment chapter 19 climate control and ozone depletion
TRANSCRIPT

17THMILLER/SPOOLMAN
LIVING IN THE ENVIRONMENT
Chapter 19Climate Control and Ozone Depletion

Science Focus: Melting Ice in Greenland• Largest island: 80% composed of glaciers
• 10% of the world’s fresh water
• Glacial melting and movement accelerating
• Effect on sea level if melting continues• 1 meter rise by 2100
19-1 How Might the Earth’s Temperature and Climate Change in the Future?
• Concept 19-1 Considerable scientific evidence indicates that the earth’s atmosphere is warming, because of a combination of natural effects and human activities, and that this warming is likely to lead to significant climate disruption during this century.
Weather and Climate Are Not the Same
• Weather is short-term changes• Temperature• Air pressure• Precipitation• Wind
• Climate is average conditions in a particular area over a long period of time• Temperature• Precipitation• Fluctuations are normal

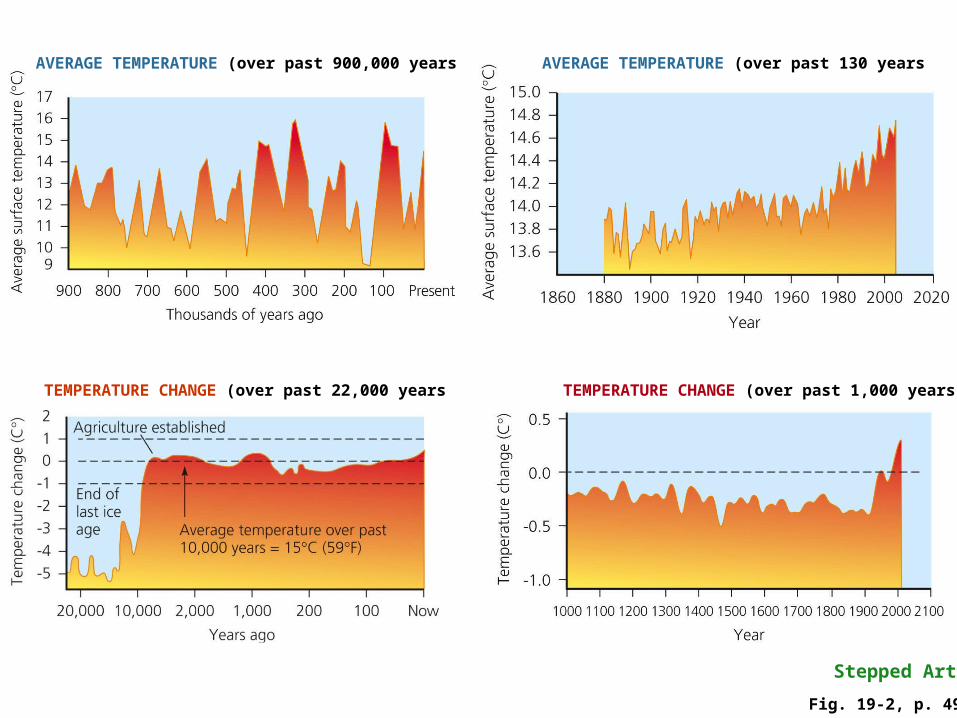
Climate Change is Not New (1)
• Over the past 4.7 billion years the climate has been altered by• Volcanic emissions• Changes in solar input• Movement of the continents• Impacts by meteors• Changing global air and ocean circulation
• Over the past 900,000 years• Glacial and interglacial periods

Climate Change is Not New (2)
• Over the past 10,000 years• Interglacial period
• Over the past 1,000 years• Temperature stable
• Over the past 100 years• Temperature changes; methods of determination

Estimated Changes in the Average Global Temperature of the Atmosphere
Fig. 19-2, p. 494

Fig. 19-2a, p. 494
17
Aver
age
surf
ace
tem
pera
ture
(°C)
800 700 600 500 400 300 200 100
Thousands of years ago
16
14
910
11
12
13
15
900 Present
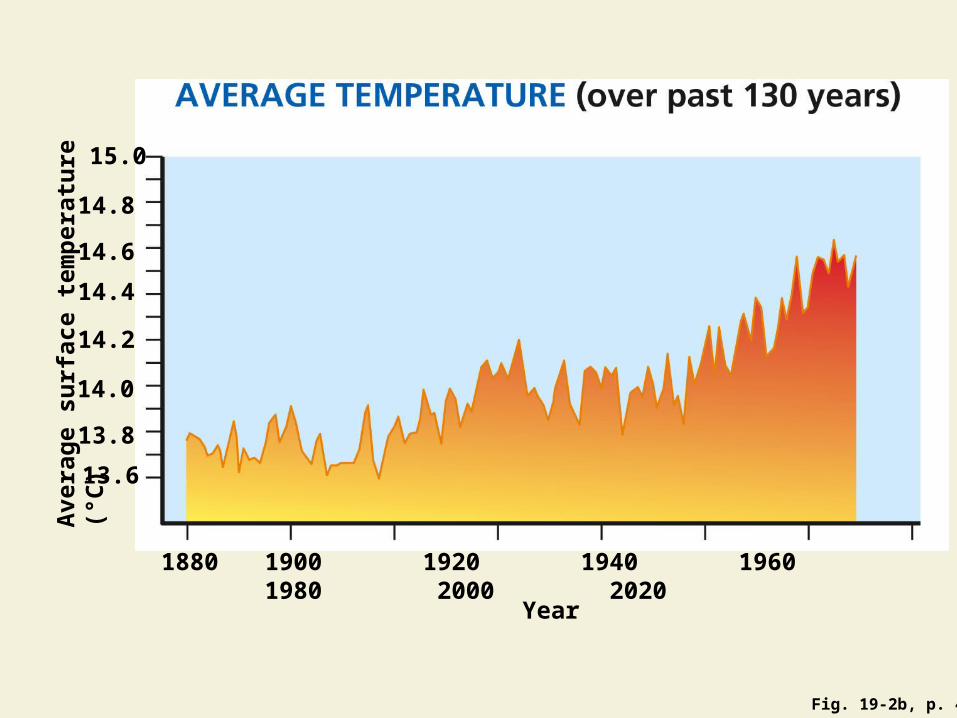
Fig. 19-2b, p. 494
15.0
Aver
age
surf
ace
tem
pera
ture
(°C)
1880 1900 1920 1940 1960 1980 2000 2020
Year
14.8
14.6
14.4
14.2
14.0
13.8
13.6

Fig. 19-2c, p. 494
TEMPERATURE CHANGE (over past 22,000 years)
2
1Agriculture established
End of last ice age-2
Average temperature over past 10,000 years = 15°C (59°F)
-4Tem
pera
ture
cha
nge
(°C)
20,000 2,000 200 100 Now
Years ago
0
-1
-3
-5
10,000 1,000

Fig. 19-2d, p. 494
0.5
0.0
-0.5
Tem
pera
ture
cha
nge
(°C)
-1.0
1000 1100 1200 1300 1400 1500 1600 1700 1800 1900 2000 2100Year
Stepped Art
AVERAGE TEMPERATURE (over past 900,000 years AVERAGE TEMPERATURE (over past 130 years
TEMPERATURE CHANGE (over past 22,000 years TEMPERATURE CHANGE (over past 1,000 years
Fig. 19-2, p. 494

Science: Ice Cores Are Extracted by Drilling Deep Holes in Ancient Glaciers
Fig. 19-3, p. 495

Our Climate, Lives, and Economies Depend on the Natural Greenhouse Effect
• Greenhouse gases absorb heat radiated by the earth• The gases then emit infrared radiation that warms the
atmosphere
• Without the natural greenhouse effect• Cold, uninhabitable earth

Human Activities Emit Large Quantities of Greenhouses Gases
• Since the Industrial Revolution• CO2, CH4, and N2O emissions higher
• Main sources: agriculture, deforestation, and burning of fossil fuels
• Correlation of rising CO2 and CH4 with rising global temperatures

Atmospheric Levels of CO2 and CH4, Global Temperatures, and Sea Levels
Fig. 19-4, p. 496

Fig. 19-4a, p. 496
400 380 360 340 320 300 280 260 240 220 200 180 160
CO2
CO2 c
once
ntra
tion
(ppm
)
350,000 300,000 250,000 200,000 150,000 100,000 50,000 0Year before present
400,000
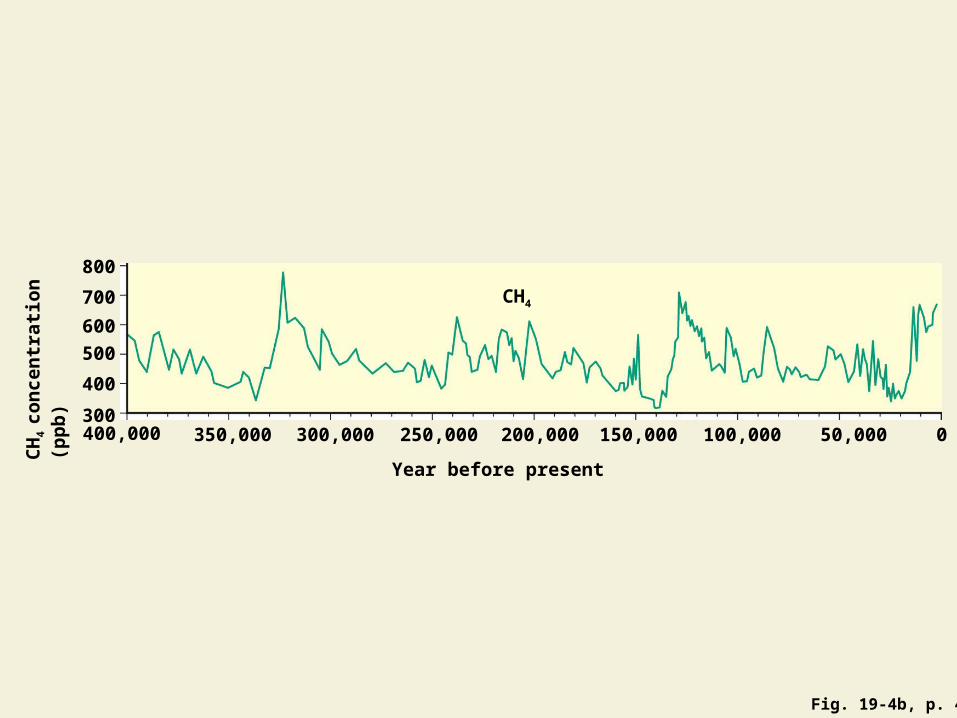
Fig. 19-4b, p. 496
800
700 CH4
600500
CH4 co
ncen
trati
on (p
pb)
400
300350,000 300,000 250,000 200,000 150,000 100,000 50,000 0400,000
Year before present
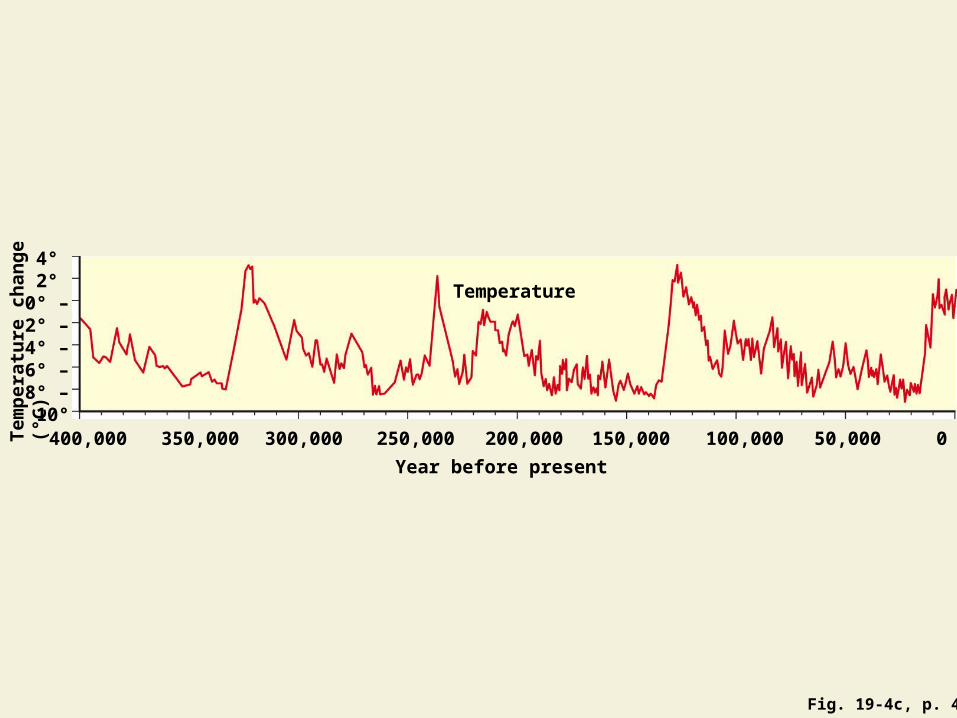
Fig. 19-4c, p. 496
4° 2°
0° –2° –4° –
6° –8° –10°
Temperature
Tem
pera
ture
cha
nge
(°C)
350,000 300,000 250,000 200,000 150,000 100,000 50,000 0400,000
Year before present

Fig. 19-4d, p. 496
20 Sea level–20 –
40 –60 –80 –100 –
120Sea
leve
l (m
)
400,000 350,000 300,000 250,000 200,000 150,000 100,000 50,000 0Year before present
0

Stepped Art
Fig. 19-4, p. 496

Correlation of CO2 and Temperature
Fig. 19-5, p. 497

Fig. 19-5, p. 497
15.0 400
14.8Average annual
temperature Running
mean CO2
14.4
14.2 340
360
380
14.6
Atmospheric CO
2 concentration (ppm)
14.0320
13.8
Aver
age
surf
ace
tem
pera
ture
(°C)
13.6300
13.4 280
1880 1900
Year
2020 20001980196019401920

CO2 Concentrations, 1960-2009
Figure 14, Supplement 9

Human Activities Play a Key Role in Recent Atmospheric Warming (1)
• Intergovernmental Panel on Climate Change (IPCC), with 2010 updates• 90–99% likely that lower atmosphere is warming• Especially since 1960• Mostly from human-caused increases in greenhouse
gases• Earth’s climate is now changing from increased
greenhouse gases• Increased greenhouse gas concentrations will likely
trigger significant climate disruption this century• Ecological, economic, and social disruptions

Human Activities Play a Key Role in Recent Atmospheric Warming (2)
• Intergovernmental Panel on Climate Change (IPCC), with 2010 updates, cont.• 1906–2005: Ave. temp increased about 0.74˚C• 1970–2009: Annual greenhouse emissions from
human activities up 70%• 2000-2009 warmest decade since 1881• Past 50 years: Arctic temp rising almost twice as fast
as the rest of the earth• Melting of glaciers and increased floating sea ice• Last 100 years: sea levels rose 19 cm

Human Activities Play a Key Role in Recent Atmospheric Warming (3)
• What natural and human-influenced factors could have an effect on temperature changes?• Amplify• Dampen

Melting of Alaska’s Muir Glacier between 1948 and 2004
Fig. 19-6, p. 499
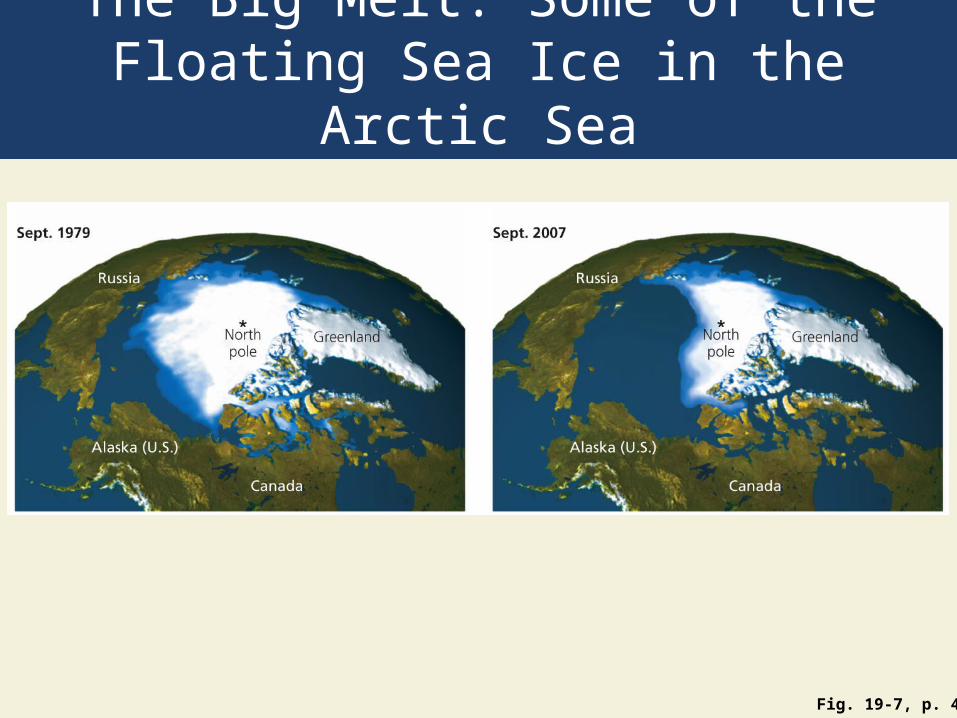
The Big Melt: Some of the Floating Sea Ice in the Arctic Sea
Fig. 19-7, p. 499

Sept. 1979 Sept. 2007
Russia Russia
North pole Greenland
North pole
Greenland
Alaska (U.S.) Alaska (U.S.)
Canada Canada
Stepped Art
Fig. 19-7, p. 499

Fig. 19-7, p. 507
Stepped Art

Science Focus: How Valid Are IPCC Conclusions?
• 2500 scientists working for over two decades to reach consensus on climate change data and likely impact• Unanimity impossible to achieve• Gaps in data• Debate about interpreting data• Need for better models• 2007 IPCC report and Nobel Prize
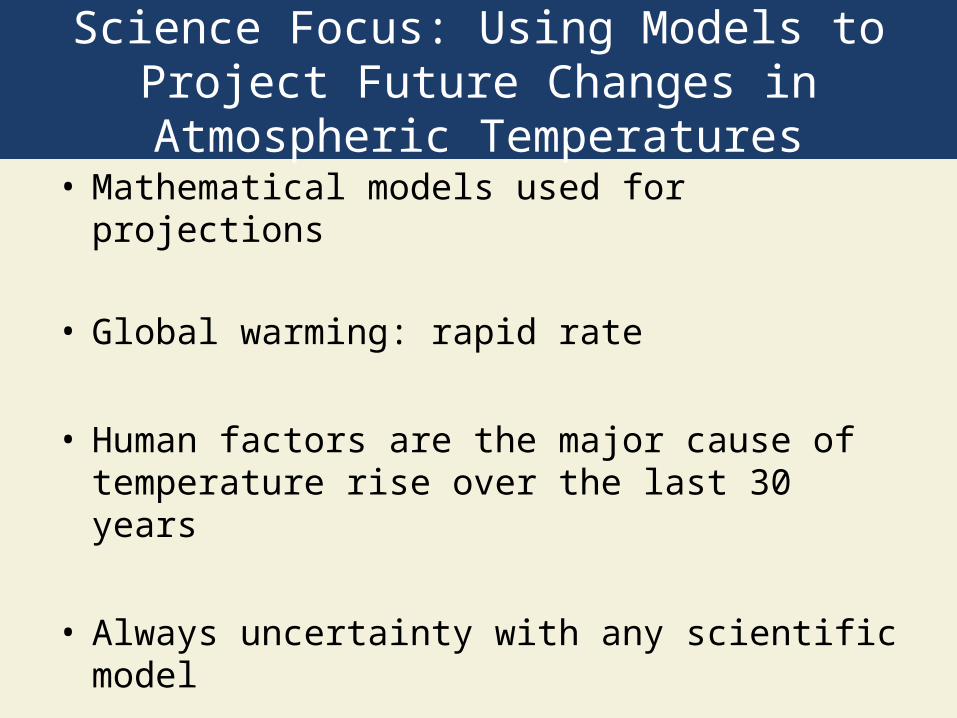
Science Focus: Using Models to Project Future Changes in Atmospheric
Temperatures• Mathematical models used for projections
• Global warming: rapid rate
• Human factors are the major cause of temperature rise over the last 30 years
• Always uncertainty with any scientific model
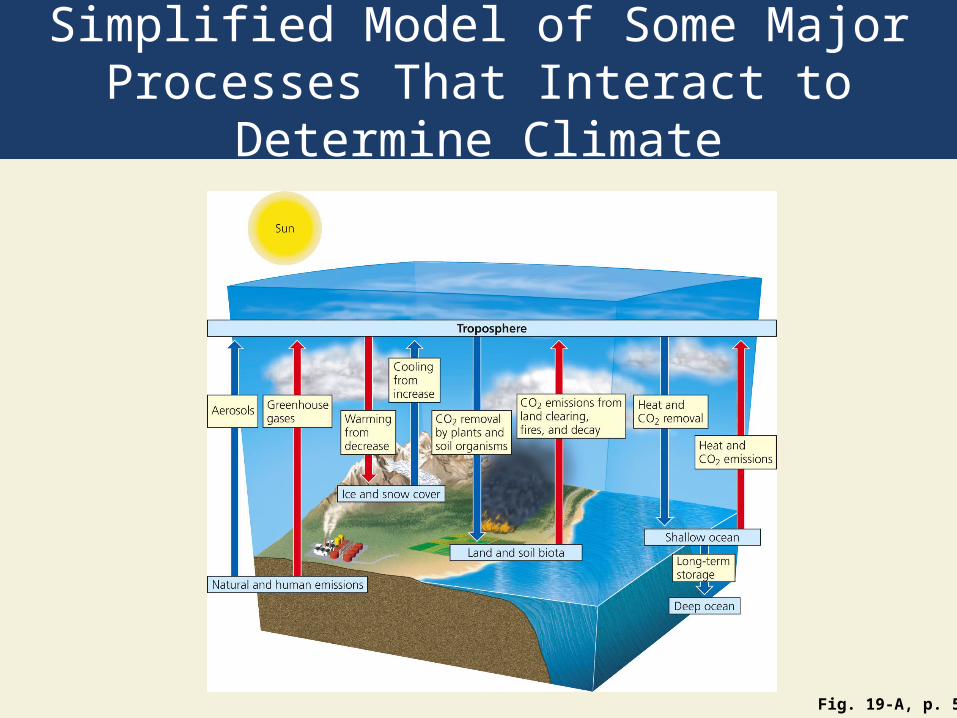
Simplified Model of Some Major Processes That Interact to Determine Climate
Fig. 19-A, p. 500
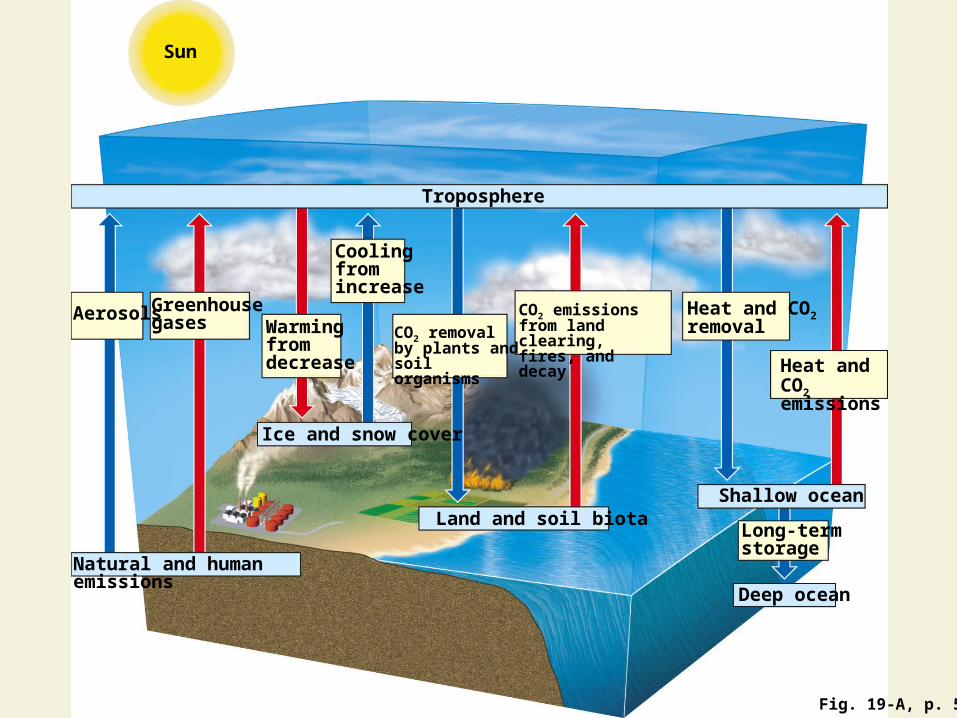
Fig. 19-A, p. 500
Sun
Troposphere
Cooling from increase
Aerosols Greenhouse gases Warming
from decrease
CO2 removal by plants and soil organisms Heat and CO2
emissions
CO2 emissions from land clearing, fires, and decay
Heat and CO2 removal
Ice and snow cover
Shallow oceanLand and soil biota
Long-term storage
Natural and human emissions
Deep ocean

Comparison of Measured Temperature from 1860–2008 and Projected Changes
Fig. 19-B, p. 501

Fig. 19-B, p. 501
5.0
4.5
4.0
3.5
3.0
2.5
2.0
Chan
ge in
tem
pera
ture
(°C)
1.5
1.0
0.5
1875 1900 1925 1950 1975 2000 2025 2050 2075 2100Year
0

Individuals Matter: Sounding the Alarm – James Hansen
• 1988 appearance before Congress began debate over atmospheric warming
• Promoted creation of IPCC
• Climate scientist at NASA
• Rising levels of greenhouse gases will lead to drastic climate disruption

James Hansen
Fig. 19-C, p. 502
CO2 Emissions Play an Important Role (1)• From burning fossil fuels and forests
• Abetted by deforestation; forests remove CO2 from the atmosphere
• 2010: 389 ppm• 2050: 560 ppm• 2100: 1,390 ppm• 450 ppm as tipping point

CO2 Emissions Play an Important Role (2)• Largest emitters, 2009
1. China2. United States3. European Union (27 countries)4. Indonesia5. Russia6. Japan7. India

Cumulative CO2 emissions, 1900-2005
Figure 15, Supplement 9

Waste Heat Also Plays a Role in Climate Disruption
• Burning any fuel creates heat
• Many sources of heat• Power plants• Internal combustion engines• lights

What Role Does the Sun Play?
• Researchers think atmospheric warming not due to an increase in energy output from the sun
• Since 1975• Troposphere has warmed• Stratosphere has cooled
• This is not what a hotter sun would do

What Role Do the Oceans Play in Projected Climate Disruption?
• Solubility of CO2 in ocean water
• Warmer oceans• Last century: 0.32-0.67C°increase• Absorb less CO2 and hasten atmospheric warming
• CO2 levels increasing acidity
• Affect phytoplankton and other organisms
There Is Uncertainty about the Effects of Cloud Cover on Global Warming
• Warmer temperatures create more clouds• Thick, low altitude cumulus clouds: decrease surface
temperature• Thin, cirrus clouds at high altitudes: increase surface
temperature
• Effect of jet contrails on climate temperature

Cumulus Clouds and Cirrus Clouds
Fig. 19-8, p. 503
Outdoor Air Pollution Can Temporarily Slow Global Warming
• Aerosol and soot pollutants• Will not enhance or counteract projected global
warming• Fall back to the earth or are washed out of the lower
atmosphere• Reduction: especially in developed countries

19-2 What Are Some Possible Effects of a Warmer Atmosphere?
• Concept 19-2 The projected rapid change in the atmosphere's temperature could have severe and long-lasting consequences, including increased drought and flooding, rising sea levels, and shifts in the locations of croplands and wildlife habitats.

Enhanced Atmospheric Warming Could Have Serious Consequences
• Worst-case scenarios• Ecosystems collapsing• Low-lying cities flooded• Wildfires in forests• Prolonged droughts• More destructive storms• Glaciers shrinking; rivers drying up• Extinction of up to half the world’s species• Spread of tropical infectious diseases

Severe Drought Is Likely to Increase
• Accelerate global warming, lead to more drought
• Increased wildfires
• Declining streamflows, dry lakes, lower water tables
• Dry climate ecosystems will increase
• Other effects of prolonged lack of water

More Ice and Snow Are Likely to Melt (1)• Why will global warming be worse in the polar
regions?
• Mountain glaciers affected by• Average snowfall• Average warm temperatures• 99% of Alaska’s glaciers are shrinking
• When mountain glaciers disappear, there will be far less water in many major rivers

More Ice and Snow Are Likely to Melt (2)• Glaciers disappearing from• Himalayas in Asia• Alps in Europe• Andes in South America
• Greenland• Warmer temperatures

Shrinking Athabasca Glacier in Canada
Fig. 19-9, p. 506
Permafrost Is Likely to Melt: Another Dangerous Scenario
• If permafrost in Arctic region melts• Methane, a greenhouse gas, will be released into the
atmosphere
• Arctic permafrost contains 50-60x the amount of carbon dioxide emitted annually from burning fossil fuels
• Methane in permafrost on Arctic Sea floor
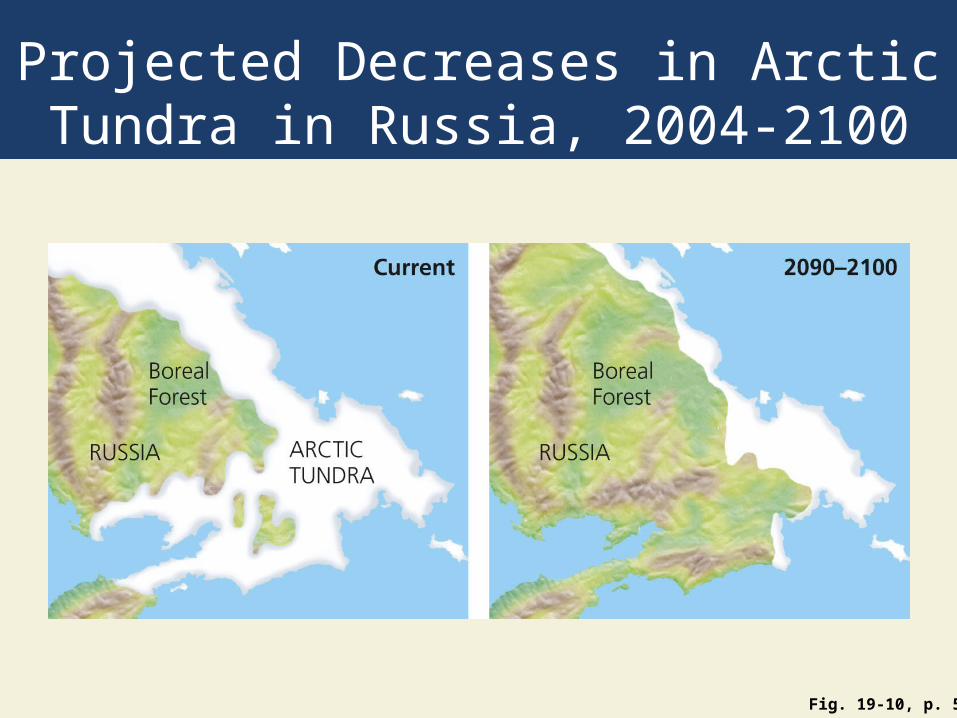
Projected Decreases in Arctic Tundra in Russia, 2004-2100
Fig. 19-10, p. 507

Fig. 19-10a, p. 507
Current
Boreal Forest
ARCTIC TUNDRARUSSIA

Fig. 19-10b, p. 507
2090–2100
Boreal Forest
RUSSIA

Current
Boreal Forest
RUSSIA ARCTIC TUNDRA
Stepped Art
2090–2100
Boreal Forest
RUSSIA
Fig. 19-10, p. 507

Sea Levels Are Rising (1)
• 0.8-2 meters by 2100
• Expansion of warm water
• Melting of land-based ice
• What about Greenland?
Sea Levels Are Rising (2)
• Projected irreversible effect• Degradation and loss of 1/3 of coastal estuaries,
wetlands, and coral reefs• Disruption of coastal fisheries• Flooding of • Low-lying barrier islands and coastal areas• Agricultural lowlands and deltas
• Contamination of freshwater aquifers• Submergence of low-lying islands in the Pacific and
Indian Oceans and the Caribbean• Flooding of coastal cities

Areas of Florida to Flood If Average Sea Level Rises by One Meter
Fig. 19-11, p. 507

Fig. 19-11, p. 507
ALABAMAGEORGIA
PensacolaTallahasee Jacksonville
Atlantic Ocean
Orlando
Gulf of MexicoTampa
FLORIDA
Fort Meyers
Naples Miami
Key West

Low-Lying Island Nation: Maldives in the Indian Ocean
Fig. 19-12, p. 508

Extreme Weather Is Likely to Increase in Some Areas
• Heat waves and droughts in some areas• Could kill large numbers of people
• Prolonged rains and flooding in other areas
• Will storms get worse? • More studies needed

Climate Disruption Is a Threat to Biodiversity (1)
• Most susceptible ecosystems• Coral reefs• Polar seas• Coastal wetlands• High-elevation mountaintops• Alpine and arctic tundra

Climate Disruption Is a Threat to Biodiversity (2)
• What about• Migratory animals• Forests
• Which organisms could increase with global warming? Significance?• Insects • Fungi• Microbes

Exploding Populations of Mountain Pine Beetles in British Columbia, Canada
Fig. 19-13, p. 509

Agriculture Could Face an Overall Decline
• Regions of farming may shift• Decrease in tropical and subtropical areas• Increase in northern latitudes• Less productivity; soil not as fertile
• Hundreds of millions of people could face starvation and malnutrition

A Warmer World Is Likely to Threaten the Health of Many People
• Deaths from heat waves will increase
• Deaths from cold weather will decrease
• Higher temperatures can cause• Increased flooding• Increase in some forms of air pollution, more O3
• More insects, microbes, toxic molds, and fungi

Detection of Dengue Fever in Mosquitoes, as of 2005
Fig. 19-14, p. 510

19-3 What Can We Do to Slow Projected Climate Disruption?
• Concept 19-3 To slow the projected rate of atmospheric warming and climate change, we can increase energy efficiency, sharply reduce greenhouse gas emissions, rely more on renewable energy resources, and slow population growth.

Dealing with Climate Disruption Is Difficult
• Global problem with long-lasting effects
• Long-term political problem
• Harmful and beneficial impacts of climate change unevenly spread
• Many proposed actions disrupt economies and lifestyles
• Humans don’t deal well with long-term threats

Possible Climate-Change Tipping Points
Fig. 19-15, p. 511

Fig. 19-15, p. 511
Atmospheric carbon level of 450 ppm
Melting of all Arctic summer sea ice
Collapse and melting of the Greenland ice sheet
Severe ocean acidification, collapse of phytoplankton populations, and a sharp drop in the ability of the oceans to absorb CO2
Massive release of methane from thawing Arctic permafrost
Collapse and melting of most of the western Antarctic ice sheet
Severe shrinkage or collapse of Amazon rainforest
Tipping point

Science Focus: Science, Politics, and Climate
• 2006-2010: increase from 30% to 48% of Americans who think global warming is exaggerated
• Fossil fuel industries
• Play on public’s lack of knowledge of • How science works• Difference between weather and climate

What Are Our Options?
• Three approaches1. Drastically reduce the amount of greenhouse gas
emissions2. Devise strategies to reduce the harmful effects of
global warming3. Suffer consequences of inaction
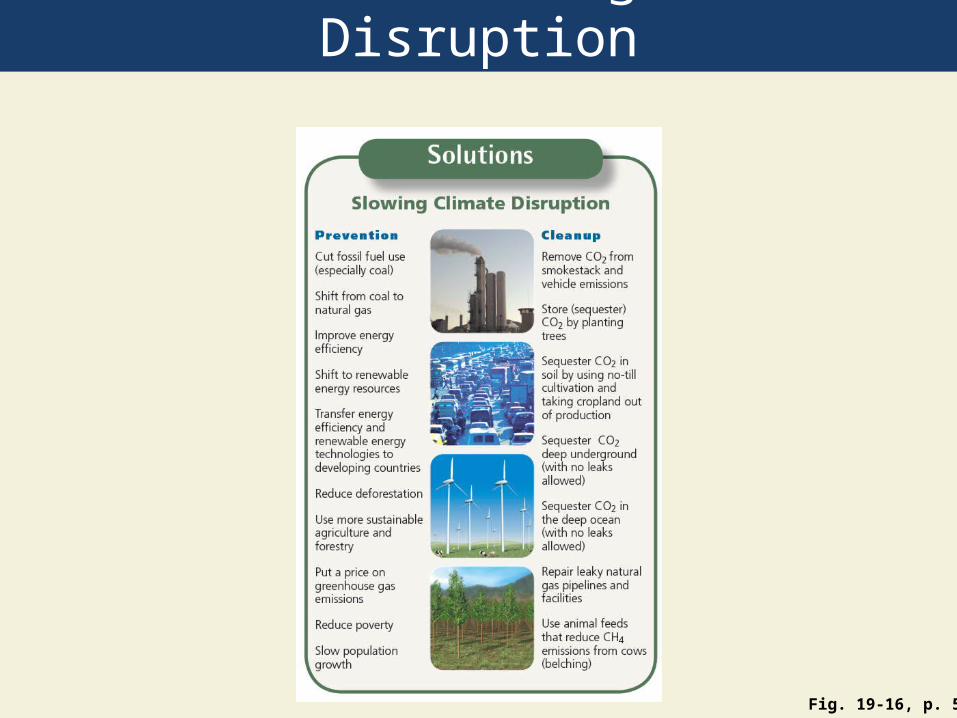
Solutions: Slowing Climate Disruption
Fig. 19-16, p. 513

Fig. 19-16, p. 513
Solutions
Cut fossil fuel use (especially coal)
Remove CO2 from smokestack and vehicle emissionsShift from coal to
natural gas Store (sequester) CO2 by planting trees
Prevention Cleanup
Slowing Climate Disruption
Improve energy efficiency
Transfer energy efficiency and renewable energy technologies to developing countries
Sequester CO2 deep underground (with no leaks allowed)
Reduce deforestationSequester CO2 in the deep ocean (with no leaks allowed)
Sequester CO2 in soil by using no-till cultivation and taking cropland out of production
Shift to renewable energy resources
Use more sustainable agriculture and forestry
Put a price on greenhouse gas emissions
Repair leaky natural gas pipelines and facilities
Reduce poverty Use animal feeds that reduce CH4 emissions from cows (belching)Slow population growth

Individuals Matter: John Sterman’s Bathtub Model
• Atmosphere as a bathtub
• Inputs of CO2
• Ways CO2 is removed from atmosphere

Bathtub Model of CO2 in Atmosphere
Fig. 19-D, p. 512

Fig. 19-D, p. 512
9.1 billion metric tons
a year 450 parts per milion
tipping point)
271 Preindustrial level200
100
5 billion metric tons a
year
0
Remains in atmosphere for up to 200 years 45%
Absorbed by plants and soils 30%
Absorbed by oceans 25%Excess CO 2 = 4.1 billion metric tons a year
Absorbed by sediments and rocks <1%
390 —2010 average

Prevent and Reduce Greenhouse Gas Emissions
• Improve energy efficiency to reduce fossil fuel use
• Increased use of low-carbon renewable energy resources
• Stop cutting down tropical forests
• Shift to more sustainable and climate-friendly agriculture
Collect Greenhouse Gas Emissions and Stash Them Somewhere
• Solutions1. Massive global tree planting; how many?2. Restore wetlands that have been drained for
farming3. Plant fast-growing perennials on degraded land4. Preserve and restore natural forests5. Promote biochar6. Seed oceans with iron to stimulate growth of
phytoplankton7. Carbon capture and storage – from coal-burning
plants

Science Focus: Is Capturing and Storing CO2 the Answer?
• Carbon capture and storage (CCS)
• Several problems with this approach• Large inputs of energy to work• Increasing CO2 emissions
• Promotes the continued use of coal (world’s dirtiest fuel)
• Effect of government subsidies and tax breaks• Stored CO2 would have to remain sealed forever: no
leaking
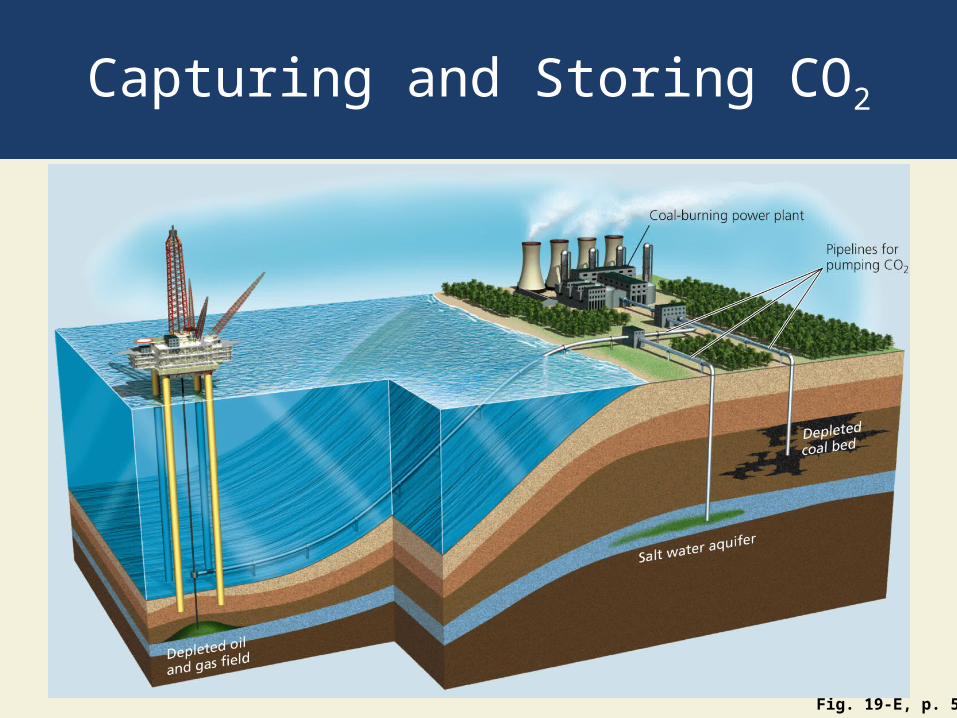
Capturing and Storing CO2
Fig. 19-E, p. 515

Fig. 19-E, p. 515
Coal-burning power plant
Pipelines for pumping CO2

Some Propose Geo-Engineering Schemes to Help Slow Climate Change (1)
• Last resort, if other methods and policies fail
• Injection of sulfate particles into the stratosphere• Would it have a cooling effect?• Would it accelerate O3 depletion?
• Giant mirrors in orbit around earth
• Large pipes to bring nutrients from bottom of ocean to top to promote algae growth

Some Propose Geo-Engineering Schemes to Help Slow Climate Change? (2)
• Doesn’t address the continued build-up of CO2 in the atmosphere
• All depend on costly and complex plans
• If any of these fixes fail, what about a rebound effect?

Governments Can Help Reduce the Threat of Climate Disruption
1. Strictly regulate CO2 and CH4 as pollutants
2. Carbon tax on fossil fuels
3. Cap-and-trade approach
4. Increase subsidies to encourage use of energy-efficient technology
5. Technology transfer
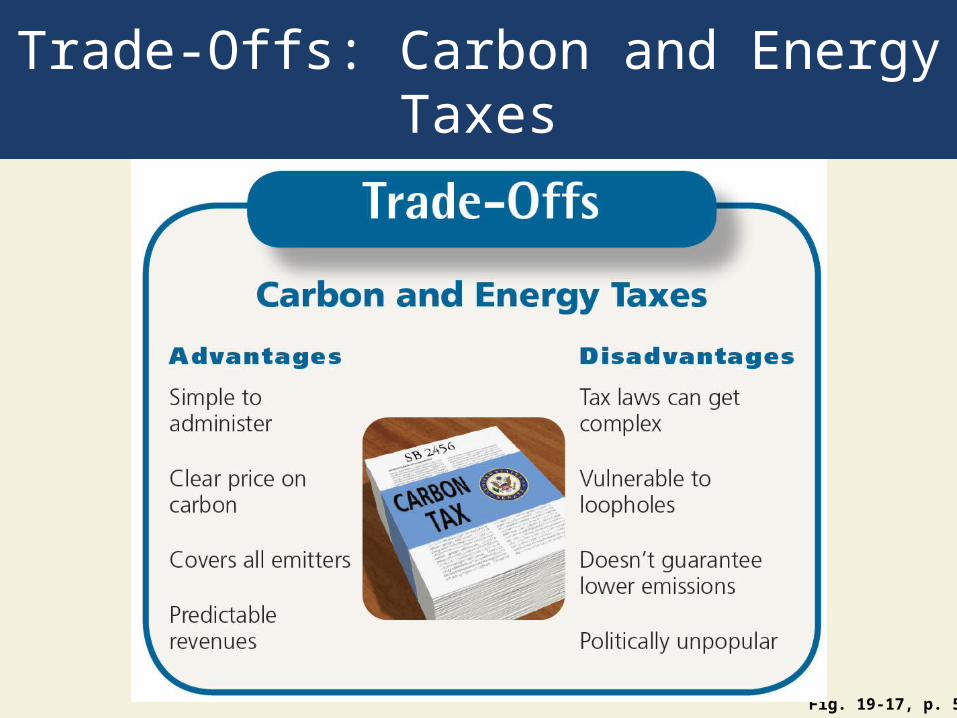
Trade-Offs: Carbon and Energy Taxes
Fig. 19-17, p. 516

Fig. 19-17, p. 516
Trade-Offs
Carbon and Energy Taxes
Advantages Disadvantages
Simple to administer Tax laws can get complex
Clear price on carbon Vulnerable to loopholes
Doesn’t guarantee lower emissions
Covers all emitters
Predictable revenuesPolitically unpopular

Trade-Offs: Cap and Trade Policies
Fig. 19-18, p. 516

Fig. 19-18, p. 516
Cap and Trade Policies
Advantages Disadvantages
Clear legal limit on emissions
Revenues not predictable
Rewards cuts in emissions
Record of successRich polluters can keep polluting
Vulnerable to cheating
Low expense for consumers
Puts variable price on carbon
Trade-Offs

Science Focus: What Is a Pollutant?
• Pollutant:• A chemical or any other agent that proves harmful to
the health, survival, or activities of humans or other organisms
• Carbon dioxide now classified as a pollutant• Concentration of carbon dioxide as the key factor

Governments Can Enter into International Climate Negotiations
• The Kyoto Protocol• 1997: Treaty to slow climate change• Reduce emissions of CO2, CH4, and N2O by 2012 to
5.2% of 1990 levels• Not signed by the U.S.
• 2009 Copenhagen• Nonbinding agreement

Some Governments Are Leading the Way• Costa Rica: goal to be carbon neutral by 2030
• China and India must change energy habits
• U.S. cities and states taking initiatives to reduce carbon emissions• California• Portland

Some Companies and Schools Are Reducing Their Carbon Footprints (1)• Major global companies reducing greenhouse gas emissions
• Alcoa• DuPont• IBM• Toyota• GE• Wal-Mart
• Fluorescent light bulbs• Auxiliary power units on truck fleets

Some Companies and Schools Are Reducing Their Carbon Footprints (2)• Colleges and universities reducing greenhouse gas
emissions• Oberlin College, Ohio, U.S.• 25 Colleges in Pennsylvania, U.S.• Yale University, CT, U.S.
• What is your carbon footprint?
• What can you do?
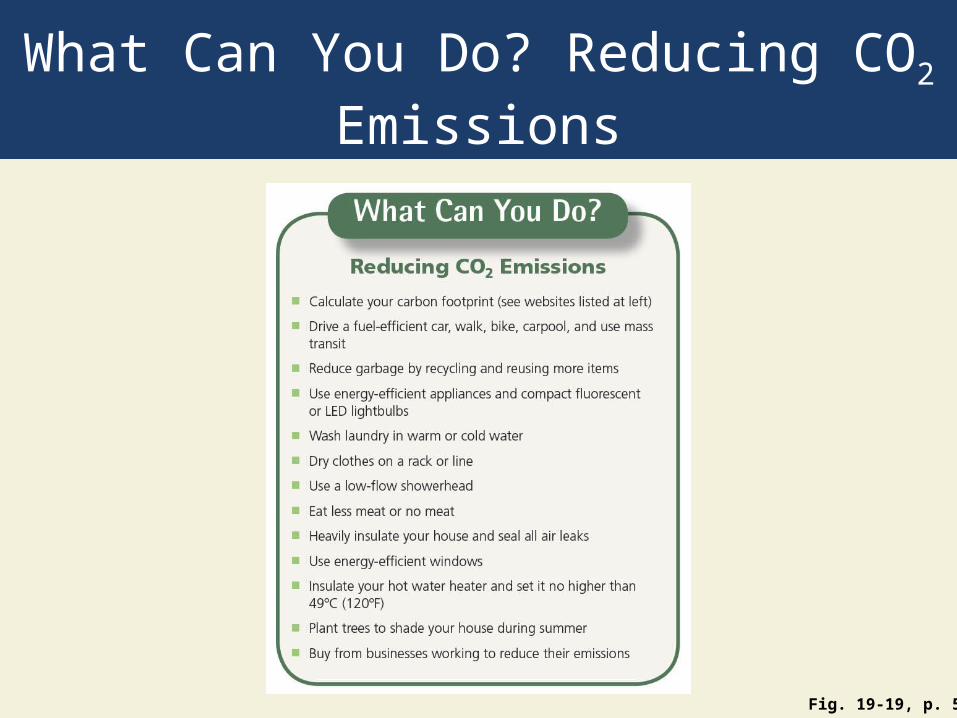
What Can You Do? Reducing CO2 Emissions
Fig. 19-19, p. 519

We Can Prepare for Climate Disruption (1)
• Reduce greenhouse gas emissions as much as possible
• Move people from low-lying coastal areas
• Take measures against storm surges at coast
• Cooling centers for heat waves

We Can Prepare for Climate Disruption (2)
• Prepare for more intense wildfires
• Water conservation, and desalination plants

Ways to Prepare for the Possible Long-Term Harmful Effects of Climate Disruption
Fig. 19-20, p. 520

Fig. 19-20, p. 520
Develop crops that need less water
Waste less water
Connect wildlife reserves with corridors Move people away
from low-lying coastal areas
Move hazardous material storage tanks away from coast
Stockpile 1- to 5-year supply of key foods
Prohibit new construction on low-lying coastal areas or build houses on stilts
Expand existing wildlife reserves toward poles

A No-Regrets Strategy
• What if climate models are wrong and there is no serious threat of climate disruption?
• No-regrets strategy• Environmental benefits• Health benefits• Economic benefits• Reduce pollution and energy use• Decrease deforestation• Promote biodiversity

19-4 How Have We Depleted O3 in the Stratosphere and What Can We Do? • Concept 19-4A Our widespread use of certain
chemicals has reduced ozone levels in the stratosphere, which has allowed more harmful ultraviolet radiation to reach the earth’s surface.
• Concept 19-4B To reverse ozone depletion, we must stop producing ozone-depleting chemicals and adhere to the international treaties that ban such chemicals.

Our Use of Certain Chemicals Threatens the Ozone Layer
• Ozone thinning • Seasonal depletion in the stratosphere• Antarctica and Arctic• Affects Australia, New Zealand, South America, South
Africa
• 1984: Rowland and Molina • CFCs were depleting O3
• Other ozone-depleting chemicals

Natural Capital Degradation: Massive Ozone Thinning over Antarctica in 2009
Fig. 19-21, p. 521
Individuals Matter: Rowland and Moline—A Scientific Story of Courage and Persistence • Research• CFCs are persistent in the atmosphere• Rise into the stratosphere over 11-20 years• Break down under high-energy UV radiation• Halogens produced accelerate the breakdown of O3 to
O2
• Each CFC molecule can last 65-385 years
• 1988: Dupont stopped producing CFCs
• 1995: Nobel Prize in chemistry

Why Should We Worry about Ozone Depletion?
• Damaging UV-A and UV-B radiation • Increase eye cataracts and skin cancer
• Impair or destroy phytoplankton• Significance?

Natural Capital Degradation: Effects of Ozone Depletion
Fig. 19-22, p. 522
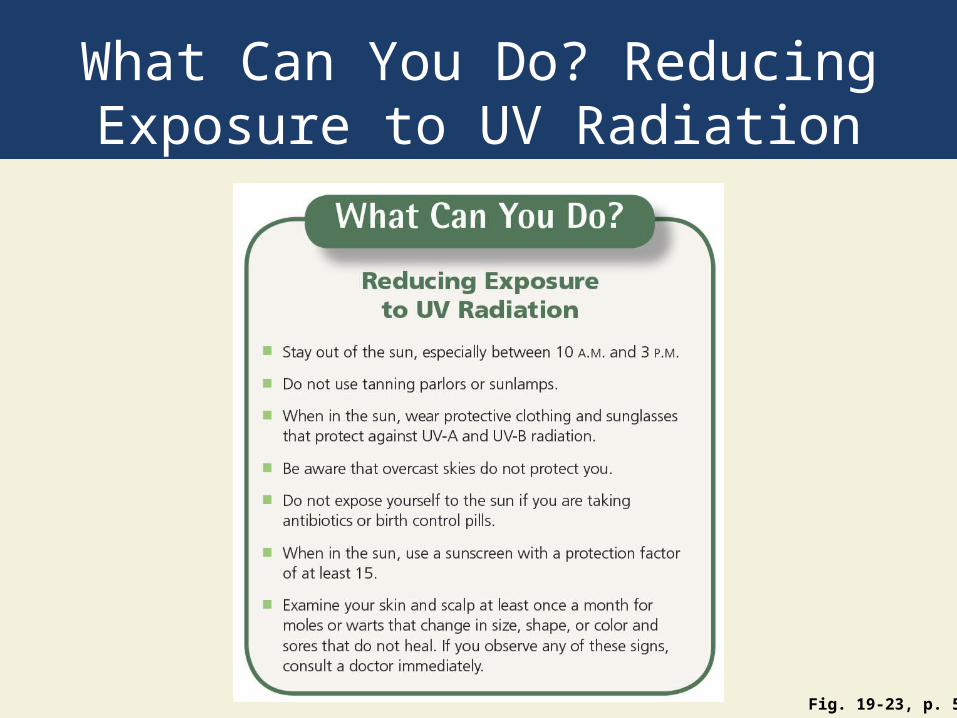
What Can You Do? Reducing Exposure to UV Radiation
Fig. 19-23, p. 523

We Can Reverse Stratospheric Ozone Depletion (1)
• Stop producing all ozone-depleting chemicals
• 60–100 years of recovery of the O3 layer
• 1987: Montreal Protocol
• 1992: Copenhagen Protocol
• Ozone protocols: prevention is the key

We Can Reverse Stratospheric Ozone Depletion (2)
• Substitutes for CFCs are available
• More are being developed
• HCFC-22• Substitute chemical• May still be causing ozone depletion• 2009: U.S. asks UN for mandatory reductions in HFC
emissions through Montreal Protocol

Three Big Ideas
1. Considerable scientific evidence indicates that the earth’s atmosphere is warming, mostly because of human activities, and that this is likely to lead to significant climate disruption during this century that could have severe and long-lasting harmful consequences.

Three Big Ideas
2. Reducing the projected harmful effects of rapid climate disruption during this century requires emergency action to increase energy efficiency, sharply reduce greenhouse gas emissions, rely more on renewable energy resources, and slow population growth.
3. We need to continue phasing out the use of chemicals that have reduced ozone levels in the stratosphere and allowed more harmful ultraviolet radiation to reach earth’s surface.