17 report of the scientific, technical and economic ... · 2.2 summary of stecf comments on...
TRANSCRIPT

1
COMMISSION OF THE EUROPEAN COMMUNITIES
Brussels, 6.5.2004 SEC(2004) 573
COMMISSION STAFF WORKING PAPER
17th REPORT OF THE SCIENTIFIC, TECHNICAL AND ECONOMIC
COMMITTEE FOR FISHERIES
Brussels, 03-07 November 2003
This report does not necessarily reflect the view of the European Commission and in no way anticipates the Commission’s future policy in this area.

2
TABLE OF CONTENTS
1 INTRODUCTION.................................................................................................................................... 5 1.1 BRIEFING OF MR JOHN FARNELL, DIRECTOR FOR CONSERVATION POLICY ....................................... 5 1.2 STECF BUREAU ELECTION............................................................................................................... 6 1.3 LIST OF PARTICIPANTS....................................................................................................................... 7 1.4 TERMS OF REFERENCE ....................................................................................................................... 8
1.4.1 Additional terms of reference ...................................................................................................... 9 2 REVIEW OF SCIENTIFIC ADVICE ON STOCKS OF COMMUNITY INTEREST .................. 10
2.1 INTRODUCTION................................................................................................................................ 10 2.2 SUMMARY OF STECF COMMENTS ON SPECIFIC STOCKS ................................................................. 13
2.2.1 Anchovy (Engraulis encrasicolus) in Division VIII (Bay of Biscay).......................................... 13 2.2.2 Anchovy (Engraulis encrasicolus) in Sub-area IX..................................................................... 13 2.2.3 Whiting (Merlangius merlangus) Vb(EU zone), VI, XII & XIV ................................................. 13 2.2.4 Cod (Gadus morhua), in the North Sea (IIa, IIIa Skagerrak, IV and VIId)............................... 14 2.2.5 Cod in Division VIa (West of Scotland)..................................................................................... 15 2.2.6 Cod (Gadus morhua) in area VIIa (Irish Sea Cod) ................................................................... 15 2.2.7 Cod (Gadus morhua) in areas VIIe-k ........................................................................................ 16 2.2.8 Haddock in Division VIa (West of Scotland) ............................................................................. 16 2.2.9 Haddock in Division VIIb-k (Celtic Sea and West of Ireland)................................................... 17 2.2.10 Hake (Merluccius merluccius) in Division Vb (1), VI and VII, and XII, XIV (Northern hake) 17 2.2.11 Hake (Merluccius merluccius) in Divisions VIIIc, IX and X (Southern hake) ...................... 17 2.2.12 Herring (Clupea harengus) in the North Sea (Sub-area IV) including components of this stock in Divs. IIa, IIIa and VIId ............................................................................................................... 18 2.2.13 Herring (Clupea harengus) in the Celtic Sea (VIIg and VIIa South), and in VIIj ................ 18 2.2.14 Norway lobster (Nephrops norvegicus) in Division VIIIc .................................................... 18 2.2.15 Norway lobster (Nephrops norvegicus) in Division IX and X. ............................................. 19 2.2.16 Anglerfish (Lophius sp.) in VIIIc, IX, X ................................................................................ 19 2.2.17 Plaice (Pleuronectes platessa) in Subarea IV (North Sea) ................................................... 19 2.2.18 Sandeel (Ammodytidae) in the North Sea (IV) ...................................................................... 20 2.2.19 Deepwater fish (several species) in the Northern North Sea (IVA), IIIa, Vb, VI, VII, VIII, IX, X and XII. 20
2.2.19.1 Ling (spp). ....................................................................................................................................... 20 2.2.19.2 Tusk (spp). ....................................................................................................................................... 21 2.2.19.3 Black scabbardfish (Aphanopus carbo) ........................................................................................... 21 2.2.19.4 Roundnose grenadier (Coryphaenoides rupestris) ........................................................................... 21 2.2.19.5 Deepwater sharks............................................................................................................................. 21
2.2.20 Bluefin (Thunnus thynnus), Eastern Atlantic and Mediterranean ........................................ 22 2.2.21 Albacore (Thunnus alalunga), North Atlantic Ocean ........................................................... 23 2.2.22 Albacore (Thunnus alalunga), Mediterranean Sea............................................................... 23 2.2.23 Small tunas (Black skipjack, Frigate tuna, Atlantic bonito, Spotted Spanish mackerel, King mackerel), Atlantic and Mediterranean ................................................................................................... 23 2.2.24 Marlins, spearfish and sailfish (Bill fishes) - Mediterranean ............................................... 23 2.2.25 Luvarus (Luvarus imperialis) – Mediterranean.................................................................... 23 2.2.26 Spurdog (Squalus acanthias) in the North-east Atlantic....................................................... 24 2.2.27 Blue shark (Prionace glauca) in the north-east Atlantic ...................................................... 24 2.2.28 Cod (Gadus morhua) in NAFO Divisions 2J, 3K and 3L. .................................................... 24 2.2.29 Greenland Halibut (Reinhardtius hippoglossoides) in NAFO Sub-area 2 and Divisions 3KLMNO 24
2.3 ICES ADVICE FOR MIXED FISHERIES. .............................................................................................. 24 2.3.1 Mixed fisheries advice for Iberian waters (Div. VIIIc and Sub-areas IX and X)....................... 25
2.4 SAMPLING IN NORTHERN IRELAND.................................................................................................. 27 2.5 STOCKS SUBJECT TO TAC BUT FOR WHICH ADVICE IS NOT AVAILABLE FROM SCIENTIFC BODIES . 27
3 ANNUAL ECONOMIC REPORT 2003 AND ECONOMIC INTERPRETATION OF ACFM ADVICE ........................................................................................................................................................... 31

3
3.1 SUMMARY OF THE ANNUAL ECONOMIC REPORT ............................................................................. 31 3.2 ECONOMIC INTERPRETATION OF ACFM ADVICE (EIAA MODEL) ................................................... 33 3.3 ECONOMIC INTERPRETATION OF THE “MIXED FISHERIES” SCENARIO’S ........................................... 38
3.3.1 Background and inputs from the MTAC model ......................................................................... 38 3.3.2 EIAA model calculation of the “Mixed fisheries” scenarios ..................................................... 41
4 ELASMOBRANCHS FISHERIES....................................................................................................... 50 4.1 STECF COMMENTS AND RECOMMENDATIONS ................................................................. 50
5 MEDITERRANEAN ............................................................................................................................. 52 5.1 MEDITERRANEAN FISHERIES............................................................................................................ 52 5.2 FUTURE WORK ON ECONOMIC ASPECTS OF MEDITERRANEAN FISHERIES........................................ 52
5.2.1 Background................................................................................................................................ 52 5.2.2 Terms of reference ..................................................................................................................... 53
6 MIXED FISHERIES.............................................................................................................................. 54 6.1 REVIEW OF MIXED FISHERIES REPORT ............................................................................................ 54
6.1.1 Species considered..................................................................................................................... 54 6.1.2 Use of landings data .................................................................................................................. 55 6.1.3 Choice of Fishing mortalities .................................................................................................... 55 6.1.4 Fleets.......................................................................................................................................... 55 6.1.5 Methodology. ............................................................................................................................. 56 6.1.6 Implementation Uncertainty. ..................................................................................................... 56 6.1.7 Choice of Scenarios ................................................................................................................... 57 6.1.8 Area Specific Analyses............................................................................................................... 57
6.1.8.1 a) North Sea MTAC analysis........................................................................................................... 57 6.1.8.2 b) North Sea spatial analysis............................................................................................................ 62 6.1.8.3 c) Irish Sea MTAC analysis............................................................................................................. 64
6.2 OVERALL CONCLUSIONS ................................................................................................................. 69 7 INDICATOR OF ENVIRONMENTAL INTEGRATION IN THE CFP ......................................... 69
7.1 BACKGROUND............................................................................................................................ 69 7.2 STECF COMMENTS ON THE TWO REPORTS ON FISHERY AND ENVIRONMENT .......... 70
7.2.1 The “development of preliminary indicators of environmental integration of the common fisheries policy” report ............................................................................................................................ 71 7.2.2 The ad hoc expert group on indicators report ........................................................................... 72
7.3 STECF COMMENTS AND RECOMMENDATIONS .................................................................. 73 8 SAMPLING SCHEME OF CATCHES OF DEEP SEA FISHERIES.............................................. 76
8.1 STECF COMMENTS AND RECOMMENDATIONS .................................................................. 76 9 AMENDMENTS TO COMMISSION REGULATION (EC) NO 1639/2001 ................................... 80
9.1 BACKGROUND ................................................................................................................................. 80 9.2 ACTION ........................................................................................................................................... 80
9.2.1 Appendix XII .............................................................................................................................. 80 9.2.2 Appendix XV .............................................................................................................................. 81 9.2.3 Appendix XVI ............................................................................................................................. 81
10 OTHER MATTERS .............................................................................................................................. 82 10.1 ADDITIONAL REQUESTS TO STECF ................................................................................................. 82
10.1.1 Additional request on Anchovy in the Bay of Biscay ............................................................ 82 10.1.2 Additional request from the Commission on the quality of ICES advice .............................. 82
10.1.2.1 Catch forecasts................................................................................................................................. 82 10.1.2.2 Framework for advice...................................................................................................................... 83
10.1.3 STECF comment on short notice additional requests........................................................... 85 10.2 SUBGROUPS COORDINATORS. .......................................................................................................... 85 10.3 ECONOMIC ISSUES FOR CONSIDERATIONS - FUTURE ORGANIZATIONS OF DATA COLLECTION/DATA HANDLING ON ECONOMIC ISSUES ................................................................................................................... 86 10.4 PARTICIPATION OF THE STECF’S MEMBERS AT THE MEETING OF THE ACFA .................................. 86 10.5 STECF ACTIVITIES IN 2003AND PLANNING OF MEETINGS FOR 2004............................................ 86
11 ANNEX I LIST OF PARTICIPANTS ................................................................................................. 92
12 ANNEX II APPENDICES TO REGULATION (EC) NO 1639/2001 ................................................. 96

4
12.1 APPENDIX XII (SECTION E) ........................................................................................................... 103 12.2 APPENDIX XV (SECTION H) .......................................................................................................... 121 12.3 APPENDIX XVI (SECTION I) .......................................................................................................... 135
13 ANNEX III STECF OPINION AND EVALUATION OF THE REPORT BY SGMOS ON RECOVERY PLANS FOR SOUTHERN HAKE AND NORWAY LOBSTER IN ICES AREAS VIIIC AND IXA. 145
13.1 SUMMARY OF THE REPORT ............................................................................................................ 145 13.1.1 Background. (Sects. 0-3)..................................................................................................... 145 13.1.2 Recovery targets. (Sect. 4) ................................................................................................. 145
13.1.2.1 Hake............................................................................................................................................... 145 13.1.2.2 Nephrops........................................................................................................................................ 146
13.1.3 Current Management measures. (Sect. 5)........................................................................... 146 13.1.4 Management options and recovery plans. (Sect. 5) ............................................................ 146 13.1.5 Evaluation of recovery strategies. (Sects. 6 & 7)................................................................ 147
13.2 STECF COMMENTS AND CONCLUSIONS......................................................................................... 147 13.2.1 Hake. ................................................................................................................................... 147 13.2.2 Nephrops. ............................................................................................................................ 148

5
1 INTRODUCTION The new Scientific, Technical and Economic Committee for Fisheries (STECF) has been nominated by the European Commission (Decision 2004/C 42/091). Its mandate will run from 1 November 2003 to 31 October 2005.
The 17th meeting of the STECF was convened at the Conference Centre “Albert Borschette” in Brussels from 3 to 7 November 2003.
The STECF meeting was preceded by the joint meeting of the subgroups SGRST and SGECA (27-31 October 2003). These Sub-groups prepared reports reviewing the status of stocks of Community interest and the economic implications of the ACFM advice for 2004.
Mr Tore Gustavvsson in his capacity of Vice-Chairman of the former STECF opened the meeting.
The Secretariat of the STECF welcomed the participants wishing them success in their deliberations and recalled the need to nominate the Bureau of the new STECF, the coordinators of the permanent STECF subgroups and the STECF representatives in the Advisory Committee for Fisheries and Aquaculture (ACFA).
The terms of reference for the meeting were surveyed and briefly discussed to arrange the details of the meeting. The session was managed through alternation of plenary and parallel working groups meetings.
The 17th meeting of the STECF was also attended also by scientific observers, from the Countries that will accede to the European Union from 1 May 2004.
Mrs Alyne Delaney attended the meeting with observer status in her capacity of researcher for the EC funded project “ Policy and Knowledge in Fisheries Management” (PKFM) that is investigating knowledge production and policy decision-making in European fisheries.
1.1 BRIEFING OF MR JOHN FARNELL, DIRECTOR FOR CONSERVATION POLICY Mr John Farnell, Director of the Conservation Policy Directorate of the Directorate General for Fisheries of the European Commission, welcomed the members of the STECF and the observers of the forthcoming Acceeding Countries to the EU.
Mr Farnell briefed the participants on the expectations of the Commission from this meeting and on the important role that STECF has played and must continue to play with respect to the following roles:
• to scrutinise and improve the quality of scientific advice
• to advise the Commission on specific matters not routinely covered by other advisory bodies
• to advice the Commission on monitoring and research needs
• and, even more importantly, to integrate economic and biological views of the European fisheries.
Mr Farnell also highlighted that ensuring sustainable Community fisheries calls for a more efficient and cost-effective way to utilise the scientific expertise and research Insitute facilities in the EU member States. To this end, the multiannual perspective enshrined in the recently adopted reform of the CFP, together with the Community data collection 1 OJ C 42 of 18.2.2004, p.15

6
framework programme, should ensure a better exploitation of the scientific resources and a higher standard of scientific advice. He stressed, in particular, the need to avoid duplication of roles between the various bodies delivering scientific advice and that greater co-ordination in the planning of research and monitoring priorities is required. To this end, he presented the possibility of establishing a common rolling programme on a time scale of 18 months at Community level ( i.e. Commission and Member States) in order to set up research and monitoring priorities and focus more effort on few specific matters and also to better comply with obligations in Regional Fisheries Organizations.
Mr Farnell also stressed that STECF can play a major role in delivering scientific advice at short notice or on specific issues not routinely covered by the other scientific bodies.
He pointed out that, in addition to a greater co-ordination and planning, greater financial support is needed both at Community and national level to support both fishery investigations and provision of fishery management advice. He recalled that the Commission has already issued a Communication on scientific advice and that based on the latest discussions with member States and research Institutions undertaken in the course of 2003 and 2004 the Commission will issue another Communication, to further address the matter by the end of 2004.. As a result of initial reflections, the Commission has made available a certain amount of funding which from 2004 on a pilot basis, will be used to support ad hoc desk and field studies, and to fund research Institutes, Universities and private research groups for making available their human resources. In addition, individual experts will also be eligible for funding for their independent participation to scientific meetings including STECF and its working groups.
On a longer term basis and hopefully starting from 2005, the participation and funding of scientists at both STECF meetings and other ad hoc working groups will be ensured by selecting experts from a dedicated data base established through a call for expressions of interest.
1.2 STECF BUREAU ELECTION The STECF members nominated candidates for election to the STECF Bureau. In accordance with the procedure given in Commission Decision 93/619/EC the following members were elected:
Dr John Casey , Chairman (Fisheries Biologist)
Dr Tore Gustavsson, Vice-Chariman (Fisheries Economist)
Dr Antonio Di Natale, Vice-Chairman (Fisheries Biologist)

7
1.3 LIST OF PARTICIPANTS The complete address of the participants is listed in Annex I.
Members of the STECF:
Ardizzone,Giandomenico
Bertignac, Michel
Camiñas, Juan Antonio
Cardinale, Massimiliano
Casey, John (Chairman)
Fariña, Celso Antonio
Di Natale, Antonio
Dickey, Collas Mark
Franquesa, Ramon
Gustavsson, Tore
Keatinge, Michael
Lokkegaard, Jorgen
Messina, Gaetano
Munch-Petersen, Sten
Officer, Rick
Perraudeau, Yves
Pestana, Graça
Petrakis, George
Rätz, Hans Joachim
Kuikka, Sakari
Simmonds, John
Somarakis, Stylianos
Vanhee, Willy
Virtanen, Jarno
Invited experts:
Kees, Taal
Murta, Alberto
Poviliunas, Justas
Saat, Toomas
Váradi, László
Vitins, Maris
Zbigniew, Karnicki
STECF Secretariat:
Biagi, Franco (European Commission)

8
1.4 TERMS OF REFERENCE
STECF was asked to address the following issues: 1. Institutional aspects, information from the Commission, planning.
1.1. Election of STECF Bureau
1.2. Mandate for the STECF November 2003 – November 2005: tasks, organisation, role of subgroups coordinators, planning 2003/2004.
1.3. Data collection. Council Regulation (EC) 1543/2000:
1.3.1. Procedure for adoption of the forthcoming SGRN report (1-5 December 2003) addressing MS derogations for 2004 programmes.
1.3.2. STECF support to the group of consultants on setting up a data base for data collection: follow up.
1.3.3. Pilot projects: call for tenders
1.4. Financial issues
2. To review the scientific advice on stocks of Community interest and to elaborate a report on the current state of these stocks.
STECF is requested to update the stock status report of November 2002 using the most recent scientific information. STECF is invited to comment taking into consideration the mixed nature of several fisheries. The basic document for this task is the report prepared during the SGRST-SGECA joint meeting of 27-31 October last. STECF is requested to review, comment as appropriate and endorse this report.
3. To review and comment as appropriate the outcomes of the EIAA model based on the latest ACFM advice.
STECF is requested to review, comment as appropriate and endorse the report prepared during the SGRST-SGECA joint meeting of 27-31 October last. STECF is requested to interpret the outcomes of the EIAA model taking into consideration the mixed nature of several fisheries.
4. Elasmobranches fisheries
STECF is requested to review, comment as appropriate and endorse the report the prepared by the SGRST (22-25 July) on this matter. STECF shall also take into consideration the previous report (SEC(2002) 1160).
5. Mediterranean fisheries
STECF is requested to review, comment as appropriate and endorse the report prepared by the SGMED (24-28 March) on this matter. STECF shall also take into consideration the previous report (SEC(2002)1374 ).
6. Mixed fisheries.
STECF is requested to review, comment as appropriate and endorse the report of the ad hoc working group ( 21-25 October) on this matter.
7. Indicators of environmental integration in the CFP.

9
The Commission is committed to integrate environmental protection requirements into the CFP. The process of integration should be monitored by a system based on indicators; a pilot system of indicators shall be set up by the end of 2003 (COM(2002) 186 final).
DG for Fisheries commissioned, through a call for tender, a study that has delivered the report “Development of preliminary indicators of environmental integration of the CFP” .A preliminary evaluation of the above report will be undertaken by an ad hoc group on 28-29 October in order to prepare the work for the STECF. STECF is requested to review and comment as appropriate both the above said reports and propose a selection of indicators of environmental integration. On the basis of the STECF advice and selected indicators, the Commission will design an experimental monitoring system. Before the end of 2005, the Commission will submit to the Council and the European Parliament a report on the environmental performance of the CFP, based on the monitoring system.
8. Sampling scheme of catches of deep sea fisheries.
STECF is requested to review the sampling plans for deep-sea species that have been submitted by Member States to the Commission. These plans concern the deployment of observers and sampling at port. Council Regulation 2347/2002 (and especially Article 8 thereof) describes the obligations of Member States in respect of these plans. STECF should conduct a scientific and statistical evaluation, and should conclude on the extent to which each sampling plan conforms to the objective of ensuring the collection of representative data that are adequate for the assessment and management of deep-sea stocks. Existing management measures for deep-sea species are principally the TACs defined in Council Regulation 2340/2002 and the vessel licensing and effort management scheme defined in Council Regulation 2347/2002.
9. Amendments to Commission Regulation (EC) No 1639/2001
The Commission is currently in the process of amending Regulation (EC) No 1639/2001 of 25 July 2001 establishing the minimum and extended Community programs for the collection of data in the fisheries sector and laying down detailed rules for the application of Council Regulation (EC) No 1543/2000. The STECF-SGRN meeting (7-11 July) and the STECF opinion delivered by correspondence have not been able to completely deal with sampling intensity issues. Therefore STECF is requested to review the draft tables of Appendixes XII, XV and XVI and to amend as adequate the cells highlighted with a question mark.
10. Other matters
1.4.1 Additional terms of reference
In addition to the above points the Commission requested STECF to address the following items:
A. Catch forecasts
In order to improve the precision of catch forecasts, it may be appropriate to take account of recent changes in management measures such as reduced TACs, effort management and changes in technical measures when making in-year assumptions in ICES forecasts. STECF is requested to consider:

10
• what additional up-to-date information from the commercial fisheries and national administrations could be used in order to improve forecasting to take account of the current effects of management measures;
• the extent to which the lack of such data has impaired the quality of forecasts in recent years.
B. Framework for advice
In the single stock advice for 2004 ICES has applied the following approach: • For stocks outside safe biological limits ICES has provided advice to increase the
spawning stock biomass above Bpa. If this is not possible within one year ICES recommends a recovery plan be established. For stocks where it is not possible to achieve Blim within one year ICES recommends no fishing until the stock has increased to above Blim.
• For stocks harvested outside safe biological limits ICES recommends reduction in F to below Fpa;
• For stocks within safe biological limits ICES advises that the fishing mortality should be kept below Fpa.
STECF is requested to comment on the ICES approach to formulating advice and especially on the: • conformity of the approach with international agreements concerning precautionary
fish stock management; • social and economic implications of applying such an advisory rule in practice; • proportionality of severity of advised conservation measures to perceived biological
risk; • use of yield-based criteria in formulating advice; • incorporation of stability criteria when providing advice; • sensitivity to revised estimates of historical stock size and fishing mortality.
2 REVIEW OF SCIENTIFIC ADVICE ON STOCKS OF COMMUNITY INTEREST
2.1 INTRODUCTION The STECF review of stocks of Community interest is published in the report SEC (2004) 372. The review presents summary information on the state of stocks and management advice for stocks of Community interest throughout the world including those in Third Country and international waters. In undertaking the review, STECF has consulted the most recent reports on stock assessments and advice from appropriate scientific advisory bodies or other readily available literature, and has attempted to summarise it in a common format. The review is partially incomplete, since in some cases, appropriate information was not readily available to the group. For some stocks the review remains unchanged from the 2002 report, since no new information on the status of or advice for such stocks was available at the time the review took place. This does not mean that no such information exists, merely

11
that STECF did not have access to it. A comment to this effect is included in the relevant stock sections.
Nevertheless, the report provides summary assessment and management advice on about 300 stocks of interest to the Community.
STECF notes that the term ‘stock’ in some cases, may not reflect a likely biological unit, but rather a convenient management unit. In specific cases STECF has drawn attention to this fact. STECF also is of the opinion, that as far as possible management areas should coincide with stock assessment areas.
For each stock, a summary of the following information is provided:
STOCK: [Species name, scientific name], [management area]
FISHERIES: fleets prosecuting the stock, management body in charge, economic importance in relation to other fisheries, historical development of the fishery, potential of the stock in relation to reference points or historical catches, current catch (EU fleets’ total), any other pertinent information.
SOURCE OF MANAGEMENT ADVICE: reference to the management advisory body.
MANAGEMENT AGREEMENT: where these exist.
PRECAUTIONARY REFERENCE POINTS: where these have been proposed.
STOCK STATUS: Reference points, current stock status in relation to these. STECF has included precautionary reference point wherever these are available.
RELEVANT MANAGEMENT ADVICE: summary of advice.
STECF COMMENTS: Any comments STECF thinks worthy of mention, including errors, omissions or disagreement with assessment or advice where appropriate.
STECF notes that the form of ICES advice for 2004 has changed and that it now includes area/based fisheries advice for stocks taken in mixed demersal fisheries. Accordingly this report includes a new Section 16 which addresses the mixed fishery advice from ICES together with STECF comments on that advice. The single stock summaries reflect the single stock advice provided by ICES. Such advice in the ICES report is now referred to as single stock exploitation boundaries.
Furthermore, brief overviews of the fisheries in some of the geographical regions where the Community has an interest have been introduced for the first time. These overviews are presently incomplete but it is the intention to extend the regional fishery overviews in future reports.
A list of reports and publications consulted is given at the end of the document. STECF recognises that in future the format of the stock review publication may evolve, taking into account comments from users of the publication.
The STECF review of scientific advice was drafted by the STECF Sub-group on Resource Status (SGRST, Chair, J. Casey) during its joint meeting with the Sub-group on Economic

12
Analyses (SGECA) of 27 – 31 October 2003, and subsequently finalised at the 17th STECF Plenary meeting (3 – 7 November 2003).
STECF acknowledges the painstaking efforts required in compiling the draft stock review and expresses it’s thanks to all participants for their valuable contributions. In recognition of their contribution the list of participants is given below:
Antonio Di NATALE
Celso FARIÑA
Enrico ARNERI
Georges PETRAKIS
Jim ELLIS (by correspondence)
John CASEY (Chair)
Julio Martinez PORTELA
Luis J Lopez ABELLAN (by correspondence)
Mariano GARCIA
Maurice CLARKE
Miguel Neves dos SANTOS
Paul FERNANDES
Peter ERNST
Raúl PRELLEZO
Sieto VERVER
Sten MUNCH-PETERSEN
Willem DEKKER (by correspondence)
Willy VANHEE

13
2.2 SUMMARY OF STECF COMMENTS ON SPECIFIC STOCKS In this section are reported some excerpts from the STECF report on stocks status (SEC (2004)372). The excerpts listed here are for those stocks for which STECF had comments in addition to those given by the relevant advisory body. Section numbers, quoted in the text of the following sub-sections, indicate the section numbering in the aforementioned stocks status report.
2.2.1 Anchovy (Engraulis encrasicolus) in Division VIII (Bay of Biscay)
RECENT MANAGEMENT ADVICE: ICES recommends that a preliminary TAC for 2004 be set to 11,000 t. A catch of this size will, in the case of poor recruitment, maintain the fishing mortality at the current level. This TAC should be re-evaluated in the middle of the year 2004, based on the development of the fishery and on the results from the acoustic and egg surveys in May-June 2004. Alternatively, the TAC could be calculated based on average recruitment. Such a TAC would be about twice the preliminary TAC proposed above. But in that case the allocation for the first half year should only be half of the preliminary TAC to assure that the total amount is not fished before the mid-year adjustment. This adjustment would include the possibility that the final TAC is below the preliminary TAC.
STECF COMMENTS: STECF agrees with the ICES assessment. STECF also considers that there are large inter-annual fluctuations in the spawning stock because recruitment is highly variable combined with anchovy’s short life span. The preliminary TAC should be set at a level where this TAC, should it become the total catch in the quota year, would provide a low risk of stock collapse even if the incoming year class is low. The year classes 2001 and 2002 were weak. A prediction based on a weak year class in 2004, suggest that fishing in 2004 should be restricted below 10,000 t and a preliminary TAC should be set at this level. ICES cannot in October predict the fishing possibilities for anchovy in the following year and ICES has therefore in recent years advised on TAC levels for the coming year, based on the setting of a preliminary TAC and later adjusting this TAC based on DEPM and acoustic survey results that become available in June.
STECF also agree that the development of harvest control rules should be investigated.
2.2.2 Anchovy (Engraulis encrasicolus) in Sub-area IX
RECENT MANAGEMENT ADVICE: ICES recommends that catches in 2004 be restricted to 4700 t (mean catches from the period 1988–2002 excluding 1995, 1998, 2001 and 2002). This level should be maintained until the response of the stock to the fishery is known.
STCEF COMMENTS: STECF agrees with the advice of ICES. Due to fact that the fishery is largely dependent on the incoming year class, STECF also considers that in-year monitoring and management should be considered.
2.2.3 Whiting (Merlangius merlangus) Vb(EU zone), VI, XII & XIV
STECF COMMENTS: Whilst, in general, agreeing with the ICES advice for this stock STECF also notes the following: Whereas an evaluation of the benefit of improvements in selectivity resulting from changes in mesh size will always remain difficult STECF considers that recent regulatory changes in mesh size may be of significant benefit for building the SSB. In the case of this stock these changes may contribute an increase up to about 30% SSB in 2005 if implemented in the

14
most optimistic circumstances (WGNSDS Technical Minutes, ICES/ACFM October 2003). STECF considers that such technical measures (including industry-initiated programs) should become a permanent feature of this fishery. The specific advice for this stock should be considered in light of additional comments in Section 16.2 that considers Regional Mixed fishery advice for the ICES area.
2.2.4 Cod (Gadus morhua), in the North Sea (IIa, IIIa Skagerrak, IV and VIId)
RECENT MANAGEMENT ADVICE: Given the very low stock size, the recent poor recruitments and the continued substantial catch [54 000 t in 2002], ICES recommends the implementation of a recovery plan to ensure a safe and rapid rebuilding of SSB to levels above Bpa. Such a recovery plan must include a provision for zero catch until the estimate of SSB is above Blim or other strong evidence of rebuilding is observed. In accordance with such a recovery plan ICES recommends a zero catch in 2004. The advice on the exploitation of this stock in 2004 is presented in the context of mixed fisheries and is found in Section 16.1. STECF COMMENTS: 1. STECF notes that the estimate of SSB for 2002 and 2003remains below 70,000 t
(Blim) and that F is estimated to have decreased from 2000-2002. STECF agrees with ICES, that the recent estimates of F and SSB are uncertain. Despite the uncertainty of these estimates the stock is clearly outside safe biological limits and in a state where the probability of stock recovery will remain low unless stringent management action is taken immediately.
2. STECF also notes that the results of the 2003 Fisherman’s survey largely complemented the result of the assessment in that the stock has increased slightly or remained at about the 2002 level.
3. STECF notes that existing recovery measures, were evaluated during the expert group meeting 29 April-7 May 2003. The evaluation of the effect of technical measures introduced for demersal towed gears indicated negligible benefit to landings or spawning biomass in medium term.
4. The Expert group concluded that the emergency closure of14 Feb-30 Apr 2001, was ineffective at protecting spawning cod, since the area did not cover the major part of the spawning stock and was too late, in that compensatory fishing may have already taken place earlier in the year. STECF Agrees with the findings of the Expert Group.
5. STECF notes that the ICES advice and forecasts do not consider the potential reduction in fishing mortality resulting from decommissioning and effort regulation in 2003. Furthermore the level of effort limitation, if any, proposed for 2004 is also unknown and consequently its impact is similarly unaccounted for in the advice. (Note STECF considers that these factors will act as F multipliers on catch forecasts for 2003 and 2004. If the level of these factors is determined their impact on catch forecasts could readily be evaluated).
6. STECF considers that technical measures (including industry-initiated programs) could be a tool in rebuilding this stock. Furthermore STECF advises that these measures should become a permanent feature of the fishery if cod is to be fished sustainably once it has recovered.
7. STECF notes that ICES evaluated the proposed re-building plans for North Sea cod and concluded that they are unlikely to lead to safe and rapid rebuilding. STECF endorses this conclusion.
8. STECF considers that the ICES advice is consistent with the objectives of the EU Norway agreement, particularly the objectives of: • ensuring a safe and rapid rebuilding of the stock (even though safe and rapid is
not defined) to a level in excess of 150,000 t (Bpa) and,
15
• making every effort to maintain a minimum level of SSB above 70,000 t (Blim).
2.2.5 Cod in Division VIa (West of Scotland)
RECENT MANAGEMENT ADVICE: The advice on the exploitation of this stock in 2004 is presented in the context of mixed fisheries and is found in Section 16.2. Given the very low stock size, the recent poor recruitments and the continued high fishing mortality, the implementation of a recovery plan which ensures a safe and rapid rebuilding of SSB to levels above Bpa has been advised. Such a recovery plan must include a provision for zero catch until the estimate of SSB is above Blim or other strong evidence of rebuilding is observed. In 2004 such a recovery plan would imply zero catch. STECF COMMENTS: 1. Whilst noting the ICES evaluation of the recovery plans and management measures for
this stock STECF considers that the current SSB is sufficiently below historic stock size that both the biological dynamics of the stock and the operations of the fisheries are unknown. Consequently historic experience and data are not considered a reliable basis for medium-term forecasts of stock dynamics under various rebuilding scenarios. STECF considers that recovery plan scenarios for this stock may be realistically evaluated only after there is clear evidence that the stock has recovered to a point where historically observed productivity could be expected.
2. Whilst recognising that an evaluation of the benefit of improvements in selectivity resulting from changes in mesh size will always remain difficult STECF considers that recent regulatory changes in mesh size are insufficient for rapid rebuilding of the SSB (contributing an extra 250 tonnes of SSB in 2005 if implemented in the most optimistic circumstances). STECF does consider, however, that technical measures (including industry-initiated programs) could be a tool in rebuilding this stock. Furthermore, STECF advises that these measures should become a permanent feature of the fishery if cod is to be fished sustainably once it has recovered.
3. STECF notes that the ICES advice and forecasts do not consider the potential reduction in fishing mortality resulting from decommissioning and effort regulation in 2003. Furthermore the level of effort limitation, if any, proposed for 2004 is also unknown and consequently its impact is similarly unaccounted for in the advice. (Note: STECF considers that these factors will act as F multipliers on catch forecasts for 2003 and 2004. If the level of these factors is determined their impact on catch forecasts could readily be evaluated).
4. STECF notes that there is no agreed management plan with clearly defined objectives for this stock. STECF advises that agreeing such a management plan is desirable both during the recovery phase and thereafter if the fishery is to be managed in a sustainable manner.
5. Taking all of these factors into account, STECF considers that there should be zero catches of cod until there is clear evidence of recovery in this stock.
2.2.6 Cod (Gadus morhua) in area VIIa (Irish Sea Cod)
STECF COMMENTS: 1. STECF notes that ICES evaluated a recovery plan proposals from the European
Commission. The results of these evaluations indicate that SSB can be recovered above Bpa over a time frame of 7-8 years. These simulations assume 100% implementation efficiency, which has not been seen in the past management of the stock and hence are likely to underestimate the time needed for recovery.
2. Whilst recognising that an evaluation of the benefit of reduced fishing mortality resulting from recent decommissioning will always remain difficult STECF considers

16
that recent decommissioning will be insufficient for rapid rebuilding of the SSB (contributing an extra 600 tonnes of SSB in 2005 if implemented in the most optimistic circumstances, “VIIa Cod Short Term Forecast Re-Calculations”, Scott, R., Working Document to ACFM, October 2003). STECF does consider, however, that technical measures (including industry-initiated programs) could be a tool in rebuilding this stock. Furthermore, STECF advises that these measures should become a permanent feature of the fishery if cod is to be fished sustainably once it has recovered.
3. STECF notes that there is no clear evidence of a reduction in fishing mortality over the period from 2000 onwards when emergency and ad hoc measures were enacted. STECF therefore cannot determine the extent to which recent increases in SSB have resulted from the emergency measures.
4. STECF notes that there is no agreed management plan with clearly defined objectives for this stock. STECF advises that agreeing such a management plan is desirable both during the recovery phase and thereafter if the fishery is to be managed in a sustainable manner.
5. Taking all of these factors into account, STECF considers that a zero catch will provide the highest probability of stock recovery in the short term. However, STECF notes that the catch options provided by ICES indicate that rebuilding of the SSB above Blim in 2005 can be achieved without a zero catch in 2004.
2.2.7 Cod (Gadus morhua) in areas VIIe-k
STECF COMMENTS: STECF notes that, in the absence of specific management objectives, the rationale for the ICES advice is to rebuild SSB above Bpa by 2005. STECF notes that recovery plan evaluations projecting F reductions to Fpa (32% reduction) achieve recovery of the SSB to Bpa within 5 years (Table 3.9.2.3, ICES ACFM Report, October 2003). STECF considers such recovery plan scenarios to provide acceptable prospects for stock recovery within acceptable time-frames. STECF therefore suggests that such recovery plan scenarios be adopted for this stock rather than the 90% reduction in fishing mortality in 2004 as advised by ICES. STECF notes that past TAC reductions have not resulted in desired reductions in fishing mortality. STECF therefore supports the ICES advice that direct effort reductions, rather than TAC controls, are required to promote a reduction in fishing mortality.
2.2.8 Haddock in Division VIa (West of Scotland)
STECF COMMENTS: Whilst, in general, agreeing with the ICES advice for this stock STECF also notes the following:
1. Whereas an evaluation of the benefit of improvements in selectivity resulting from changes in mesh size will always remain difficult STECF considers that recent regulatory changes in mesh size may be of significant benefit for building the SSB. In the case of this stock these changes may contribute an increase of about 16% in SSB in 2005 if implemented in the most optimistic circumstances (WGNSDS Technical Minutes, ICES/ACFM 2003). STECF considers that such technical measures (including industry-initiated programs) should become a permanent feature of this fishery.

17
2. The specific advice for this stock should be considered in light of additional comments in section 16.2 that considers Regional Mixed fishery advice for the ICES area.
2.2.9 Haddock in Division VIIb-k (Celtic Sea and West of Ireland)
STECF COMMENTS: STECF considers that any increase in TAC must be set taking into account the mixed nature of fisheries in this area (see Section 16.4).
STECF agrees with the advice from ICES that fishing mortality should not increase and notes that recent levels of F are consistent with Fmax. However, STECF notes that the lack of provision of a short term forecast by ICES precludes an estimation of landings in 2004 consistent with status quo fishing mortality. STECF notes that using the average of recent landings (as adopted in previous years) is a poor basis for management advice in stocks such as Celtic Sea haddock where catches are expected to increase markedly in response to strong confirmed recent recruitment. STECF agrees with ICES that there are indications of a strong year-class (2001) in the fishery and that a TAC based on an average of recent landings would lead to increased discarding of marketable fish. In the 2004 catch forecast presented to ICES (but not reported by ICES), the 2004 landings of haddock at FSQ were indicated to be around 18,300t (2.4 times the average landings of the last 3 years).
2.2.10 Hake (Merluccius merluccius) in Division Vb (1), VI and VII, and XII, XIV (Northern hake)
STECF COMMENTS : STECF agrees with the ICES assessment of the state of the stock and that a recovery plan is required to ensure a safe and rapid recovery of SSB to Bpa. STECF also agree that rebuilding of the hake can be obtained by reducing the overall fishing mortality, or by a reduction in overall F combined with an improvement in selection pattern. The emergency plan for northern hake implemented on 1 September 2001 (combining a low TAC and mesh size) in recent years has not been evaluated. However, STECF notes that an improvement of the selection pattern would increase the probability that a reduction in F will allow the rebuilding of SSB.
The recovery plan proposed by the EU Commision (Doc. COM2003-374 final) in July 2003 aims at an annual increase of the SSB of 10% with a limit on the annual TAC variation of 15%. ICES notes that the reductions indicated in the proposed plan are much less severe than the cuts in fishing mortality required to rebuild the stock in the short-term, and suggested a reduction in F of 70% in 2004 to rebuild the stock in the short-term. STECF agree with ICES advises that given the state of the stock, and the risk of impaired recruitment, any further delay in the implementation of a recovery plan will be detrimental the stock and the fastest possible rebuilding to Bpa is strongly needed. However, STECF considers that the proposed reduction in F is unlikely to be achieved, and that the ICES mixed fishery advice (Section 16.4) should be taken into account in determining appropriate exploitation rates for hake.
2.2.11 Hake (Merluccius merluccius) in Divisions VIIIc, IX and X (Southern hake)
RECENT MANAGEMENT ADVICE: The advice on the exploitation of this stock in 2004 is presented in the context of mixed fisheries and is found in Section 16.5.
ICES recommends that given the very low stock size, the recent poor recruitments, and the continued substantial catch, a recovery plan to ensure a safe and rapid rebuilding of SSB to levels above Bpa should be implemented. Such a recovery plan must include a provision for

18
zero catch until the estimate of SSB is above Blim or other strong evidence of rebuilding is observed. A zero catch in 2004 would be in accordance with such a recovery plan.
STECF COMMENTS: STECF agrees that the ICES advice is consistent with the accepted biomass reference point. However, since the perception of the stock has changed over the last decade, STECF points out that more investigations are needed to define appropriated fishing mortality reference points. STECF agrees with the ICES advice that a recovery plan should be applied.
STECF notes that the recovery plans for hake and Nephrops in the Iberian region prepared by SGMOS (June, 2003) has been accepted but it has not yet been implemented.
2.2.12 Herring (Clupea harengus) in the North Sea (Sub-area IV) including components of this stock in Divs. IIa, IIIa and VIId
STECF COMMENTS: STECF agrees with the advice from ICES, although it notes that there may be significant illegal landings which will influence the assessment of the stock. The EU/Norway management plan implies a rise in TAC for 2004. If the TAC is raised above the 2003 level, the incoming year class will be insufficient to replace the removed biomass, implying the need for a reduction in TAC in 2005 in order to conform to the EU-Norway agreement. A roll-over TAC (2003-2004) would maintain stability of catch in the short term and increase the likelihood of roll-over TAC in 2005.
2.2.13 Herring (Clupea harengus) in the Celtic Sea (VIIg and VIIa South), and in VIIj
STECF COMMENTS: STECF agrees with ICES that current management measures should be kept in place to allow the stock to recover. STECF also supports the actions of the Irish Southwest Pelagic Management Committee that has devised a rebuilding plan for this stock.
STECF notes that additional fisheries-independent indices are required to refine estimates of recruitment. This would help to reduce uncertainty in the assessment and provide a better basis for management advice than using recent catches.
STECF notes that the current ICES advice of catch appears to be similar to catches in 2002. STECF was unable to find the scientific basis for the advice of the catch in 2004 being 60% of the average (1997-2000).
2.2.14 Norway lobster (Nephrops norvegicus) in Division VIIIc
STECF COMMENTS: STECF notes that the mixed nature of these demersal fisheries has prevented directed management of Nephrops stocks in this Management Area. The management measures for hake have determined the exploitation level of the Nephrops stocks.
A recovery plan for the hake and Nephrops fisheries has been prepared (SGMOS, 2003) but has not yet been implemented. STECF further notes that with the present situation for the Iberian Nephrops stocks, the effort reduction scheme proposed for southern hake and Nephrops in this recovery plan (SGMOS, 2003) must be complemented with the closure of selected Nephrops fishing grounds to all fishing. STECF suggests that there be a zero catch in 2004 for this Management Area, except for the Gulf of Cadiz, if the recovery plan and complementary closure areas are not implemented.

19
2.2.15 Norway lobster (Nephrops norvegicus) in Division IX and X.
RECENT MANAGEMENT ADVICE: For West Galicia and North Portugal, ICES
advises a zero TAC in order to allow the stock to rebuild from the current low biomass levels. ICES advises a zero TAC for SW and S Portugal, in order to allow the stock to increase.
Given the declining stocks in neighbouring areas and the absence of information for Gulf of Cádiz, ICES advises that landings from this stock be kept at the lowest level of recent years, i.e. 50 t.
The advice on the exploitation of this stock in 2004 is presented in the context of mixed fisheries and is found in Section 16.5.
Given the perception that there are no Nephrops grounds in División IXb and Subarea X, ICES recomends that a zero TAC be set to prevent mis-reporting.
STECF COMMENTS: STECF notes that the mixed nature of these demersal fisheries has prevented directed management of Nephrops stocks in this Management Area. The management measures for hake have determined the exploitation level of the Nephrops stocks.
A recovery plan for the hake and Nephrops fisheries has been prepared (SGMOS, 2003) but has not yet been implemented. STECF further notes that with the present situation for the Iberian Nephrops stocks, the effort reduction scheme proposed for southern hake and Nephrops in this recovery plan (SGMOS, 2003) must be complemented with the closure of selected Nephrops fishing grounds to all fishing. STECF suggests that there be a zero catch in 2004 for this Management Area, except for the Gulf of Cadiz, if the recovery plan and complementary closure areas are not implemented.
2.2.16 Anglerfish (Lophius sp.) in VIIIc, IX, X
RECENT MANAGEMENT ADVICE: Fishing mortality equal 0 in 2004 is required to bring SSB to BMSY in short-term. If this it not possible then a recovery plan should established that will ensure rapid and safe recovery of the SSB above BMSY in the medium-term.
The ICES advice on the exploitation of this stock in 2004 is presented in the context of mixed fisheries and is found in Section 16.5.
STECF COMMENTS: STECF notes that within the recovery plan for hake and Nephrops in the Iberian region (Divisions VIIIc and IXa) the ICES recommendations for the anglerfish may be partially achieved.
STECF further notes that this recovery plan has been accepted (SGMOS, 2003) but it has not yet been implemented.
2.2.17 Plaice (Pleuronectes platessa) in Subarea IV (North Sea)
STECF COMMENTS: STECF notes that the most recent assessment resulted in a marked downward revision of the SSB. This was due to a change in perception of the strength of the 1996 year-class and a declining trend in mean weight at age. STECF also notes that there were revisions to the assessment model settings for the age range over which average fishing mortality is calculated, and to the age range used in the assessment. STECF

20
considers that such changes require a revision of reference points but notes that there has been no revision of the reference points.
Nevertheless, STECF agrees that a recovery plan be established to ensure a rapid recovery of the stock to a level above Bpa. This recovery plan should incorporate both reduction of fishing mortality and reduction of discards. STECF agrees with ICES that reduction of discards would benefit the plaice stock and future yields from sole and plaice. STECF notes that estimates of discards are not included in the assessment. STECF agrees with ICES that there is a need for continuous monitoring of discards and that special attention should be given to reconstructing recent discard trends so as to improve the assessment. STECF notes that as plaice are caught in a mixed fishery, the management measures for plaice should take into account management measures adopted for other species, especially North Sea cod for which stringent management is advised.
2.2.18 Sandeel (Ammodytidae) in the North Sea (IV)
RECENT MANAGEMENT ADVICE: The advice on the exploitation of this stock in 2004 is presented in the context of mixed fisheries and is found in Section 16.1. ICES is unable to provide predictions that can be used for TAC setting for 2004. The fishery should therefore be managed through effort and capacity control.
The 2002 year class is weak which means that SSB in 2004 will be low. The exploitation at the beginning of the 2004 sandeel season should be kept below the exploitation in 2003. This restriction should apply until the strength of the incoming year class has been evaluated, at which time appropriate adjustment in management can be advised.
Local depletion of sandeel aggregations by fisheries should be prevented, particularly in areas where predators congregate.
STECF COMMENTS:STECF agrees in general with the advice from ICES. STECF also recommends that in order to implement appropriate and effective management proposals in 2004, in accordance with the intentions of the ICES advice for 2004, an appropriate (‘ad hoc’) harvest control rule (decision rule) which takes into account information from the fishery in 2004, must be agreed before the start of the fishery in the spring 2004. Such a decision rule should be established in consultation with appropriate fishery experts.
2.2.19 Deepwater fish (several species) in the Northern North Sea (IVA), IIIa, Vb, VI, VII, VIII, IX, X and XII.
RECENT MANAGEMENT ADVICE: ICES recommends immediate reduction in these fisheries unless they can be shown to be sustainable. New fisheries should be permitted only when they expand very slowly, and are accompanied by programs to collect data which allow evaluation of the stock status.
STECF COMMENTS: STECF agrees with the ICES recommendation. STECF further notes that several of these fisheries take place in international waters outside national or EU jurisdiction. Hitherto this has rendered it difficult to enforce management measures for these fisheries
STECF notes that in 2002 some of these stocks have been subject to TACs for the 1st time. STECF reiterates its comment of November 2001 that management measures based on effort/fleet regulation would be an appropriate long-term approach for management of these fisheries.
2.2.19.1 Ling (spp).

21
RECENT MANAGEMENT ADVICE: ICES recommends that the overall fishing effort be reduced by 30%.
STECF COMMENTS: STECF agrees with the advice of ICES. However STECF notes that the ICES advice for deepwater species for 2004 is unclear, in that it recommends effort reductions but does not specify reference levels. The interpretation of STECF is that, based on the ICES answer to a request for clarification of such reference levels NEAFC (ICES, 2003, Section 3.13.3a), the advised reduction in effort should refer to 1998 levels.
2.2.19.2 Tusk (spp).
RECENT MANAGEMENT ADVICE: ICES recommends that overall fishing effort be reduced by 30%.
STECF COMMENTS: STECF agrees with the advice of ICES. However STECF notes that the ICES advice for deepwater species for 2004 is unclear, in that it recommends effort reductions but does not specify reference levels. The interpretation of STECF is that, based on the ICES answer to a request for clarification of such reference levels NEAFC (ICES, 2003, Section 3.13.3a), the advised reduction in effort should refer to 1998 levels.
2.2.19.3 Black scabbardfish (Aphanopus carbo)
RECENT MANAGEMENT ADVICE: ICES recommends a significant reduction in the fishing effort in the northern areas. The contradicting trends of the CPUE series make it difficult to advise on the need for effort reduction in the southern area, but certainly no expansion of the effort should be allowed and fisheries should not be allowed to expand until reliable assessment indicate that increased harvests are sustainable.
STECF COMMENTS: STECF agrees with the advice of ICES. However STECF notes that the ICES advice for deepwater species for 2004 is unclear, in that it recommends effort reductions but does not specify reference levels. The interpretation of STECF is that, based on the ICES answer to a request for clarification of such reference levels NEAFC (ICES, 2003, Section 3.13.3a), the advised reduction in effort should refer to 1998 levels.
2.2.19.4 Roundnose grenadier (Coryphaenoides rupestris)
RECENT MANAGEMENT ADVICE: ICES recommends regulation of the fishery in all areas in order to control fishing effort. For Sub-areas VI and VII and Divisions Vb and IIIa significant reductions on effort are necessary. In all other areas, expansion of fisheries should not be allowed to expand until reliable assessments indicate that increased harvests are sustainable.
STECF COMMENTS: STECF agrees with the advice of ICES. However STECF notes that the ICES advice for deepwater species for 2004 is unclear, in that it recommends effort reductions but does not specify reference levels. The interpretation of STECF is that, based on the ICES answer to a request for clarification of such reference levels NEAFC (ICES, 2003, Section 3.13.3a), the advised reduction in effort should refer to 1998 levels.
2.2.19.5 Deepwater sharks
RECENT MANAGEMENT ADVICE: Deepwater sharks can only sustain very low levels of exploitation. Due to the overall declining trends in CPUE, despite the mixed nature of the catches, ICES recommends that the overall exploitation be reduced. Deepwater sharks are taken in mixed fisheries and this makes it difficult to manage them in a single species

22
context. ICES further advises that species specific landings data be collected for all deepwater sharks.
STECF COMMENTS: STECF agrees with ICES in that deep-water sharks are very vulnerable to exploitation, and that the fishing mortality should be reduced However STECF notes that the ICES advice for deepwater species for 2004 is unclear, in that it recommends effort reductions but does not specify reference levels. The interpretation of STECF is that, based on the ICES answer to a request for clarification of such reference levels NEAFC (ICES, 2003, Section 3.13.3a), the advised reduction in effort should refer to 1998 levels.
2.2.20 Bluefin (Thunnus thynnus), Eastern Atlantic and Mediterranean
RECENT MANAGEMENT ADVICE: ICCAT recommended in 1998 that yields should be reduced to 32,000 tonnes in 1999 and 29,500 tonnes in 2000 and 2001. In 2002, ICCAT fixed the Total Allowable Catch for the East Atlantic and Mediterranean bluefin tuna at 32,000 t for the years 2003, 2004, 2005 and 2006, subject to revision on scientific advice after the 2005 stock assessment. The 2002 assessment, as that of 1998, indicate that under current level of recruitment and current fishing selectivity and current mortality rate, yields higher than 26,000 tons are not sustainable over the long-term. Because of the lack of confidence in the input data and in the assessment results, the SCRS is not in a position to give or suggest any strong management recommendations for the short or medium term. The SCRS can only offer advice about long-term consequences of maintaining current catches. The SCRS thinks that long-term sustainable yield is probably lower than current catches because of high fishing mortality rates. Furthermore, bluefin tuna is a long living species (over 20 year classes exploited) with a late age-at-maturity and a low biological productivity in comparison to other tuna species. These biological characteristics mean that the SCRS continues to be concerned with the strong fishing pressure on small fish and recommended that every effort be made to ensure the application of current measures on size limits. A complex package of measures has been adopted by ICCAT in 2002. This includes:
- A prohibition on the catching, retaining on board or selling of tuna less than 4.8 kg in the Mediterranean; this limit will remain at 3.2 kg in the Eastern Atlantic.
- In addition no more than 10% of the total catch, by number of fish, may consist of fish between the minimum landing size and 6.4 kg.
- A closed fishing season in the Mediterranean from 16th July to 15th August for purse seiners.
- A closed fishing season in the Mediterranean during June-July for long-line vessels greater than 24 meters.
- A prohibition on the use of aircraft support during June in the Mediterranean. - Specific recommendations in respect of data requirements from tuna farms. - Improvements to data collection. STECF COMMENTS: STECF agrees with ICCAT advice. STECF further stresses the importance of reinforcing controls on current regulations and improving rapidly the quality of the catch data. In the meantime, measures on size limits and limitation of fishing effort appear to be the most efficient management tools, as well as a better enforcement of the controls. The development of farming in the Mediterranean Sea has generated several problems that make the assessment and management of the bluefin tuna stock more difficult. STECF recommends that regulation of farming be considered and implemented as soon as possible (some potential solutions have been provided in the 2002 GFCM/ICCAT report).
23
2.2.21 Albacore (Thunnus alalunga), North Atlantic Ocean
RECENT MANAGEMENT ADVICE: In 2000 ICCAT/SCRS recommended that in order to maintain a stable Spawning Stock Biomass in the period 2001-2002 the catch should not exceed 34,500 tonnes (the 1999 catch level). It further noted that should the Commission wish the Spawning Stock Biomass to begin increasing towards the level estimated to support the MSY, then catches in 2001 and 2002 should not exceed 31,000 tonnes. The 2003 Committee reiterates its previous advice and extends it until the next assessment.
STECF COMMENTS: STECF agrees with the advice from ICCAT. STECF additionally recommends that during the next assessment further attempts be made to explain the uncertainty in the assessment; this should, where possible, include the use of historic data and the effect of environmental variability on this stock.
2.2.22 Albacore (Thunnus alalunga), Mediterranean Sea
RECENT MANAGEMENT ADVICE: ICCAT currently does not provide management recommendations for the Mediterranean stock. ICCAT recommends that reliable data be provided on catch, effort and size for Mediterranean albacore and that efforts be made to recover historic data.
STECF COMMENTS: STECF agrees with the advice from ICCAT, and notes that data collection is now mandatory within the EC data collection programme. STECF additionally strongly supports the recommendation of the ICCAT/SCRS concerning the timely provision of catch and effort data and the collection of historical data.
2.2.23 Small tunas (Black skipjack, Frigate tuna, Atlantic bonito, Spotted Spanish mackerel, King mackerel), Atlantic and Mediterranean
RECENT MANAGEMENT ADVICE: No management recommendations have been presented by ICCAT due to the lack of data and analyses.
STECF COMMENTS: STECF agrees with the advice from ICCAT and recommends that the Commission make the necessary effort to report much more comprehensive data sets. It is worthy of note that the current EC data collection programme includes only the Atlantic bonito and no other species in this group, a number of which are relevant, both in terms of quantity and economic value.
2.2.24 Marlins, spearfish and sailfish (Bill fishes) - Mediterranean
RECENT MANAGEMENT ADVICE: ICCAT have not provided any kind of management recommendations for this stock.
STECF COMMENTS: Billfishes are charismatic species and their stock status should be followed carefully, even if they are not generally a target species for commercial fleets. The Mediterranean Spearfish should be strictly monitored, due to the high fishing pressure on other target species and to the possible increase of catch levels.
2.2.25 Luvarus (Luvarus imperialis) – Mediterranean
RECENT MANAGEMENT ADVICE: GFCM have not provided any kind of management recommendations for this stock.

24
STECF COMMENTS: The Luvarus is a quite poorly known species. Its natural history was much better known at the beginning of the last centuray, while now data are completely lacking. Due to the low density of the species and to the old age classes involved in the fishery, it should be important to collect basic data about the fishery and the species, even if it is not generally a target species for commercial fleets.
2.2.26 Spurdog (Squalus acanthias) in the North-east Atlantic
RECENT MANAGEMENT ADVICE: There is no specific management advice for spurdog in the NE Atlantic.
STECF COMMENTS: STECF agrees with the STECF-SGRST Working Group Report on Elasmobranch Fishes, that the stock of spurdog in the Northeast Atlantic is severely depleted.
2.2.27 Blue shark (Prionace glauca) in the north-east Atlantic
RECENT MANAGEMENT ADVICE: There is no species specific management advice for blue sharks in the NE Atlantic.
STECF COMMENTS: There is a need for long-term database of shark data. STECF recommends that all EU fleets operating in the Northeastern Atlantic region provide required input data on catch, effort and catch-at-size to ICCAT for the blue shark, in time for the 2004 schedule (late April) assessment meeting. EC should encourage other nations to report their shark catch data too.
2.2.28 Cod (Gadus morhua) in NAFO Divisions 2J, 3K and 3L.
STECF COMMENTS: STECF agrees with the advice given by the FRCC. However, STECF notes that the results of the management options evaluated by FRCC are presented in the report of FRCC as qualitative statements. STECF urges that quantitative results of these evaluations should be presented in full to permit scrutiny by non FRCC scientists.
2.2.29 Greenland Halibut (Reinhardtius hippoglossoides) in NAFO Sub-area 2 and Divisions 3KLMNO
STECF COMMENTS: STECF is aware of the severe decline suffered in this stock and agrees with the advice given by NAFO. However, STECF notes that there is considerable uncertainty regarding the absolute level of this stock and recommends that NAFO makes every effort to reconcile the discrepancies in the stock indicators. STECF notes that management decisions have already been taken during NAFO’s 25th Annual Meeting, 15-19 September 2003.
2.3 ICES ADVICE FOR MIXED FISHERIES. STECF notes that most ICES advice is based on single species stock assessments and forecasts. ICES now has a very clear policy described in the ACFM report detailing how it provides catch advice dependent on the status of a stock. This description is very useful in understanding the reasoning behind how ICES arrives at the single species advice based on the current estimate of stock status and exploitation. ICES has attempted to provide mixed fishery area based advice, but indicates that it has found difficulty in providing advice due primarily to poor data on catch by fleet. Currently there is a need for improved mixed

25
fishery advice. ICES acknowledges the presence of mixed species and fisheries interactions and provides advice in a mixed fishery context in a qualitative manner.
Where there is conflicting single species advice in the presence of a mixed fishery or international management agreement, ICES has chosen to consider that primacy should be given to the single species advice that is most restrictive. However, without appropriate decision rules within a management context ICES has little alternative.
STECF considers that this approach may not be the most appropriate
There is a need for managers to rank or weight the relative importance of the conflicting requirements for mixed species fisheries. For example issues which need to be resolved include:
The rate with which it is necessary for stocks to recover to Blim or to Bpa.
The importance of the recovery of one species relative to others in a fishery.
Where international agreements on exploitation exist, the weight to be given to each if they are in apparent conflict.
The balance between economic and social needs and those of stock conservation.
If this type of guidance was communicated to ICES, or built into a management plan, it will aid the provision of mixed fishery advice. In the absence of such guidance or clear management objectives it will be difficult for ICES to provide more pertinent advice in the future.
The longer term solution to these issues could be to develop an operational management model that can be populated annually with data on fisheries, the ICES advice on single species basis, and the economic data currently used in the EIAA model. Such a model could provide the functionality to allow managers to enter their priorities and to provide facilities to explore and understand the possibilities for compromise among the conflicting priorities.
With regard to the ICES mixed fishery advice for specific areas (see section 16 of the report on stocks status review (SEC (2004)372), STECF has specific comments only on ICES Division VIIIc and Sub-areas IX and X). The STECF comments are given below in section 2.3.1.
2.3.1 Mixed fisheries advice for Iberian waters (Div. VIIIc and Sub-areas IX and X)
The characteristics of the mixed demersal fisheries in the Iberian Region are given below. Note, that some species (e.g. southern horse mackerel) are exploited by both pelagic and demersal fisheries and that the blue whiting in these areas are caught with bottom trawls:
• Both megrim species are caught together in fisheries, which also take a large number of other commercial species, including southern hake. The decreasing catch of hake has modified the target species of some of the fleets and has reduced the effort on these species in recent years.
• A portion of the catch of L. piscatorius and L. budegassa is taken together with other species in mixed trawl fisheries.
• Southern horse mackerel are mainly exploited by Spanish and Portuguese purse seiners and by Portuguese trawlers. While the purse seiners mainly catch juvenile fish, the

26
catches taken by trawlers comprise also older fish. There is a significant by-catch of Trachurus mediterraneus and Trachurus picturatus, mainly in the trawl fishery.
• For blue whiting most of the catches are taken in the directed pelagic trawl fishery in the spawning and post-spawning areas (Divisions Vb, VIa,b, and VIIb,c). Catches are also taken in a directed and a mixed fishery in Subarea IV and Division IIIa and in the pelagic trawl fishery in the Subareas I and II, and in Divisions Va and XIVa,b. These fisheries in the northern areas have taken 340 000–1 390 000 t per year in the last decade, while catches in the southern areas (Subarea VIII, IX, Divisions VIId,e and g-k) have been stable in the range of 25 000–34 000 t. In Division IXa blue whiting is mainly taken as a by-catch in mixed trawl.
The stocks of anglerfish (2 species), southern hake and Nephrops are outside safe biological limits. These stocks are the overriding concern in the management advice. The demersal fisheries in the Iberian Region should therefore be managed such that the following rules apply simultaneously:
1. For southern hake there should be no catch;
2. for Anglerfish and Nephrops rebuilding plans should be established that will ensure rapid rebuilding to safe biological levels and which ensure large reductions in F in 2004. Such rebuilding plans should imply no catch or discards of southern hake;
3. The fishing for each species should be restricted within the precautionary limits as indicated in the table of individual stock limits above.
Furthermore, unless ways can be found to harvest species caught in a mixed fishery within precautionary limits for all those species individually then fishing should not be permitted.
ICES notes, that this advice presents a strong incentive to fisheries to avoid catching species outside safe biological limits. If industry-initiated programs aim at reducing catches of species outside safe biological limits to levels close to zero in mixed fisheries, then these programs could be considered in the management of these fisheries. Industry-initiated programs to pursue such incentives should be encouraged, but must include a high rate of independent observer coverage, or other fully transparent methods for ensuring that their catches of species outside safe biological limits are fully and credibly reported.
All fisheries should be considered in the management; the major fisheries in the area are:
Bottom trawl fishery targeting Nephrops, but also taking hake and anglerfish as their main bycatch.
Bottom trawl fishery for mixed fish, i.e. hake, anglerfish, megrim, horse mackerel, and blue whiting.
• Artisanal gillnet fishery for mixed demersal fish, i.e. hake, anglerfish, megrim.
• Baca trawl fleet for blue whiting, hake and horse mackerel and Nephrops, megrims.
• Trawl for horse mackerel by a small bycatch of other species (not Nephrops).
• Pair trawl for blue whiting.
• Fixed-net fisheries (Rasco directed at monkfish, Beta and Volanta directed at hake).
• Long line fishery for hake and other demersal species.
• Artisanal fleet taking miscellaneous species.
STECF COMMENTS: STECF notes that recovery plans proposals for hake and Nephrops in the Iberian region (ICES Divisions VIIIc and IXa) have been proposed (SGMOS) but not yet implemented. As anglerfish (two species) are mainly caught within the same fisheries

27
that catch hake and Nephrops, the implementation of those recovery plans should also reduce fishing mortality on anglerfish.
The proposed recovery plans have the following elements :
1. An overall effort reduction scheme applied to all vessels which land hake and Nephrops in Divisions VIIIc and IXa. This should achieve an annual reduction in effort of 10% relative to the previous year.
2. The closure of selected Nephrops fishing grounds to all fishing. STECF recommends that the proposed hake and Nephrops recovery plans be implemented.
2.4 SAMPLING IN NORTHERN IRELAND STECF is concerned about the absence of market sampling of the catch in Northern Ireland since February 2003 and the impact of this lack of data on the quality of the stock assessment and the utility of the Irish Sea Cod Recovery Plan. STECF urges those concerned to come to an agreement to allow sampling to re-commence.
2.5 STOCKS SUBJECT TO TAC BUT FOR WHICH ADVICE IS NOT AVAILABLE FROM SCIENTIFC BODIES
Traditionally, STECF gives a series of data for recent years on catch and corresponding TACs, based on Commission's statistics. In rare occasions STECF is able to provide with innovative information useful for management, and has generally advised that, if a TAC is to be set, it should be based on recent catches.
Again, STECF was not in a position to improve the advice given in recent years. TAC and catch data (000tons) were updated and this is shown in the following tables. Figures are taken from DG-FISH statistics. STECF notes that in nearly all cases the agreed TACs are not restrictive.
Previous comments made by STECF on these stocks remain valid.

28
Pollack Vb (EC zone), VI, XII, XIV
Year 1993 1994 1995 1996 1997 1998 1999 2000 2001 2002 2003
Agreed TAC 1.1 1.1 1.1 1.1 1.1 1.1 1.1 1.1 1.1 1.1 0.70
Landings (kt) 0.34 0.33 0.50 0.40 0.31 0.22 0.31 0.23 0.22 0.14
Pollack VII
Year 1993 1994 1995 1996 1997 1998 1999 2000 2001 2002 2003
Agreed TAC 14.0 14.0 14.0 14.0 14.0 17.0 17.0 17.0 17.0 17.0 17.0
Landings (kt) 5.32 6.02 5.38 6.08 5.46 5.20 3.81 3.96 5.45 5.64
Pollack VIIIabde
Year 1993 1994 1995 1996 1997 1998 1999 2000 2001 2002 2003
Agreed TAC 2.6 2.6 2.6 2.6 2.6 2.6 2.6 2.6 2.6 2.1 1.68
Landings (kt) 1.35 1.87 1.60 1.43 1.32 1.00 1.08 1.18 1.30 1.52
Pollack VIIIc
Year 1993 1994 1995 1996 1997 1998 1999 2000 2001 2002 2003
Agreed TAC 0.8 0.8 0.8 0.8 0.8 0.8 0.8 0.8 0.8 0.64 0.41
Landings (kt) 0.05 0.06 0.05 0.05 0.06 0.09 0.11 0.09 0.12 0.04
Pollack IX, X CECAF 3.4.11
Year 1993 1994 1995 1996 1997 1998 1999 2000 2001 2002 2003
Agreed TAC 0.45 0.45 0.45 0.45 0.45 0.45 0.45 0.45 0.45 0.45 0.29
Landings (kt) 0.05 0.03 0.06 0.05 0.06 0.05 0.04 0.06 0.12 0.08

29
Herring VIIef
Year 1993 1994 1995 1996 1997 1998 1999 2000 2001 2002 2003
Agreed TAC 1.0 1.0 1.0 1.0 1.0 1.0 1.0 1.0 1.0 1.0 1.0
Landings (kt) 0.76 0.45 0.95 1.0 1.04 0.40 0.68 0.71 0.67 0.67
Whiting VIII
Year 1993 1994 1995 1996 1997 1998 1999 2000 2001 2002 2003
Agreed TAC 5.0 5.0 8.0 7.0 7.0 7.0 7.0 7.0 7.0 5.6 2.2
Landings (kt) 3.11 3.43 4.32 2.70 2.69 2.13 3.13 1.56 3.06 2.56
Whiting IX, X CECAF 3.4.11
Year 1993 1994 1995 1996 1997 1998 1999 2000 2001 2002 2003
Agreed TAC 2.6 2.6 2.6 2.6 2.6 2.6 2.6 2.6 2.6 1.7 1.02
Landings (kt) 0.23 0.31 0.17 0.18 0.14 0.11 0.08 0.08 0.04 0.04
Plaice VIII, IX, X CECAF 3.4.11
Year 1993 1994 1995 1996 1997 1998 1999 2000 2001 2002 2003
Agreed TAC 0.7 0.7 0.7 0.7 0.7 0.7 0.7 0.7 0.7 0.56 0.45
Landings (kt) 0.44 0.44 0.41 0.35 0.32 0.23 0.28 0.45 0.31 0.29
Sole VIIIcde, IX, X CECAF 3.4.11
Year 1993 1994 1995 1996 1997 1998 1999 2000 2001 2002 2003
Agreed TAC 2.0 2.0 2.0 2.0 2.0 2.0 2.0 2.0 2.0 2.0 1.28
Landings (kt) 1.37 1.20 1.25 0.98 0.96 0.97 0.90 1.02 0.98 0.72

30
Horse mackerel X, CECAF 34.1.2 (EC Zone - Azores Islands)
Year 1993 1994 1995 1996 1997 1998 1999 2000 2001 2002 2003
Agreed TAC - - - 5.0 5.0 5.0 5.0 5.0 5.0 4.0 3.2
Landings (kt) 1.72 1.92 1.50 0.65 0.65 1.04 3.55
Horse mackerel CECAF 34.1.1 (EC Zone - Madeira Islands)
Year 1993 1994 1995 1996 1997 1998 1999 2000 2001 2002 2003
Agreed TAC - - - 2.0 2.0 2.0 2.0 2.0 2.0 2.0 1.6
Landings (kt) 0.39 0.76 0.66 0.34 0.56 0.35 0.36
Horse mackerel CECAF 34.1.1 (EC Zone - Canary Islands)
Year 1993 1994 1995 1996 1997 1998 1999 2000 2001 2002 2003
Agreed TAC - - - 2.0 2.0 2.0 2.0 2.0 2.0 2.0 1.6
Landings (kt) 0.04 - 0.08 0.17
Common prawn, French Guyana (Penaeus subtilis). (PEN/FGU.)
Year 1993 1994 1995 1996 1997 1998 1999 2000 2001 2002 2003
Agreed TAC 4.1 4.1 4.1 4.1 4.1 4.1 4.1 4.1 4.1 4.1 4.1
Landings (kt) 3.3 4.2 4.0 4.3 4.0 3.8 3.5 2.65 2.65 3.41

31
3 ANNUAL ECONOMIC REPORT 2003 AND ECONOMIC INTERPRETATION OF ACFM ADVICE
3.1 SUMMARY OF THE ANNUAL ECONOMIC REPORT STECF reviewed the 2003 draft of the Annual Economic Report (AER) that was prepared by the Concerted Action 'Economic Assessment of European Fisheries' (Q5CA-2001-01502).
This report contains economic indicators regarding fisheries in twenty countries. It presents information on revenues, costs, profits, employment, value and volume of landings and fleet composition along with analysis of the main developments in 2002. It also offers an outlook on the expected economic results in the year 2003. For clarity and easy comparison, data from 2001 are given in brackets. The report presents economic results for 2002 from 83 (75) fleet segments in the European Union, the new member states in the Baltic area and Norway, Iceland and Faeroe Islands. The fleets surveyed represent 60% (50-60%) of the total fishery sector of Europe in terms of value and volume of landings and 40% (35-40%) of employment. Fishing fleets of the 20 (20) countries discussed in the report employ about 225,000 (246,000) people on board. The value of total production amounted to EUR 9.8 (9.7) bln. Average gross value added per fisherman in the surveyed fleets amounts to about EUR 40,000 (36,000), of which a major part is disposable income.

32
Table 3.1 Main indicators by country (Total figures)
Value of landings
(mEUR)
Employment (FTE) 5.
Volume of landings
(1000 t)
Number of vessels
GT
(1000)
kW
(1000)
Belgium 92 700 26 130 24 68
Denmark 502 4,051 1,429 1,409 96 326
Finland 24 583 86 357 9 55
France 4. 1,078 13,824 594 5,712 161 911
Germany 2. 188 2,509 187 2,199 68 161
Greece 3. 250 32,441 89 19,546 99 601
Ireland 4. 234 6,000 283 1,361 59 206
Italy 1,385 38,360 304 15,915 178 1,253
Netherlands 380 2,331 447 410 170 388
Portugal 336 22,224 178 10,500 119 413
Spain 3. 1,677 58,400 1,050 15,385 528 1,298
Sweden 117 2,350 285 1,821 45 225
UK 866 12,746 686 7,033 234 908
Total EU 7,130 196,519 5,643 81,778 1,790 6,813
Estonia 1. 13 2,035
Faeroe Island 189 749 289 63 45 84
Iceland 926 4,984 2,133 1,939 194 532
Latvia 1. 21 978 73 191 16 35
Lithuania 1. 82 2,223 148 148 54 56
Norway 1,232 12,399 2,432 2,193 105 827
Poland 68 5,400 204 1,426 75 175
Total non-EU 2,532 28,768 5,279 5,960 488 1,708
Total 9,661 225,287 10,922 87,738 2,278 8,521
1. Data not available or only for the fisheries in the Baltic Sea, 2. Estimations, 3 Value and volume of landings are estimated, 4. Employment is based on 2001, 5 Full Time Equivalent, could differ per member state
In 2002 within the European Union some 196,000 (216,000) fishermen produced approximately EUR 7.1 (7.6) bln worth of fish. Some of the segments show average crew share below EUR 10,000 per crewmember. Compared to the year 2001, the value of production has decreased by approximately 7% and employment has decreased by about 10% (5%).

33
About 58 (57) segments of 73 (70) segments analysed have achieved reasonable to good economic performance over the period 2000-2002. These segments represent about 84% of the economic value of the surveyed fleets in terms of value of landings. The results revealed that 10 (12) segments faced significant losses over that period. In 2002, compared to 2000-2001, 38 (37) segments have further improved their performance, while 31 (26) faced some degree of deterioration.
The data collected in the AER have been used in the EIAA–model calculations which are shown in paragraphs 3.2 and 3.3.
From the information provided by AER it may be concluded that despite problems with a number of fish stocks, in 2002 economic performance of many segments in European fisheries was profitable. However there was a significant difference between segments.Demersal fisheries were most negatively affected and operated at loss.
The major changes concerning the EU-fleet between 2002 and 2001 indicated in AER are as follow:
- value of EU-landings decreased from EUR 7,600 million to EUR 7,100 million (-7%)
- employment in European fisheries reduced from 216,000 to 196,000 fishermen (–10%)
- average gross value added per fisherman rose from EUR 36,000 to EUR 40,000 (+10%)
- capacity in terms of number of vessels decreased from 84,558 to 81,778 (-3%)
STECF wishes to emphasize that the AER concerted action, which is near to completion, has significantly contributed to the development of systematic economic analysis of European Fisheries. Such analyses need to be further developed, particularly in view of the enlargement of the EU and the necessity for the consolidation of the data collection program. As there is no other structure for collecting data than that provided by the Concerted Action-project, STECF recommends that arrangements should be made to guarantee continuation and development of this work in the near future when the Concerted Action-project will end.
3.2 ECONOMIC INTERPRETATION OF ACFM ADVICE (EIAA MODEL) A STECF working group (SGECA) met in Brussels 29-31 October 2003 to make economic interpretation of the ICES advice on stock assessment. The work was undertaken together with the STECF working group on stock assessment SGRST. The report of the SGECA subgroup meeting is available as a Commission staff working paper (SEC(2004)61).
The EIAA calculations in the SGECA report give an assessment of the expected economic impact of the single species TACs proposed by the ICES (ACFM2) for 2004. STECF stresses that the model gives a demonstration of how the different factors effecting the economy of the fishery are linked to each other taking into consideration the restrictions and assumptions. The model gives a comparative and static analysis and does not make any predictions of the future financial profitability. It simply calculates the consequences of the proposed ICES advice, under the assumptions of the model calculations and with the data available. The future profitability is dependent on a series of factors ranging from cost interactions to price fluctuations, which are outside the present scope of this model. The calculations were made only for 25 segments in six countries, for which sufficient data were available. The results for 2004 are summarised in the two tables below.
2 The estimated TACs for 2004 were taken from the ICES single stock summary advice and were used to
demonstrate the effect of the single stock advice on the economic performance of the fleets. In some cases the ICES advice did not imply a specific TAC for 2004 and in such cases, the group set the TAC for 2004, either as being equal to the 2003 TAC or estimated a TAC using an existing management objective. For the Baltic Sea, the already decided quotas for 2004 by the International Baltic Sea Fisheries Commission have been applied in all scenarios.
34
In table 3.2.1 the gross value added (GVA: the sum of returns of production factors i.e. value of landings minus costs other than wages and capital costs) for 2004 is compared to the medium term (2000-2002) performance. The comparison shows that in all but one segment gross value added in the 2004 is reduced, which indicates general deterioration of economic performance of the sector. The reason is the decreasing landed value due to the quota cuts. In some cases, for example, the Danish gill-netters the gross value added for 2004 is half of the medium term 2000-2002 figure.

35
Table 3.2.1 EIAA results for the ACFM advise for 2004. Country/segment
Indicator
2000-2002 Average (mln
€) 2003
(mln €)
ACFM 2004 scenario (mln
€) Belgium Beam trawlers <=24m
Value oflandings 13.3 12.7 11.7
Gross valueadded 7.2 6.7 6.2
Beam trawlers >24m Value oflandings 70.3 67.1 62.3
Gross valueadded 33.7 31.7 29.5
Denmark Trawler>200 GT
Value oflandings 147.0 142.0 146.6
Gross valueadded 78.7 74.9 78.0
Trawler<200GT Value oflandings 152.0 133.7 126.5
Gross valueadded 85.9 71.5 66.3
Danish seiners Value oflandings 27.0 24.0 20.0
Gross valueadded 16.6 14.1 10.7
Gill-netters Value oflandings 64.8 49.1 38.4
Gross valueadded 42.2 29.2 20.8
Finland Trawlers<24
Value oflandings 5.8 4.4 4.5
Gross valueadded 3.2 1.9 2.1
Trawlers>24 Value oflandings 8.7 7.0 7.2
Gross valueadded 4.8 3.3 3.4
Gill-netters Value oflandings 1.5 1.5 1.4
Gross valueadded 0.6 0.5 0.4
Coastal vessels Value oflandings 7.9 7.6 7.6
Gross valueadded 3.7 3.5 3.5
France Atlantic Bottomtrawlers
Value oflandings 348.0 344.6 337.0
Gross valueadded 205.7 202.8 204.2
Atlantic netters Value oflandings 112.7 107.6 96.2
Gross valueadded 75.3 71.0 61.6
Netherlands Value of 62.3 57.8 57.1

36
Beam trawlers <=24m landings Gross value
added 35.0 30.7 30.0
Beam trawlers >24m Value oflandings 202.1 177.9 175.1
Gross valueadded 86.3 63.4 59.7
Sweden Pelagic Trawlers/Purseseiners <24m
Value oflandings 53.6 35.2 39.7
Gross valueadded 27.4 14.4 17.7
Shrimp trawlers Value oflandings 12.9 12.3 11.7
Gross valueadded 7.5 7.2 6.7
Trawlers >=24 Value oflandings 14.8 13.2 11.2
Gross valueadded 7.2 6.2 5.0
Trawlers <24 Value oflandings 11.4 10.1 8.7
Gross valueadded 5.8 4.9 3.9
Nephrop trawlers Value oflandings 10.8 10.6 10.2
Gross valueadded 6.3 6.3 6.0
Gill netters >=12m Value oflandings 4.0 3.4 2.8
Gross valueadded 2.7 2.3 1.9
UK Scottish DemersalTrawlers >24m
Value oflandings 122.8 104.3 98.4
Gross valueadded 48.5 38.4 34.3
Scottish DemersalTrawlers <24m
Value oflandings 86.9 71.8 75.8
Gross valueadded 31.4 21.6 25.4
Scottish DemersalSeiners
Value oflandings 50.0 45.4 37.2
Gross valueadded 21.1 20.8 13.4
United Kingdom, BeamTrawlers
Value oflandings 97.0 113.7 63.0
Gross valueadded 21.4 42.5 -0.2
Scottish NephropsTrawlers
Value oflandings 82.9 79.1 86.3
Gross valueadded 38.2 35.6 40.8

37
Table 3.2.2 Impact of 2004 TAC on operating profit margin3 compared to 2000-2002 average.
Country Segment
2000-2002 Average Operating Profit Margin
2004 Operating Profit Margin
Impact4
Beam trawlers <=24m 2.3% -1.5% Worsened Belgium
Beam trawlers >24m -1.6% -4.7% Worsened
Trawlers ≥ 200 GT -2.7% -3.0% No impact
Trawlers < 200 GT -8.3% -16.4% Worsened
Danish Seiners -2.5% -15.1% Worsened
Denmark
Gill Net -19.6 -44.6% Worsened
Trawlers<24 -7.1% -23.9% Worsened
Trawlers>24 -2.2% -12.2% Worsened
Gill-netters -19.6% -26.4% Worsened
Finland
Coastal vessels* 29.4% 27.5% Lower
Atlantic bottom trawlers 12.7% 13.7% Higher France
Atlantic netters 18.3% 13.3% Lower
Beam trawlers <=24m 3.5% -2.2% Worsened Netherlands
Beam trawlers >24m 0.3% -10.8% Worsened
Pelagic trawls/purse seiners ≥ 24*
27.3% 20.8% Lower
Shrimp trawlers* 32.8% 31.9% Lower
Trawlers ≥ 24* 20.5% 10.4% Lower
Trawlers < 24* 18.7% 16.1% Lower
Nephrop trawlers* 27.2% 27.6% Lower
Sweden
Gill netters ≥ 12* 33.1% 32.7% Lower
Scottish Demersal Trawlers≥24 m
4.9% -1.9% Worsened
Scottish Demersal Trawlers<24 m
-5.7% -10.3% Worsened
Scottish Seiners -1.5% -11.3% Worsened
Beam Trawl -14.7% -44.2% Worsened
UK
Scottish Nephrops Trawlers 5.7% 7.2% Higher
3 The operating profit margin is defined as the ratio of the net profit and landing value. 4 “Worsened” = Segment was making losses and losses are now greater. “Improved” = Segment was making losses and loses are now smaller. “Lower” = Segment was making profit and profits are now lower. “Higher” = Segment was making profits and profits are now higher * For these fleet segments there are no imputed skipper wages in the costs.

38
The table 3.2.2 presents comparison made between the medium term economic performance (average for the years 2000-2002) and the figures calculated by the model. STECF notes that in 2004 15 out of the 25 segments are estimated to operate at a loss compared to 11 segments in 2000-2002 and in all cases with an increase in the losses. This particularly refers to all five beam trawler segments. Also most of the demersal trawlers will have profitability problems.
From the information provided by the EIAA model calculations STECF concludes and wishes to emphasize that the proposed 2004 TACs, in relation to the percentage changes on operating profit margin, will have different effects:
- 6 segments will not be affected (less than 1% difference) - 8 segments will be affected at a low level (1 to 5% of difference) - 7 segments will be significantly affected (5 to 10%) - 4 segments will face very radical impact (over 10%).
STECF considers it important to include more segments in the future use of the model and urges for improved harmonisation of the input figures. For example the gross cash flow of the Danish and Swedish gill-netters are not calculated in the same way and therefore the comparison is not possible. Another example that requires improvement is in the segmentation of the fleet for French bottom trawlers and netters, which should be divided into more homogenous segments.
3.3 ECONOMIC INTERPRETATION OF THE “MIXED FISHERIES” SCENARIO’S
3.3.1 Background and inputs from the MTAC model
At the meeting on “Mixed Fisheries” (Subgroup on Resource Status (SGRST) of STECF), held in Brussels from 21-24 October 2003, the Commission requested the group to make mixed species/fishery model (MTAC) runs with specific targets for the North Sea and for the Irish Sea stocks.
The two requested “target” settings A and B for the two areas and the accompanied decision weightings for the different species are listed below (DW1 = Commission request).
Table 3.3.1 - MTAC Targets for the North Sea
Species Target A Target B Decision weight
(DW1)
Decision weight
(DW2)
Cod 0.2*Csq 0.35* Csq 0.5 0.48
Haddock Csq Csq 0 0.01
Whiting Csq Csq 0 0.01
Plaice 0.3* Csq 0.6* Csq 0.5 0.48
Sole Advice: Fpa Advice: Fpa 0 0.01
Saithe Advice: Fpa Advice: Fpa 0 0.01
Nephrops Constant Catch 0 0

39
Table 3.3.2 - MTAC Targets for the Irish Sea
Species Target A Target B Decision weight
(DW1)
Decision weight
(DW2)
Cod F for +30% SSB F for +30% SSB 0.5 0.48
Haddock Fpa Fpa 0 0.01
Whiting 0.2*Fsq 0.35*Fsq 0.5 0.48
Plaice Fpa Fpa 0 0.01
Sole Advice = 0.9* Fsq Advice= 0.9* Fsq 0 0.01
Nephrops Csq Csq 0 0.01
Where Csq is the level of catches corresponding to Fsq.
Investigations at the “Mixed Fisheries” meeting indicated that the choice of different decision weights were very sensitive to the results of the MTAC model and therefore two sets of different decision weights were investigated (DW1 and DW2).
For each “Target” setting, an extra MTAC run with different allocating of catch among fleets. (OPT1 and OPT2 described as prop 1 and prop 2 in the SG report) These can be explained as follows: -
• OPT1: In proportion to the catch (in weight) of the species within the total catch of that fleet.
• OPT2: In proportion to the catch (in weight) of the species by the fleet relative to the total catch of that species by all fleets.
The settings for the eight chosen scenarios are listed in section 6 (mixed fisheries).
The runs, done at the SGECA meeting in Brussels from 29-31 October 2003 with the EIAA model, were based on a mix of inputs of catches and landings and therefore give incorrect results as they should be based on landings only. STECF have updated the input tables to include only landings and rerun the economic model.
As the Commission had requested OPT = 2 only this option was retained for the economic evaluation.
Table 3.3.3 - Settings for the 4 chosen scenarios
Scenario North Sea
Target –
Calculation option
Irish Sea
Target –
Calculation option
Decision weights
(See above)
3 – Mixed Fishery A – OPT 2 A – OPT 2 DW1
4 – Mixed Fishery A – OPT 2 A – OPT 2 DW2
7 – Mixed Fishery B – OPT 2 B – OPT 2 DW1
8 – Mixed Fishery B – OPT 2 B – OPT 2 DW2

40
Numbering of scenarios in the table above reflects numbering of scenarios given in Section 6 of this report. The TAC input for the EIAA model calculations based on the assumptions indicated in Table 3.3.3 are given in Table 3.3.4.
Table 3.3.4 - The MTAC outputs for the different scenario’s
Scenario 3
Target A
OPT=2
DW1
North Sea
Mixed Fishery
2004 landings
Irish Sea
Mixed Fishery
2004 landings
Cod 20000 1887
Haddock 24000 1048
Whiting 19000 500
Plaice 18000 844
Sole 3000 581
Saithe 89000
Nephrops 22550* 2279
Scenario 4
Target A
OPT=2
DW2
North Sea
Mixed Fishery
2004 landings
Irish Sea
Mixed Fishery
2004 landings
Cod 26000 2002
Haddock 41000 1118
Whiting 22000 589
Plaice 19000 892
Sole 3000 612
Saithe 141000
Nephrops 22550* 3101
Scenario 7
Target B
OPT=2
DW1
North Sea
Mixed Fishery
2004 landings
Irish Sea
Mixed Fishery
2004 landings
Cod 37000 2133
Haddock 43000 1204
Whiting 24500 590
Plaice 37000 914
Sole 5000 592
Saithe 114000
Nephrops 22550* 2759
Scenario 8
Target B
OPT=2
DW2
North Sea
Mixed Fishery
2004 landings
Irish Sea
Mixed Fishery
2004 landings
Cod 41000 2231
Haddock 55000 1264
Whiting 26000 669
Plaice 38000 957
Sole 5000 623
Saithe 157000
Nephrops 22550* 3528

41
* Total landings for North Sea Nephrops used as fixed
In the absence of any ICES single stock advice for North Sea Haddock and Plaice, STECF used corresponding landings from the WG report for Haddock at Fpa and for Plaice at F = 0.3 (agreement between EU and Norway since 1999).
3.3.2 EIAA model calculation of the “Mixed fisheries” scenarios
The results of the EIAA model calculations is given in tables 3.3.5 to 3.3.10 for the fleet segments in Belgium (2 segments), Denmark (4 segments), France (2 segments), The Netherlands (2 segments), Sweden (6 segments) and UK (5 segments).
General comparison between different scenarios is rather difficult as there are significant differences between fleet segments in different countries. It can be concluded however, that taking Gross value added as a universal indicator for overall performance, only scenario 8 (target B, OPT = 2, DW2) produces a higher GVA figure than the ICES/ACFM single species (base case) scenario. See table below
Scenario Gross value added
ICES/ACFM Single species 720
4 684
3 682
8 735
7 712
The above calculations essentially reflect the situation in the North Sea as fleet segments represented in the calculations operates mainly in that area.
Taking into account operating profit margin, it can be seen from tables’ 3.3.5 to3.3.10 that fleet segments mostly affected are beam and demersal trawlers fishing in the North Sea as well as Scottish demersal seiners.
STECF wish to emphasise that uncertainty, related to data and models, has to be taken into account in the evaluation of the results (see also chapter 6).
Base Case
ICES/ACFM
North Sea Mixed Fishery
2004 landings
Irish Sea Mixed Fishery
2004 landings
Cod 0 0
Haddock 64600 1500
Whiting 16000 0
Plaice 47300 1600
Sole 17900 790
Saithe 111360
Nephrops 22550* 9550

42
Table 3.3.5 – Mixed Fishery analysis – Belgium
Belgium - Mixed Fishery Scenario Analysis - 2004 2000-2002 2003 2004 ICES Scenario4 Scenario3 Scenario8 Scenario7
B: Beam trawlers <=24m
Operating profit margin 2.3% 0.5% -1.5% -1.7% -2.0% -0.5% -0.6%
Performance STABLE STABLE STABLE STABLE STABLE STABLE STABLE
Value of landings 13.3 12.7 11.7 10.2 10.1 11.0 10.9
Crew share 4.2 4.0 3.7 3.2 3.2 3.5 3.5
Gross cash flow 3.0 2.7 2.5 2.5 2.4 2.6 2.6
Net profit 0.3 0.1 -0.2 -0.2 -0.2 -0.1 -0.1
Gross value added 7.2 6.7 6.2 5.7 5.6 6.1 6.0
B: Beam trawlers >24m
Operating profit margin -1.6% -3.2% -4.7% -3.2% -3.3% -2.7% -2.7%
Performance STABLE STABLE STABLE STABLE STABLE STABLE STABLE
Value of landings 70.3 67.1 62.3 54.8 54.0 58.8 58.2
Crew share 20.9 19.9 18.5 16.3 16.0 17.5 17.3
Gross cash flow 12.8 11.7 11.0 12.2 12.1 12.3 12.3
Net profit -1.1 -2.2 -2.9 -1.7 -1.8 -1.6 -1.6
Gross value added 33.7 31.7 29.5 28.4 28.2 29.8 29.6

43
Table 3.3.6 – Mixed Fishery analysis – Denmark
Denmark - Mixed Fishery Scenario Analysis - 2004 2000-2002 2003 2004 ICES Scenario 4 Scenario 3 Scenario 8 Scenario 7
Trawler>200GT Operating profit
margin -2.7% -4.3% -3.0% -3.1% -3.2% -2.8% -2.9% Performance STABLE STABLE STABLE STABLE STABLE STABLE STABLE
Value of landings 147.0 142.0 146.6 146.3 145.7 147.3 146.8 Crew share 45.1 43.5 44.9 44.9 44.7 45.1 45.0
Gross cash flow 33.6 31.4 33.1 33.1 32.8 33.4 33.2 Net profit -3.9 -6.2 -4.5 -4.5 -4.7 -4.1 -4.3
Gross value added 78.7 74.9 78.0 77.9 77.5 78.6 78.2 Trawler<200GT Operating profit
margin -8.3% -14.0% -16.4% -15.6% -16.4% -14.3% -14.8% Performance UNPROFITABLE UNPROFITABLE UNPROFITABLE UNPROFITABLE UNPROFITABLE UNPROFITABLE UNPROFITABLE
Value of landings 152.0 133.7 126.5 128.5 126.4 132.4 130.9 Crew share 68.9 60.6 57.4 58.3 57.3 60.0 59.3
Gross cash flow 17.0 10.9 9.0 9.7 8.9 10.8 10.3 Net profit -12.6 -18.8 -20.7 -20.0 -20.7 -18.9 -19.4
Gross value added 85.9 71.5 66.3 67.9 66.2 70.8 69.6 Danish seiners Operating profit
margin -2.5% -7.1% -15.1% -17.2% -18.2% -13.4% -14.0% Performance STABLE UNPROFITABLE UNPROFITABLE UNPROFITABLE UNPROFITABLE UNPROFITABLE UNPROFITABLE
Value of landings 27.0 24.0 20.0 18.8 18.4 20.6 20.3 Crew share 13.7 12.2 10.2 9.6 9.4 10.5 10.3
Gross cash flow 2.9 1.9 0.6 0.3 0.2 0.8 0.7 Net profit -0.7 -1.7 -3.0 -3.2 -3.3 -2.8 -2.9
Gross value added 16.6 14.1 10.7 9.9 9.6 11.3 11.1 Gill net
Operating profit margin -19.6% -31.8% -44.6% -45.0% -47.0% -40.1% -41.2%
Performance UNPROFITABLE UNPROFITABLE UNPROFITABLE UNPROFITABLE UNPROFITABLE UNPROFITABLE UNPROFITABLE Value of landings 64.8 49.1 38.4 38.3 37.1 41.6 40.8
Crew share 41.8 31.6 24.8 24.7 23.9 26.8 26.3 Gross cash flow 0.4 -2.5 -4.0 -4.1 -4.3 -3.5 -3.7
Net profit -12.7 -15.6 -17.1 -17.2 -17.5 -16.7 -16.8
Gross value added 42.2 29.2 20.8 20.6 19.6 23.3 22.6

44
Table 3.3.7 – Mixed Fishery analysis – France
France - Mixed Fishery Scenario Analysis - 2004 2000-2002 2003 2004 ICES Scenario 4 Scenario 3 Scenario 8 Scenario 7
Atlantic Bottom trawlers
Operating profit margin (%) 12.7% 11.3% 13.6% 12.0% 14.2% 13.0% 12.0%
Performance PROFITABLE PROFITABLE PROFITABLE PROFITABLE PROFITABLE PROFITABLE PROFITABLE
Value of landings 348.0 333.8 338.9 323.7 345.0 332.8 325.3
Crew share 111.7 107.1 108.7 103.9 110.7 106.8 104.4
Gross cash flow 93.9 87.7 96.2 88.9 99.0 93.2 89.2
Net profit 44.4 37.7 46.2 38.9 49.0 43.2 39.2
Gross value added 205.7 194.8 205.0 192.8 209.7 200.0 193.5
Atlantic netters
Operating profit margin (%) 18.3% 15.8% 13.2% 13.2% 13.0% 13.0% 11.3%
Performance PROFITABLE PROFITABLE PROFITABLE PROFITABLE PROFITABLE PROFITABLE PROFITABLE
Value of landings 112.7 105.5 96.3 96.3 95.9 95.9 91.9
Crew share 43.9 41.2 37.6 37.5 37.4 37.4 35.9
Gross cash flow 31.3 28.0 24.1 24.0 23.8 23.8 21.7
Net profit 20.6 16.6 12.7 12.7 12.5 12.5 10.4
Gross value added 75.3 69.1 61.6 61.5 61.2 61.2 57.6

45
Table 3.3.8 – Mixed Fishery analysis – The Netherlands
The Netherlands - Mixed Fishery Scenario Analysis - 2004 2000-2002 2003 2004 ICES Scenario 4 Scenario 3 Scenario 8 Scenario 7
NL: Beam trawlers <=24m
Operating profit margin 3.5% -1.4% -2.2% -15.6% -16.5% -9.4% -9.9%
Performance STABLE STABLE STABLE UNPROFITABLE UNPROFITABLE UNPROFITABLE UNPROFITABLE
Value of landings 62.3 57.8 57.1 45.1 44.7 48.7 48.4
Crew share 23.2 21.5 21.2 16.8 16.6 18.1 18.0
Gross cash flow 12.2 9.2 8.8 3.0 2.6 5.4 5.2
Net profit 2.2 -0.8 -1.2 -7.0 -7.4 -4.6 -4.8
Gross value added 35.0 30.7 30.0 19.8 19.3 23.5 23.2
NL: Beam trawlers >24m
Operating profit margin 0.3% -8.7% -10.8% -29.8% -30.7% -19.2% -19.7%
Performance STABLE UNPROFITABLE UNPROFITABLE UNPROFITABLE UNPROFITABLE UNPROFITABLE UNPROFITABLE
Value of landings 202.1 177.9 175.1 79.8 78.4 104.8 103.8
Crew share 50.7 44.6 43.9 20.0 19.6 26.3 26.0
Gross cash flow 35.4 18.9 15.8 11.0 10.7 14.6 14.3
Net profit 0.6 -15.9 -18.9 -23.8 -24.1 -20.2 -20.4
Gross value added 86.3 63.4 59.7 31.0 30.3 40.8 40.3

46
Table 3.3.9 – Mixed Fishery analysis – Sweden
Sweden - Mixed Fisheries Scenario Analysis - 2004 2000-2002 2003 2004 ICES Scenario 4 Scenario 3 Scenario 8 Scenario 7
Pelagic trawlers / purse seiners >=24 Operating profit margin 27.3% 15.4% 19.4% 19.4% 19.4% 19.3% 19.4%
Performance PROFITABLE PROFITABLE PROFITABLE PROFITABLE PROFITABLE PROFITABLE PROFITABLE
Value of landings 53.6 34.4 39.2 39.1 39.1 39.0 39.0
Crew share 12.7 8.2 9.3 9.3 9.3 9.3 9.3
Gross cash flow 14.6 5.3 7.6 7.6 7.6 7.6 7.6
Net profit 14.6 5.3 7.6 7.6 7.6 7.6 7.6
Gross value added 27.4 13.5 16.9 16.9 16.9 16.8 16.8
Shrimp trawlers Operating profit margin 32.8% 32.9% 32.3% 32.3% 32.3% 32.2% 32.2%
Performance PROFITABLE PROFITABLE PROFITABLE PROFITABLE PROFITABLE PROFITABLE PROFITABLE
Value of landings 12.9 12.4 11.7 11.7 11.7 11.7 11.7
Crew share 3.3 3.2 3.0 3.0 3.0 3.0 3.0
Gross cash flow 4.2 4.1 3.8 3.8 3.8 3.8 3.8
Net profit 4.2 4.1 3.8 3.8 3.8 3.8 3.8
Gross value added 7.5 7.3 6.8 6.8 6.8 6.8 6.8
Trawlers >=24 Operating profit margin 20.5% 11.0% 9.3% 11.3% 8.4% 12.0% 9.9%
Performance PROFITABLE PROFITABLE PROFITABLE PROFITABLE PROFITABLE PROFITABLE PROFITABLE
Value of landings 14.8 11.7 10.4 10.9 10.1 11.2 10.5
Crew share 4.1 3.3 2.9 3.1 2.8 3.1 2.9
Gross cash flow 3.0 1.3 1.0 1.2 0.8 1.3 1.0
Net profit 3.0 1.3 1.0 1.2 0.8 1.3 1.0
Gross value added 7.2 4.6 3.9 4.3 3.7 4.5 4.0
Trawlers <24 Operating profit margin 18.7% 28.0% 22.7% 22.3% 21.8% 21.8% 21.4%
Performance PROFITABLE PROFITABLE PROFITABLE PROFITABLE PROFITABLE PROFITABLE PROFITABLE

47
Value of landings 11.4 12.7 10.4 10.2 10.1 10.1 10.0
Crew share 2.8 3.1 2.5 2.5 2.5 2.5 2.4
Gross cash flow 3.1 4.5 3.3 3.2 3.1 3.1 3.1
Net profit 2.1 3.5 2.3 2.3 2.2 2.2 2.1
Gross value added 5.8 7.5 5.8 5.7 5.6 5.6 5.5
Nephrop trawlers Operating profit margin 27.2% 29.2% 27.7% 27.9% 28.0% 27.9% 27.9%
Performance PROFITABLE PROFITABLE PROFITABLE PROFITABLE PROFITABLE PROFITABLE PROFITABLE
Value of landings 10.8 10.4 9.3 9.5 9.5 9.5 9.5
Crew share 3.4 3.2 2.9 3.0 3.0 3.0 3.0
Gross cash flow 2.9 3.0 2.6 2.7 2.7 2.6 2.7
Net profit 2.9 3.0 2.6 2.7 2.7 2.6 2.7
Gross value added 6.3 6.3 5.5 5.6 5.6 5.6 5.6
Gill netters >=12 Operating profit margin 33.1% 34.2% 34.6%
Performance PROFITABLE PROFITABLE PROFITABLE
Value of landings 4.0 3.7 3.2
Crew share 1.4 1.3 1.1
Gross cash flow 1.3 1.3 1.1
Net profit 1.3 1.3 1.1
Gross value added 2.7 2.5 2.2

48
Table 3.3.10 – Mixed Fishery analysis – UK
UK - Mixed Fishery Scenario Analysis - 2004 2000-2002 2003 2004 ICES Scenario 4 Scenario 3 Scenario 8 Scenario 7
Scottish Demersal Trawlers >24m
Operating profit margin 4.9% 0.7% -1.9% 2.9% -0.9% 6.5% 4.7%
Performance STABLE STABLE STABLE STABLE STABLE PROFITABLE STABLE
Value of landings 122.8 104.3 98.4 107.9 100.0 117.6 112.5
Crew share 31.6 26.9 25.4 27.8 25.8 30.3 29.0
Gross cash flow 16.9 11.5 8.9 14.0 10.0 18.4 16.1
Net profit 6.1 0.7 -1.9 3.2 -0.9 7.6 5.3
Gross value added 48.5 38.4 34.3 41.8 35.7 48.7 45.1
Scottish Demersal Trawlers <24m
Operating profit margin -5.7% -14.5% -10.3% -7.1% -9.5% -4.5% -5.9%
Performance UNPROFITABLE UNPROFITABLE UNPROFITABLE UNPROFITABLE UNPROFITABLE STABLE UNPROFITABLE
Value of landings 86.9 71.8 75.8 80.6 76.8 85.3 82.8
Crew share 24.9 20.6 21.8 23.1 22.0 24.5 23.8
Gross cash flow 6.5 1.0 3.6 5.7 4.2 7.6 6.6
Net profit -5.0 -10.4 -7.8 -5.7 -7.3 -3.9 -4.9
Gross value added 31.4 21.6 25.4 28.9 26.2 32.1 30.3
Scottish Demersal Seiners
Operating profit margin -1.5% 1.1% -11.3% -4.4% -11.4% 1.6% -1.4%
Performance STABLE STABLE UNPROFITABLE STABLE UNPROFITABLE STABLE STABLE
Value of landings 50.0 45.4 37.2 42.7 37.1 49.4 45.8
Crew share 16.6 15.1 12.4 14.2 12.3 16.4 15.2
Gross cash flow 4.5 5.7 1.0 3.3 1.0 6.0 4.6
Net profit -0.8 0.5 -4.2 -1.9 -4.2 0.8 -0.6

49
Gross value added 21.1 20.8 13.4 17.5 13.3 22.5 19.8
United Kingdom, Beam Trawlers
Operating profit margin -14.7% 1.3% -44.2% -42.3% -42.9% -33.8% -34.3%
Performance UNPROFITABLE STABLE UNPROFITABLE UNPROFITABLE UNPROFITABLE UNPROFITABLE UNPROFITABLE
Value of landings 97.0 113.7 63.0 64.3 63.8 72.4 71.9
Crew share 23.0 27.0 14.9 15.3 15.1 17.2 17.1
Gross cash flow -1.6 14.2 -15.2 -14.5 -14.7 -11.8 -11.9
Net profit -14.3 1.5 -27.9 -27.2 -27.4 -24.5 -24.6
Gross value added 21.4 41.1 -0.2 0.8 0.5 5.4 5.1
Scottish Nephrops Trawlers
Operating profit margin 5.7% 4.2% 7.2% 7.4% 7.1% 7.7% 7.5%
Performance PROFITABLE STABLE PROFITABLE PROFITABLE PROFITABLE PROFITABLE PROFITABLE
Value of landings 82.9 79.1 86.3 86.7 85.9 87.6 87.0
Crew share 27.0 25.8 28.1 28.2 28.0 28.5 28.4
Gross cash flow 11.2 9.8 12.6 12.8 12.5 13.2 12.9
Net profit 4.8 3.4 6.2 6.4 6.1 6.8 6.5
Gross value added 38.2 35.6 40.8 41.1 40.5 41.7 41.3
50
4 ELASMOBRANCHS FISHERIES.
4.1 STECF COMMENTS AND RECOMMENDATIONS STECF has reviewed the report on elasmobranch fisheries, prepared during the second SGRST meeting on Elasmobranch Fishes, held from 22 to 25 July 2003 (SEC (2003)1427). The report presents a comprehensive reference work on the current knowledge of elasmobranchs in many of the world’s seas. STECF welcomes the report and endorses its findings, noting that for most of the species described in the report, there is a paucity of data on their life histories, their roles as top predators and their exploitation rates. Therefore there is an urgent need for fishery related data on elasmobranchs in order to provide better stock assessments and management advice.
STECF acknowledges the large amount of work involved in collating all the available information on this issue. It is important to remark that relatively few studies have been specifically devoted to elasmobranchs, and most of the fishery data on elasmobranchs are scattered throughout a large number of fishery reports, most relating to fisheries for other species.
The SGRST report supplements the information presented in its previous report and provides a significant improvement on the knowledge of EU fisheries that exploit elasmobranch stocks. Landings data on elasmobranchs have been extended and the report now includes a much more detailed and focused overview of the fisheries in the Mediterranean where elasmobranchs are caught.
STECF also recognises the considerable effort made by SGRST, to collate and comment on the available information on species distribution, stock structure, biometrics (length-weight relationships and other conversion factors), species ecology, breeding seasons, breeding grounds, spawning and nursery grounds, feeding grounds, essential fish habitats and ecosystem considerations. A long and useful list of conversion factors is included, and the report also lists those species for which such data are missing.
The report summarises the group’s considerations on elasmobranch management and proposes appropriate management units. This section of the SGRST reports clearly shows that for many species of elasmobranchs even the most basic information required for providing useful management advice are missing. STECF notes that this part of the report is extremely useful and can be used in the further development of the existing data collection regulation or to address specific pilot studies.
STECF notes that the comprehensive overview and revision of the list of priority species either from a fishery or a conservation point of view, provides a useful tool to establish priorities for management purposes. These sections of the SGRST report will prove to be particularly valuable if used in conjunction with the critical examination of case studies of existing International Plan of Actions (IPOA) on elasmobranch species. This is particularly true as most of catches are due to fisheries not targeting elasmobranch species. The draft for a Community IPOA included in the SGRST report could help to better define the Plan.
Due to the lack of historical reference points for most of the stocks, STECF recommends an increase in effort in the collation of all the available information on elasmobranch species. Many data exist in reports written between the 1960s and 1980s, with special foci on large pelagic fisheries (long-lines and drift-nets). Such a collation would allow historical benchmarks to be developed for the stock assessment of priority species.

51
STECF also recommends improving the data collection for the elasmobranch species by using observers on board of commercial fishing vessels, wherever practicable.
STECF shares the SGRST opinion that species specific catch and landing data be collected on the following species:
• Blue shark (Prionace glauca) in the entire ICCAT area;
• Mako shark (Isurus oxyrinchus) in the entire ICCAT area;
• Porbeagle (Lamna nasus) in the entire ICCAT area;
• Species within the family Squalidae in the NAFO area;
• Species of deep-water sharks which are subject to management under Council Regulation (EC) No. 2340/2002 and No. 2347/2002;
• Species included in priority lists for fishery, others than those listed above (Tope, Galeorhinus galeus, in NE Atlantic; Greenland shark, Somniosus microcephalus, in Northern waters, sub-areas I, II and III of Greenland; Lesser spotted dogfish, Scyliorhinus canicula, in areas other than VIIIc; Starry ray, Amblyraja radiata, in Iceland waters, Divison V; Common skate, Dipturus batis; Smalleyed ray, Raja microcellata, in Bristol Channel VIIf; Skates and rays, Rajidae, in Iberian coast, Bay of Biscay, Irish Sea, Bristol Channel, Celtic Sea VIIa,f,g, Channel VIId,a, North Sea sub-area IV;
• Species included in priority lists for conservation (by CITES or/and Barcelona Convention, Bern Convention, Barcelona Convention, Bonn Convention, UN Agreement on Straddling Fish Stocks and Highly Migratory Fish Stocks), others than those listed above Basking shark, Cetorhinus maximus; Devil ray, Mobula mobular; White skate, Rostroraja alba; Angel shark, Squatina squatina; Great white shark, Charcharodon carcharias.
STECF suggests that an evaluation should be undertaked in order to establish whether the inclusion of the above species in the EU data collection regulation would enable the collection of the data desired for these species. This could be undertaken by an expert group convened under the auspices of the STECF Sub-group on Research needs (SGRN). Should the conclusion of the Expert group be that the desired data is unlikely to be obtained under the data collection regulation, STECF recommends that specific Pilot studies be initiated. STECF underlines that the first three species of the list, Blue shark (Prionace glauca), Mako shark (Isurus oxyrinchus) and Porbeagle (Lamna nasus), should be included in the minimum programme at the first opportunity, due to ICCAT, ICES and FAO requirements.
STECF is aware that issues surrounding elasmobranchs are particularly emotive, of growing concern to public opinion and the mass media. STECF acknowledges that better data provision on catches and exploitation are required by managers to address these issues.
STECF suggests that the EC should strongly encourage all Member States to provide data on elasmobranchs, especially considering that most of these species are top predators and their absence or presence can potentially have large effects on fisheries and ecosystems.

52
5 MEDITERRANEAN
5.1 MEDITERRANEAN FISHERIES STECF was requested to review, comment as appropriate and endorse the report prepared by the SGMED (24-28 March 2003) on this matter.
STECF considered the paper produced by the SGMED and found that it has not been duly amended according to the remarks and suggestions provided in the last plenary meeting (April, 2003).
STECF pointed out that the report needs a further and deeper revision to be finalized, and the co-ordinator was unable to achieve this by correspondence.
Therefore STECF recommends that the Commission convene a new SGMED working group, early in 2004, to critically review and finalise the report prepared by SGMED at its meeting of 24-28 March 2003. This working group should include the STECF members with appropriate expertise and no more than two experts from relevant EU (Mediterranean) member states.
5.2 FUTURE WORK ON ECONOMIC ASPECTS OF MEDITERRANEAN FISHERIES
5.2.1 Background
The STECF was asked by the Commission to give an overall knowledge of the fishing activity of the E.U. Mediterranean Countries and of the status of the stocks in the Mediterranean.
Three Scientific, Technical and Economic Committee for Fisheries Sub-Group on Mediterranean (SGMED) meetings were proposed (SEC (2003)288) to have an overview over the Mediterranean Fisheries.
A first subgroup on shared stocks was convened in September 2002 (SEC(2002)1374) and the results were reported to the last STECF plenary meeting. The report is available on the DG-Fish web site:
http://europa.eu.int/comm/fisheries/doc_et_publ/factsheets/legal_texts/rapp_en.htm
The second subgroup, chaired by Gaetano Messina, was tasked to define the Mediterranean EU fleets, the applied and potential technical regulations and pros & cons of different alternative management options. The meeting was held in Brussels in March 2003 ( see section 5.1 above).
A third session of the SGMED should address the economic aspects of the Mediterranean fisheries; provisional terms of reference have been agreed at the 15th STECF session but it is expected that this third meeting will also benefit from information and suggestions from the elaboration of the SGMED reports on “shared stocks” (SEC(2002)1374) and “fleets and technical measures” respectively.
If information on a specific issue is not yet available STECF coulddraw analogies by making reference to scientific works carried out in areas outside the Mediterranean.

53
STECF believes that this meeting has to consider also the Commission Communication on a Mediterranean Plan of Action [COM(2002) 535 final] and the Proposal of Council Regulation relative to the management measures for the sustainable exploitation of fishing resources in the Mediterranean Sea, that change the Regulations (EEC) nº 2847/93 and (EC) nº 973/2001 (COM(2003) 589 final).
In particular, there is a need to present some basic harmonised information, to evaluate the social impact of the plan, the financial needs, the effects on the consumers, the management cost and the possibilities of developing an effective control to assure the real application of the proposed management actions.
Scientific advice for the Mediterranean fisheries calls for improvements of exploitation patterns through effort reduction and technical measures. To this end, it is fundamental an updated listing and description of the different fisheries currently undertaken in the various area by Community fishermen, irrespective of their legal status and of the fact that they catch shared or national stocks. In addition, to complement the work done during the previous subgroups, STECF should provide economic knowledge on other important shared stocks and fisheries not already addressed.
From the previous meeting reports, the WG should be able to obtain information on the requirement for fishing effort reductions for the various fisheries by different GFCM geographical sub-areas. In particular, for the mixed fisheries consideration must be given to how effort reductions are weighting according to the catch composition. The evaluation of the socio-economic impacts of alternative options to fishing effort reductions and mesh size increases to achieve equivalent reductions in fishing mortality is the main objective of the WG.
This analysis needs to consider several fisheries, identified by gear type and target species (or group of species) but considered as economic unit (enterprise or vessel). STECF stresses the importance of a common definition of “fishery” in order to avoid different approaches in the various GSA.
5.2.2 Terms of reference
The terms of reference, previously defined and accepted by the STECF in the 15th Session are as follows:
1. Employment by fleets and areas: basic figures and characteristics.
2. Investments by fleets in EU area (and candidates?)
3. Value of landings (distribution and time evolution) by fleets
4. Basic accounts of the fleets: wages, costs
5. Relative overcapacity: possible methodologies and description of basic trends.
6. Market characteristics: channels, control, prices.
7. Basic national control systems: institutions, legislation, resources and running costs
After the experience gained by the previous WGs and in the frame of the new regulations in progress, it is suggested to redefine new Terms of Reference. So the ultimate enlarged TOR shall be the following:

54
1. Evaluate the economic data available for the Mediterranean fleets and markets in E.U. Countries.
2. Evaluate the potential interaction between economic and biological data for the Mediterranean fleets in E.U. Countries
3. Describe the socioeconomic potential impact of the different management options for the Mediterranean fisheries: technical regulations, fleets resizing, effort redistribution, fishing days reduction or redistribution, economic incentives, etc.
4. Revise the useful bioeconomic models available or in progress (BEMMFISH, MEFISTO; MOSES, etc.) in the context of Mediterranean fisheries
5. Develop some pilot analysis on some representative fisheries from the data contributed by the experts of the WG. It is expected some work before the WG from projects and national institutes, to prepare some simulations. Predict short and long-term results in catches, biomass and economic consequences under the assumption of different management possibilities.
6. Draw some provisional conclusions on the relation of the impact over fishermen, administrators and consumers in short and long term of the alternative measures over:
a. Employment and social impact
b. Economic performance of fisheries
c. Cost of management measures
d. Market behaviour
7. Summary and final considerations.
STECF suggests that the WG use the geographical sub-areas (GSA) adopted by the GFCM for management purposes. Participation by experts from the new EU Mediterranean countries (Malta, Cyprus and Slovenia) is desirable.
The meeting (chair Mr. Ramon Franquesa) is proposed to be held at June 2004 in Brussels.
6 MIXED FISHERIES STECF reviewed the report of the subgroup on Resource Status (SGRST) dealing with mixed fisheries SEC (2003) 1428 (chair Mr Stuart Reeves).
STECF welcomes the report of the SGRST meeting on Mixed Fisheries. This represents a considerable amount of work achieved by the participants in a very short period of time following ACFM. Firstly in section 6.1 we provide a review of the report on multi-species fisheries, and secondly in section 6.2 we provide a discussion of the utility of the multi-species advice on TAC that is produced by this process.
6.1 REVIEW OF MIXED FISHERIES REPORT
6.1.1 Species considered.
The species considered by the study group were the dominant commercial demersal species; cod, haddock, whiting, saithe, plaice, sole and Nephrops. Generally these are thought to be the most important species for consideration within mixed fisheries in the North Sea and Irish

55
Sea which are covered by the report. STECF notes that the fleet specific landings for Nephrops are for trawl gears with a minimum cod-end mesh size less than 100mm. The fleet definitions used do not necessarily conform to fleet classifications used in some of the fisheries assessment WGs.
6.1.2 Use of landings data
Most of the analysis has been carried out using the official landings data by fleet and by country. This was the only data available. Data on discards have only been included for haddock and whiting in the North Sea and Nephrops and whiting in the Irish Sea, where they are explicitly included in the assessments. However, these data do not come from all fleets but are extrapolated from limited data. STECF is concerned that evaluation of mixed fisheries advice through landings may seriously distort the impact of some fisheries. To obtain realistic predictions of catch in a multispecies fishery constrained by TAC it is important to consider total catch (both landings and discards), otherwise the results will be largely dependent only on the TAC already in place. STECF considers that the analysis provided gives a reasonable basis for exploration of the issues and methods required to provide multispecies advice. However, unless discarding remains constant across fleets and over time, the failure to include them ( or bycatch) in the analysis will give biased results. If TACs are set using these results this could be counter productive and may not achieve the intended management objective.
6.1.3 Choice of Fishing mortalities
The absence of accepted forecasts for some stocks in the North Sea is a potentially serious problem for giving any form of catch advice. ACFM did not give catch forecasts in circumstances where there were severe problems with estimation of terminal stock numbers and fishing mortalities, combined with further uncertainty due to the possible effects of management measures during 2003. The Commission provided the SG with F multipliers in the absence of ICES advice. Where the SG was unable to obtain status of stock data the SG used the best values that could be obtained from the ICES assessment WG reports. These values formed the basis for a sensitivity analysis carried out by the SG. In addition the Commission requested that the subgroup implement two specific scenarios. The SG noted that the options requested by the Commission for the North Sea MTAC runs reflect catch options relative to status quo. The ICES advice indicated the current situation is poorly known. However, as the MTAC model works with F multipliers the outputs although expressed as TACs may be considered as indicative of the scale of change in catch relative to the catch at Fsq.
6.1.4 Fleets
The fleet segmentation used in this analysis is chosen to reflect the functional units in the fisheries (métiers) and not those that conform to the MAGP segments and the data regulation (1639/2001). The analysis presented was carried out by fleet using landed tonnages assuming a fleet specific selection pattern where this was available. As the report indicates it is very important that fleet segmentation must match the fleet management capabilities. Segmentation should be properly chosen taking into account the ability for moving catch between fleets. Well-specified fleets that have a defined catch selection pattern will allow for the most flexible and therefore optimal solution to mixed fishery allocation. Combining fleets with diverse catch characteristics will reduce flexibility. If necessary fleets can be specified

56
by area or by season reflecting the possibility of seasonal and spatial restriction. It is therefore important for the future developments that fleet segmentation be defined at the appropriate level such that the métier has:
A homogeneous group of vessels with similar gears and fishing patterns, Sufficient data to describe catch of the métier, A distinct group of vessels that can be managed as a unit.
6.1.5 Methodology.
The MTAC software has been improved over the last 12 months and has now been used extensively during ICES WGs and in the SG. While evaluation of the software by the ICES Methods WG is advisable it is not anticipated that there will be significant problems. This type of method provides an alternative to earlier ad hoc methods of allocating fishing opportunities. That being said, STECF noted that the multispecies modelling method chosen assumes that the species composition by fleet is maintained when switching catch between fleets. While this may be acceptable for small adjustments to fisheries, this may be a demanding assumption for the level of change in fishing pattern that has been examined for the mixed fisheries that catch cod in North Sea
ACFM expressed concerns regarding the development of mixed fisheries advice. Overall the SG shares this concern and has dealt with the issues in two ways:-
1) ACFM did not provide single stock assessments and projections and F options for some species and there was a lack of clear management options. Following consultation with the Commission the SG used F multipliers from ICES Assessment WGs for stocks without explicit management options in the ICES advice and used these to carry out exploratory sensitivity analyses. To provide single species catch options F values would have to be selected in this way for single species TACs.
2) ACFM pointed out there were data inadequacies for mixed fishery management. This is a more difficult problem. Specifically there are poor fishery definitions, and lack of discard data. The SG agrees with ACFM that using this data for fleet based mixed fisheries management could be seriously flawed. The SG expresses a view which STECF accepts that in most cases it is preferable to obtain mixed species TAC advice from MTAC than to continue to use only traditional short-term single species forecasts or ad hoc modifications.
Overall, the SG acknowledges that the scientific basis underlying the mixed-species projections derived from MTAC and related datasets is not ideal one, but only the best available at the time of the meeting. The SG was of the opinion that, despite its numerous limitations, it would be more appropriate to provide advice based on evidence for the mixed-species nature of the different fisheries than advice that completely ignores the effects of technical interactions on the implementation success of TAC-based management.
6.1.6 Implementation Uncertainty.
STECF is concerned that the TACs supplied by MTAC imply that the resulting Fs will be achieved if TACs applied to individual species are set in the proposed proportions. STECF considers that only if the fleet keys are an accurate reflection of the catch by the fleets and that the distribution of TACs among fleets implied by the MTAC analysis is fully implemented will there be a possibility of achieving the suggested fishing mortalities. A

57
failure to implement the implied allocation key at the fleet level is likely to reduce or negate the effectiveness of the management considerably.
6.1.7 Choice of Scenarios
The SG report provides 3 sets of single species management targets (ICES, A and B). The values used are given separately for North Sea and Irish Sea in section 6.1.8(a) for the North Sea, and 6.1.8(c) for the Irish Sea.
These management targets include F multipliers from the ICES advice but also where these are not available some values selected by the Commission.
In addition to these targets two more management parameters are implemented with the MTAC software:
1) The software requires decision factors that express the importance attached to obtaining the different F multipliers for each species. The management parameters selected by the Commission were run with decision weights of 0.5 for cod and plaice in the North Sea and cod and whiting in the Irish Sea and with zero for all other species (DW1). The sensitivity analysis indicated that the model output is particularly sensitive to decision weights near to or equal to zero. Thus the outcome of the management selected by the Commission is very dependant on the weights. STECF has run two further options with decision weights of 0.48 for the chosen species and 0.01 for all other species (DW2) to illustrate this issue. The TACs resulting from the scenarios have been used in runs of the EIAA model to estimate the economic impact of these management options. See section 3.3
2) The software also provides two options for allocating catch among fleets. (OPT1 and OPT2 described as prop 1 and prop 2 in the SG report) These can be explained as follows:
• OPT1: In proportion to the catch (in weight) of the species within the total catch of that fleet.
• OPT2: In proportion to the catch (in weight) of the species by the fleet relative to the total catch of that species by all fleets.
The SG expresses a view that the OPT1 allocation method more closely matches the cod recovery plan. STECF does not agree with that view because the allocation of effort in the proposed recovery plan is weighted according to national catch as proportion of the total catch of cod. STECF considers that the choice between OPT1 and OPT2 is an implementation issue.
Note that as the ICES ‘mixed-species advice’ target gives zero catch for all fleets it is not documented further in the tables 6.2 and 6.6.
The combination of two management targets, two decision factors and two allocation options gives 8 scenarios for both the North and Irish Seas.
6.1.8 Area Specific Analyses
6.1.8.1 a) North Sea MTAC analysis
While STECF endorses the general methodology behind the model, the data used to provide input to the model should be viewed with caution. The limitations are:

58
– With the exception of haddock and whiting catch is taken as landings only, excluding discards,
– Not all of the fleets have individual age structured data
– For Nephrops the fleet catch is set for all scenarios to provide the ICES recommended F with resulting bycatch of other species included as a fixed component in the total catch.
There were three management targets given in table 6.1.
Table 6.1 Management Targets. Changes in fishing yield by species according to ICES Advice and Commission’s Target A and Target B for the North Sea (where Csq is catch at Fstatus Quo, Fstatus Quo is a fixed fishing mortality, and Fpa is the precautionary fishing mortality)
ICES Advice Target A Target B
Cod 0 0.2*Csq 0.35* Csq
Haddock Csq Csq Csq
Whiting Csq Csq Csq
Plaice 0 0.3* Csq 0.6* Csq
Sole Advice: Fpa Advice: Fpa Advice: Fpa
Saithe Advice: Fpa Advice: Fpa Advice: Fpa
Nephrops Constant Catch
The results for the first management target (ICES Advice) is for zero catch for all fleets as there is no fleet that does not catch some cod or some plaice. As all entries for all species are zero the results for this scenario are not included in the tables below.
The results for the two other management targets, the Commission’s Targets A and B are given in both in Table 6.2. and Figure 6.1. These two methods of presentation show the same information in tabular and graphical form to assist with presentation. Four optional implementations Decision Weights 1 & 2 with fleet allocations OPT1 and OPT2 are provided for comparison to emphasise the sensitivity of MTAC to the decision weights and implementation options. The results for the four scenarios for each of the Commission’s targets A and B illustrate that there are different outcomes for any single overall set of management targets. STECF notes that these are not the only possible management targets and other choices based either on biological or economic criteria could also be evaluated. STECF was particularly concerned about the use of decision weights of zero for the Commission examples. Zero implies that absolutely no account is taken of differences in catch between single species TACs and MTAC mixed species landings for species other than cod and plaice. This seems to STECF to be unlikely to be an acceptable management option..
The MTAC model assumes stability of species proportions through time; this stability cannot be expected, given the associated changes in fishing opportunity implied by the resulting changes in TAC and any technical measures that are to being implemented in 2002 and 2003.
The different outcomes for two management targets presented here (Target A and Target B) illustrate the sensitivity of the MTAC model approach. Very small changes in the choices of decision weights and the choice of allocation option across fleets (OPT1 or OPT2) results in a range of catch allocations. These differences may be important for management.

59
The results of scenarios in Table 6.2 for fleet allocation method OPT2 were used in an analysis of economic implications in the EIAA model. The results are reported in section 3.3.
Table 6.2 MTAC North Sea Landings by species for Commission's Scenarios Target A and Target B for different Decision Weights (DW1 and DW2 ) using fleet allocation methods OPT1 and OPT2.. The four weighting and implementation options are give in the top panel the results for Target A and Target B are given in panel 2 and 3 respectively. The ICES advice option gives zero catch for all conditions
Panel 1 Scenario 1 Scenario 2 Scenario 3 Scenario 4 Target A Target A Target A Target A
Decision weight 1
(DW1)
0.5 Cod and Plaice
0.0 All other species
Fixed Nephrops allocation
Decision weight 2
(DW2)
0.48 Cod and Plaice
0.01 All other species Fixed Nephrops allocation
Decision weight 1
(DW1)
0.5 Cod and Plaice
0.0 All other species Fixed Nephrops allocation
Decision weight 2
(DW2)
0.48 Cod and Plaice
0.01 All other species Fixed Nephrops allocation
Fleet combination Option 1
(OPT1)
Fleet combination Option 1
(OPT1)
Fleet combination Option 2
(OPT2)
Fleet combination Option 2
(OPT2)
Scenario 5 Scenario 6 Scenario 7 Scenario 8 Target B Target B Target B Target B
Decision weight 1
(DW1)
0.5 Cod and Plaice
0.0 All other species Fixed Nephrops allocation
Decision weight 2
(DW2)
0.48 Cod and Plaice
0.01 All other species Fixed Nephrops allocation
Decision weight 1
(DW1)
0.5 Cod and Plaice
0.0 All other species Fixed Nephrops allocation
Decision weight 2
(DW2)
0.48 Cod and Plaice
0.01 All other species Fixed Nephrops allocation
Fleet combination Option 1 (OPT1)
Fleet combination Option 1 (OPT1)
Fleet combination Option 2 (OPT2)
Fleet combination Option 2 (OPT2)

60
Panel 2
Panel 3
North Sea
Target A
OPT=1
Scenario 1
Mixed Fishery
2004 landings
DW1
Scenario 2
Mixed Fishery
2004 landings
DW2
Cod 22000 27000
Haddock 41800 52900
Whiting 20700 23400
Plaice 18000 19000
Sole 5000 6000
Saithe 117000 157000
Nephrops* 22550 22550
North Sea
Target A
OPT=2
Scenario 3
Mixed Fishery
2004 landings
DW1
Scenario 4
Mixed Fishery
2004 landings
DW2
Cod 20000 26000
Haddock 24000 41000
Whiting 19000 22000
Plaice 18000 19000
Sole 3000 3000
Saithe 89000 141000
Nephrops* 22550 22550
North Sea
Target B
OPT=1
Scenario 5
Mixed Fishery
2004 landings
DW1
Scenario 6
Mixed Fishery
2004 landings
DW2
Cod 35000 39000
Haddock 64100 72300
Whiting 27400 29400
Plaice 38000 39000
Sole 12000 12000
Saithe 125000 163000
Nephrops* 22550 22550
North Sea
Target B
OPT=2
Scenario 7
Mixed Fishery
2004 landings
DW2
Scenario 8
Mixed Fishery
2004 landings
DW2
Cod 37000 41000
Haddock 43000 55000
Whiting 24500 26000
Plaice 37000 38000
Sole 5000 5000
Saithe 114000 157000
Nephrops* 22550 22550

61
** Total TAC for the North Sea used as fixed
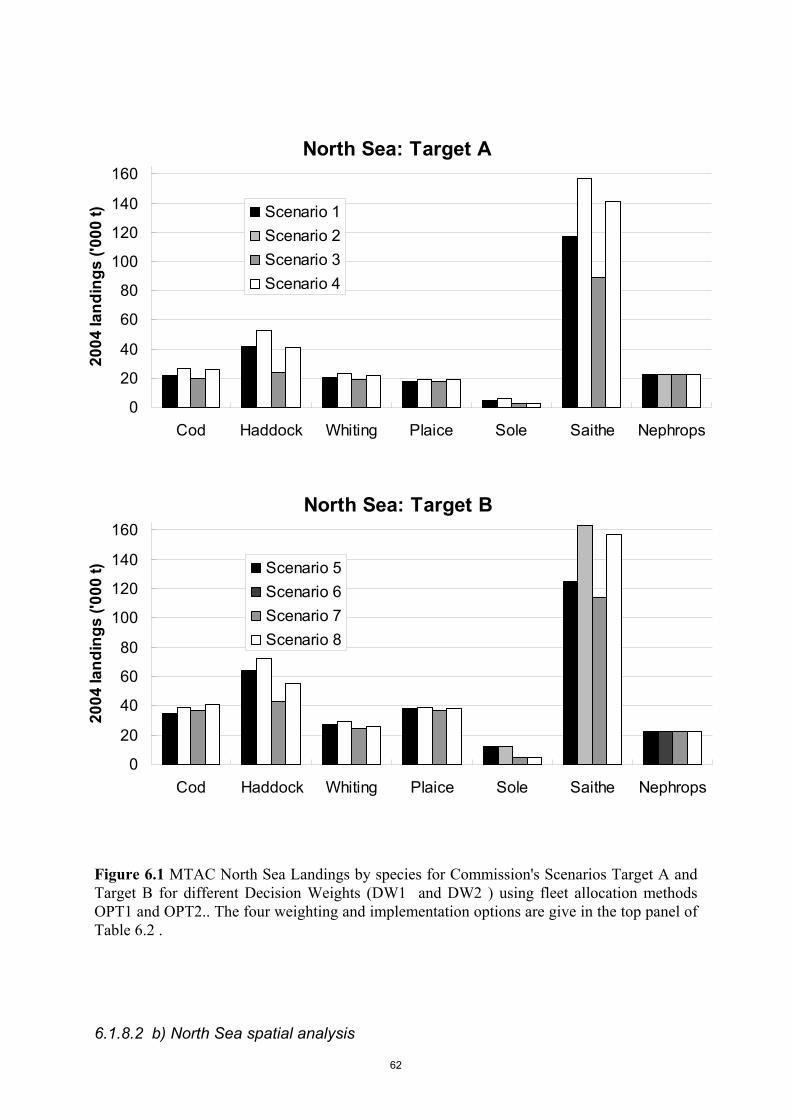
62
Figure 6.1 MTAC North Sea Landings by species for Commission's Scenarios Target A and Target B for different Decision Weights (DW1 and DW2 ) using fleet allocation methods OPT1 and OPT2.. The four weighting and implementation options are give in the top panel of Table 6.2 .
6.1.8.2 b) North Sea spatial analysis
North Sea: Target A
0
20
40
60
80
100
120
140
160
Cod Haddock Whiting Plaice Sole Saithe Nephrops
2004
land
ings
('00
0 t) Scenario 1
Scenario 2Scenario 3Scenario 4
North Sea: Target B
0
20
40
60
80
100
120
140
160
Cod Haddock Whiting Plaice Sole Saithe Nephrops
2004
land
ings
('00
0 t) Scenario 5
Scenario 6Scenario 7Scenario 8

63
In addition to the fleet based mixed species analysis the SG carried out an AD HOC investigations into the spatial pattern of landings and the potential impact of regional effort management using a data set of 2002 Area IV landings, for cod, haddock, whiting, saithe, plaice, sole and Nephrops. Five concepts were investigated
A. The effects on the landings of all species of increased activity in a “Haddock Box” where haddock catch is >60% of cod and haddock landings.
B. The effects on the landings of all species of increased activity in “Nephrops areas”. C. Identification of areas where cod and plaice contribute specified proportions >5% of
the landings. D. Examine the effects of landings of all species on a year round closure covering the
2001 “Cod spawning area”. E. Examine the effects of landings of all species on a year round closure based on cod
and plaice landings. For area A and B effort is increased in the haddock and nephrops boxes without reference two where effort might be reduced, for areas C,D and E effort is removed from the closed areas assuming effort removal and no increases effort in other areas.
The ‘Haddock Box’ including areas with >70% catches of haddock might be expected to yield improved selectivity if intra-annual variability in distribution is low. Nephrops areas could result in improved selection of Nephrops relative to cod and plaice but the areas that need to be selected are scattered and need careful definition.
The effects of a year round closure of a ‘Cod Spawning Area’ is given in Table 6.3 assuming no redirection of effort. This measure results in relative advantages for catches of whiting and saithe with some benefit for haddock.
The effects of a year round area closure for cod and plaice is given in table 6.4 for catch levels of 60-90% of total catch. The cod area is complex and difficult to define at moderate levels though the place area is relatively simple and clear to define. The effect is moderate for Cod with some advantages for saithe haddock and whiting but no advantage for sole.
Table 6.3 Effects of a year round closure of the “Cod spawning area” based on 2002 landings.
2002
landings
Landings
Outside closure
% of 2002 landings
Cod 37451 16715 44.63%
Haddock 50103 31730 63.33%
Whiting 14624 10307 70.48%
Saithe 88674 63064 71.12%
Sole 16101 8919 55.39%
Plaice 66292 29558 44.59%
Nephrops 13855 12222 88.21%

64
Table 6.4 Effects of year round closures of the “Cod and Plaice areas” based on 2002 landings. The figures represent the percentages of the 2002 catches which would be available under each scenario The area percentage refers to the highest yield percentage of the cod and plaice catch areas combined. (For example the 60%area is where the highest 60% of both Cod and Place catches occurred and the 36% for Cod and 84% for Nephrops is then the proportion of 2002 catch taken in the remaining part of the North Sea)
60% area 70% area 80% area 90% area
Cod 36% 23% 14% 6%
Haddock 62% 44% 36% 23%
Whiting 51% 34% 23% 11%
Saithe 68% 55% 48% 36%
Sole 38% 22% 13% 5%
Plaice 36% 24% 13% 6%
Nephrops 84% 75% 61% 40%
The area based analyses provide some indications that area closure can provide some preferential protection for cod over all other species. Either a haddock box or a cod closed area can possibly be helpful. Though protection for plaice cannot be obtained spatially without commensurate reductions in catch of sole. The results presented for here reflect the best that could have been obtained with perfect knowledge in 2002. Most importantly they do not deal with reallocation of effort. Unless effort had been strictly reallocated in an optimum manner the gains illustrated here would not have been achieved. Spatial management which involves effort displacement may have some other deleterious effects that counter some of the advantages. Spatial management which concentrates effort on part of the spatial distribution of a stock (in contrast to total area closure) may result in reduction in genetic diversity.
The chosen areas are complex and may be too complex for regulation. The results for each area are not additive, and any full proposal for an area would need to be evaluated separately using data from several years. As most of the North Sea fleets operate with spatial preference the potential area based benefits do not combine additively with the fleet based MTAC benefits. The STECF notes that it has not yet been possible to demonstrate benefits resulting from previous closed areas implemented under recovery measures for cod.
6.1.8.3 c) Irish Sea MTAC analysis
Similar to the North Sea the results for the first management target (ICES Advice) is for zero catch for all fleets as there is no fleet that does not catch some cod or some whiting. As all entries for all species are zero the results for this management target is not included in the tables below.
The results for the two other management targets, the Commission’s targets A and B, are given in Table 6.5. and Figure 6.2. These two methods of presentation show the same information in tabular and graphical form to assist with presentation. Four optional implementations Decision Weights 1 & 2 with fleet allocation options OPT1 and OPT2 are

65
provided for comparison to emphasise the sensitivity of MTAC to the decision weights and implementation options. The results for the four scenarios for each of the Commission’s targets A and B illustrate that there are different outcomes for any single overall set of objectives.
Table 6.5 Required changes in fishing yield by species according to ICES Advice and Commission Target A and Target B for the Irish Sea (where Csq is catch at Fstatus Quo, Fstatus Quo is a fixed fishing mortality, and Fpa is the precautionary fishing mortality)
Species ICES Advice Target A Target B
Cod 0 F for +30% SSB F for +30% SSB
Haddock Fpa Fpa Fpa
Whiting 0 0.2*Fsq 0.35*Fsq
Plaice Fpa Fpa Fpa
Sole Advice = 0.9* Fsq Advice = 0.9* Fsq Advice= 0.9* Fsq
Nephrops Fsq Fsq Fsq
STECF notes that these are not the only possible management targets and other choices based either on biological or economic criteria could also be evaluated. STECF was particularly concerned about the use of decision weights of zero for the Commission examples. Zero implies that absolutely no account is taken of differences in catch between single species TACs and MTAC mixed species landings for species other than cod and whiting. This seems to STECF to be unlikely to be an acceptable management option..
The MTAC model assumes stability of species proportions through time; this stability cannot be expected, given the associated changes in fishing opportunity implied by the resulting changes in TAC and any technical measures that are to being implemented in 2002 and 2003.
The results for the ICES Advice management target is zero catch for all fleets at there is no fleet that does not catch some cod or some whiting. The results for the two other management targets, the Commission’s targets A and B, are given in Table 6.5. Four optional implementations Decision Weights 1 & 2 with fleet allocation options OPT1 and OPT2 are provided for comparison.

66
Table 6.6 MTAC Irish Sea Landings by species for Commissions Target A and Target B for different Decision Weights (DW1 and DW2 ) using fleet allocation methods OPT1 and OPT2.. The four weighting and implementation options are give in the top panel the results for Target A and Target B are given in panel 2 and 3 respectively. The ICES advice option gives zero catch for all conditions
Panel 1 Scenario 1 Scenario 2 Scenario 3 Scenario 4 Target A Target A Target A Target A
Decision weight 1 (DW1) 0.5 Cod and Whiting 0.0 All other species
Decision weight 2 (DW2) 0.48 Cod and Whiting 0.01 All other species
Decision weight 1 (DW1) 0.5 Cod and Whiting 0.0 All other species
Decision weight 2 (DW2) 0.48 Cod and Whiting 0.01 All other species
Fleet combination Option 1 (OPT1)
Fleet combination Option 1 (OPT1)
Fleet combination Option 2 (OPT2)
Fleet combination Option 2 (OPT2)
Scenario 5 Scenario 6 Scenario 7 Scenario 8 Target B Target B Target B Target B
Decision weight 1 (DW1) 0.5 Cod and Whiting 0.0 All other species
Decision weight 2 (DW2) 0.48 Cod and Whiting 0.01 All other species
Decision weight 1 (DW1) 0.5 Cod and Whiting 0.0 All other species
Decision weight 2 (DW2) 0.48 Cod and Whiting 0.01 All other species
Fleet combination Option 1 (OPT1)
Fleet combination Option 1 (OPT1)
Fleet combination Option 2 (OPT2)
Fleet combination Option 2 (OPT2)

67
Panel 2
Panel 3
Irish Sea
Target A
OPT=1
Scenario 1
Mixed Fishery
2004 landings
DW1
Scenario 2
Mixed Fishery
2004 landings
DW2
Cod 1659 1767
Haddock 855 917
Whiting 604 668
Plaice 869 911
Sole 644 669
Nephrops 4280 4845
Irish Sea
Target A
OPT=2
Scenario 3
Mixed Fishery
2004 landings
DW1
Scenario 4
Mixed Fishery
2004 landings
DW2
Cod 1887 2002
Haddock 1048 1118
Whiting 500 589
Plaice 844 892
Sole 581 612
Nephrops 2279 3101
Irish Sea
Target B
OPT=1
Scenario 5
Mixed Fishery
2004 landings
DW1
Scenario 6
Mixed Fishery
2004 landings
DW2
Cod 1837 1927
Haddock 980 1031
Whiting 723 771
Plaice 909 947
Sole 651 675
Nephrops 5330 5765
Irish Sea
Target B
OPT=2
Scenario 7
Mixed Fishery
2004 landings
DW1
Scenario 8
Mixed Fishery
2004 landings
DW2
Cod 2133 2231
Haddock 1204 1264
Whiting 590 669
Plaice 914 957
Sole 592 623
Nephrops 2759 3528

68
Figure 6.2 MTAC Irish Sea Landings by species for Commissions Scenarios Target A and Target B for different Decision Weights (DW1 and DW2 ) using fleet allocation methods OPT1 and OPT2.. The four weighting and implementation options are give in the top panel of Table 6.6. The ICES advice option gives zero catch for all conditions
Irish Sea: Target A
0
1000
2000
3000
4000
5000
Cod Haddock Whiting Plaice Sole Nephrops
2004
land
ings
(t)
Scenario 1Scenario 2Scenario 3Scenario 4
Irish Sea: Target B
0
1000
2000
3000
4000
5000
Cod Haddock Whiting Plaice Sole Nephrops
2004
land
ings
(t)
Scenario 5Scenario 6Scenario 7Scenario 8

69
6.2 OVERALL CONCLUSIONS STECF draws the following main conclusions on the utility of the mixed fishery advice
• Managing mixed demersal fisheries according to the single species advice ignoring multispecies considerations will not achieve appropriate F for all species
• As the MTAC analysis is carried out with either limited or no discard data this results in errors in the catch by fleet and will result in errors in optimised catch by fleet used to give mixed species TACs.
• The mutispecies TACs supplied by MTAC will not deliver the required fishing mortality unless the distribution of MTAC implied TACs is fully implemented across the fleets. A failure to implement the implied allocation key at the fleet level is likely to reduce considerably or negate the effectiveness of the management.
• Where F multipliers and decision weights are very different among species small changes to the allocation across fleets (OPT and Decision Weights factors) can result in substantial changes the total catch for all species within the MTAC.
• Given the objective of improved mixed species fisheries management it is considered that despite the current limitations of the input data (incomplete catch data, sub-optimal fleet segmentation) and the likely failures in implementation the report nevertheless provides a step forward in providing improved mixed fisheries options for management.
• For the North Sea there are indications that area closures for cod protection and Nephrops or haddock boxes for concentrating these fisheries may be helpful when applied in concert with MTAC measures for cod conservation. However, more careful analysis is needed to determine the appropriate areas and their potential benefit alongside fleet TAC allocations.
The results of scenarios in Tables 6.2 and 6.5 for fleet allocation method OPT2 were used in an analysis of economic implications in the EIAA model. The results are reported in chapter 3.3.
7 INDICATOR OF ENVIRONMENTAL INTEGRATION IN THE CFP
7.1 BACKGROUND The need for a closer integration of environmental concerns to the Common Fisheries Policy (CFP) has been identified through the Cardiff Process and during the reform process of the CFP. The Commission is committed to integrate environmental protection requirements into the CFP. The need to develop a preliminary set of indicators of environmental integration for the CFP has been identified in Commission Communications COM/20022/186 and COM/2001/ 143. In order to support the Commission DG for Fisheries commissioned, through a call for tender, a study that has delivered the report “Development of preliminary indicators of environmental integration of the CFP”. The process of integration should be monitored by a system based on indicators; a pilot system of indicators is to be set up (COM(2002) 186 final). These indicators are due to become operational at the beginning of 2004 and a first assessment is due to be made in 2005.

70
It seems that a lot of effort has been put in different forums in developing fisheries environmental indicators, however, most indicators developed have not been tested yet and many indicators have not been operationalised at all. Some of the main criteria used by different forums in evaluation and comparison of indicators have been: Concreteness, theoretical basis, public awareness, cost, availability of measurement data, sensitivity to fishing activities and responsiveness.
According to experience gained it is recommendable to keep the quantity of indicators at a very limited level. The study identified roughly three types of indicators developed:
1) Indicators related to monitoring the state of single fish stocks,
2) Indicators related to monitoring the larger ecosystem by looking at several related fish stocks or the whole ecosystem,
3) Indicators related to fisheries management.
It seems that development work is most advanced and most experience exists with indicators of type 1. Ecosystem type indicators are more complex to handle than single stock indicators and development work is not yet finished. Very little of the development work undertaken relates to tools for monitoring the effectiveness of management activities such as structural policy, the common markets policy or horizontal policy of the CFP.
The study has created a structural/ hierarchical system for the indicators dividing the CFP into five main measure areas all of which environmental performance should be monitored. The identified components have been (following also the DG Fish policy areas): 1) Conservation measures, 2) structural measures, 3) market measures, 4) external measures, 5) horizontal measures. This type of approach is important in order to assure that different CFP measures do not function in a contradictory way in the sense of enhancing environmental integration. The study has been limited to EU internal fisheries policy and for this reason no indicators have been developed for EU external fisheries policy.
Indicators are used to represent complex processes in a simple manner and may be used to monitor and assess the performance of the integration strategy. To be useful they should be embedded in a conceptional framework allowing the understanding of their individual value within the context of the whole system.
In relation to policy-making, environmental indicators are used for three major purposes:
• to supply information on environmental problems, in order to enable policy-makers and public to value their seriousness
• to support policy development and priority-setting, by identifying key factors that cause pressure on the environment
• to monitor the effects of policy responses
In addition, environmental indicators may be used as a powerful tool to raise public awareness on environmental issues. Providing information on driving forces, impacts and policy responses is a common strategy to strengthen public support for policy measures.
7.2 STECF COMMENTS ON THE TWO REPORTS ON FISHERY AND ENVIRONMENT
At its 17th meeting in November 2003, STECF was asked to address the issue Indicators of environmental integration in the CFP. To do that STECF is requested to review and comment as appropriate both the “Development of preliminary indicators of environmental integration of the CFP” and the “ad hoc Working Group on indicators” (SEC (2004)29) reports and

71
propose a selection of indicators of environmental integration. On the basis of the STECF advice and selected indicators, the Commission will design an experimental monitoring system. Before the end of 2005, the Commission will submit to the Council and the European Parliament a report on the environmental performance of the CFP, based on the monitoring system.
7.2.1 The “development of preliminary indicators of environmental integration of the common fisheries policy” report
The contracted report examined the progress done in some international forum on the environmental indicators such as FAO, OECD, EEA, ICES, and others and analyzing, selecting and summarizing in tables a number of such indicators. Some conclusions on the indicators type, indicators already used and implications of their implementation are also included in the contracted report.
It looks in general that not an extensive amount of practical experience exists on the utilisation of different types of indicators. It seems that the most effort in the development work and the most experience exists with indicators related to monitoring single commercial stocks. In here it seems that currently the most developed indicators are those of ICES.
Based on the political framework in which the indicators are supposed to be used (the EU CFP) and based on the concrete planned environmental integration measures the report propose the following system for the utilisation of the indicators for monitoring environmental performance of the CFP:
ConservationMeasures
StructuralMeasures
MarketMeasures
External Measures
HorizontalIssues
-Control & Enforcement-Research-Stewardship
Question 1 Question 2
Indicator 1
Indicator 2
Indicator 3
Indicator 4
Indicator 1
Indicator 2
Indicator 3
Indicator 4
Question 1 Question 2
Indicator 1
Indicator 2
Indicator 3
Indicator 4
Indicator 1
Indicator 2
Indicator 3
Indicator 4
Question 1 Question 2
Indicator 1
Indicator 2
Indicator 3
Indicator 4
Indicator 1
Indicator 2
Indicator 3
Indicator 4
Question 1 Question 2
Indicator 1
Indicator 2
Indicator 3
Indicator 4
Indicator 1
Indicator 2
Indicator 3
Indicator 4
Question 1 Question 2
Indicator 1
Indicator 2
Indicator 3
Indicator 4
Indicator 1
Indicator 2
Indicator 3
Indicator 4
For each one of the five CFP components the proposed indicators structure include a limited number of environmental questions based on the identified political priorities (requirements of the CFP) posed by the Commission. These environmental questions have been formulated in such a way that they are suitable for matching with environmental indicators for each of the five DG Fish policy categories (Conservation measures; Structural measures; Market

72
measures; External measures5; Horizontal issues). The major part of the indicators for answering the questions under each policy category have been found through the international organisations although some innovations were added and presented in the contracted report.
STECF considers that the document reviews the existing useful information and data for the environmental indicators selection purpose tabulating the most important theme, the data source and the accessibility to the data. For most of the five policy categories the report comment on organisations as ICES, FAO or Eurostat where the information for the Atlantic and Baltic Sea exist or the data are compiled. The report does not fully consider the information available in the Mediterranean area to establish adequate environmental indicators
The report proposes a set of indicators that are ranked in the Annex II of that report. They were analysed by the STECF expert group on indicators and will be presented later on.
7.2.2 The ad hoc expert group on indicators report
An evaluation of the aforementioned contracted report was reviewed by an ad hoc expert group in order to prepare the work for the STECF. The expert group on Indicators met in Brussels from the 28th to 29th of October 2003 under the chairmanship of Mr. Gerjan Piet (SEC(2004)29). The report of this meeting was available to the STECF at its 17th meeting in November 2003.
The terms of reference of the expert groups were:
a. Discuss the report of the Contract Study by Jaakko Pöyry Infra, on the "Development of Preliminary Indicators of Environmental Integration of the Common Fisheries Policy" (Doc. No. FISH/2002/08);
b. Assess the appropriateness of the selection of indicators suggested in this study;
c. Analyse the operational requirements (data availability, computation needs) to attribute numerical values to the selected set of indicators.
The group has prepared a document available to the STECF members during its 17th meeting in Brussels. The potential environmental indicators were ranked as 1 (best fit to the evaluation purpose), 2 (less fit) and 3 (least fit). The expert group discussed all the proposed indicators ranked as 1 as well as some of those with lower ranks and indicated whether the contractor’s report covered the indicators issue well. Apart from some reservation listed in the expert group report, the expert group supported the conclusions of the contractors report.
Some indicators were considered to be acceptable without major change. On a number of others, group had some doubts (e.g. with regards to their definition, rationale, the type of supportive information needed, etc.), and minor modifications are proposed. A final group of indicators was considered as being unlikely to give the proper signals, and therefore to be rejected. If so, the reasons why are explained and, whenever possible or needed, more suitable alternatives are proposed. Most often, these alternatives were chosen from the existing list of indicators, where they figured with a lower initial rank.
With respect to the proposed suit of indicators, the group stressed that because of the diversity of the fisheries, the complexity of the ecosystem and the socio-economic factors related to fisheries, a limited suit of indicators will never be able to provide a comprehensive 5 STECF notes that the report did not address external measures.

73
description of this system. However, as a first step towards the integration of environmental concerns into the Common Fisheries policy (CFP) the aim was to cover as much as possible of the complexity of this system using a minimum number of indicators. In doing this the group followed the Contractors Report and distinguished indicators for:
• Conservation measures
• Structural measures
• Market measures
• Horizontal issues
Under the section "Indicators on Structural Measures", the group introduced a new question and a set of associated indicators that address the issue on how well the CFP promotes "good fishing practice".
7.3 STECF COMMENTS AND RECOMMENDATIONS STECF recognized in its 13th Report [(SEC 2002) 410] that the problem of incorporating environmental aspects in fisheries management is still prevailing. A possible approach could be the use of environmental indicators. It was emphasized that these indicators are determined by the perception of society. Communication about indicators is obviously also a factor not to be neglected.
STECF reviewed and recognized the efforts done by both groups working on the environmental indicators and consider that the proposed list of indicator provided below (based on the two reports) can be an useful tool to the implementation of the environmental aspects on the CFP.
STECF supports the use of DPSIR approach used by contract report (Driving forces, Pressure, State, Impact and Response) as the basic element when evaluating and planning the environmental impacts of fisheries and related management actions. This approach has been successfully applied in other environmental problems.
STECF considers, that the public awareness should be used as a driving force in improving the environmental performance of the fisheries sector. Use of inspections and law as enforcement system does not ensure a satisfactory result. Therefore, STECF supports the use of appropriate indicators in the development of the monitoring system.
STECF wishes to stress that there are several fishing regions within the European Union. The fisheries diversity in each region, the different level of fisheries data and analysis, the level of the scientific organization and advise, the complexity and diversity of ecosystems affected by the EU fisheries, the socio-economic factors related to fisheries and other considerations support the use of several indicators, which are also selected on area specific basis.
The contracted report and the expert report have not considered the costs of implementing a group of environmental indicators for all EU fisheries.
STECF recognizes that the establishment of a system of environmental indicators and their integration into the CFP, together with their monitoring, will imply additional costs that must be compared against the increased knowledge of how the CFP is working and assessed. Because different regions have different problems it will be necessary to adapt environmental indicators to each region.
STECF considers it necessary to organize pilot projects to analyze the implementation of limited environmental indicators, their constraints, the reaction of the fishing sector and public and the economic costs of monitoring.

74
STECF provides list of indicators as candidates from which the Commission may design an experimental monitoring system. Some of the indicators can be common to all areas and member states, but there is clearly a need for area and fisheries specific indicators, as well. STECF considers that the final selection should be carried out after pilot projects.
The list of candidate indicators is as follows (list is based on the Expert report and on the Contractors report). All indicators adopted by the working group are given.
1. INDICATORS ON CONSERVATION MEASURES
Q1: Are fisheries sustainable towards individual species?
Proposed indicator: Proportion of commercial stocks that are within safe biological limits
Proposed indicator: Proportion of a set of non-assessed populations which are decreasing in number.
Q2: Are fisheries sustainable towards fish communities?
Proposed indicator: Average size (length and weight) in the community
Proposed indicator: Mean trophic level
Proposed indicator: Mean maximum length
Q3: Is the impact of fisheries on marine habitats and non-fish species sustainable?
Proposed indicator: Trends in abundance of sensitive benthos species.
Proposed indicator: Area coverage of highly sensitive habitats.
Q4: Is aquaculture getting more environmentally sound?
Proposed indicator: Total aquaculture production and total area occupied by aquaculture installations
Proposed indicator: Water quality
Proposed indicator: Eco-efficiency of aquaculture
Proposed indicator: Potential impact of aquaculture, and particularly on the impact of reared fish (such as salmon) escaping from fish farms, on the genetic structure of wild (fish) populations.
2. INDICATORS ON STRUCTURAL MEASURES
Q1: Are the structure and organisation of the fishery sector supportive of environmental goals?
Proposed indicator: Effective fishing capacity and its spatial and temporal distribution (STECF considerer that this indicator should refer to adjusted fishing effort rather than fishing capacity)
Proposed indicator: Structural support and proportion allocated to promote environmental friendly fishing practices.
Q2: Is the CFP contributing to good fishing practices?

75
Although no proposed indicators are included under this epigraph the group underline several time series than can be used to estimate the appropriate indicators. Some of these are suggested in the end of this list.
3. INDICATORS ON MARKET MEASURES
Q1: Does the market develop in a way that is supportive of environmental goals?
Proposed indicator: The share of fish produced (or consumed) that are eco-labelled. (As working group indicated, this may not yet be useful due to the fact that eco-labelling is not yet common practise and that there is not jet internationally agreed guidelines for eco-labelling in fisheries products).
Proposed indicator: Initiatives to support eco-labelling and use of eco-labelling
Proposed indicator: The amounts of fish taken out of the market and/or traded on secondary (intervention) conditions.
Proposed indicator: The size of the European market for fish
Proposed indicator: Changes in consumer preferences in relation to environmental issues
4. INDICATORS ON HORIZONTAL MEASURES
Q1: Are the structure and organisation of the fishery inspection sector supportive of environmental goals?
Proposed indicator: Number of inspections per landing
Proposed indicator: Number of infringements over number of inspections.
Proposed indicator: Level of imposition of punishment
Q2: Is stakeholder participation increasing?
Proposed indicator: Attitudes and awareness of stakeholders towards CFP environmental goals
Proposed indicator: Number of violations (assuming that inspection is efficient)
Q3: Is the understanding of complex environmental issues improving in research as well as integration of scientific advice to decision making?
Proposed indicators: Total quantity of funds allocated to relevant research and Distribution of research funds
Proposed indicators: Scientific advice in decision making
Proposed indicators: Policy makers performance
In addition, STECF considers that the following indicators should be included to the candidate list (this list is based on the additional elements of expert document):
Indicators of conservation measures:
1) Biodiversity indicators.
2) Unwanted by-catches of protected species and discards as elements of the "good fishing practise"
Indicators of structural measures:

76
3) Mapping of effort distribution over the sensitive areas
4) Use of environmentally friendly gears
5) Oil consumption as a proxy for CO 2 production.
8 SAMPLING SCHEME OF CATCHES OF DEEP SEA FISHERIES STECF was requested to review the sampling plans for deep-sea species that have been submitted by Member States to the Commission. These plans concern the deployment of observers and sampling at port. Council Regulation 2347/2002 (and especially Article 8 thereof) describes the obligations of Member States in respect of these plans.
STECF should conduct a scientific and statistical evaluation, and should conclude on the extent to which each sampling plan conforms to the objective of ensuring the collection of representative data that are adequate for the assessment and management of deep-sea stocks.
8.1 STECF COMMENTS AND RECOMMENDATIONS Member states with allocations for deep sea resources are:
Belgium, Denmark, France, Germany, Ireland, Netherlands, Portugal, Spain, Sweden, UK
At its November 2003 plenary meeting STECF has received sampling plans from: France, Germany, Ireland, Portugal, Spain and UK.
To review compliance in data collection as outlined by member states for their sampling programmes with Article 8 of Council Regulation 2347/2002, STECF chose sampling criteria similar with the Annex of Commission Regulation 1639/2001, the minimum and extended sampling programme for biological sampling of catches.
STECF considers only sea sampling from catches of deep sea species representative while port sampling derived from landings is biased due to discarding of a variety of both commercial and non-commercial species. Additional port sampling can be useful in certain cases of clean fisheries with low by-catches of other species or discards. 5 % of the catches should be sampled by member states throughout the fishing seasons and grounds when TAC shares of a given management unit (Council Regulation 2340/2002, Annex 1) exceeds 100 tonnes per year.
Haul by haul information is required because of high variation in catch rates.
The reported sampling plan should cover the following details:
• vessel specification consistent with Commission Regulation 1639/2001, Appendix III (section C)
• haul specification (date, position, depth coverage, effort) for sampled hauls, effort to be given in accordance with Commission Regulation 1639/2001, Appendix IX (section D)
• gear specification consistent with Commission Regulation 1639/2001, Appendix III (section C)
• retained catch by species in numbers and weight (kg) by haul listed in Council Regulation 2347/2002, Annexes I and II.
• discard by species in numbers and weight (kg) by haul listed in Council Regulation 2347/2002, Annexes I and II.

77
• size composition of retained catch by species by haul listed in Council Regulation 2347/2002, Annexes I and II.
• size composition of discard by species by haul listed in Council Regulation 2347/2002, Annexes I and II.
• reporting of other individual biological data like sex, maturity or age is considered non obligatory but useful for assessment purposes in certain cases.
Table 8.1 lists an overview over the contents taken from the member state’s sampling schemes. Belgium, Denmark, Netherlands and Sweden have not provided a sampling plan and Germany’s plan does not cover the management unit “ling in Div. IV” and “ling in Divs. VI, VII, VIII, IX, X, XII and XIV”, respectively. STECF notes that Belgium and Sweden has only very small quota shares of deep sea species. Catches of deep sea species by Belgium and Sweden are therefore considered unlikely.

78
Table 8.1 Overview over the member state’s sampling schemes. Compliance with the above specified data requirements is indicated by a (+) while non-compliance or disregards are signed by a (-). Empty cells note that the sampling scheme is missing. Note that observer information must be provided on a haul by haul basis from sampled hauls.
Member
State Management unit >100 t
Sea
sampling Vessel Haul Gear
Retained catch
(n, kg)
Discard
(n, kg)
Size composition
of retained catch
Size composition
of discard
Other
biol.data
Belgium Others < 100 t
Denmark Greater silver smelt III, IV
Denmark Tusk IV
Denmark Roundnose grenadier III
Denmark Ling IV
Denmark Other < 100 t
France Black scabbardfish V, VI, VII, XII + + + + + + + + +
France Tusk V, VI, VII + + + + + + + + +
France Roundnose grenadier Vb, VI, VII + + + + + + + + +
France Orange roughy VII + + + + + + + + +
France Blue ling VI, VII + + + + + + + + +
France Ling IV + + + + + + + + +
France Ling VI, VII, VIII, IX, X, XII, XIV + + + + + + + + +
France Other < 100 t + + + + + + + + +
Germany Greater silver smelt V, VI, VII + + + + + + + + -
Germany Ling IV - - - - - - - - -
Germany Ling VI, VII, VIII, IX, X, XII, XIV - - - - - - - - -
Germany Other <100 t - - - - - - - - -
Ireland Greater silver smelt V, VI, VII + + + + + + + + +
Ireland Roundnose grenadier Vb, VI, VII + + + + + + + + +
Ireland Orange roughy VII + + + + + + + + +

79
Ireland Ling VI, VII, VIII, IX, X, XII, XIV + + + + + + + + +
Ireland Other < 100 t + + + + + + + + +
Netherlands Greater silver smelt V, VI, VII
Netherlands Other <100 t
Portugal Black scabbardfish IX, X + + + + + + + + +
Portugal Red seabream IX + + + + + + + + +
Portugal Red seabream X + + + + + + + + +
Portugal Other <100 t + + + + + + + + +
Spain Black scabbardfish V, VI, VII, XII + + + + + + + + +
Spain Blue ling VI, VII + + + + + + + + +
Spain Ling VI, VII, VIII, IX, X, XII, XIV + + + + + + + + +
Spain Red seabream VI, VII, VIII + + + + + + + + +
Spain Red seabream IX + + + + + + + + +
Spain Other <100 t + + + + + + + + +
Sweden Other <100 t
UK Black scabbardfish V, VI, VII, XII + + + + + + + + +
UK Greater silver smelt V, VI, VII + + + + + + + + +
UK Tusk IV + + + + + + + + +
UK Tusk V, VI, VII + + + + + + + + +
UK Roundnose grenadier Vb, VI, VII + + + + + + + + +
UK Blue ling VI, VII + + + + + + + + +
UK Ling IV + + + + + + + + +
UK Ling VI, VII, VIII, IX, X, XII, XIV + + + + + + + + +
UK Other <100 t + + + + + + + + +

80
9 AMENDMENTS TO COMMISSION REGULATION (EC) NO 1639/2001
9.1 BACKGROUND The Commission is currently in the process of amending Regulation (EC) No 1639/2001 of 25 July 2001 establishing the minimum and extended Community programs for the collection of data in the fisheries sector and laying down detailed rules for the application of Council Regulation (EC) No 1543/2000.
The subgroup on research need (STECF-SGRN meeting, 7-11 July) and the STECF opinion delivered by correspondence have not been able to completely deal with sampling intensity issues (SEC(2003)1415). Therefore STECF is requested to review the draft tables of Appendixes XII, XV and XVI and to amend as adequate the cells highlighted with a question mark.
9.2 ACTION STECF welcomes the report of the SGRN meeting annexed to the STECF report (SEC (2003)1415). STECF reviewed the draft report of the subgroup on research need (STECF-SGRN) and explicitly the draft tables of Appendixes XII, XV and XVI and amend the cells highlighted with a question mark.
The major points in the revised Appendixes are:
• The inclusion of European eel in the Council Regulation (EC) No 1543/2000
• The inclusion of several species not previously included in the Council Regulation (EC) No 1543/2000
• The inclusion of sampling period for discard in the MP
The revised Appendixes are presented in Annex II to this report and retained new sampling intensities are highlighted in bold fonts.
9.2.1 Appendix XII
Definition of the sampling intensity for catch and landings for species newly included in the Council Regulation (EC) No 1543/2000.
Re-definition of the sampling intensity for catch and landings for species already included in the Council Regulation (EC) No 1543/2000.
However, the STECF recognize that sampling intensity of European eel as defined in Appendix XII is too low given that European eel (Anguilla anguilla) stock is considered overexploited, fishing activity is often seasonal and it is an important species from the economical point of view. Therefore, STECF recommends to increase sampling effort to a quarterly base and by fishing technique at the ICES rectangle in the MP and to month base and by fishing technique in the EP for all areas. STECF also identify that sampling for European eel in ICES area III (excl. Skagerrak) including Baltic did not cover area IIIb-d. This should be corrected in the revised Appendix XII.
The STECF also stress that there is sampling need for European eel taken by inland fisheries and therefore it should be included into the Council Regulation (EC) No 1543/2000.

81
The STECF recognize that there is an inconsistency about the English name used in the regulation for Pandalus borealis in Appendix XII. The STECF recommends that Northern shrimp should be used for this species in the EC regulation. This is in accordance to the FAO and ICES nomenclature for this species.
The STECF recognise that in several areas of the Mediterranean both Scomber japonicus (not currently included) and Scomber scombrus occur. The STECF recommends that both Mackerel species should be included in the Mediterranean as for the NE Atlantic area.
STECF also recognize that the assessment working group for Pandalus borealis. In NAFO area 3M uses landings/catch data at month disaggregation level. Thus, STECF recommends that sampling level in Appendix XII should be set accordingly.
9.2.2 Appendix XV
Definition of the sampling intensity for length and age data for species newly included in the Council Regulation (EC) No 1543/2000
Re-definition of the sampling intensity for length and age data for species already included in the Council Regulation (EC) No 1543/2000
The STECF recognize that sampling intensity of European eel as defined in Appendix XII and XV is too low given that European eel stock is considered overexploited, fishing activity is often seasonal and it is an important species from the economical point of view. Regulation and management is variable across MS. Therefore, STECF recommends that for length and age data, sampling effort should be increased to 1 sample every 20 tonnes and to 100 individuals per sample.
In order to define sampling intensity for those species highlighted with a question mark and where sampling intensity for length was already specified, the same sampling intensity was applied for age sampling scheme.
STECF note that age sampling intensity for several highly migratory species and species in areas CECAF FAO 34, WECAF and FAO 58 is not defined.
9.2.3 Appendix XVI
Definition of the sampling intensity for other biological data for species newly included in the Council Regulation (EC) No 1543/2000
Re-definition of the sampling intensity for other biological data for species already included in the Council Regulation (EC) No 1543/2000
Specifically, period of sampling for other biological data has been defined for dolphin fish species, Centrophorus spp and Portuguese dogfish.
Moreover, STECF recommends that sharks species listed in the elasmobranches fisheries report (SEC(2003)1427) and evaluated in this STECF plenary session (see chapter 4) should be examined in detail by the forthcoming Working Group on data collection. The WG should assess which species should be included in the minimum program, in the extended program or in the discard program and the related sampling intensity.

82
10 OTHER MATTERS
10.1 ADDITIONAL REQUESTS TO STECF
10.1.1 Additional request on Anchovy in the Bay of Biscay
In response to a request from the Spanish Authorities for an evaluation of the stock projections for the stock of anchovy in the Bay of Biscay, the Commission asked STECF whether it was in a position to provide appropriate advice. STECF received the Commission’s request during its Final plenary session and unfortunately was unable to respond. The Committee considered whether it could provide an evaluation by correspondence during the week beginning 10 November, but the appropriate STECF Experts indicated that they were unable to do so because of previous commitments.
10.1.2 Additional request from the Commission on the quality of ICES advice
STECF was asked by the Commission to respond to to a number of questions on the quality of ICES advice. This request was received during the meeting at short notice and as a result, STECF was unable to provide a comprehensive response to any of the specific questions, but general comments on some of the questions raised are presented. The questions and the STECF responses are given below.
10.1.2.1 Catch forecasts
In order to improve the precision of catch forecasts, it may be appropriate to take account of recent changes in management measures such as reduced TACs, effort management and changes in technical measures when making in-year assumptions in ICES forecasts. STECF is requested to consider:
A. what additional up-to-date information from the commercial fisheries and national administrations could be used in order to improve forecasting to take account of the current effects of management measures;
STECF considers that the following information from the Commercial fisheries and National administrations could be used in order to improve forecasting to take account of the current effects of management measures.
For the most recent 3 years, the current and the next year, the following data are required, at a monthly or quarterly level:
1) A detailed description of the fleets operation in different management areas and their deployed effort, for example:
a) Fleets should be defined according to vessel size, gear deployed, mesh size etc.
b) For mobile gears, effort should be expressed as days fishing and as kW days.
c) For static gears effort should be expressed as days fishing and as days fishing times net length or number of hooks set, or number and type of pots or traps set.
2) A description of how national quota allocations are allocated to fleets

83
3) A description of how national effort allocations (if any) are allocated by fleet.
4) Up-to data and accurate estimates of catch, expressed as landings and discards by fleet and by age for each fishing area, preferably at the resolution of the statistical rectangle.
B. the extent to which the lack of such data has impaired the quality of the forecasts
in recent years
The extent to which the lack of such data has impaired the quality of the catch forecasts in recent years varies by stock. For some stocks the quality has been significantly affected, especially those stocks for which the recent catches are suspected to be underestimates.
STECF is unable to comment on this point on a stock by stock basis. However, in general, the quality of forecasts is primarily dependent on the accuracy and precision of estimates of starting stock numbers and fishing mortality at age. In addition, forcasts for the forthcoming year that are to be used as a basis for setting TACs also rely on accurate estimates of the level of deplolyed fishing effort for the current year, relative to the deployed effort over the most recent three years.
It should be remembered that, in general, the assessment methodology is designed to provide the best estimates of the state of the stock in a steady state situation. Changes in management measures that cause short-term changes in the fishery will, inevitably, cause these assessment methods to give more uncertain results.
In the absence of reliable discard estimates, forecasts will tend to underestimate future catches and the precision of estimated landings deteriorates.
10.1.2.2 Framework for advice
In the single stock advice for 2004 ICES has applied the following approach:
a. For stocks outside safe biological limits ICES has provided advice to increase the spawning stock biomass above Bpa. If this is not possible within one year ICES recommends a recovery plan be established. For stocks where it is not possible to achieve Blim within one year ICES recommends no fishing until the stock has increased to above Blim.
b. For stocks harvested outside safe biological limits ICES recommends reduction in F to below Fpa;
c. For stocks within safe biological limits ICES advises that the fishing mortality should be kept below Fpa.
STECF is requested to comment on the ICES approach to formulating advice and especially on the:
A. conformity of the approach with international agreements concerning precautionary fish stock management;
For stocks outside safe biological limits ICES has provided advice to increase the spawning stock biomass above Bpa. If this is not possible within one year ICES recommends a recovery plan be established. STECF considers that such advice is appropriate and is consistent with the precautionary approach, provided that Bpa is a robust reference point. However, STECF notes that for some stocks, Bpa is not or poorly estimated and there is a danger that in such cases, appropriate advice consistent with the precautionary approach, may not be given.

84
For stocks where it is not possible to achieve Blim within one year ICES recommends no fishing until the stock has increased to above Blim. STECF considers that in the absence of clear fishery management objectives, ICES has given advice that will recover the stock to Blim in the shortest time possible.
For stocks harvested outside safe biological limits ICES recommends reduction in F to below Fpa. STECF considers that such advice is appropriate and is consistent with the precautionary approach, provided that Fpa is a robust reference point. However, STECF notes that for some stocks, Fpa is not or poorly estimated and there is a danger that in such cases, appropriate advice consistent with the precautionary approach, may not be given.
For stocks within safe biological limits ICES advises that the fishing mortality should be kept below Fpa. STECF considers that while such advice is consistent with the precautionary approach (provided that Fpa is a robust reference point). STECF notes that PA reference points should not be considered appropriate targets. STECF considers that stocks with safe biological limits should be managed following agreed management plans, with clearly defined objectives and appropriate harvest control rules.
B. social and economic implications of applying such an advisory rule in practice;
While STECF is unable to give a comprehensive response to this specific point in this report it does note that the potential social and economic implications of applying such an advisory rule are complex and depend on how managers act upon such advice, and the response of the fishery. In the event that the social and economic consequences are in conflict with the biological implications it is the role of managers to determine the relative importance of these conflicting requirements.
Generally, in the long run, the conflicts between the socio-economic and biological objectives are smaller than in the short term.
C. proportionality of severity of advised conservation measures to perceived biological risk;
STECF notes that the proportionality of the severity of advised conservation measures to perceived biological risk is a difficult issue. It is clear, that if only a biological criterion is applied, the fastest way to remove the biological risk is to act as strongly as possible. The multi-objective weighting of other political objectives does not usually belong to the criteria given to ICES, and ICES currently focuses solely on biological objectives. Through recovery plans managers are able to introduce specific weighting of several objectives over time. The evaluation of biological functioning of these is still a task which can be carried out by ICES.
D. use of yield-based criteria in formulating advice;
STECF was unable to address this question during its 17th session. STECF recognised that the question requires a more considered response than could be provided in the time available.

85
E. incorporation of stability criteria when providing advice;
STECF was unable to address this question during its 17th session. STECF recognised that the question requires a more considered response than could be provided in the time available.
F. sensitivity to revised estimates of historical stock size and fishing mortality.
STECF was unable to address thoroughly this question during its 17th session. STECF recognised that the question requires a more considered response than could be provided in the time available.
However STECF believes it is useful to note the following:
Large changes from one year to another in estimated stock size due to new data may change the magnitude of a stock and thus our perception of stock size and maybe status. In cases where such downwards changes (revisions) of stock size take place, the stock status in relation to safe biological limits may also result in drastic changes in management advice. In recent years ICES has for two major fish stocks, e.g. Eastern Baltic cod in 2001 and North Sea Plaice in 2003, presented drastic downward revisions of stock size.
STECF has noted that such sudden changes in SSB may create credibility problems to the industry, especially if management (recovery) plans already exist. In any such cases ICES should explain more carefully why/if the limit reference points (based SSB-Recruitment relationship) are not revised together with the SSB revisions.
10.1.3 STECF comment on short notice additional requests
STECF notes that during its Plenary Sessions, and especially during its November Sessions, following the advice from ICES and ahead of the Commissions proposals for management of EU Fisheries for the subsequent year, the Committee is often presented with additional requests to undertake evaluations on specific ICES stocks. Such requests invariably appear during the meeting at short notice, and after the Terms of Reference and Agenda have been agreed and set.
The Committee always strives to respond positively to such requests and aims to provide the best possible scientific advice to the Commission under all circumstances. However, the advice contained in its responses to requests at short notice may be compromised because of an inability to fully address the issue.
Recognising that the Commission requires the best possible scientific advice in order to make appropriate management proposals, and in order that the scientific integrity of the Committee is not compromised, STECF urges Member States and the Commission to ensure that any late requests for advice are presented to the Committee before the meeting agenda is agreed. In practice this means requests should be lodged with the STECF Secretariat before the opening of the meeting.
10.2 SUBGROUPS COORDINATORS. STECF briefly reviewed the role of the Co-ordinators of the STECF permanent subgroups. Their important role in cooperating with the Commission both to facilitate the participation of the right experts and to identify the most suitable chairperson to the STECF meetings was recognised. The role of coordinators is very important also to help and stimulate the work of the chairperson of a working group. STECF has appointed 5 new coordinators out of 7 subgroups. The still missing coordinators will be appointed shortly by the STECF Bureau.

86
The final composition of co-ordinators is given below:
• Subgroup on balance between resources and exploitation (SGBRE): to be named
• Subgroup on economic assessment (SGECA): Jörgen Lokkegaard
• Subgroup on mangament objectives and strategies (SGMOS): Michael Keatinge
• Subgroup on Mediterranean (SGMED): Ramon Franquesa
• Subgroup on research needs and data collection (SGRN): to be named
• Subgroup on resources status (SGRST): Hans-Joachim Raetz
• Sungroup on fisheries and environment (SGFEN): Sten Munch-Petersen
10.3 ECONOMIC ISSUES FOR CONSIDERATIONS - FUTURE ORGANIZATIONS OF DATA COLLECTION/DATA HANDLING ON ECONOMIC ISSUES
In the 16th Report of the STECF from the meeting March 31-04 April 2003 (SEC(2003) 843), the STECF stressed important aspects of the future work, especially the organisation of the economic work. In order to forward this issue preparations should be made in advance of the next meeting of STECF in April 2004 and a suitable date could be from 16 to 20 February.
The preparation should at least include a working group meeting of SGECA with participation of representatives from institutions responsible for collecting economic data and the Concerted Action of Economic Assessment of European Fisheries (Q5CA-2001-01502). The terms of reference of the meeting should include data collection issues and issues related to analysis of economic performance.
10.4 PARTICIPATION OF THE STECF’S MEMBERS AT THE MEETING OF THE ACFA Every year the ACFA organises 12 meetings, respectively by 4 fields: fisheries resources, aquaculture, markets, general questions. Since 2001 STECF members (biologist and/or economist) have participated at these meetings. For 2003, the STECF’s members have participated regularly at 11 meetings, during these they have contributed to answer or to shed a good light on the discussions of the members of the ACFA.
Even though the minutes of the ACFA meetings are regularly distributed to STECF members, however their content should be considered confidential and not circulated outside STECF circuit.
STECF has maintained Yves Perraudeau as the coordinator for the actions of the Scientific Comittee within the ACFA. In order to maximize its input, it is necessary for a biologist to accompany the coordinator at the fisheries resources and aquaculture working groups.
Michael Keatinge volunteered to attend ACFA meetings covering the biological matters.
Upon receipt of ACFA agendas, the coordinator informs all STECF members in order to receive their opinions on the different agenda items and, if the case, to prepare an agreed position to be delivered on behalf of the STECF.
10.5 STECF ACTIVITIES IN 2003AND PLANNING OF MEETINGS FOR 2004 STECF notes that the agendas of its meeting have been becoming more and more overloaded with several items often added at very short notice. STECF asks that the Commission re-evaluates its strategy with regard to drawing up terms of reference. However, STECF is also aware that the number of inter-session subgroup and ad hoc meetings has gradually increased from 1-2 to more than 10-15 per year. This fact inevitably

87
raises the number of subgroups reports that need to be evaluated and endorsed by the STECF.
STECF recognises that most of the preparatory work before plenary sessions cannot be duly undertaken by STECF members due to their routinely and institutional engagements within their Institutes. STECF underlines that more formal solutions, including economic rewarding of both research Institutes and experts, as envisaged in the draft communication on scientific advice, could help in finding a more adequate structure to cope with the increasing workload. Perhaps, also a higher number of STECF plenary sessions (more than 2 per year) might be considered.
STECF notes that the participation of its members to subgroup meetings is sometimes quite limited with a predominance of invited experts. STECF invites its members to attend more regularly subgroups meetings, such a strategy should also speed up the work during the plenary sessions.
In closure of the meeting it was recalled that the next plenary session will take place in Brussels from 29 March – 2 April 2004.
The first following text table shows the activities carried out, since the STECF plenary meeting of April 2003, either within the STECF framework or as ad hoc working groups for which STECF has subeseqently delivered its opinion.
The reports of both the ad hoc working group “In season assessment of anchovy in the Bay of Biscay” (SEC(2004)180) and of the STECF-SGMOS “Recovery plans of Southern hake and Iberian Norway lobster stocks” (SEC(2004)178) were adopted by the STECF through a fast track procedure by correspondence in October and July respectively. STECF opinion on the SGMOS report is included in the Annex III to this report.
The subsequent text table shows provisional activities of STECF and its sub-groups scheduled for 2004. The Commission informed that the provisional planning for 2004 could be changed depending on the outcomes of the December Council. Besides, STECF budget constraints might determine rearrangement of the provisional planning.

88
MEETING ITEM DATE April –December 2003
ad hoc working group
In season assessment of anchovy in the Bay of Biscay” Chairman: Uriarte Andres
AZTI Instituto Tecnológico Pesquero y Alimentario Pasaia, Gipuzkoa (Spain) 7- 11 July
- Management Objectives and Strategies (MOS): Co-ordinator: Michael Keatinge
Recovery plans of Southern hake and Iberian Norway lobster stocks. Chairman: Stuart Reeves
IPIMAR, Lisbon (Portugal) 9 – 13 June
ad hoc working group
Elasmobranchs Fisheries Chairman: Henk Heessen
22-25 July
- Research Needs and Data Collection ( RNDC )- Co-ordinator: Philippe Moguedet
Mid-Term Review of Data Collection Programme Chairman: Frank Redant
07 – 11 July
- Review of scientific advice on STocks of relevance to the CFP (RST) . Co-ordinator John Casey
- Mixed fisheries Chairman: Stuart Reeves
22-26 October
Subgroup on Economic Assessmment (ECA) Co-ordinator: Jos Smit
The Potential Economic Impact on Selected Fishing Fleet Segments of TACs Proposed by ACFM for 2004 (EIAA-model calculations) Chairman: Hans Frost
29-31 October
- Review of scientific advice on STocks of relevance to the CFP (RST) . Co-ordinator John Casey
- Stock status review Chairman: John Casey
27 – 31 October
Scientific, technical and economic committee for fisheries (STECF) Chairman: John Casey
Plenary session 03- 07 November
- Research Needs and Data Collection ( RNDC )- Co-ordinator: Jørgen Løkkegaard
- Evaluation of derogations in national programmes for 2004 - Evaluation of economic issues in national programmes for 2004 Chairman: Frank Redant
1-5 December
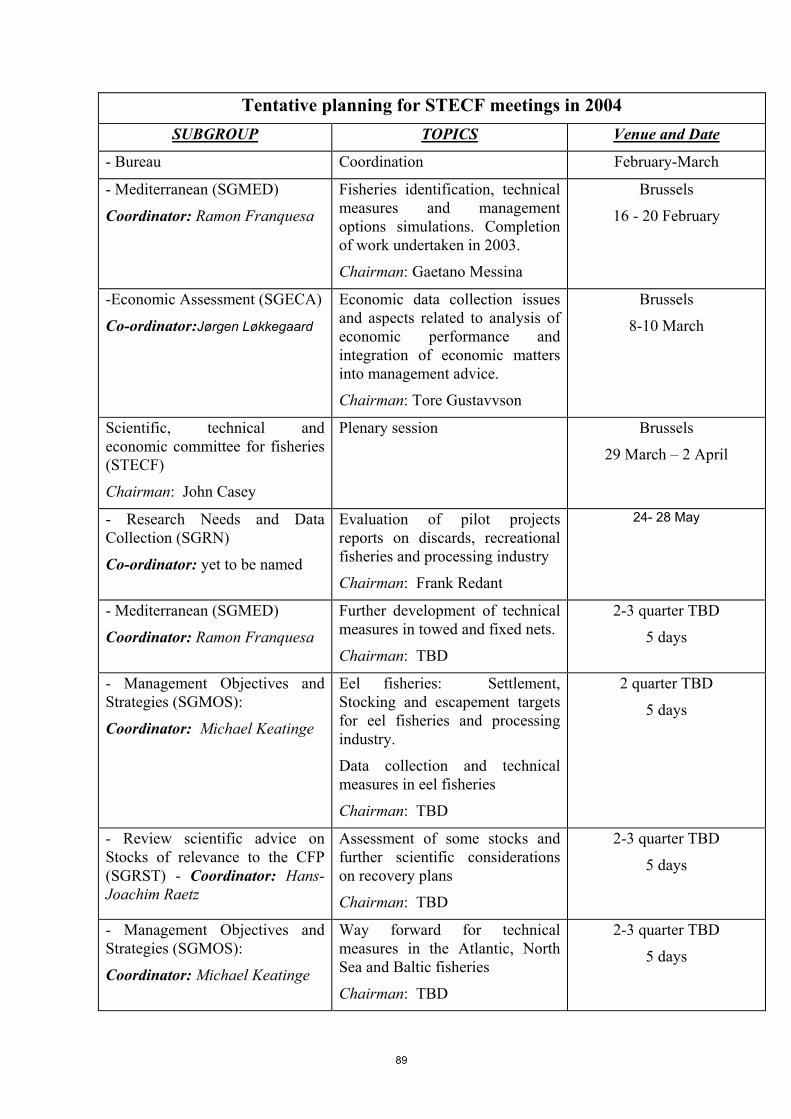
89
Tentative planning for STECF meetings in 2004 SUBGROUP TOPICS Venue and Date
- Bureau Coordination February-March
- Mediterranean (SGMED)
Coordinator: Ramon Franquesa
Fisheries identification, technical measures and management options simulations. Completion of work undertaken in 2003.
Chairman: Gaetano Messina
Brussels
16 - 20 February
-Economic Assessment (SGECA)
Co-ordinator:Jørgen Løkkegaard
Economic data collection issues and aspects related to analysis of economic performance and integration of economic matters into management advice.
Chairman: Tore Gustavvson
Brussels
8-10 March
Scientific, technical and economic committee for fisheries (STECF)
Chairman: John Casey
Plenary session Brussels
29 March – 2 April
- Research Needs and Data Collection (SGRN)
Co-ordinator: yet to be named
Evaluation of pilot projects reports on discards, recreational fisheries and processing industry
Chairman: Frank Redant
24- 28 May
- Mediterranean (SGMED)
Coordinator: Ramon Franquesa
Further development of technical measures in towed and fixed nets.
Chairman: TBD
2-3 quarter TBD
5 days
- Management Objectives and Strategies (SGMOS):
Coordinator: Michael Keatinge
Eel fisheries: Settlement, Stocking and escapement targets for eel fisheries and processing industry.
Data collection and technical measures in eel fisheries
Chairman: TBD
2 quarter TBD
5 days
- Review scientific advice on Stocks of relevance to the CFP (SGRST) - Coordinator: Hans-Joachim Raetz
Assessment of some stocks and further scientific considerations on recovery plans
Chairman: TBD
2-3 quarter TBD
5 days
- Management Objectives and Strategies (SGMOS):
Coordinator: Michael Keatinge
Way forward for technical measures in the Atlantic, North Sea and Baltic fisheries
Chairman: TBD
2-3 quarter TBD
5 days

90
- Management Objectives and Strategies (SGMOS):
Coordinator: Michael Keatinge
Harvesting rules in single species fisheries and further considerations on mixed fisheries aspects
Chairman: TBD
2-3 quarter TBD
5 days
- Review scientific advice on Stocks of relevance to the CFP (SGRST)–Economic Assessments (SGECA)
Joint meeting
Coordinators: Hans-Joachim Raetz, Jørgen Løkkegaard
Further improvement of EIAA model including long-term perspective and effects of recovery plans
Chairman: Hans Frost
2 quarter TBD
5 days
- Fisheries and Environment (SGFEN) –
Coordinator: Sten Munch-Petersen
-Sensitive fish habitats and habitats of paramount importance for biodiversity conservation and stocks production in the Mediterranean.
Chairman: TBD
2-3 quarter TBD
5 days
- Mediterranean (SGMED) –
Coordinator: Ramon Franquesa
Economic aspects of Mediterranean fisheries
Chairman: Ramon Franquesa
28 June – 2 July
- Research Needs and Data Collection (SGRN)
Co-ordinator: yet to be named
Evaluation of achievements of 2003 data collection national programmes
Chairman: Frank Redant
June-July 5 days TBD
- Management Objectives and Strategies (SGMOS):
Coordinator: Michael Keatinge
Way forward for technical measures in the Atlantic, North Sea and Baltic fisheries
Chairman: TBD
3 quarter TBD
5 days
- Management Objectives and Strategies (SGMOS):
Coordinator: Michael Keatinge
Plan of action for elasmobranch fisheries
Chairman: Henk Heessen
2-3 quarter TBD
- Review scientific advice on Stocks of relevance to the CFP (SGRST)
Coordinator: Hans-Joachim Raetz
Mixed fisheries forecasts
Chairman: Hans-Joachim Rätz
18-22 October
SGRST – SGECA joint group
Coordinator: Hans-Joachim Raetz
- Stock status review
- Fleet status report
- EIAA model
Chairman: John Casey
25 - 29 October

91
Scientific, technical and economic committee for fisheries (STECF)
Chairman: John Casey
Plenary session 1-5 November
- Research Needs and Data Collection (SGRN)
Co-ordinator: yet to be named
Evaluation of derogations in national programmes
Chairman: Frank Redant
29 November–3 December

92
11 ANNEX I LIST OF PARTICIPANTS Ardizzone Giandomenico Dip. Biologia Animale e dell'Uomo Università di Roma "La sapienza" Viale dell 'Università 32 I-00185 Roma Italy Tel: +39-06-49914773 Fax: +39-06-49914773 E-mail: [email protected] Arneri Enrico Consiglio Nazionale Ricerche Largo fiera della Pesca I-60129 Ancona Italy Tel: +39-071-20-78-849 Fax: +39-071-55-313 E-mail: [email protected] Bertignac Michel IFREMER Station de Lorient 8, rue François Toullec 56100 Lorient France Tel: +33-2-97-87-38-00 Fax: +33-2-97-87-38-01 E-mail: [email protected] Camiñas Juan Antonio Centro Oceanográfíco de Málaga Puerto Pesquero s/n. Ap. 285 E-29640 Fuengirola (Málaga) Spain Tel: +34-952-478148 Fax: +34-952-463808 E-mail: [email protected] Cardinale Massimiliano Havsfiskelaboratoriet Box 4 DK-453 21 Lysekil Denmark Tel: +46 523 187 00 Fax: +46 523 139 77 E-mail: [email protected]
Casey John CEFAS Fisheries Laboratory Pakefield Road UK-Lowestoft NR33 OHT United Kingdom Tel: 44-1502524251 Fax: 44-15025242511 E-mail: [email protected] Celso farina Perez Antonio Calle San Pablo N° 5 2 DCHA ES – 15001 A Coruña Tel : + 34 981 20 53 62 Fax : + 34 981 22 90 77 e-mail : [email protected] Clarke Maurice Marine Institute Marine Fisheries Services Abbotstown Dublin 15 Ireland Tel: +353-91-43-04-00 E-mail: [email protected] Delaney Alyne Institute for Fisheries Management and Coastal Community Development PO Box 104 North Sea Center 9850 Hirtshals Denmark Tel: +45 98 94 28 55 Fax: +45 98 94 42 68 E-mail: [email protected] Di Natale Antonio Aquastudio Via Trapani 6 I-98121 Messina Italy Tel: +39 090 34 64 08 Fax: +39 090 36 45 60 E-mail: [email protected] [email protected] Dickey-Collas Mark RIVO-DLO

93
Rijksinstituut voor Visserijonderzoek Haringkade 1 P.O.Box 68 NL-1970 AB Ijmuiden The Netherlands Tel: +31-255-564-685 Fax: +31-255-564-644 E-mail: [email protected] Ernst Peter Bundesforschungsantalt für Fischerei An der Jägerbäk, 2 D-18069 Rostock Tel: +49-381-810-352 Fax: +49-381-810-445 E-mail: [email protected] Fernandes Paul The Marine Laboratory 375 Victoria Road Torry UK Aberdeen AB119 DB Tel: +44-1224-29-56-96 Fax: +44-1224-29-5515 E-mail: [email protected] Franquesa Ramon GEM-Universidad de Barcelona Av. Diagonal, 690 E-08034 Barcelona Spain Tel: +34-932178734 Fax: +34-932178734 E-mail: [email protected] Garcia-Rodriguez Mariano Instituto español de oceanografia Avenida de Brasil, 31 ES-28020 Madrid Tel: +34-91-59-74-443 Fax: +34-91-59-73-770 Gustavsson Tore Fiskeriverket, National Board of Fisheries Box 423 S-401 26 Göteborg Sweden Tel: +46-31-7430300 Fax: +46-31-7430444 E-mail: [email protected] Keatinge Michael Bord Iascaigh Mhara Dun Laoghaire
Dublin Ireland Tel: +353 1 2144 230 Fax: +353 1 2300 564 E-mail: [email protected] Kees Taal LEI-DLO, Landbouw Economisch Instituut Afdeling Visserij P.O.Box 29703 NL-2502 LS Den Haag The Netherlands Tel: +31-70- 335 83 170 Fax: +31-70-361 56 24 E-mail: mailto:[email protected] Kuikka Sakari Finnish Game and Fisheries Research Institute (FGFRI) Pukinmäenaukio 4 P.O.Box 6 F-00721 Helsinki Finland Tel: +358-205-75-11 Fax: +358-205-75-12-01 Email: Lokkegaard Jorgen FOI Danish Institute of Food Economics Rolighedsvej 25 – 1958 Frederiksberg C Denmark Tel: +45-35 286890 Fax: +45-35 286801 E-mail: [email protected] Martinez Portela Júlio Avda Ricardo Mella 610 ES-36392 Vigo Spain Tel: +34-986-46-29-40 Fax: +34-986-49-23-51 E-mail: [email protected] Messina Gaetano Consiglio Nazionale delle Ricerche Istituto di Ricerche sulla Pesca Marittima Largo Fiera della Pesca I-60125 Ancona Italy Tel: +39-071-2078831 Fax: + 39-071-55313 E-mail: [email protected] Munch-Petersen Sten DIFRES -Danish Institute for Fisheries Research Charlottenlund Castle

94
DK-2920 Charlottenlund Denmark Tel: +45-33 96 33 90 Fax: +45-33 96 33 33 E-mail: [email protected] Murta Alberto IPIMAR Av. Brasília 1449-006 Lisboa – Portugal Tel: +351 21 302 7062 Fax: +351 21 301 5948 E-mail: [email protected] Neves dos Santos Av. Dr Júlio Almeida Carrapato 95-1°E PT-8000 FARO Tel: +351-91-93-93-935 Fax: +351-70-05-35 E-mail: [email protected] Officer Rick Marine Institute Abbdtstown lab complex snugbord Abbotstown Dublin 15 Ireland Tel: +35 31 822 82 00 Fax: +35 31 820 50 78 E-mail: [email protected] Perraudeau Yves Faculté des Sciences Economiques de Nantes Bld Michelet, 110 LEN-CORRAIL F-44071 Nantes Cedex 03 France Tel : 33-680482956 GSM : 0680482956 Fax : 33-2-40141740 E-mail : [email protected] nantes.fr Pestana Graca IPIMAR Av. Brasília P-1499-006 Lisboa Portugal Tel : 351-21-3027109 Fax : 351-21-3015948 E-mail : [email protected] Petrakis George Institute of Marine Biological Resources Aghios Kosmas, 166 04 hellenikon Athens
Greece Tel: +30 1 982 13 54 Fax: +30 1 9811 713 E-mail: [email protected] Poviliuna Justas State Pisciculture Research Centre of Lithuania Konstitucijos 23A Vilnius Lithuania Tel: +37 06 82 11 284 Fax: +37 05 27 22 146 E-mail: [email protected] Prellezo Raúl Fundación AZTI Txatxarramendi irla, s-n ES 48395 Sukarrieta Tel: +94-60-29-400 Fax: +94-68-70-006 E-mail: [email protected] Rätz Hans Joachim Federal Research Centre for Fisheries Institue for Sea Fisheries Palmaille, 9 22767 Hamburg Germany Tel: +49 40 38 905 169 Fax: +49 40 38 905 263 E-mail: [email protected] Saat Toomas Estonian Marine Institute Tartu University Tel: +372-62-67-410 Fax: +372-62-67-417 E-mail: [email protected] Simmonds John MARINE LABORATORY ABERDEEN The Marine Laboratory P.O. BOX 101 Victoria Road Aberdeen AB11 9DB United Kingdom Tel: 44-0-1224 876544 Fax: 44-0-1224 295511 E-mail: [email protected] Somarakis Stylianos University of Patras Department of Biology 26500 Patra Greece Tel:+30 26 16 99 75 21 61 00

95
Fax: +30 26 10 99 61 00 E-mail: [email protected] Vanhee Willy CLO – Sea Fisheries Department Ministerie van Landbouw, Departement Zeevisserij Ankerstraat 1 B-8400 Oostende Belgium Tel: +32-59-34 22 55 Fax: +32-59-330629 E-mail: [email protected] Varadi Laszlo Ministry of Agriculture and Rural Dev. Kossuth Lajos Ter 11 1055 Budapest Hungary Verver Sieto Netherlands Institute for Fisheries Research Animal Science Group Wageningen UR PO Box 68 NL-1970 AB Ijmuiden The Netherlands Tel: +31-255-564-700 Fax: +31-255-56-46-44 E-mail: [email protected] Virtanen Jarno FGRI P.o Box 6 FIN-00721 Helsinki Finland Tel: +358 205 751 302 Fax: +358 205 751 202 E-mail: [email protected] Vitinis Maris Latvian Fisheries Research Institute Daugaverinas str, 8 1048-Riga Latvia Tel: +37 17 61 24 09 Fax: +37 17 61 69 46 E-mail: [email protected] Zbigniew Karnicki Sea Fisheries Institute Kottataja, 1 81-332 Gdynia Poland Tel : +48 58 621 68 30 Fax : +48 58 621 28 31
E-mail : [email protected]
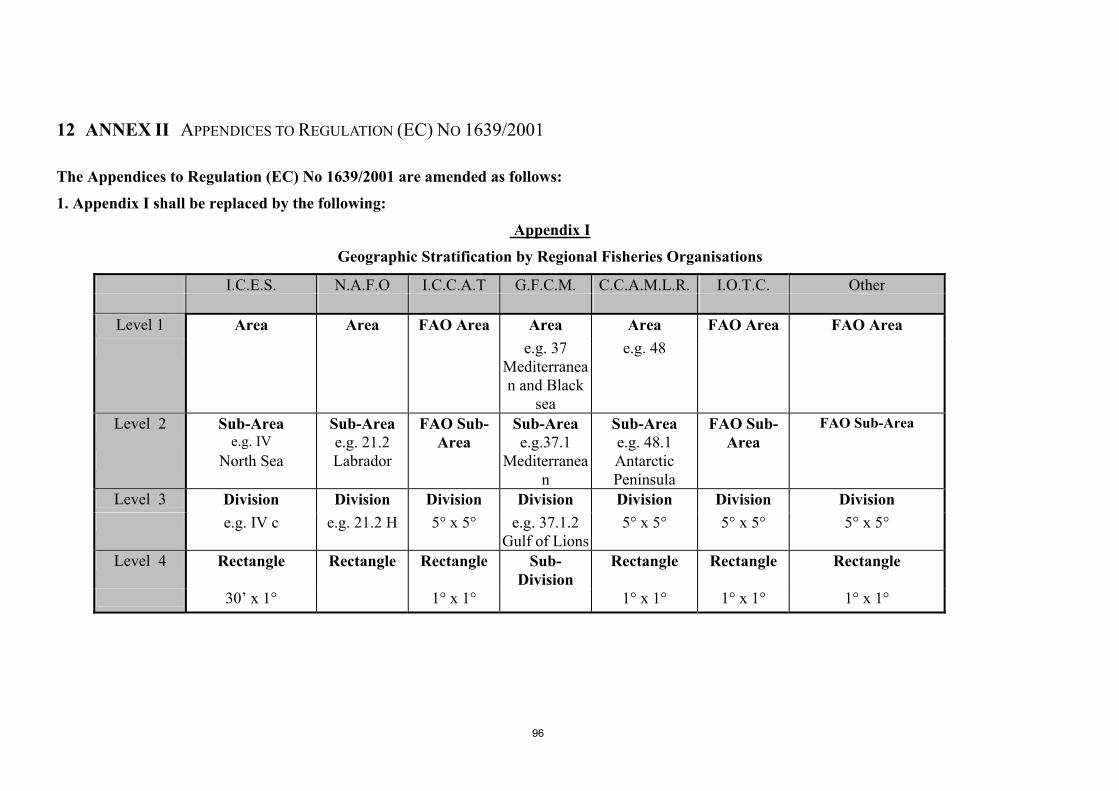
96
12 ANNEX II APPENDICES TO REGULATION (EC) NO 1639/2001 The Appendices to Regulation (EC) No 1639/2001 are amended as follows:
1. Appendix I shall be replaced by the following:
Appendix I
Geographic Stratification by Regional Fisheries Organisations
I.C.E.S. N.A.F.O I.C.C.A.T G.F.C.M. C.C.A.M.L.R. I.O.T.C. Other
Level 1 Area Area FAO Area Area Area FAO Area FAO Area e.g. 37
Mediterranean and Black
sea
e.g. 48
Level 2 Sub-Area e.g. IV
Sub-Area e.g. 21.2
FAO Sub-Area
Sub-Area e.g.37.1
Sub-Area e.g. 48.1
FAO Sub-Area
FAO Sub-Area
North Sea Labrador Mediterranean
Antarctic Peninsula
Level 3 Division Division Division Division Division Division Division e.g. IV c e.g. 21.2 H 5° x 5° e.g. 37.1.2
Gulf of Lions5° x 5° 5° x 5° 5° x 5°
Level 4 Rectangle Rectangle Rectangle Sub-Division
Rectangle Rectangle Rectangle
30’ x 1° 1° x 1° 1° x 1° 1° x 1° 1° x 1°

97
2. Appendix II shall be replaced by the following:
Appendix II
Functional Units (FU) and Statistical rectangles for Nephrop norvegicus
FU no. Name ICES area
Statistical rectangles
3 Skagerrak IIIa 47G0-G1; 46F9-G1; 45F8-G1;
44F7 G0 43F8 F94 Kattegat IIIa 44G1-G2; 42-43G0-G2; 41G1 G25 Botney Gut - Silver Pit IVb,c 36-37 F1-F4; 35F2-F3
6 Farn Deeps IVb 38-40 E8-E9; 37E9 7 Fladen Ground IVa 44-49 E9-F1; 45-46E8 8 Firth of Forth IVb 40-41E7; 41E6 9 Moray Firth IVa 44-45 E6-E7; 44E8 10 Noup IVa 47E6 11 North Minch VIa 44-46 E3-E4 12 South Minch VIa 41-43 E2-E4 13 Clyde VIa 39-40 E4-E5 14 Irish Sea East VIIa 35-38E6; 38E5 15 Irish Sea West VIIa 36E3; 35-37 E4-E5; 38E4 16 Porcupine Bank VIIc,k 31-36 D5-D6; 32-35 D7-D8 17 Aran Grounds VIIb 34-35 D9-E0 18 Ireland NW coast VIIb 37D9-E1; 36D9 19 Ireland SW and SE coast VIIg,j 31-33 D9-E0; 31E1; 32E1-E2;
33E2 E320 NW Labadie, Baltimore and G ll
VIIg,j 21 Jones and Cockburn VIIg,h,j 28-30 E1; 28-31 E2; 30-32 E3; 31
E422 Smalls VIIg 23 Bay of Biscay North VIIIa 22-24 E6-E7; 23-24E5 24 Bay of Biscay South VIIIb 20-21 E7-E8; 19E8 25 North Galicia VIIIc 15E0-E1; 16E1 26 West Galicia IXa 13-14 E0-E1 27 North Portugal (N of Cape
E i h l)IXa 6-12E0; 9-12E1
28 South-West Portugal (Alentejo) IXa 3-5 E0-E1 29 South Portugal (Algarve) IXa 2E0-E2 30 Gulf of Cadiz IXa 2-3 E2-E3 31 Cantabrian Sea VIIIc 16E4-E7 32 Norwegian Deep lVa 44-52 F2-F6; 43F5-F7 33 Off Horn Reef lVb 39-41E4; 39-41E5

98
3. Appendix III shall be replaced by the following:
Appendix III (Section C)
Basic segmentation of vessels for Capacities (MP)
Vessel length < 12 m 12 - < 24 m 24 - < 40 m >= 40 m
Type of Fishing Technique
Mobile Gears Beam trawl Demersal trawl & Demersal seiner
Pelagic trawl & seiners
Dredges
Polyvalent
Others
Passive Gears Gears using hooks
Drift & Fixed nets (1)
Pots & traps
Polyvalent
Polyvalent Gears Combining mobile & passive gears
(1) This segment is aggregated for all passive gears
Note 1: If a gear category contains less than 10 vessels, then the cell can be merged with a neighbouring length category to be specified in the National Programme
Note 2: If a vessel spends more than 50% of its time using a specific type of fishing technique, it should be included in the corresponding segment
Note 3: Length is defined as Length Over All (LOA)

99
4. Appendix IV shall be replaced by the following:
Appendix IV (Section C)
Detailed disaggregation of vessels for Capacities (EP)
Vessel length < 10 m 10 - < 12 m 12 - < 18 m 18 - <24 m 24 - <40 >= 40 m Type of Fishing Technique
Mobile gears Beam trawl North Sea < 221 North Sea >= 221
kW
Outside North Sea Demersal trawl & Demersal
iBottom trawl
Danish and Scottish i
Polyvalent Pelagic trawl and seiners Pelagic trawl Pelagic seiner and purse
seiner
Polyvalent Dredges Polyvalent mobile gears Others
Passive gears Gears Long-lines using hooks Other gears using hooks Drift nets & Fixed Nets Pots and traps Polyvalent passive gears
Polyvalent gears

100
5. Appendix V shall be replaced by the following:
Appendix V (Section D)
Fishing Power units by type of Fishing Technique
Fishing Technique Fishing Power units
Mobile gears kW and GT
Fixed gears kW and GT
Polyvalent kW and GT

101
6. Appendix VI shall be replaced by the following:
Appendix VI (Section D)
Stocks related to specific effort
Species and area Threshold 1a Threshold 2b Salmon (Baltic Sea) 30% 5%
Cod (all areas, exc. M dit )
30% 5%
Haddock (all areas, exc. Med.) 30% 5%
Saithe (all areas, exc. Med.) 30% 5%
Whiting (all areas, exc. Med.) 30% 5%
Plaice (all areas, exc. Med.) 30% 5%
Sole (all areas, exc. Med.) 10% 5%
Sole (Mediterranean) 30% 5%
Nephrops (all areas) 30% 5%
Hake (all areas) 30% 5%
Anchovy (all areas) 30% 5%
Sardine (all areas) 50% 5%
Mackerel (all areas, exc. Med.) 50% 10%
Horse mackerel (all areas, exc. Med )
50% 10%
Swordfish (all areas) 30% 5%
Blue-fin tuna (all areas) 30% 5%
Big-eye tuna (all areas) 30% 5%
Albacore (all areas) 30% 5%
Yellow-fin tuna (all areas) 30% 5%
Herring (all areas, exc. Med.) 50% 10%
Sprat (all areas, exc. Med.) 50% 10%
Sand eel (all areas, exc. Med.) 70%
Norway pout (all areas, exc. Med )
70%
European eel (all areas) 30%
a A fishing day is to be considered as targeting one specific species, if the percentage of this species
in total daily catch is higher than threshold 1.
b A fishing day is to be considered as affecting significantly a species, if the percentage of the
particular species is higher than threshold 2.

102
7. Appendix XI shall be replaced by the following:
Appendix XI (Section E)
List of recreational fisheries stocks (MP)
1. Salmon (marine waters in the Baltic Sea and North Sea): Catch figures collected in weight and number by:
– Geographical area as defined Appendix 1, level 2. 2. Blue-fin tuna (all areas): Catch figures collected in weight and number by:
– Annual basis – Geographical area as defined Appendix 1, level 2. – Distinguishing catch of fish below and above 10 kg.
3. Cod in areas III, IV, V, VI and VII:
Catch figures collected in weight and number by:
– Geographical area as defined Appendix 1, level 2.

103
8. Appendix XII shall be replaced by the following:
12.1 APPENDIX XII (SECTION E) List of stocks for Landings and Discards monitoring (MP)
Legend:
Catch and Landings Monitoring Within the market or sea sampling programme the stratification of sampling is prioritized at the total or fleet level, with monthly quarterly or annual sampling schemes, with data reported by rectangle, division or area.
Fishing technique stratification:
M Monthly by type of fishing technique (Appendix III)
N Monthly total
Q Quarterly by type of fishing technique (Appendix III)
R Quarterly total
Y Yearly by type of fishing technique (Appendix III)
Z Yearly total
T Triannual (one yearly over a period of three years) by type of technique (Appendix III)
Geographical stratification:
0 Functional unit
1 ICES Stat. Rectangle
2 ICES /NAFO divisions
3 ICES /NAFO sub areas
4 ICCAT 1o Rectangle
5 ICCAT 5o Rectangle
6 FAO Division
7 FAO Sub Area
8 FAO Area
Important remarks:
(1) Stock definitions should follow the ones defined by regional fisheries organisation, and the sampling strategies should include at least the respective strata.
(2) Data concerning areas separated by commas may be aggregated, while data concerning areas separated by slashes must not be aggregated.

104
Sampling DiscardsStrata
Species Area / Stock
MP EP MP
ICES AREA I, II
Glass eel Anguilla anguilla I, II Q2 M1
Yellow eel Anguilla anguilla I, II Q2 M1
Silver eel Anguilla anguilla I, II Q2 M1
Atlanto-Scandian Herring
Clupea harengus IIa, V Q2 M2 Y
Cod Gadus morhua I,II Q2 M2 Y
Haddock Melanogrammus aeglefinus
I,II Q2 M2 Y
Blue Whiting Micromesistius poutassou
I-IX, XII, XIV Q2 M1 T
Northern shrimp Pandalus borealis I,II Y2 Q2 T
Saithe Pollachius virens I,II Q2 M2 Y
Redfish spp. Sebastes spp. I,II Y3 Q2 T
Horse mackerel Trachurus trachurus IIa, IVa, Vb, VIa, VIIa-c,e-k, VIIIabde
Q2 M1 T
North Sea (Skagerrak) ICES AREA IIIa(north)
Sandeel Ammodytidae IIIa N Q2 M1 T
Glass eel Anguilla anguilla IIIa N Q2 M1
Yellow eel Anguilla anguilla IIIa N Q2 M1
Silver eel Anguilla anguilla IIIa N Q2 M1
Herring Clupea harengus IV, VIId, IIIa / 22-24, IIIa Q2 M1 Y
Cod Gadus morhua IV, VIId, IIIa Q2 M2 Y
Haddock Melanogrammus aeglefinus
IV, IIIa Q2 M1 Y
Hake Merluccius merluccius IIIa,IV,VI,VII,VIIIab Q2 M1 Y
Blue Whiting Micromesistius poutassou I-IX, XII, XIV Q2 M1 T
Norway lobster Nephrops norvegicus Functional unit Q0 M0 Y
Northern shrimp Pandalus borealis. IIIa , IVa east R2 Q1 T
Plaice Pleuronectes platessa IIIa Q2 M1 Y
Saithe Pollachius virens IV, IIIa, VI Q2 M1 Y
Mackerel Scomber scombrus IIIa, IVbc, VIId Q2 M1 T
Sole Solea solea IIIa R2 Q1 Y

105
Sprat Sprattus sprattus IIIa Q2 M1 T
Norway pout Trisopterus esmarki IV, IIIa Q2 M1 T
ICES AREA III (excl. Skagerrak) inc. Baltic
Glass eel Anguilla anguilla All areas Q2 M1
Yellow eel Anguilla anguilla All areas Q2 M1
Silver eel Anguilla anguilla All areas Q2 M1
Herring Clupea harengus 22-24/ 25-29, 32/ 30 /31/ Gulf of Riga
Q2 M1 T
Cod Gadus morhua IIIa S /22-24, 3d /25-32 Q2 M2 Y
Hake Merluccius merluccius IIIa,IV,VI,VII,VIIIab Q2 M1 Y
Blue Whiting Micromesistius poutassou
I-IX, XII, XIV Q2 M1 T
Norway lobster Nephrops norvegicus Functional unit Q0 M0 Y
Flounder Platichthys flesus III a-d Q2 M1 T
Plaice Pleuronectes platessa IIIa Q2 M1 Y
Salmon Salmo salar IIIb-d, 22-31 / 32 R2 Q1 T
Sea trout Salmo trutta IIIb-d R2 Q2 T
Sole Solea solea IIIa R2 Q1 Y
Sprat Sprattus sprattus IIIa S / IIIb-d Q2 M1 T
North Sea & Eastern Channel ICES AREAS IV, VIId
Sandeels Ammodytidae IV Q1 M1 T
Glass eel Anguilla anguilla IV,VIId Q2 M1
Yellow eel Anguilla anguilla IV,VIId Q2 M1
Silver eel Anguilla anguilla IV,VIId Q2 M1
Argentine Argentina spp. IV Z2 R2 T
Herring Clupea harengus IV,VIId, IIIa Q2 M1 Y
Shrimp Crangon crangon IV,VIId Q1 M1 T
Seabass Dicentrarchus labrax IV, VIId Y3 Q3 T
Cod Gadus morhua IV, VIId, IIIa Q2 M1 Y
Four-spot Megrim Lepidorhombus boscii IV, VIId Y2 Q2 T
Megrim Lepidorhombus whiffiagonis
IV, VIId Y2 Q2 T
Black-bellied Angler Lophius budegassa IV,VIId Y2 Q2 T
Anglerfish Lophius piscatorius IV,VI Y2 Q2 T
Haddock Melanogrammus aeglefinus
IV, IIIa Q2 M1 Y
Whiting Merlangius merlangus IV, VIId Q2 M1 Y

106
Hake Merluccius merluccius IIIa,IV,VI,VII,VIIIab Q2 M2 Y
Blue whiting Micromesistius poutassou
I-IX, XII, XIV Q2 M1 T
Lemon sole Microstomus kitt IV,VIId Z2 R2 T
Red mullet Mullus barbatus IV, VIId Z2 Q2 T
Striped red mullet Mullus surmuletus IV, VIId Z2 Q2 T
Norway lobster Nephrops norvegicus Functional unit Q0 M0 Y
Northern shrimp Pandalus borealis IIIa, IVa east / IVa R2 Q1 T
Plaice Pleuronectes platessa IV / VIId Q2 M1 Y
Saithe Pollachius virens IV, IIIa, VI Q2 M1 Y
Turbot Psetta maxima IV, VIId Q2 M1 T
Thornback Ray Raja clavata IV, VIId Z2 R2 T
Starry Ray Raja radiata IV, VIId Z2 R2 T
Cuckoo Ray Raja naevus IV, VIId Z2 R2 T
Spotted Ray Raja montagui IV, VIId Z2 R2 T
Other Rays and Skates Rajidae IV, VIId Z2 R2 T
Mackerel Scomber scombrus IIIa, IVbc, VIId Q2 M1 T
Brill Scopthalmus rhombus IV, VIId Q2 M1 T
Sole Solea solea IV / VIId Q2 M1 Y
Sprat Sprattus sprattus IV Q1 M1 T
Horse mackerel Trachurus spp. IIa, IVa, Vb, VIa, VIIa-c,e-k, VIIIabde / IIIa,IVbc, VIId
Z2 R2 T
Norway pout Trisopterus esmarki IV Q1 M1 Y
NE Atlantic & W Channel ICES V, VI, VII (exc d), VIII, IX, X, XII, XIV
Glass eel Anguilla anguilla all areas Q2 M1
Yellow eel Anguilla anguilla all areas Q2 M1
Silver eel Anguilla anguilla all areas Q2 M1
Scabbardfishes Aphanopus spp. IXa, X Q2 Q3 T
Argentine Argentina spp. all areas Z2 R2 T Alfonsinos Beryx spp. X R2 Q2 T
Crab Cancer pagurus all areas Z2 Y2 T
Gulper shark Centrophorus granulosus
all areas Y2 M4 T
Leafscale gulper shark Centrophorus squamosus
all areas Y2 M4 T
Portuguese dogfish Centroscymnus coelolepis
all areas Y2 M4 T

107
Herring Clupea harengus VIa / VIa N / VIaS, VIIbc / VIIa / VIIj
Q2 M1 Y
Conger Conger conger X R2 Q2 T
Roundnose grenadier Coryphaenoides rupestris
all areas Y2 Q2 T
Seabass Dicentrarchus labrax all areas exc. IX Y2 Q2 T
Anchovy Engraulis encrasicolus VIII Q2 M1 T
Anchovy Engraulis encrasicolus IXa (only Cadiz) Q2 M2 T
Cod Gadus morhua XII, XIV Y2 Q2 T
Cod Gadus morhua Va / Vb / VIa / VIb / VIIa / VIIb-k / VIII
Q2 M2 Y
Blue mouth rockfish Helicolenus dactylopterus
IXa, X Q2 M2 T
Lobsters Homarus gammarus all areas Z2 Y2 T
Orange roughy Hoplostethus atlanticus all areas Z2 Y2 T
Four-spot Megrim Lepidorhombus boscii VIIIc, IXa Q2 M2 T
Megrim Lepidorhombus whiffiagonis
VI / VII, VIIIabd Q2 M2 Y
Megrim Lepidorhombus whiffiagonis
VIIIc, IXa Q2 M2 T
Common Squid Loligo vulgaris VIIIc, IXa Y2 Q2 T
Black-bellied Angler Lophius budegassa IV, VI / VIIe-k, VIIIabd / VIIIc,IXa
Q2 M2 T
Anglerfish Lophius piscatorius IV, VI / VIIb-k, VIII abd / VIIIc, IXa
Q2 M2 T
Haddock Melanogrammus aeglefinus
Va / Vb , VI, XII, XIV Y2 Q2 Y
Haddock Melanogrammus aeglefinus
VIa / VIb / VIIa / VII b-k Q2 M2 Y
Whiting Merlangius merlangus Vb / VIa / VIb / VIIa / VIIe-k Q2 M2 Y
Whiting Merlangius merlangus VIII / IX, X Y2 Q2 T
Hake Merluccius merluccius IIIa,IV,VI,VII,VIIIab / VIIIc,IXa Q2 M2 Y
Blue whiting Micromesistius poutassou
I-IX,XII,XIV Q2 M1 T
Blue ling Molva dypterygia X R2 Q2 T
Ling Molva molva all areas Y2 Q2 T
Striped red mullet Mullus surmuletus all areas Z2 Y2 T
Norway lobster Nephrops norvegicus Functional unit Q0 M0 Y
Common Octopus Octopus vulgaris VIIIc, IXa Y2 Q2 T

108
White shrimp Parapenaeus longirostris
IXa Y2 Q2 T
Forkbeard Phycis phycis X Q2 M2 T
Plaice Pleuronectes platessa VIIa / VIIe / VIIfg Q2 M2 Y
Saithe Pollachius virens Va / Vb / IV, IIIa, VI Q2 M2 T
Saithe Pollachius virens VII, VIII, IX, X Y2 Q2 T
Wreckfish Polyprion americanus X Y2 Q2 T
Blond Ray Raja brachyura all areas Y2 Q2 T
Thornback Ray Raja clavata all areas Y2 Q2 T
Spotted Ray Raja montagui all areas Y2 Q2 T
Cuckoo ray Raja naevus all areas Y2 Q2 T
Other rays and skates Rajidae all areas Y2 Q2 T
Greenland halibut Reinhardtius hippoglossoides
V,VI, XII,XIV Y2 Q2 T
Sardine Sardina pilchardus VIIIabd / VIIIc, IXa Q2 M1 T
Spanish mackerel Scomber japonicus VIII, IX Y2 R2 T
Mackerel Scomber scombrus II,IIIa,IV,V,VI,VII,VIII,IX / VIIIc, IXa
Q2 M1 T
Redfishes Sebastes spp. V, VI, XII,XIV Q2 M2 T
Cuttlefish Sepia officinalis VIIIc, IXa Y2 Q2 T
Sole Solea solea VIIa/ VIIe/ VIIfg/ VIIIab Q2 M2 T
Sole Solea solea VIIbc/ VIIhk / IXa Y2 Q2 T
Seabreams Sparidae VIIIc, IXa, X Y2 Q2 T
Blue Jackmackerel Trachurus picturatus X Q2 M2 T
Horse mackerel Trachurus trachurus IIa, IVa, Vb, VIa, VIIa-c,e-k, VIIIabde / VIIIc, IXa / X
Q2 M1 T
Pouting Trisopterus luscus VIIIc, IXa Y2 Q2 T
Mediterranean
Glass eel Anguilla anguilla all areas Q2 M1
Yellow eel Anguilla anguilla all areas Q2 M1
Silver eel Anguilla anguilla all areas Q2 M1
Giant Red shrimp Aristeomorpha foliacea 1.3, 2.2,3.1 Q6 M6 T
Red shrimp Aristeus antennatus 1.1, 1.3, 2.2,3.1 Q6 M6 T
Bogue Boops boops 1.3, 2.1, 2.2, 3,1 Y6 Q6 T
Dolphinfish Coryphaena hippurus all areas Y6 Q6
Dolphinfish Coryphaena equiselis all areas Z6 R6

109
Seabass Dicentrarchus labrax 1, 2 Y6 Q6 T
Horned Octopus Eledone cirrosa all areas Y6 Q6 T
Musky Octopus Eledone moschata all areas Y6 Q6 T
Anchovy Engraulis encrasicolus all areas Q6 M6 T
Grey gurnard Eutrigla gurnardus 1.3,2.2,3.1 Y6 Q6 T
Squids Illex spp., Todarodes spp.
1.3, 2.1, 2.2, 3.1 Q6 M6 T
Billfishes Istiophoridae all areas Q5 Q4 T
Common Squid Loligo vulgaris 1.3,2.2,3.1 Y6 Q6 T
Black-bellied Anglerfish Lophius budegassa 1.1,1.3,2.2,3.1 Q6 M6 T
Anglerfish Lophius piscatorius 1.1,1.3,2.2,3.1 Q6 M6 T
Hake Merluccius merluccius all areas Q6 M6 T
Grey mullets Mugilidae 1.3, 2.1, 2.2, 3.1 Q6 M6 T
Red mullet Mullus barbatus all areas Q6 M6 T
Striped red mullet Mullus surmuletus all areas Q6 M6 T
Norway lobster Nephrops norvegicus 1.3,2.1,2.2,3.1 Q6 M6 T
Common Octopus Octopus vulgaris all areas Q6 M6 T
Pandora Pagellus erythrinus 1.1,1.2,2.1,2.2,3.1 Y6 Q6 T
White shrimp Parapenaeus longirostris
1.1, 1.3,2.2,3.1 Q6 M6 T
Caramote prawn Penaeus kerathurus 3.1 Y6 Q6 T
Thornback ray Raja clavata 1.3,2.1,2.2,3.1 Y6 Q6 T
Brown ray Raja miraletus 1.3,2.1,2.2,3.1 Y6 Q6 T
Atlantic bonito Sarda sarda all areas Q5 Q4 T
Sardine Sardina pilchardus all areas Q6 M6 T
Mackerel Scomber spp. 1.3,2.2,3.1 Y6 Q6 T
Sharks Shark-like Selachii all areas Q5 Q4 T
Cuttlefish Sepia officinalis 1.3,2.1,3.1 Q6 M6 T
Sole Solea vulgaris 1.2,2.1,3.1 Y6 Q6 T
Gilthead sea-bream Sparus aurata 1.2,3.1 Y6 Q6 T
Picarels Spicara spp. 1.3, 2.1, 2.2, 3.1 Y6 Q6 T
Mantis shrimp Squilla mantis 1.3, 2.1, 2.2 Q6 M6 T
Albacore Thunnus alalunga all areas Q5 Q4 T
Bluefin Tuna Thunnus thynnus all areas Q5 Q4 T
Mediterranean Horse mackerel
Trachurus mediterraneus
1.1,1.3,3.1 Y6 Q6 T

110
Horse mackerel Trachurus trachurus 1.1,1.3,3.1 Y6 Q6 T
Tub gurnard Trigla lucerna 1.3,2.2,3.1 Y6 Q6 T
Clam Veneridae 2.1, 2.2 Q6 M6 T
Swordfish Xiphias gladius all areas Q5 Q4 T
NAFO Areas
Cod Gadus morhua 2J3KL Y2 Q2 Y
Cod Gadus morhua 3M Y2 Q2 Y
Cod Gadus morhua 3NO Y2 Q2 Y
Cod Gadus morhua 3Ps Y2 Q2 T
Cod Gadus morhua SA 1 Y2 Q2 Y
Witch flounder Glyptocephalus cynoglossus
3NO Y2 Q2 T
American plaice Hippoglossoides platessoides
3LNO Y2 Q2 T
American plaice Hippoglossoides platessoides
3M Y2 Q2 T
Yellowtail flounder Limanda ferruginea 3LNO Y2 Q2 T
Grenadiers Macrouridae SA 2 + 3 Y2 Q2 T
Northern shrimp Pandalus borealis 3M Y2 Q2 Y
Skates Raja spp. SA 3 Y2 Q2 T
Greenland halibut Reinhardtius hippoglossoides
3KLMNO Y2 Q2 Y
Greenland halibut Reinhardtius hippoglossoides
SA 1 Y2 Q2 T
Redfishes Sebastes spp. 3M Y2 Q2 Y
Redfishes Sebastes spp. 3LN Y2 Q2 Y
Redfishes Sebastes spp. 3O Y2 Q2 Y
Redfishes Sebastes spp. SA 1 Y2 Q2 Y
Highly Migratory Species, Atlantic, Indian, Pacific ocean
Frigate tunas Auxis spp. Y M4 Y
Atlantic back skipjack Euthynnus alleteratus Y M4 Y
Billfishes Istiophoridae Y M4 Y
Short fin mako Isurus oxyrinchus Y M4 T
Skipjack tuna Katsuwonus pelamis M5 M4 T
Porbeagle Lamna nasus Y M4 T
Blue shark Prionace glauca Y M4 T
Atlantic bonito Sarda sarda Y M4 Y

111
Sharks Squalidae Y M4 Y
Albacore Thunnus alalunga M5 M4 T
Yellowfin tuna Thunnus albacares M5 M4 Y
Bigeye tuna Thunnus obesus M5 M4 Y
Bluefin tuna Thunnus thynnus M5 M4 T
Swordfish Xiphias gladius M5 M4 T
CECAF FAO 34
Black scabbardfish Aphanopus carbo Madeira Q2 M2 T
Hake Merluccius spp. Atl. CE Q6 M6 T
Common Octopus Octopus vulgaris Atl. CE Q4 M4 T
Deepwater Rose Shrimp Parapeneus longirostris Atl. CE Q2 M2 T
Southern Pink Shrimp Penaeus notialis Atl. CE Q3 M3 T
Sardine Sardina pilchardus Atl. CE Q5 M5 T
Mackerel Scomber japonicus Madeira Q2 M2 T
Horse mackerels Trachurus spp. Madeira Q2 M2 T
WECAF
Red snapper Lutjanus purpureus French Guyana ZEE Y6 Q7 T
Penaeus shrimp Penaeus subtilis French Guyana ZEE M6 M7 T

112
9. Appendix XIII shall be replaced by the following:
Appendix XIII
List of optional species for EP
SamplingSpecies Area / Stock Strata
ICES AREA I, II
Greenland Halibut Reinhardtius hippoglossoides
I,II Y3
North Sea (Skagerrak) ICES AREA IIIa(north)
Dab Limanda limanda IIIa N R2
Whiting Merlangius merlangus IIIa N R2
Sharks Squalidae IIIa N Z3
ICES AREA III (excl. Skagerrak) inc. Baltic
Whitefish Coregonus lavaretus IIId R2
Pike Esox lucius IIId R2
Dab Limanda limanda IIIa S, IIIb-d R2
Haddock Melanogrammus aeglefinus IIIa S R2
Whiting Merlangius merlangus IIIa S R2
Perch Perca fluviatilis IIId R2
Plaice Pleuronectes platessa III b-d R2
Saithe Pollachius virens IIIa S R2
Turbot Psetta maxima IIIb-d R2
Pike-perch Stizostedion lucioperca IIId R2
North Sea & Eastern Channel ICES AREAS IV, VIId
Catfishes Anarhichas spp. IV Z3
Tusk Brosme brosme IV, IIIa Z3
Witch flounder Glyptocephalus cynoglossus IV Z3
Bluemouth rockfish Helicolenus dactylopterus IV Z3
Dab Limanda limanda IV, VIId Z2
Roughhead Grenadier Macrourus berglax IV, IIIa Z3
Blue Ling Molva dypterygia IV, IIIa Z3
Ling Molva molva IV, IIIa Z3
Common scallop Pecten maximus VII d Z2
Forkbeard Phycis phycis IV Z3

113
Greenland Halibut Reinhardtius hippoglossoides
IV Z3
Salmon Salmo salar IV Z0
Redfishes Sebastes spp. IV Z3
Deep water sharks Shark-like Selachii IV Z3
Small sharks Shark-like Selachii IV, VIId Z3
Spurdogs Squalus acanthias IV, VIId Z3
NE Atlantic & W Channel, ICES V,VI,VII (exc d),VIII,IX,X,XII,XIV
Scabbardfishes Aphanopus spp. all areas, exc. IXa, X
Z2
Meagre Argyrosoma regius all areas Z2
Alfonsinos Beryx spp. all areas, exc. X Z2
Whelks Busycon spp. all areas Y2
Conger Conger conger all areas, exc. X Y2
Seabass Dicentrarchus labrax IX Y2
Witch Glyptocephalus cynoglossus VI, VII Y2
Bluemouth rockfish Helicolenus dactylopterus all areas, exc. IXa, X
Z2
Common Squid Loligo vulgaris all areas, exc. VIIIc, IXa
Y2
Capelin Mallotus villosus XIV Y2
Wedge sole Microchirus variegatus all areas Y2
Lemon sole Microstomus kitt all areas Z2
Blue ling Molva dypterygia all areas, exc. X Y2
Common Octopus Octopus vulgaris all areas, exc. VIIIc, IXa
Z2
Pandalid shrimps Pandalus spp. all areas Z2
Forkbeard Phycis phycis all areas, exc. X Z2
Plaice Pleuronectes platessa VIIbc / VIIhk / VIII, IX, X
Y2
Pollack Pollachius pollachius all areas Y2
Salmon Salmo salar all areas Z0
Cuttlefish Sepia officinalis all areas, exc. VIIIc, IXa
Z2
Razor clams Solen spp. all areas Z2
Seabreams Sparidae all areas, exc. VIIIc, IXa, X
Z2
Spurdog Squalus acanthias all areas Y2

114
Mediterranean Horse Mackerel
Trachurus mediterraneus VIIIc,IXa Y2
Pouting Trisopterus spp. all areas, exc. VIIIc, IXa
Z2
Other Deepwater species
Other Deepwater species all areas Z2
Mediterranean
Blue whiting Micromesistius poutassou 1.1,3.1 Y6
NAFO Areas
Pandalus Shrimps Pandalus spp. 3LN Y2
CECAF FAO 34
Anchovy Engraulis encrasicolus Y7
Silver scabbardfish Lepidopus caudatus Mauritania Y7
Common Squid Loligo vulgaris Atl.CE. Y7
Bonito Sarda sarda Mauritania Q7
Round sardinella Sardinella aurita Mauritania,Atl CE Y7
Short-body sardinella Sardinella maderensis Mauritania,Atl CE Y7
Chub Mackerel Scomber japonicus Mauritania Y7
Cuttlefish Sepia hierredda Atl. CE. Y7
Finfish Sparidae, Serranidae, Haemulidae
Atl. CE. Y7
Horse mackerel Trachurus trachurus Mauritania Y7
Cunene Horse mackerel
Trachurus trecae Mauritania Y7
Scabbardfishes Trichiuridae Y7
CCAMLR FAO 58
Antartic icefish Champsoccephalus gunnari Kerguelen Y6
Antartic toothfish Dissostichus eleginoides Kerguelen Y6
Grenadiers Macrouridae Kerguelen, Crozet Y6
Grey rockcod Notothenia squamifrons Kerguelen Y6
Skates Raja spp. Kerguelen, Crozet Y6
South West Atlantic FAO 41
Antartic toothfish Dissostichus eleginoides. Argentina/UK Y7
Cusk-eel Genypterus blacodes. Argentina/UK Y7
Short-finned squid Illex argentinus Argentina/UK Q7
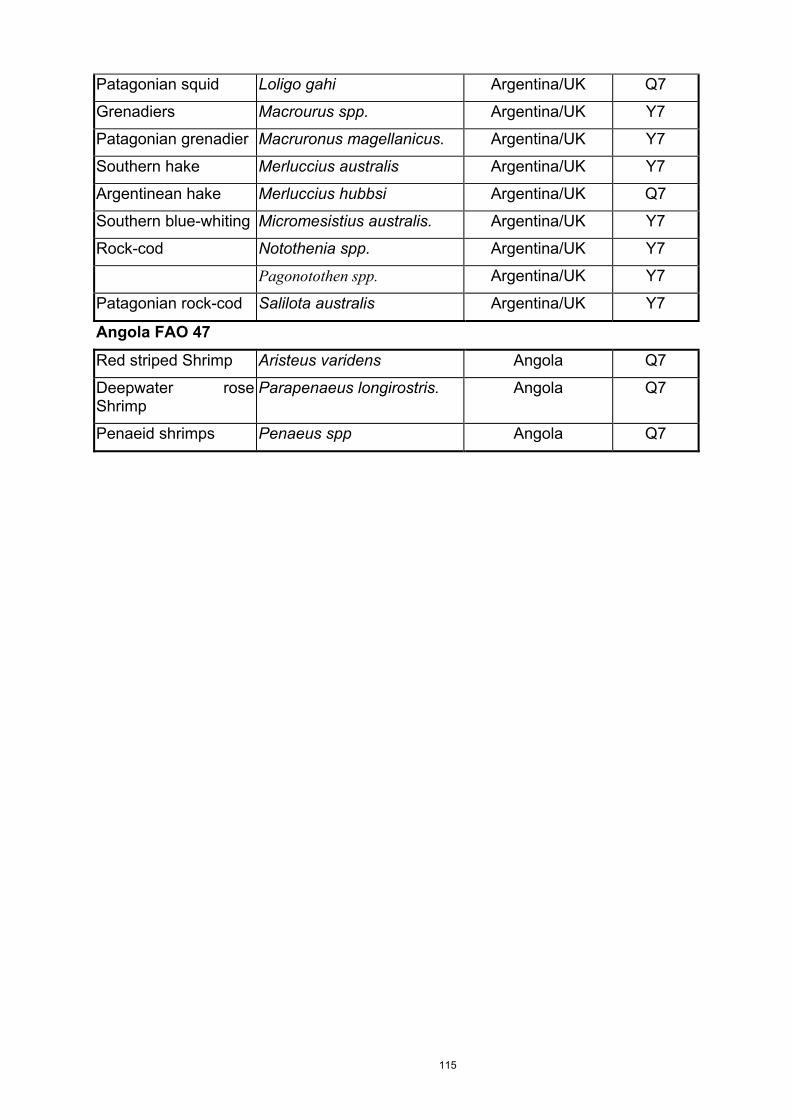
115
Patagonian squid Loligo gahi Argentina/UK Q7
Grenadiers Macrourus spp. Argentina/UK Y7
Patagonian grenadier Macruronus magellanicus. Argentina/UK Y7
Southern hake Merluccius australis Argentina/UK Y7
Argentinean hake Merluccius hubbsi Argentina/UK Q7
Southern blue-whiting Micromesistius australis. Argentina/UK Y7
Rock-cod Notothenia spp. Argentina/UK Y7
Pagonotothen spp. Argentina/UK Y7
Patagonian rock-cod Salilota australis Argentina/UK Y7
Angola FAO 47
Red striped Shrimp Aristeus varidens Angola Q7
Deepwater rose Shrimp
Parapenaeus longirostris. Angola Q7
Penaeid shrimps Penaeus spp Angola Q7

116
10. Appendix XIV shall be replaced by the following:
Appendix XIV (Section G)
List of surveys (MP, EP)
Name of the survey
Area Period Main objectives (Species etc)
Survey effort
Priority
days hauls
ICES AREA III inc. Baltic
BITS 1st/4rd Quarter
IIIaS, IIIb-d Quarter 1 and 4
Cod and other demersal species
129-157 510 1
IBTS 1st/3rd Quarter
IIIa Quarter 1 and 3
Haddock, Cod, Saithe, Herring, Sprat, Whiting,
Mackerel, Norway pout.
22-26 95 1
Herring Acoustic Survey
IIIa and IIIb-d
Quarter 3 and 4
Herring, Sprat 60-74 180 1
Sprat Acoustic Survey
IIIc-d Quarter 2 Sprat 32-39 85 1
Herring Larvae survey
IIIc Quarter 2 Herring Larvae 54-66 400 2
German Flatfish Survey
IIIc Quarter 3 Flounder 24-30 20 2
NORTH SEA & EASTERN CHANNEL & Area II
IBTS 1st Quarter IV,IIIa 1st Quarter Haddock, Cod, Saithe, Herring, Sprat, Whiting,
Mackerel, Norway pout.
117-143 360 1
Atlan/Scand. Herring Survey
IIa May Herring, Blue whiting
27-33 90+track
1
IBTS 3rd Quarter IV,IIIa 3rd Quarter Haddock, Cod, Saithe, Herring, Sprat, Whiting,
Mackerel, Norway pout.
117-143 360 1
NS Herring Acoustic Survey
IV,IIIa July Herring, Sprat 68-83 150+track
1
BTS IVb,IVc,VIId 3rd Quarter Plaice, Sole 50-62 280 1
Sole Net Survey IVb,IVc 3rd Quarter Sole, Plaice 14-17 60 1
Demersal Young Coasts of NS 3rd,4th Quarter plaice, sole, brown 117-143 1000 1

117
Fish Survey shrimp
Herring Larvae survey
IV,VIId 1st,4th Quarter Herring, Sprat Larvae
37-45 390 2
Greenland halibut survey
IIb slopes October since 1997
Greenland halibut 27-33 120 from 300-
750 m water depth
2
Nephrops TVsurvey
IVa,IVb 2nd Quarter Nephrops 17-21 90 2
Channel Ground Fish Survey
VIId 4th Quarter whiting, cod, pout, plaice, red gurnard,
black bream, red mullet
27-33 100 2
German Cod Survey
German Bight
1st,4th Quarter Cod, whiting, plaice and dab
14-18 70 2
Mackerel egg Survey
IV May-July (Trennial)
Mackerel egg production
14 130 1
NE ATLANTIC AREA & WESTERN CHANNEL
Western IBTS 4th quarter
VIa, VII, VIII, IXa
Oct-Nov Groundfish Survey (Gadoids + Pelagics)
abundance indices
149-182 580 1
ISBCBTS VIIa f g Sept Sole, Plaice 22-26 120 1
Mackerel / Horse Mackerel Egg
Survey
VIa, VII,VIII, IXa
Jan-July (Triennial)
Mackerel, Horse Mackerel egg
production
252-308 1750Plankton /
50 Bottom trawls
1
Spawning/Pre spawning Herring acoustic survey
VIa, VIIa,g July, Sept, Nov,
March,Jan
Herring, Sprat 126-154 Acoust Track
1
Sardine, Anchovy H Mackerel
Acoustic Survey
VIII + IX March/ April / May
Sardine, Anchovy, Mackerel, Horse
Mackerel abundance indices
77-95 140 1
BIOMAN VIII May Anchovy SSB (DEP)
18-22 600/20 pelagic hauls
1
Redfish survey Irminger Sea June (every two years)
Redfish abundance, age
24-30 20 1
Sardine DEPM VIIIc, IXa Spring (VIII) Winter (IX)
Sardine SSB and use of CUFES to
108-132 1200 1

118
Tri-annual improve estimates
WCBTS VIIe Oct Sole, Plaice, Anglerfish, Lemon
sole
7-9 55 1
RESSGASC VIIIa,b May + Oct Abundance indices, discards for hake,sole
22-26 70 2
Nephrops TV survey
VIa Feb+Aug/Sept Nephrops (from burrow counts)
28-34 200 2
Egg production survey
VIIa Jan-May (5-yearly)
Egg production (Demersal)
58-70 800 2
DARD groundfish VIIa March Groundfish Survey (Gadoids + Pelagics)
9-11 45 2
DARD herring larvae
VIIa Nov Larva indices: herring.
5-6 60 2
DARD MIK-net VIIa May/June Pelagic juvenile indices: gadoids.
5-6 45 2
DARD Nephrops VIIa Apr + August Distribution and biology: Nephrops
14-18 80 2
Juvenile Plaice Survey
VIIa May Young Plaice 6-8 25 2
Nephrops VIIa June Nephrops Ecology 6-8 25 2
Cod Tagging VIIa,b, VIa-b March Cod 9-11 30 2
Egg and Larval Survey
VI April Demersal (Gadoids)
25-31 70 2
ARSA IXa March Abundance indices for demersal stocks
15-19 50 2
Sardine-acoustic survey(SAR)
IXa Nov Abundance indices, Recruit
23-29 40 2
Nephrops IXa Jun Nephrops abundance
indices/Neph.Recruit.
15-19 60 2
Groundfish survey Summer
IXa Jul/Aug Abundance for hake, horse mackerel, mackerel,
23-28 65 2
Deep Sea Fish survey
IXa Aug/Sept Abundance indices of deep sea stocks
41-50 130 2

119
ARQDAÇO X Apr/May Abundance of bluemouth rockfish,
forkbears,alfonsinos,
conger,seabreams
41-50 35 2
DEEP X 4th Quarter Distribution & abundance
27-33 25 2
PELAGICOS X 3rd Quarter Distribution & abundance of tuna
and sharks
27-33 25 2
Greenland groundfish survey
ICES XIV, NAFO SA1
Sept./Oct. Distribution, abundance, biomass,
recruitment of target species cod and other species
42-52 70 down to 400m
2
IBTS (WCGFS) VIIe-k VIIIa March Groundfish Survey (Gadoids + Pelagics)
27-33 80 2
Scottish West Coast,Young Fish
Survey
VIa,VIIa March Gadoids, herring, mackerel
19-23 60 2
Rockall Survey VIb Sept (Bi-annual)
Haddock 12-14 40 2
Deepwater Survey VIa Sept (Biannual)
Deepwater species abundance
14 35 2
Porcupine groundfish Survey
VIIb,c,j,k 3rd. Quarter Hake, monk, megrim
30 90 2
Blue whiting survey
VI, VII March-April Blue whiting ? ? 2
MEDITERRANEAN
MEDITS 37(1,2,3.1) 2nd Quarter 30 species 320-391 1100 1
PELMED 37(2) Sardine, Anchovy (Abundance
indices)
23-28 15 2
GRUND 37(1,2) Biological data of 10 target species
81-99 1080 2
ANCHOVY 37(3.1) Anchovy abundance estimation
11-13 110 2
ECOMED 37(1) Nov-Dec Sardine, Anchovy (Abundance
indices)
27-33 55 2

120
SARDINE 37(3.1,2.2) Sardine abundance estimation
27-33 110 2
NAFO AREA
Flemish Cap groundfish survey
3M July since 1988 cod, American plaice, redfish,
Greenland halibut, roughhead
grenadier,shrimp
30-36 120 up to 750
m water depth
1
3NO groundfish survey
3NO April/May since 1995
Yellowtail flounder, American plaice, cod, redfish, Greenland halibut,
roughhead grenadier
27-33 120/ to 1250 m
2
INDIAN & ATLANTIC OCEANS, MEDITERRANEAN SEA
Tuna tagging (only for
assessment purposes)
Indian & Atlantic Oceans,
Mediterranean
Bigeye, Bluefin, Swordfish
1
Tuna tagging (only for
assessment purposes)
Indian & Atlantic Oceans,
Mediterranean
Yellow fin Skipjack, Albacore
2

121
11. Appendix XV shall be replaced by the following:
12.2 APPENDIX XV (SECTION H) Age-Length sampling scheme (MP, EP)
Legend:
a)
M : Mandatory species which should be sampled within the minimum programme
O : Optional species which could be sampled within extended programme
b) Market sampling effort defined as the numbers of samples taken per average tonne of landings of the last three years, on an annual basis:
A 1/20
B 1/50
C 1/100
D 1/200
E 1/500
F 1/1000
G 1/2000
c) Length sampling level defined as the number of fish measured per sample.
0 400
1 200
2 100
3 50
4 25 or less as available
d) As regards ageing, in cases where the sampling scheme as given in this Appendix is excessive, the following rule applies:
For stocks for which age reading is possible, 40 individuals must be aged per year within each length interval. However, this number can be reduced if Member States establish that such a reduction will not affect the quality of the age composition estimate.

122
Species Area / Stock
M/O Length Age
ICES area I, II
Silver Eel Anguilla anguilla I, II M A2 A2 Atlanto-Scandian herring
Clupea harengus IIa, V M F3 F4
Cod Gadus morhua I, II M D3 E4
Haddock Melanogrammus aeglefinus
I, II M D3 E4
Blue Whiting Micromesistius poutassou
I-IX, XII, XIV M F3 F3
Northern prawn Pandalus borealis I, II M D2 N/A
Saithe Pollachius virens I, II M D2 E3
Greenland halibut
Reinhardtius hippoglossoides
I, II O F3
Redfish Sebastes spp. I, II M E2 E2 Horse mackerel Trachurus trachurus IIa, IVa, Vb, VIa,
VIIa-c,e-k, VIIIabde
M F3 F4
North Sea (Skagerrak) ICES area IIIa (north)
Sandeel Ammodytidae IIIa N M F3 F3
Silver Eel Anguilla anguilla IIIa N M A2 A2
Herring Clupea harengus IV, VIId, IIIa / 22-24, IIIa M F2 F2
Cod Gadus morhua IV, VIId, IIIa M C3 C4
Dab Limanda limanda IIIa N O C3 C3
Haddock Melanogrammus aeglefinus
IV, IIIa M C3 C3
Whiting Merlangius merlangus IIIa N O C3 C3
Hake Merluccius merluccius IIIa, IV, VI, VII, VIIIab
M C3 C3
Blue whiting Micromesistius poutassou
I-IX, XII, XIV M F3 F3
Norway lobster Nephrops norvegicus Functional unit
M C1 N/A
Pandalid shrimps
Pandalus borealis IIIa , IVa east
M C0 N/A
Plaice Pleuronectes platessa IIIa M C3 C3
Saithe Pollachius virens IV, IIIa ,VI M C3 C3

123
Mackerel Scomber scombrus IIIa, IVbc, VIId M E3 E3
Sole Solea solea IIIa M B3 B3
Sprat Sprattus sprattus IIIa M F2 F2
Sharks Squalidae IIIa N O C4 N/A
Norway pout Trisopterus esmarki IV, IIIa M F3 F3
ICES area III (excluding Skagerrak) inc. Baltic
Silver Eel Anguilla anguilla IIIa (exc. a N)
M A2 A2
Herring Clupea harengus 22-24/ 25-29, 32/ 30 /31/ Gulf
of Riga M F2 F2
Whitefish Coregonus lavaretus IIId O C3 C3
Pike Esox lucius IIId O C3 C3
Cod Gadus morhua IIIa S M C3 C3
Cod Gadus morhua IIIb-d M D3 D4
Dab Limanda limanda IIIa S, IIIb-d O D3 D3
Haddock Melanogrammus aeglefinus
IIIa S O C3 C3
Whiting Merlangius merlangus IIIa S O C3 C3
Hake Merluccius merluccius IIIa,IV,VI,VII, VIIIab
M C3 C3
Blue whiting Micromesistius poutassou
I-IX, XII, XIV M F3 F3
Norway lobster Nephrops norvegicus Functional unit
M C1 N/A
Perch Perca fluviatilis IIId O C3 C3
Flounder Platichtys flesus IIIb-d M C3 C3
Plaice Pleuronectes platessa IIIa S M C3 C3
Plaice Pleuronectes platessa IIIb-d O D3 D3
Saithe Pollachius virens IIIa S O C3 C3
Turbot Psetta maxima IIIb-d O C3 C3
Salmon Salmo salar IIIb-d, 22-31/32
M C3 C3
Sea trout Salmo trutta IIIb-d M C3 C3
Sole Solea solea IIIa M B3 B3
Sprat Sprattus sprattus IIIa S M F2 F3
Sprat Sprattus sprattus IIIb-d M G2 G3
Pike-perch Stizostedion lucioperca IIId O C3 C3

124
North Sea and Eastern Channel ICES areas IV, VIId
Sandeel Ammodytidae IV M G3 G3
Silver Eel Anguilla anguilla IV, VIId M A2 A2
Catfish Anarhichas spp. IV O C4
Argentine Argentina spp. IV M F1 F2
Tusk Brosme brosme IV, IIIa O C4
Herring Clupea harengus IV, VIId, IIIa M F3 F4
Shrimp Crangon crangon IV, VIId M E2 N/A Sea bass Dicentrarchus labrax IV, VIId M D3
Cod Gadus morhua IV, VIId, IIIa M D3 D4
Witch flounder Glyptocephalus cynoglossus
IV O C4
Blue-mouth rockfish
Helicolenus dactylopterus
IV O C4
Four-spot megrim
Lepidorhombus boscii IV, VIId M E3 E4
Megrim Lepidorhombus whiffiagonis
IV, VIId M E3 E4
Dab Limanda limanda IV, VIId O C4
Black-bellied angler
Lophius budegassa IV, VIId M D4 D4
Anglerfish Lophius piscatorius IV, VI M D4 D4
Roughhead grenadier
Macrourus berglax IV, IIIa O C4
Haddock Melanogrammus aeglefinus
IV, IIIa M D3 D4
Whiting Merlangius merlangus IV, VIId M E4 D4
Hake Merluccius merluccius IIIa, IV, VI, VII, VIIIab
M C4
Blue whiting Micromesistius poutassou
I-IX, XII, XIV M F3 F3
Lemon sole Microstomus kitt IV, VIId M D4 D4
Blue ling Molva dypterygia IV, IIIa O C4
Ling Molva molva IV, IIIa O C4 C4 Red mullet Mullus barbatus IV, VIId M D3 D3 Striped red mullet
Mullus surmuletus IV, VIId M D3 D3
Norway lobster Nephrops norvegicus Functional Unit
M B0 N/A

125
Northern shrimp Pandalus borealis IIIa, IVa east/IVa
M E2 N/A
Common scallop Pecten maximus VIId M D3 N/A
Forkbeard Phycis phycis IV O C4
Plaice Pleuronectes platessa IV M E3 E4
Plaice Pleuronectes platessa VIId M C1 C3
Saithe Pollachius virens IV, IIIa, VI M D3 D4
Turbot Psetta maxima IV, VIId M D4 D4
Thornback ray Raja clavata IV, VIId M E4 N/A
Spotted ray Raja montagui IV, VIId M E4 N/A
Cuckoo ray Raja naevus IV, VIId M E4 N/A
Starry ray Raja radiata IV, VIId M E4 N/A
Other rays and skates
Rajidae IV, VIId M E4 N/A
Greenland halibut
Reinhardtius hippoglossoides
IV O C4
Salmon Salmo salar IV O C4 C4 Mackerel Scomber scombrus IIIa, IVbc,
VIId M F3 F4
Brill Scophthalmus rhombus
IV, VIId M D4 D4
Redfish Sebastes spp. IV O C4
Deep water shark
Shark-like Selachii IV O C4 N/A
Small shark Shark-like Selachii IV, VIId O C4 N/A
Sole Solea solea IV M D3 D4
Sole Solea solea VIId M C1 C3
Sprat Sprattus sprattus IV / VIIde M G3 G3
Spurdog Squalus acanthias IV, VIId O C4 N/A
Horse mackerel Trachurus spp. IIa,IVa,Vb,VIa, VIIa-c,e-k, VIIIabde / IIIa,IVbc,VII
d
M F2 F4
Norway pout Trisopterus esmarki IV M G3 G3

126
NE Atlantic and Western Channel ICES areas V, VI, VII (excluding d), VIII, IX, X, XII, XIV
Silver Eel Anguilla anguilla all areas M A2 A2
Scabbardfish Aphanopus spp. all areas, exc. IXa, X
O F3
Scabbardfish Aphanopus spp. IXa, X M B2 B4
Argentine Argentina spp. all areas M F1 F2
Meagre Argyrosoma regius all areas O F3
Alfonsinos Beryx spp. all areas, exc. X
O F3 F3
Alfonsinos Beryx spp. X M A3 A4
Whelk Busycon spp. all areas O F3
Edible crab Cancer pagurus all areas M D3 N/A
Gulper shark Centrophorus granulosus all areas M B4
Leafscale gulper shark
Centrophorus squamosus
all areas M B4 N/A
Portuguese dogfish
Centroscymnus coelolepis
all areas M B4 N/A
Herring Clupea harengus VIa/VIaN/VIaS,VIIbc/VII
a/VIIj
M F3 F4
Conger Conger conger all areas, exc. X
O F3 F4
Conger Conger conger X M B4 B4
Roundnose grenadier
Coryphaenoides rupestris
all areas M F3 C2
Sea bass Dicentrarchus labrax all areas, exc. IX
M D3 E4
Sea bass Dicentrarchus labrax IX O F3 F4
Anchovy Engraulis encrasicolus IXa (only Cadiz)
M E2 F3
Anchovy Engraulis encrasicolus VIII M D3 E4
Cod Gadus morhua Va/ Vb/VIa/VIb/ VIIa/VIIe-k
M D3 E4
Witch Glyptocephalus cynoglossus
VI, VII O F3
Bluemouth rockfish
Helicolenus dactylopterus
all areas, exc. IXa, X
O F3 F2
Bluemouth Helicolenus IXa, X M B3 B4

127
rockfish dactylopterus
Lobster Homarus gammarus all areas M F3 N/A
Orange roughy Hoplostethus atlanticus all areas M F3
Four-spot megrim
Lepidorhombus boscii VIIIc, IXa M C3 E3
Megrim Lepidorhombus whiffiagonis
VII, VIIIabd/ VIIIc,IXa
M C3 E3
Common squid Loligo vulgaris all areas, exc. VIIIc,
IXa
O F3 N/A
Common squid Loligo vulgaris VIIIc, IXa M B2 N/A
Black-bellied angler
Lophius budegassa IV, VI / VIIb-k, VIIIabd
M C3 D4
Black-bellied angler
Lophius budegassa VIIIc, IXa M B3 E3
Anglerfish Lophius piscatorious IV, VI / VIIb-k, VIIIabd
M C3 D4
Anglerfish Lophius piscatorious VIIIc, IXa M B3 E3
Capelin Mallotus villosus XIV O F3 F3 Haddock Melanogrammus
aeglefinus Va/Vb M F4 F4
Haddock Melanogrammus aeglefinus
VIa/VIb/VIIa/ VIIb-k
M E4 E3
Whiting Merlangius merlangus VIII / IX,X M F3 F4
Whiting Merlangius merlangus Vb/VIa/VIb/ VIIa/VIIe-k
M C3 E3
Hake Merluccius merluccius IIIa, IV, VI, VII, VIIIab / VIIIc, IXa
M C3 E3
Wedge sole Microchirus variegatus all areas O F3
Blue whiting Micromesistius poutassou
I-IX, XII, XIV M F3 F4
Lemon sole Microstomus kitt all areas O F3
Blue ling Molva dypterygia all areas, exc. X
O F3 F4
Blue ling Molva dypterygia X M A4 A4
Ling Molva molva all areas M F3 F4
Striped red mullet
Mullus surmuletus all areas M F3
Norway lobster Nephrops norvegicus VI Functional
M B0 N/A

128
Unit
Norway lobster Nephrops norvegicus VII Functional
Unit
M B1 N/A
Norway lobster Nephrops norvegicus VIII, IX Functional
Unit
M A1 N/A
Common octopus
Octopus vulgaris all areas, exc. VIIIc,
IXa
O F3 N/A
Common octopus
Octopus vulgaris VIIIc, IXa M B3 N/A
Pandalid shrimps
Pandalus spp. all areas O F3 N/A
White shrimp Parapenaeus longirostris
IXa M B1 N/A
Forkbeard Phycis phycis all areas, exc. X
O F3
Forkbeard Phycis phycis X M B3 B4
Plaice Pleuronectes platessa VIIa / VIIe / VIIfg
M B1 B3
Plaice Pleuronectes platessa VIIbc/VIIh-k/ VIII, IX, X
O F3 F4
Pollack Pollachius pollachius all areas O F3 F4
Saithe Pollachius virens Va/Vb/IV, IIIa, VI
M C3 E3
Saithe Pollachius virens VII, VIII M F3 F4
Wreckfish Polyprion americanus X M A4
Blond ray Raja brachyura all areas M F4 N/A
Thornback ray Raja clavata all areas M F4 N/A
Spotted ray Raja montagui all areas M F4 N/A
Cuckoo ray Raja naevus all areas M E4 N/A
Other rays and skates
Rajidae all areas M F4 N/A
Greenland halibut
Reinhardtius hippoglossoides
V, XIV/VI M A2 E3
Salmon Salmo salar all areas O F3
Sardine Sardina pilchardus VIIIabd/VIIIc, IXa
M C3 E3
Spanish Scomber japonicus VIII, IX M D3 F4

129
mackerel
Mackerel Scomber scombrus II, IIIa, IV, V, VI, VII, VIII,
IX (exc. VIIIc, IXa)
M F3 F4
Mackerel Scomber scombrus VIIIc, IXa M D4 D4
Redfishes Sebastes spp. V, VI, XII, XIV
M C2 E3
Cuttlefish Sepia officinalis all areas, exc. VIIIc,
IXa
O F3 N/A
Cuttlefish Sepia officinalis VIIIc, IXa M B3 N/A
Sole Solea solea VIIa / VIIfg M B1 B3
Sole Solea solea VIIbc / VIIhjk / IXa
M F3 F4
Sole Solea solea VIIe M C3 D4
Sole Solea solea VIIIab M B1 C3
Razor clam Solen spp. all areas O F3 N/A
Sea bream Sparidae all areas, exc. VIIIc,
IXa, X
O F3
Sea bream Sparidae VIIIc, IXa, X M B3 B4
Spurdog Squalus acanthias all areas O F3 N/A
Mediterranean horse mackerel
Trachurus mediterraneus
VIII, IX O F3 F4
Blue jack mackerel
Trachurus picturatus X M B3 C4
Horse mackerel Trachurus trachurus IIa, IVa, Vb, VIa, VIIa-
c,e-k, VIIIabde/ X
M F3 F4
Horse mackerel Trachurus trachurus VIIIc , IXa M D3 E2
Pouting Trisopterus luscus VIIIc, IXa M B4
Pouting Trisopterus spp. all areas, exc. VIIIc,
IXa
O F3 F3
Other deepwater species
Other deepwater species
all areas O F3

130
Mediterranean
Silver Eel Anguilla anguilla all areas M A2 A2
Giant red shrimp Aristeomorpha foliacea 1.3, 2.2, 3.1 M B3 N/A
Red shrimp Aristeus antennatus 1.1, 1.3, 2.2, 3.1
M B3 N/A
Bogue Boops boops 1.3, 2.1, 2.2, 3.1
M E3 E4
Dolphinfish Coryphaena hippurus all areas M B3
Dolphinfish Coryphaena equiselis all areas M B3 B3 Sea bass Dicentrarchus labrax 1.2 M E3 E3 Horned octopus Eledone cirrhosa 1.1, 1.3, 2.1,
2.2, 3.1 M E4 N/A
Musky octopus Eledone moschata 1.3, 2.1, 2.2, 3.1
M E4 N/A
Anchovy Engraulis encrasicolus all areas M D3 E4
Grey gurnard Eutrigla gurnardus 1.3, 2.2, 3.1 M D3
Squids Illex spp., Todarodes spp.
1.3, 2.1, 2.2, 3.1
M N/A
Billfish Istiophoridae all areas M D2 D2
Common squid Loligo vulgaris 1.3, 2.2, 3.1 M D3 N/A
Black-bellied angler
Lophius budegassa 1.1, 1.3, 2.2, 3.1
M C2 D4
Anglerfish Lophius piscatorius 1.1, 1.3, 2.2, 3.1
M C2 D4
Hake Merluccius merluccius all areas M C3 D4
Blue whiting Micromesistius poutassou
1.1, 3.1 O D3
Grey mullets Mugilidae 1.3, 2.1, 2.2, 3.1
M D3 D3
Red mullet Mullus barbatus all areas M C3 D4
Striped red mullet
Mullus surmuletus all areas M C3 D4
Norway lobster Nephrops norvegicus 1.3, 2.1, 2.2, 3.1
M B3 N/A
Common octopus
Octopus vulgaris all areas M N/A
Pandora Pagellus erythrinus 1.1, 1.2, 2.1, 2.2, 3.1
M D3 E4

131
White shrimp Parapenaeus longirostris
1.1, 1.3, 2.2, 3.1
M C3 N/A
Caramote prawn Penaeus kerathurus 3.1 M E3 N/A
Thornback ray Raja clavata 1.3, 2.1, 2.2, 3.1
M D3 N/A
Brown ray Raja miraletus 1.3, 2.1, 2.2, 3.1
M D3 N/A
Atlantic bonito Sarda sarda all areas M E4
Sardine Sardina pilchardus all areas M D3 E4
Mackerel Scomber spp. 1.3, 2.2, 3.1 M E4 E4
Cuttlefish Sepia officinalis 1.3, 2.1, 3.1 M E3 N/A
Sharks Shark-like Selachii all areas M D2 N/A
Sole Solea vulgaris 1.2, 2.1, 3.1 M E3
Gilthead sea-bream
Sparus aurata 1.2, 3.1 M E3 E3
Picarels Spicara spp. 1.3, 2.1, 2.2, 3.1
M E3 E3
Mantis shrimp Squilla mantis 1.3, 2.1, 2.2 M N/A
Albacore Thunnus alalunga all areas M C2
Bluefin tuna Thunnus thynnus all areas M C2 C2 Mediterranean horse mackerel
Trachurus mediterraneus
1.1, 1.3, 3.1 M E3 E4
Horse mackerel Trachurus trachurus 1.1, 1.3, 3.1 M E3 E4
Tub gurnard Trigla lucerna 1.3, 2.2, 3.1 M D3
Clam Veneridae 2.1, 2.2 M F3 N/A
Swordfish Xiphias gladius all areas M C2
NAFO areas
Cod Gadus morhua 2J 3KL M A2 E3
Cod Gadus morhua 3M M A2 E3
Cod Gadus morhua 3NO M A2 E3
Cod Gadus morhua 3Ps M F4 F4
Cod Gadus morhua SA 1 M F4 F4 Witch flounder Glyptocephalus
cynoglossus 3NO M A2
American plaice Hippoglossoides platessoides
3LNO M A2 E3
American plaice Hippoglossoides platessoides
3M M A2 E3

132
Yellowtail flounder
Limanda ferruginea 3LNO M A2
Grenadier Macrouridae SA 2 + 3 M A2 E3
Pandalid shrimps
Pandalus spp. 3LN O F3 N/A
Pandalid shrimps
Pandalus spp. 3M M D2 N/A
Rays and skates Raja spp. SA 3 M D2 N/A
Greenland halibut
Reinhardtius hippoglossoides
3KLMNO M A2 E3
Greenland halibut
Reinhardtius hippoglossoides
SA 1 M A2 E3
Redfish Sebastes spp. 3LN M A2
Redfish Sebastes spp. 3M M A2 F3
Redfish Sebastes spp. 3O M C2
Redfish Sebastes spp. SA 1 M A2 A2
Highly migratory species, Atlantic, Indian, Pacific Oceans
Frigate tuna Auxis spp. M E4
Atlantic back skipjack
Euthynnus alleteratus M E4
Billfish Istiophoridae M D2
Shortfin mako Isurus oxyrinchus M
Skipjack tuna Katsuwonus pelamis M C2
Porbeagle Lamna nasus M
Blue shark Prionace glauca M A4
Atlantic bonito Sarda sarda M E4
Shark Squalidae M D2
Albacore Thunnus alalunga M C2
Yellowfin tuna Thunnus albacares M C2
Bigeye tuna Thunnus obesus M C2
Bluefin tuna Thunnus thynnus M C2
Swordfish Xiphias gladius M C2
CECAF FAO 34
Black scabbardfish
Aphanopus carbo Madeira M D3
Anchovy Engraulis encrasicolus O E3
Silver scabbardfish
Lepidopus caudatus Mauritania O D2

133
Common squid Loligo vulgaris Atl. CE O D2
Hake Merluccius spp. Atl. CE M C2
Common octopus
Octopus vulgaris Atl. CE M C2
Deepwater rose shrimp
Parapenaeus longirostris
Atl. CE M C2
Southern pink shrimp
Penaeus notialis Atl. CE M C2
Bonito Sarda sarda Mauritania O F2
Sardine Sardina pilchardus Atl. CE M E3
Round sardinella Sardinella aurita Mauritania, Atl. CE
O F3
Short-body sardinella
Sardinella maderensis Mauritania, Atl. CE
O F3
Chub Mackerel Scomber japonicus Madeira M D2
Chub Mackerel Scomber japonicus Mauritania O D2
Cuttlefish Sepia hierredda Atl. CE O D2
Finfish Sparidae, Serranidae, Haemulidae
Atl. CE O D2
Horse mackerel Trachurus spp. Madeira M D3
Atlantic horse mackerel
Trachurus trachurus Mauritania O D2
Cunene horse mackerel
Trachurus trecae Mauritania O D2
Scabbardfish Trichiuridae O D2
WECAF
Red snapper Lutjanus purpureus French Guiana ZEE
M C2
Penaeus shrimp Penaeus subtilis French Guiana ZEE
M C2
CCAMLR FAO 58
Antarctic icefish Champsocephalus gunnari
Kerguelen O C2
Antarctic toothfish
Dissostichus eleginoides
Kerguelen O C2 D3
Grenadier Macrouridae Kerguelen Crozet
O C2
Grey rockcod Notothenia squamifrons
Kerguelen O C2

134
Rays and skates Raja spp. Kerguelen Crozet
O C2
South-west Atlantic FAO 41
Antarctic toothfish
Dissostichus eleginoides
Argentina/UK
O D2 D2
Cusk-eel Genypterus blacodes Argentina/UK
O D2 D2
Argentine short-finned squid
Illex argentinus Argentina/UK
O D2 N/A
Patagonian squid
Loligo gahi Argentina/UK
O D2 N/A
Grenadier Macrourus spp. Argentina/UK
O D2 D2
Patagonian grenadier
Macruronus magellanicus
Argentina/UK
O D2 D2
Southern hake Merluccius australis Argentina/UK
O D2 D2
Argentinean hake
Merluccius hubbsi Argentina/UK
O D2 C2
Southern blue-whiting
Micromesistius australis
Argentina/UK
O D2 D2
Rockcod Notothenia spp. Argentina/UK
O D2 D2
Codling Salilota australis Argentina/UK
O D2 D2
Angola FAO 47
Red-striped shrimp
Aristeus varidens Angola O B2 N/A
Deepwater rose shrimp
Parapenaeus longirostris
Angola O B2 N/A
Penaeid shrimps Penaeus spp. Angola O B2 N/A

135
12. Appendix XVI shall be replaced by the following:
12.3 APPENDIX XVI (SECTION I) Other biological samplings
Y=yearly; T=every 3 years; S=every 6 years
Growth Maturity Fecundity Sex Ratio Data Data
Species Area / Stock
Length
Weight
Length
Age Length
Age Length
Age
ICES AREA I, II Silver eel Anguilla anguilla I, II T T Atlanto-Scandian Herring
Clupea harengus
IIa, V T T T T T T
Cod Gadus morhua I,II T T T T T T Haddock Melanogrammus
aeglefinus I,II T T T T T T
Blue Whiting
Micromesistius poutassou
I-IX, XII, XIV T T T T T T
Northern prawn
Pandalus borealis
I,II T T T T
Saithe Pollachius virens I,II T T T T T T Redfishes spp. Sebastes spp. * I,II T T T T T T
Horse mackerel
Trachurus trachurus
IIa, IVa, Vb, VIa, VIIa-c,e-k,
VIIIabde
T T T T T T
North Sea (Skagerrak) ICES AREA IIIa(north)
Sandeel Ammodytidae IIIa N T T T T T T Silver eel Anguilla anguilla IIIa N T T Herring Clupea
harengus IV,
VIId,IIIa/ 22-24, IIIa
T T T T T T
Cod Gadus morhua IV, VIId,IIIa T T T T T T Haddock Melanogrammus
aeglefinus IV, IIIa T T T T T T
Hake Merluccius merluccius
IIIa,IV,VI,VII,
VIIIab T T T T T T
Blue Whiting Micromesistius poutassou
I-IX, XII,XIV
T T T T T T
Norway lobster Nephrops norvegicus
Functional unit
S S S T
Pandalid Pandalus IIIa,IVa T T T T

136
shrimps borealis east Plaice Pleuronectes
platessa IIIa T T T T T T
Saithe Pollachius virens IV, IIIa, VI T T T T T T Mackerel Scomber
scombrus IIIa, IVbc,
VIId T T T T T T
Sole Solea solea IIIa T T T T T T Sprat Sprattus
sprattus IIIa T T T T T T
Norway pout Trisopterus esmarki
IV, IIIa T T T T T T
ICES AREA III (excl. Skagerrak) inc. Baltic Silver eel Anguilla anguilla IIIa (exc. a
N) T T
Herring Clupea harengus
22-24/ 25-29, 32/ 30 /31/ Gulf of Riga
T T T T T T
Flounder Platichthys flesus
III b-d T T T T T T
Cod Gadus morhua IIIa S /22-24, 3d /25-32 T T T T T T
Norway lobster Nephrops norvegicus
Functional unit
S S S T
Flounder Platichthys flesus
III b-d T T T T T T
Plaice Pleuronectes platessa
IIIa S T T T T T T
Salmon Salmo salar IIIb-d, 22-31 /32
T T T T T T
Sea trout Salmo trutta IIIb-d T T T T T T Sole Solea solea IIIa T T T T T T Sprat Sprattus
sprattus IIIa S / IIIb-
d T T T T T T
North Sea & Eastern Channel ICES AREAS IV, VIId
Sandeel Ammodytidae IV T T T T T T Silver eel Anguilla anguilla IV,VIId T T Argentine Argentina spp. * IV T T T T T T Herring Clupea
harengus IV,VIId, IIIa T T T T T T
Shrimp Crangon crangon
IV,VIId T T T T
Seabass Dicentrarchus labrax
IV, VIId T T T T T T
Cod Gadus morhua IV, VIId, T T T T T T

137
IIIa Four-spot Megrim
Lepidorhombus boscii
IV,VIId T T T T T T
Megrim Lepidorhombus whiffiagonis
IV,VIId T T T T T T
Black-bellied Angler
Lophius budegassa
IV,VIId T T T T T T
Anglerfish Lophius piscatorius
IV,VI T T T T T T
Haddock Melanogrammus aeglefinus
IV, IIIa T T T T T T
Whiting Merlangius merlangus
IV, VIId T T T T T T
Hake Merluccius merluccius
IIIa,IV,VI,VII,VIIIab
T T T T T T
Blue whiting Micromesistius poutassou
I-IX, XII,XIV
T T T T T T
Lemon sole Microstomus kitt IV,VIId T T T T T T Red Mullet Mullus barbatus IV, VIId T T T T T T Striped red mullet
Mullus surmuletus
IV, VIId T T T T T T
Norway lobster Nephrops norvegicus
Functional unit
S S S T
Northern shrimp
Pandalus borealis
IIIa, IVa east/ IVa
T T T T
Plaice Pleuronectes platessa
IV / VIId T T T T T T
Saithe Pollachius virens IV, IIIa, VI T T T T T T Turbot Psetta maxima IV, VIId T T T T T T Thornback ray Raja clavata IV, VIId T T T T Starry Ray Raja radiata IV, VIId T T T T Cuckoo Ray Raja naevus IV, VIId T T T T Spotted Ray Raja montagui IV, VIId T T T T Other Rays & Skates
Rajidae * IV,VIId T T T T
Mackerel Scomber scombrus
IIIa, IVbc,VIId
T T T T T T T T
Brill Scopthalmus rhombus
IV, VIId T T T T T T
Sole Solea solea IV / VIId T T T T T T Sprat Sprattus
sprattus IV T T T T T T
Horse mackerel
Trachurus spp. * IIa, IVa, Vb, VIa, VIIa-c,e-k, VIIIabde/ IIIa,
IVbc, VIId
T T T T T T T T

138
Norway pout Trisopterus esmarki
IV T T T T T T
NE Atlantic & Western Channel ICES AREAS V, VI, VII (exc d), VIII, IX, X, XII, XIV
Silver eel Anguilla anguilla all areas T T Scabbardfishes
Aphanopus spp.*
IXa, X T T T T T T
Argentine Argentina spp. * all areas T T T T T T Alfonsinos Beryx spp. * X T T T T T T Edible Crab Cancer pagurus all areas T T T T
Gulper shark
Centrophorus granulosus
all areas T T T N/A T N/A
Leafscale gulper shark
Centrophorus squamosus
all areas T T T N/A T N/A
Portuguese dogfish
Centroscymnus coelolepis
all areas T T T N/A T N/A
Herring Clupea harengus
VIa / VIa N / VIaS, VIIbc /
VIIa / VIIj T T T T T T
Conger Conger conger X T T T T T T Roundnose Grenadier
Coryphaenoides rupestris
all areas T T T T T T
Seabass Dicentrarchus labrax
all areas, exc. IX
T T T T T T
Anchovy Engraulis encrasicolus
IXa, only Cadiz
T T T T T T T T
Anchovy Engraulis encrasicolus
VIII T T T T Y Y Y Y
Cod Gadus morhua Va/Vb/VIa/VIb/VIIa/VIIe-k
T T T T T T
Bluemouth rockfish
Helicolenus dactylopterus
IXa, X T T T T T T
Lobster Homarus gammarus
all areas T T T T
Orange roughy Hoplostethus atlanticus
all areas T T T T T T
Four-spot Megrim
Lepidorhombus boscii
VIIIc, IXa T T T T T T
Megrim Lepidorhombus whiffiagonis
VI / VII, VIIIabd
/VIIIc,IXa
T T T T T T
Common Squid
Loligo vulgaris VIIIc, IXa T T T T

139
Black-bellied angler
Lophius budegassa
IV, VI / VIIb-k, VIIIabd / VIIIc,IXa
T T T T T T
Anglerfish Lophius piscatorius
IV, VI / VIIb-k, VIII abd / VIIIc,
IXa
T T T T T T
Haddock Melanogrammus aeglefinus
Va / Vb,VI,XII,XIV/VIa/VIb/VIIa/ VIIb-k
T T T T T T
Whiting Merlangius merlangus
VIII/ IX,X T T T
Whiting Merlangius merlangus
Vb/VIa/VIb/ VIIa/ VIIe-k
T T T T T T
Hake Merluccius merluccius
IIIa,IV,VI,VII,VIIIab/VII
Ic, IXa
T T T T T T
Blue whiting Micromesistius poutassou
I-IX,XII,XIV T T T T T T
Blue ling Molva dypterygia X T T T T T T Ling Molva molva all areas T T T T T T Red mullet Mullus
surmuletus all areas T T T T T T
Norway lobster Nephrops norvegicus
Functional Unit
S S S T
Common Octopus
Octopus vulgaris VIIIc, IXa T T T T
White shrimp Parapenaeus longirostris
IXa T T T T
Forkbeard Phycis phycis X T T T T T T Plaice Pleuronectes
platessa VIIa/
VIIe/VIIfg T T T T T T
Saithe Pollachius virens Va/ Vb/IV, IIIa, VI/ VII,VIII
T T T T T T
Wreckfish Polyprion americanus
X T T T T T T
Blond Ray Raja brachyura all areas T T T T Thornback ray Raja clavata all areas T T T T Spotted Ray Raja montagui all areas T T T T Cuckoo ray Raja naevus all areas T T T T Other rays and skates
Rajidae * all areas T T T T
Greenland halibut
Reinhardtius hippoglossoides
V, XIV / VI T T T T T T
Sardine Sardina pilchardus
VIIIabd/VIII T T T T T T T T

140
c, IXa Spanish mackerel
Scomber japonicus
VIII,IX T T T T T T
Mackerel Scomber scombrus
II,IIIa,IV,V,VI,VII,VIII,I
X
T T T T T T T T
Mackerel Scomber scombrus
VIIIc, IXa T T T T T T T T
Redfishes Sebastes spp. * V,VI, XII,XIV
T T T T T T
Cuttlefish Sepia officinalis VIIIc, IXa T T T T Sole Solea solea VIIa/VIIbc
/VIIe/VIIfg/ VIIhk/VIIIa
b/ IXa
T T T T T T
Seabreams Sparidae * VIIIc, IXa, X
T T T T T T
Blue jack mackerel
Trachurus picturatus
X T T T T T T
Horse mackerel
Trachurus trachurus
IIa, IVa, Vb, VIa, VIIa-c,e-k,
VIIIabde / VIIIc, IXa / X
T T T T T T T T
Pouting Trisopterus luscus
VIIIc, IXa T T T T T T
Mediterranean
Silver eel Anguilla anguilla
all areas T T
Giant Red shrimp
Aristeomorpha foliacea
1.3, 2.2,3.1
T T T T
Red shrimp Aristeus antennatus
1.1, 1.3, 2.2,3.1
T T T T
Bogue Boops boops 1.3, 2.1, 2.2, 3.1
T T T T T T
Dolphinfish Coryphaena spp. *
all areas T T T T T T
Seabass Dicentrarchus labrax
1,2 T T T T T T
Horned Octopus
Eledone cirrhosa
1.1, 1.3,2.1,2.2,
3.1
T T T T
Musky Octopus Eledone moschata
1.3, 2.1,2.2,3.1
T T T T
Anchovy Engraulis encrasicolus
all areas T T T T T T
Grey gurnard Eutrigla gurnardus
1.3,2.2,3.1 T T T T T T

141
Squids Illex spp. *, Todarodes spp. *
1.3, 2.1, 2.2, 3.1 T T T T
Billfishes Istiophoridae * all areas T T T T T T
Common Squid
Loligo vulgaris 1.3,2.2,3.1 T T T T
Black-bellied Angler
Lophius budegassa
1.1,1.3,2.2,3.1
T T T T T T
Anglerfish Lophius piscatorius
1.1,1.3,2.2,3.1
T T T T T T
Hake Merluccius merluccius
1.1,1.2,1.3,2.1,2.2,3.1
T T T T T T
Grey mullets Mugilidae * 1.3, 2.1, 2.2, 3.1 T T T T T T
Red Mullet Mullus barbatus
all areas T T T T T T
Striped red mullet
Mullus surmuletus
all areas T T T T T T
Norway lobster
Nephrops norvegicus
1.3,2.1,2.2,3.1
S S S T
Common Octopus
Octopus vulgaris
all areas T T T T
Pandora Pagellus erythrinus
1.1,1.2,2.1,2.2,3.1
T T T T T T
White shrimp
Parapenaeus longirostris
1.1, 1.3,2.2,3.1
T T T T
Caramote prawn
Penaeus kerathurus
3,1 T T T T
Picarels Spicara maris 3,1 T T T T T T
Thornback ray
Raja clavata 1.3,2.1,2.2,3.1
T T T T
Brown ray Raja miraletus 1.3,2.1,2.2,3.1
T T T T
Atlantic bonito
Sarda sarda all areas T T T T T T
Sardine Sardina pilchardus
all areas T T T T T T
Mackerel Scomber spp. 1.3,2.2,3.1 T T T T T T
Sharks Shark-like Selachii *
all areas T T T T T T
Cuttlefish Sepia officinalis
1.3,2.1,3.1 T T T T
Sole Solea vulgaris 1.2,2.1,3.1 T T T T T T

142
Gilthead seabream
Sparus aurata 1.2,3.1 T T T T T T
Picarels Spicara spp. * 1.3,2.1,2.2,3.1
T T T T T T
Mantis shrimp
Squilla mantis
1.3, 2.1, 2.2 T T T T
Albacore Thunnus alalunga
all areas T T T T T T
Bluefin tuna Thunnus thynnus
all areas T T T T T T
Mediterranean Horse mackerel
Trachurus mediterraneus
1.1,1.3,3.1 T T T T T T
Horse mackerel
Trachurus trachurus
1.1,1.3,3.1 T T T T T T
Tub gurnard Trigla lucerna 1.3,2.2,3.1 T T T T T T
Clam Veneridae *
2.1, 2.2 T T T T
Swordfish Xiphias gladius all areas T T T T T T NAFO Areas
Cod Gadus morhua 2J 3KL T T T Cod Gadus morhua 3M T T T T T T Cod Gadus morhua 3NO T T T T T T Cod Gadus morhua 3Ps T T T T T T Cod Gadus morhua SA I T T T T T T Witch flounder Glyptocephalus
cynoglossus 3NO T T T
American plaice
Hippoglossoides platessoides
3LNO T T T T T T
American plaice
Hippoglossoides platessoides
3M T T T T T T
Yellowtail flounder
Limanda ferruginea
3LNO T T T
Grenadiers Macrouridae * SA 2 + 3 T T T T T T Pandalid shrimps
Pandalus spp. * 3M T T T T
Skates Raja spp. * SA 3 T T T Greenland halibut
Reinhardtius hippoglossoides
3KLMNO T T T T T T
Greenland halibut
Reinhardtius hippoglossoides
1D T T T T T T
Redfishes Sebastes spp. * 3M T T T Redfishes Sebastes spp. * 3LN T T

143
Redfishes Sebastes spp. * 3O T T Redfishes Sebastes spp. * SA I T T Highly Migratory Species, Atllantic, Indian, Pacific ocean
Frigate tunas Auxis spp. * T T T T T T Atlantic back skipjack
Euthynnus alleteratus
T T T T T T
Billfishes Istiophoridae * T T T T T T
Short fin mako
Isurus oxyrinchus
T T T T
Skipjack tuna Katsuwonus pelamis
T T T T T T
Porbeagle Lamna nasus
T T T T
Blue shark Prionace glauca
T T T T
Atlantic bonito Sarda sarda T T T T T T Sharks Squalidae * T T T T Albacore Thunnus
alalunga T T T T T T
Yellowfin tuna Thunnus albacares
T T T T T T
Bigeye tuna Thunnus obesus T T T T T T Bluefin tuna Thunnus
thynnus T T T T T T
Swordfish Xiphias gladius T T T T T T
CECAF FAO 34
Black scabbardfish
Aphanopus carbo
Madeira T T T T T T
Anchovy Engraulis encrasicolus
T T T T T T
Common Squid
Loligo vulgaris
Atl.CE. T T T T
Hake Merluccius spp. *
Atl. CE T T T T T T
Common Octopus
Octopus vulgaris
Atl. CE T T T T
Deepwater rose Shrimp
Parapeneus longirostris
Atl. CE T T T T
Southern pink Shrimp
Penaeus notialis
Atl. CE T T T T

144
Sardine Sardina pilchardus
Atl. CE T T T T T T
Bonito Sarda sarda Mauritania T T T T T T
Round sardinella
Sardinella aurita
Mauritania, Atl. CE T T T T T T
Short-body sardinella
Sardinella maderensis
Mauritania, Atl. CE T T T T T T
Chub Mackerel
Scomber japonicus
Madeira, Mauritania
T T T T T T
Cuttlefish Sepia hierredda
Atl. CE. T T T T
Horse Mackerel
Trachurus spp.*
Madeira T T T T T T
WECAF
Red snapper
Lutjanus purpureus
French Guyana
ZEE
T T T T T T
Penaeus shrimp
Penaeus subtilis
French Guyana
ZEE
T T T T
(*) Each present species in a particular area should be considered separatly

145
13 ANNEX III STECF OPINION AND EVALUATION OF THE REPORT BY SGMOS ON RECOVERY PLANS FOR SOUTHERN HAKE AND NORWAY LOBSTER IN ICES AREAS VIIIC AND IXA.
STECF adopted by fast track procedure, in July 2003, the report by SGMOS on Southern stocks recovery plans (SEC(2004)178). STECF summary of the report and opinion are reported in the following sections.
13.1 SUMMARY OF THE REPORT
13.1.1 Background. (Sects. 0-3)
The Southern Hake and Iberian Nephrops (Norway lobster) stocks are in a severely depleted state and ICES has for several years advised for strong measures to rebuild these stocks
A Subgroup on Management Objectives (SGMOS) of the Scientific, Technical and Economic Committee for Fisheries (STECF) was formed to address the topic of Recovery plans of Southern hake and Iberian Norway lobster stocks. The subgroup met from 9 – 13 June at IPIMAR Headquarters in Lisbon with the following TOR:
• advise on possible recovery targets both for the Southern hake stock and Norway lobster stocks (FU 26-30 and FU 25-31 in the Atlantic Iberian peninsula; ICES areas IXa and VIIIc), and the acceptable time-span needed to rebuild the stocks to safe biological limits;
• evaluate different recovery strategies based on SSB increments or F reduction and explore the effect of implementing constraints on annual variation in TAC, taking into account the time needed to rebuild the stock;
• advise on management measures suitable for implementing the recovery strategies paying special attention to quota, effort and/or technical measures, taking into consideration the characteristics of the fisheries (multi-species and multi-fleet);
• identify areas suitable for permanent or temporary closures suitable for Norway lobster stocks;
• evaluate possible technical measures (mesh size or other selectivity measures, closed areas, gear size) to improve the exploitation pattern for Southern hake stock;
• define criteria to evaluate the performance of the different recovery strategies, including criteria for when the recovery target has been met.
Considering the short notice and time constraints the report produced by this sub-group is very extensive and well structured, and STECF commends the group for its work.
The group proposes a recovery plan containing the following elements:
1. An overall effort reduction scheme applied to all vessels which land hake and Nephrops in these areas. This should achieve an annual reduction in effort of 10% relative to the previous year.
2. The closure of selected Nephrops fishing grounds to all fishing.
13.1.2 Recovery targets. (Sect. 4)
13.1.2.1 Hake.

146
At present there are no defined or agreed reference points for the southern Hake as the previously established ones were rejected by the relevant ICES Working Group. Considering that absolute values of SSB (pawning stock biomass) were too uncertain, the SGMOS adopted a fishing mortality strategy for stock rebuilding. The target reference point chosen was F0.1.
13.1.2.2 Nephrops.
Since no biological reference points based on a stock-recruitment relationship have yet been established for any Nephrops stock, the group also chose the fishing mortality target strategy for the Nephrops stocks considered.
STECF agrees with SGMOS in defining and setting the targets of recovery for these stocks. STECF further points out, that in case of Nephrops a basis for setting the standard reference values for SSB (spawning stock biomass) Blim and Bpa has not been established yet due to lack of adequate recruitment data.
13.1.3 Current Management measures. (Sect. 5)
The TACs for both the Southern Hake and the Nephrops stocks considered have for many years been set at levels far above the catch levels proposed by ICES, and thus rendering even the possibility of a regulatory effect of these TACs very small. Since 1995 the actual (estimated) landings of Nephrops did not even reach the proposed TAC.
Apart from the common European fishing gear and minimum landing size regulations there are also numerous national regulatory measures in force. Among some of these there seem to be a mismatch between the MLS of Hake and the mesh size of 40 mm in trawls used in Gulf of Cadiz.
National closed areas and seasons mainly aiming at protecting juvenile hake are in force both in Portuguese and Spanish waters. During the evaluation of the SGMOS report STECF was notified by a member of a Portuguese regulation DR 63, Portaria 213/2001, March 15, on the establishment of an all year closed area (“Beirinha”) to gillnets and trammel nets, in the South of the Portuguese coast, in order to protect the adult hake (box H in attached new version of Fig. 3.3.1).
13.1.4 Management options and recovery plans. (Sect. 5)
Among the common tools available to manage fisheries the following were considered in the recovery plan: 1) catch controls (TACs), 2) effort controls, 3) closed areas/seasons and 4) gear regulations. The conclusion of the group was that an effort control scheme represents the best overall management scheme for the fisheries for Southern hake and Iberian Nephrops. As Nephrops is a sedentary species, closed areas for Nephrops fisheries could be an additional measure. However, due to the mixed fishery characteristics of the Nephrops fisheries and possible switching target species closed area measures would only be effective when closed to all major fisheries. Because of the mixed-species nature of both these fisheries the group finds little scope for additional fishing gear regulations.
STECF notes that the SGMOS has concluded that an effort control system represents the best overall measure for incorporation in a recovery plan for these stocks. It was however also noted that in case of small (artisanal) vessels effort control may be a problem.

147
13.1.5 Evaluation of recovery strategies. (Sects. 6 & 7)
The evaluation for Hake is based on simulations (‘medium term projections’) with selected scenarios applying an F-strategy, i.e. reduction of the current F (=0.39) to F0.1(=0.15). Two strategies were applied for such reduction in F: A decrease of 10% each year, and a parabolic decrease. The reduction of the Fs is combined with two levels of recruitment: Higher (1989-2002 average) and low (average of last 3 years).
The simulations indicate that the differences in recruitment have a high impact on the rebuilding of SSB, but the two F strategies do not differ significantly in the recovery time. With a high level of recruitment the stock will rebuild to the level in the beginning of the 1990s in 6-7 years, while in case of ‘low’ recruitment it will take 9 years.
The same strategy was also applied for Nephrops in SW and S Portuguese waters (FUs 28-29). However, due to lack of adequate knowledge on the dynamics of Nephrops stocks and the fact that males and females are assessed separately, the group has only considered the males and the results must therefore be viewed cautiously as basis for any further management measures. The simulations show that during a 10 years period the SSB would have increased only by some 30% and this suggests that further effort regulations would be necessary to ensure rebuilding of this Nephrops Stock.
The state of the other Nephrops stocks in consideration (FUs 25, 31, 26, 27) is worse and they have been classified as ‘collapsed’ by ICES (ACFM, June 2003), but SGMOS has not considered these stocks further in the report. Thus, the main element in the recovery plan for the southern hake as proposed by the SGMOS is a 10 % annual reduction in fishing mortality (relative to the previous year) over a 10 year’s period. The SGMOS also notes, that the success of the 10% annual effort reduction scheme will depend upon how it is applied. If it is not applied effectively, or if it is applied to inappropriate vessels, then recovery will be delayed.
For the Nephrops stocks the schemes for recovery are very vague, mainly because of insufficient knowledge. It is stated, that adopting the strategy of a 10% reduction in F probably is not sufficient for recovery within a reasonable period of time. Further reductions in F by e.g. closure of fishing grounds are recommended.
13.2 STECF COMMENTS AND CONCLUSIONS.
13.2.1 Hake.
STECF notes, that no new assessment data since the ICES WG (WGHMM) meeting in May 2003 were available to the SGMOS. The projections presented in this report, therefore, are thus based on the recent ICES assessment.
STECF further notes the problem of distinction of the ‘Southern Hake stock’ from the ‘Northern Hake stock’. As pointed out by ICES, there seems to be no clear biological basis for this stock separation. This problem may also influence the actual performance of not only any implemented recovery plan for the Southern stock, but also those proposed for the Northern Hake.
STECF agrees with the results for the Southern Hake presented in the report and recommends the suggested recovery plan as a step towards improvement of this the Southern Hake stock component.

148
13.2.2 Nephrops.
Also all of the Iberian Nephrops stocks have been assessed by ICES recently (WGNEPH in March 2003), and no new data were at disposal for SGMOS. STECF agrees with SGMOS that even defining recovery for these Nephrops stocks may be difficult due to the lack of knowledge of the dynamics of stocks of Nephrops. STECF further notes, that uncertainties of the current age based assessments of the Nephrops stocks probably would further add to the uncertainty of any medium term projection of the estimated cohorts.
It is not clearly stated in the report, why only one set of simulations (projections) have been included in the report, namely those for Nephrops males in Portuguese waters (FUs 28-29). But since this stock is one of the least depleted among the Iberian Nephrops stocks, STECF assumes that SGMOS tacitly has assumed that similar or even more severe even further measures than those recommended above would be necessary to rebuild the other stocks, e.g. zero TACs as suggested by the ICES Nephrops WG.
STECF agrees with SGMOS that with the present stock situation for the Iberian Nephrops stocks, the effort reduction scheme proposed for hake would be insufficient for rebuilding these Nephrops stocks. Taking into account the mixed nature of the fisheries, STECF also considers that total closure of half of the fishing grounds could be a way to implement a stronger reduction in fishing effort on (the sedentary) Nephrops, with lower impact on the fishery for the other species. However, STECF cannot on basis of the SGMOS report point out any specific measures to ensure recovery of these stocks other than the zero TACs suggested by the ICES Nephrops WG.
However, STECF cannot on basis of the SGMOS report point out any specific measures to ensure recovery of these stocks.
STECF in general agrees with the content and conclusions of the report and endorses the proposed recovery plans.