17-5-2012 vikram gupta kolkata · § over the last 10 years, the indian cement to gdp cagr factor...
TRANSCRIPT
Railway Interaction
17-5-2012Vikram GuptaKolkata
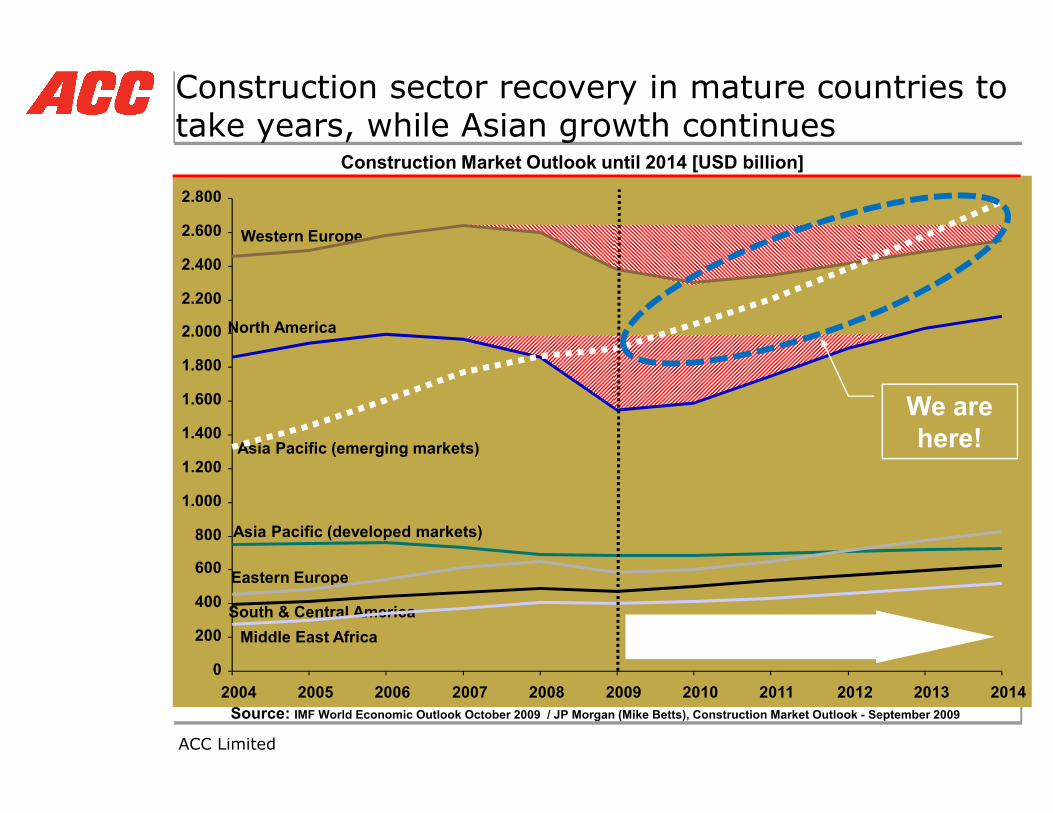
Construction Market Outlook until 2014 [USD billion]
Western Europe
North America
2.800
2.600
2.400
2.200
2.000
1.800
1.600
Construction sector recovery in mature countries to take years, while Asian growth continues
We are
ACC Limited
Source: IMF World Economic Outlook October 2009 / JP Morgan (Mike Betts), Construction Market Outlook - September 2009
Asia Pacific (developed markets)
Eastern Europe
South & Central America
Asia Pacific (emerging markets)
Middle East Africa
800
600
400
200
1.600
1.400
1.200
1.000
02004 2005 2006 2007 2008 2009 2010 2011 2012 2013 2014
Forecast
We are here!

55
110
165
220
275
330
400000
800000
1200000
1600000
2000000
2400000
Cement consumption may rise to 322 Mn Tons by 2014 from 193 Mn Tons in 2009Historic and forecasted real GDP (in Rs. Cr) and cement demand (Mt)
x 1.29
x1.20-1.29
305 Mt
322 Mt
193 Mt
Cement: 8.5% CAGR
GDP: 6.5% CAGR
Cement: 9.6 – 10.8% CAGR
GDP: 8.0% CAGR
ACC Limited
0
55
0
400000
2000
2001
2002
2003
2004
2005
2006
2007
2008
2009
2010
2011
2012
E
2013
E
2014
E
Real GDP (Rs Cr; 1993 prices) Real GDP (Rs Cr; 1993 prices) Cement demand (Mt)
Potential forecast low range (Mt) Potential forecast base range (Mt)
§ Over the last 10 years, the Indian cement to GDP CAGR factor was 1.29x.
§ Real GDP in India is expected to grow by a CAGR of 8.0 % until 2014 (Consensus forecast)
§ Assuming a 1.20x (low range) to 1.29x (base range) cement to GDP factor, cement demand could grow by a CAGR in the range of 9.6 to 10.8% over the five years.
Source: EIU, IMF, RBI, Govt. of India, CMA, ACC Analysis
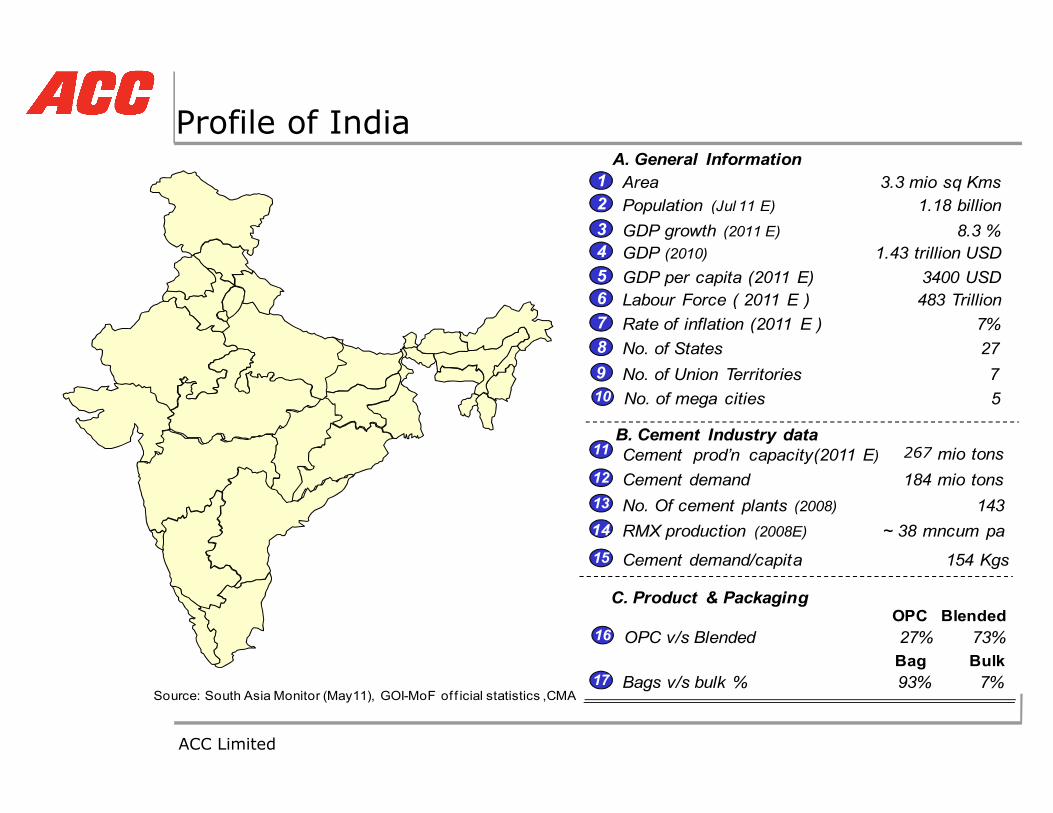
Profile of India
2 Population (Jul 11 E)
7 Rate of inflation (2011 E )
3 GDP growth (2011 E)
8 No. of States
1 Area
9 No. of Union Territories
A. General Information 3.3 mio sq Kms
1.18 billion
8.3 %
7%27
7
4 GDP (2010)5 GDP per capita (2011 E)
1.43 trillion USD3400 USD
10 No. of mega cities 5
6 Labour Force ( 2011 E ) 483 Trillion
ACC Limited
Cement demand/capita
OPC v/s Blended16
15
C. Product & Packaging
B. Cement Industry data
Bags v/s bulk %17
27%
93%
11 Cement prod’n capacity(2011 E) 240 mio tons
154 Kgs
12 Cement demand 184 mio tons13 No. Of cement plants (2008) 14314 RMX production (2008E) ~ 38 mncum pa
73%
7%BulkBag
BlendedOPC
Source: South Asia Monitor (May11), GOI-MoF of f icial statistics ,CMA
No. of mega cities 5
267

What’s our rank in world production?
v Top 50 manufacturers worldwide account for 60% of total cement production
v The Indian cement industry is the second largest in the world
Others17%
Cement production across nations
ACC Limited
China67%
India9%
US4%
Japan3%
17%
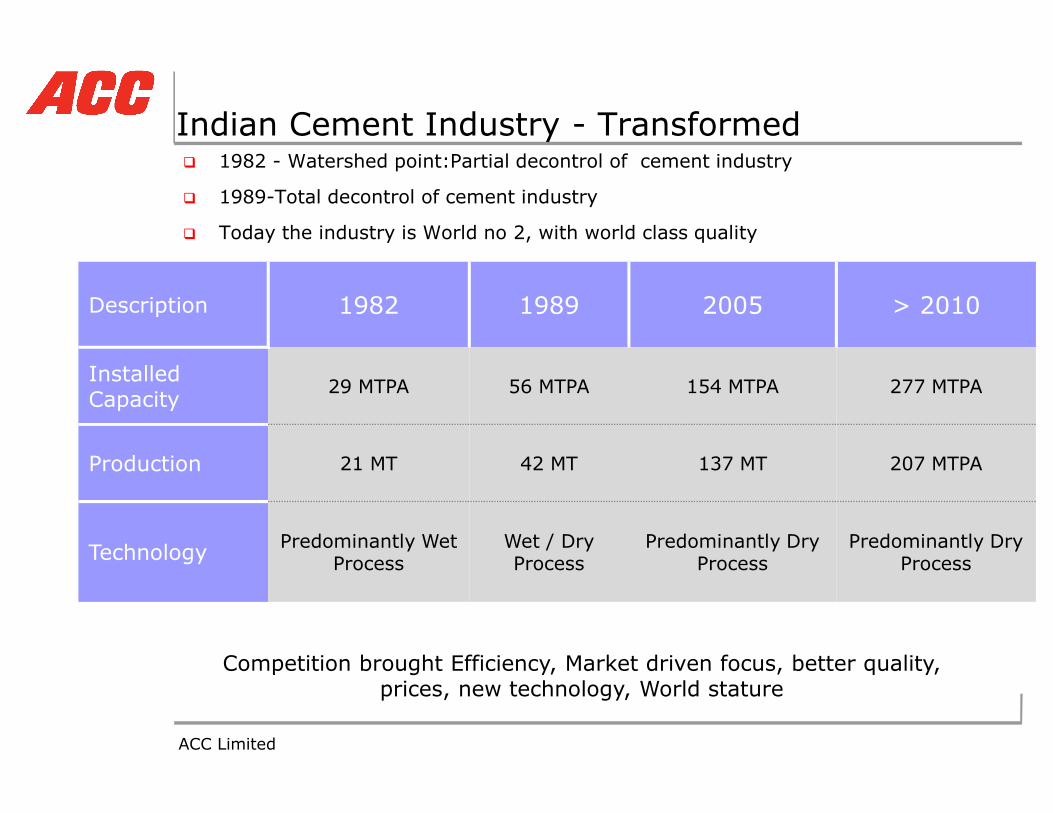
Indian Cement Industry - Transformedq 1982 - Watershed point:Partial decontrol of cement industry
q 1989-Total decontrol of cement industry
q Today the industry is World no 2, with world class quality
Description 1982 1989 2005 > 2010
Installed Capacity
29 MTPA 56 MTPA 154 MTPA 277 MTPA
ACC Limited
Competition brought Efficiency, Market driven focus, better quality, prices, new technology, World stature
Capacity
Production 21 MT 42 MT 137 MT 207 MTPA
Technology Predominantly Wet Process
Wet / Dry Process
Predominantly Dry Process
Predominantly Dry Process

Industry Cement Plant Locations
ACC Limited
Installed Capacity: 267 Million Ts
(as in 2010)

Expected all-India cement demand forecast
Cement demand – Historical and projected [mio t]
341312
286263
242224212193
+8.9%
+8.8%
x Y-o-y growthx CEM / capita [kg]
ACC Limited
212193
174160146
20162015201420132012201120102009200820072006
10.111.5 9.3 9.0 10.8 5.6 7.9 8.7 9.18.9
179134 144 153 166 186 201 218 255236
9.2
275

Excess capacity in some states will increase cross regional movement in 2011-2012
HP 6.0Rajasthan 6.0UP 1.2Uttaranchal 1.0Haryana 1.5Punjab 0.0MP 1.1
New Capacity
9
ACC Limited 20.12.09Setting the Context – Cairo Conference 2009
PAST FUTURE
TN 9.6AP 11.0Karnataka 8.8Maharashtra 3.3Kerala 0.0Gujarat 5.8
Chattisgarh 4.3Jharkand 2.0Orissa 3.8WB 2.7
New Capacity
New Capacity
New movements

[mio t]
96
8.2%
2015
123
106
2011
77
5540
6541
12.3%
2015
2011
Available supplyDemand
North Central East
Bathi
Ropar
Gagal
Cement demand in East region to grow fastest in the country
ACC Limited
Source: McKinsey Study 2011; CRISL, Market intelligence ACC & ACL, FP 2011-2015 ACC & ACL
10.2%
2015
195
157
2011
155
107 225
9.9%
2015
373
328
2011
291
51
Total India
South West
hinda
rPali
Wadi
Lakheri
Kymore
lTikaria
Bhatapara

East India: State-wise development[mio t, CAGR 2012-16]
59.6
11.2
19.2
55.9
10.6
17.0
50.9
15.0
46.7
13.4
43.1
12.1WB
+8.5%CAGR12-16
JHR 6.5
BH 7.3
WB 12.2
ACC Limited
5.1
6.0 6.3 6.7 7.1 7.2
8.3 9.2 10.2 11.3 11.6
5.44.74.54.3
2016
5.0
2015
10.6
2014
4.5
9.8
2013
9.1
2012
3.9
8.5
North East
OR
JHR
BH
CH
4.94.2
N-E 5.9
CH 4.8
OR 8.6

Plant footprintPlant footprint

GAGAL
TIKARIA
LAKHERI
SINDRI
DCW
Nationwide presence§ 16 cement plants -capacity of 30 million tonnes/annum
§ 21 sales units, 66 area offices
§ 50+ RMX plants§ 10,000 dealers
Subsidiaries
ACC – A Pan India Presence
13
17.05.2012
KYMORE
CHANDA
KUDITHINI
WADI
THONDEBHAVI
MADDUKARAI
BARGARH
JAMUL
CHAIBASA
DCW
ACC Integrated Plant
ACC Grinding Unit
AssociatesALCON (40%)Asian (45%)Shiva (<10%)
SubsidiariesBCCI (94.5%)Lucky Minmat (100%)
National Limestone(100%)
Encore (100%)
AMRL (100%)ACCCL (100%)
Cement manufacturing processCement manufacturing process

Cement manufacturing process
15
17.05.2012

16
17.05.2012

Lime stone mining, crushing & transportation
17
17.05.2012

Preparation of raw meal..
18
17.05.2012

Pyro processing…
19
17.05.2012

Cement grinding, packing and despatch
20
17.05.2012
Cement manufacturing process animation
21
17.05.2012

Thumb rules:
§ PPC cement
� 70% clinker� 25% fly ash� 5% gypsum
§ PSC cement
� 42% clinker� 53% GBFS� 5% gypsum
§ OPC cement
� 95% clinker� 5% gypsum
22
17.05.2012
1 t clinker 1.5 t raw meal
Raw meal made up of 95% lime stone, 5% additives (Bauxite, iron ore)
1 t clinker 15% coal

HOLCIM Value chain
Transactional
Ready-mixConcrete
Concrete
Direct Sales
Traders Traders
End-users
General Contractors
ChannelsTransformational
CementitiousMaterials
(cement,mineral
SupplyBasic Materials Processing
Housing
Demand
Appl
Applications andConstruction Fields
ACC Limited
Mortars
Asphalt
Concrete Products
Direct Sales
Traders
Wholesalers
Retailers
Traders
Wholesalers
Retailers
Civil Engineering
Masons
Self -builders
mineralcomponents)
Aggregates
(sand, gravel, stone, recycled aggregates)
Infrastructure
Commercial / IndustrialBuilding
l icat ions

Multi-storey, Commercial, Infrastructure fast growing segments IHB growing slowest; Mass Housing has wide variance in growth forecast
2007 market (MTPA)
2007 market (MTPA)
Percentage of cement in 2007 and 2011by Demand segment
Percentage of cement in 2007 and 2011by Demand segment
2011 market (MTPA)
Base-Upside
2011 market (MTPA)
Base-Upside
4-Yr CAGR forecast (%)Base-Upside
4-Yr CAGR forecast (%)Base-Upside
IHB
Mass housing
75 91-95 5%-6%
8 11-13 8%-13%
40
% of Total Market
110
100
90
80 • IHB
ACC share2ACC share2
23%
24
17.05.20121. Includes institutional cement – growth primarily from Commercial segment (Organized retail / IT / ITES) 2. ACC Share only in locations ACC operates – Avg ~18% from HVC templateSource: Demand Pool study; BP Study; HVC Template data; 10th and 11th Five year plans, Interviews with industry experts
Commer-cial1
Industrial
Infra-structure
Multi-storey
27 47-51
10 13-14 6%-7%
25 39-44 12%-15%
160 230-249 9%-11%
15 29-32 18%-21%
15%-17%
16 17
6 6
913
4740
5
80
70
60
50
40
20
10
0
• Infrastructure
• Industrial
• Commercial30
• Multistorey
• Mass housing
• IHB
2011 Base case (mtpa)
20
5
2007 (mtpa)
17
23%
15%
12%
16%
15%
13%

Cement logisticsCement logistics

VCX : Across the Value Chain
26
17.05.2012

Inbound logisticsInbound logistics

§ Coal-
� Linkage coal-SECL, MCL, ECL, � Market coal-CCL, SECL, MCL� Imported coal
§ Mineral Gypsum-
� Bhutan� Rajasthan� Thailand
Contd..
28
17.05.2012
� Thailand� Iran
§ Chemical Gypsum
� Tata Chemical Haldia� Paradip Phosphate
§ Marine gypsum from coastal areas
§ Lime stone
� Own mines� High grade limestone-purchased from market

Slag sources & availability in East
DM
0.15 / 0.80 IISCO - Burnpur
0.58 / 1.0 SAIL -Durgapur
2.0 / 3.0 TATA -Jamshedpur
0.1 / 0.1 Usha Martin
0.96 / 2.0 SAIL – Bokaro
0.04 / 0.04 Kalinga - Barbil
0.04 / 0.04 Electrosteel - Khardah
0.1 / 0.2 Tata Metallics - Kharagpur 0.75 / 1.5 SAIL -Rourkela
0.1 5/ 0.15 Jindal -CH
SD
9.45
16.9
0.22 / 0.22 Bhushan - Sambalpur
0.9 / 1.8 TATA - Saraikela
Capacity by state0.25/ 0.6 Electrosteel – Bokaro
29
ACC Limited
Grinding plant
Integrated plant Existing Steel plant
JL
1.54 / 2.2 SAIL - Bhilai
1.90 / 2.55 RINL - Vizag
0.16 / 0.16 Jaiswal Neco - Raipur
0.36 / 0.36 NINL - Duburi
0.1 5/ 0.15 Jindal -Raigarh
BG
JL
CH
New steel plant
AP
West Bengal
Jharkhand
Orissa
Chattisgarh
0 / 1.2 Posco0 / 1.1 Essar – Paradeep
0 / 0.9 Mittal – Keonjhar0 / 0.6 Jindal
0.9 / 0.9 Tata0.05 / 0.05 Visa0.2 / 0.2 Mesco -Kalinganagar
2011 2015
Expansion Steel plant
[Mio t/y]
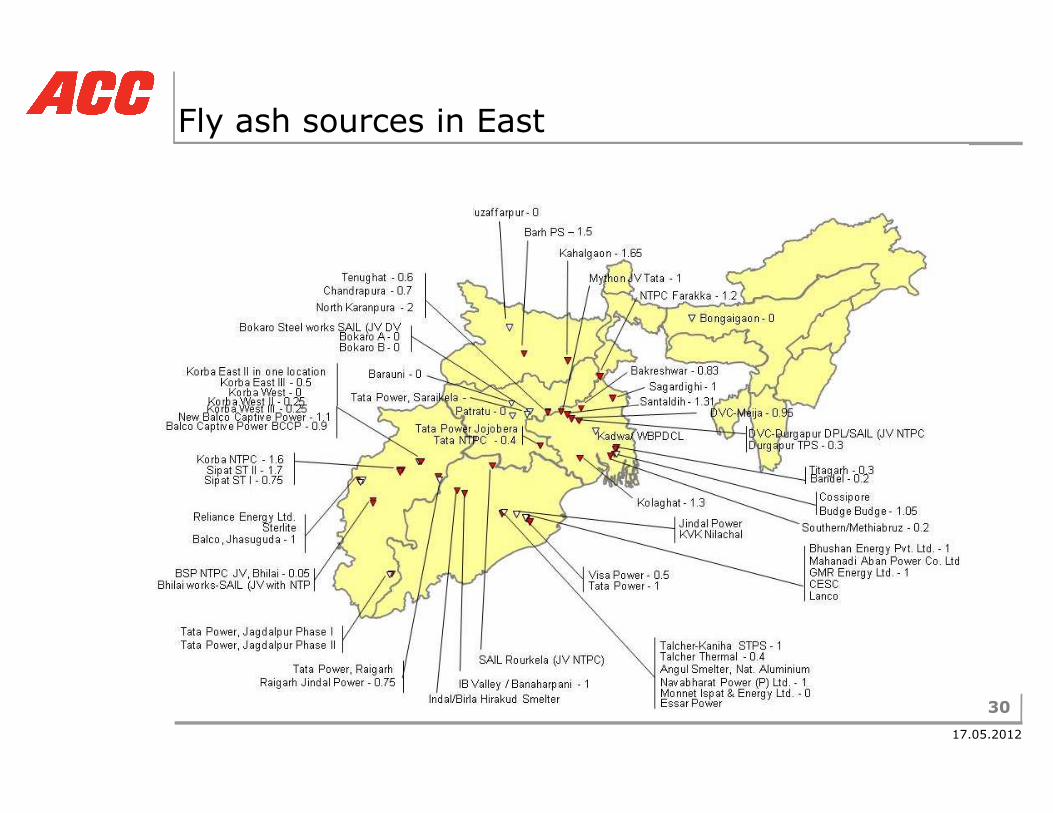
Fly ash sources in East
30
17.05.2012

Outbound logisticsOutbound logistics

Challenge in cement distribution - trend shifting to small lot size deliveries.
Production and
despatch capability/Economic lot size etc
Customer demand – lot
size considerations
32
17.05.2012
1990s
Free commodity
Lot size :Part truck load
> 2000
Free commodity
Lot size : “Nano” deliveries
1987
Partial decontrol
Lot size :Large Truck loads
1982
Controlled era
Lot size :Full rake
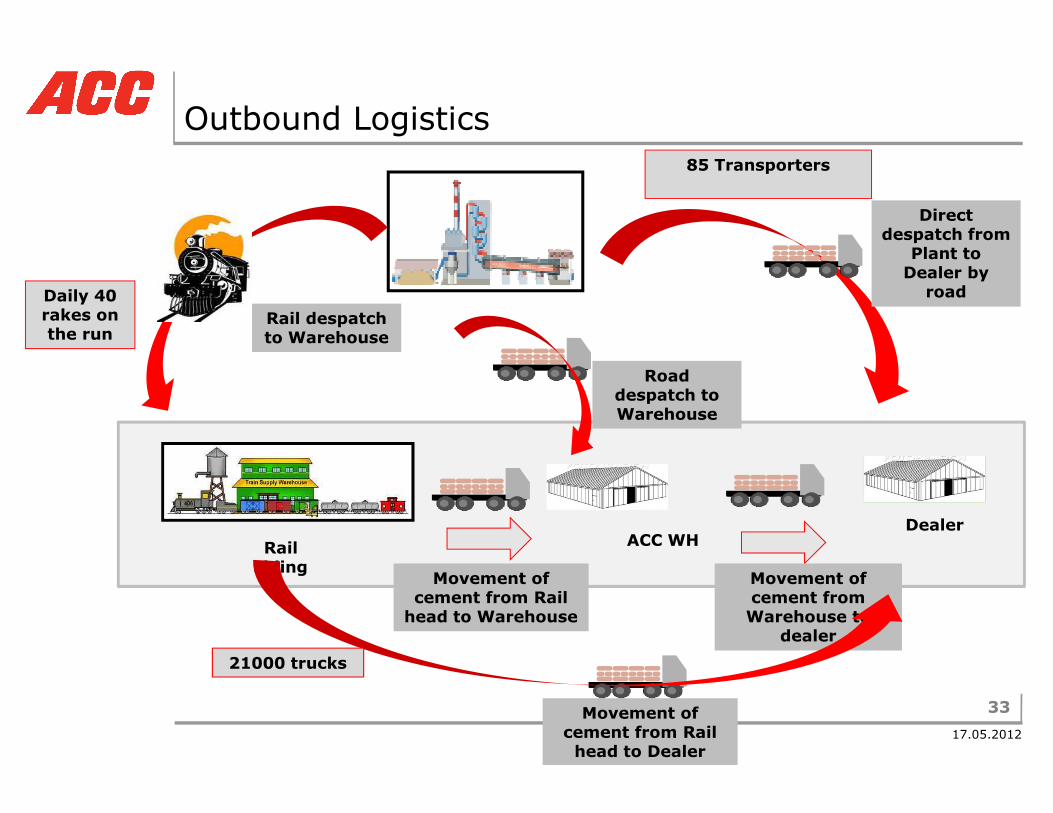
Outbound Logistics
Direct despatch from
Plant to Dealer by road
Rail despatchto Warehouse
Road despatch to Warehouse
Daily 40 rakes on the run
85 Transporters
33
17.05.2012
ACC WHRail siding
Dealer
Warehouse
Movement of cement from Rail head to Warehouse
Movement of cement from Warehouse to
dealer
Movement of cement from Rail head to Dealer
21000 trucks

Rail road coefficient:
35%
65% 66%
34%
2011 2012
34
17.05.2012
ACC Rail volume 9 lakhs MT /month ,108 lakhs MT/ month
Operating through 370 railheads all over the country
Outbound rail freight 58 Crores /month , 700 Crores /annum
Rail coefficient Road Coefficient
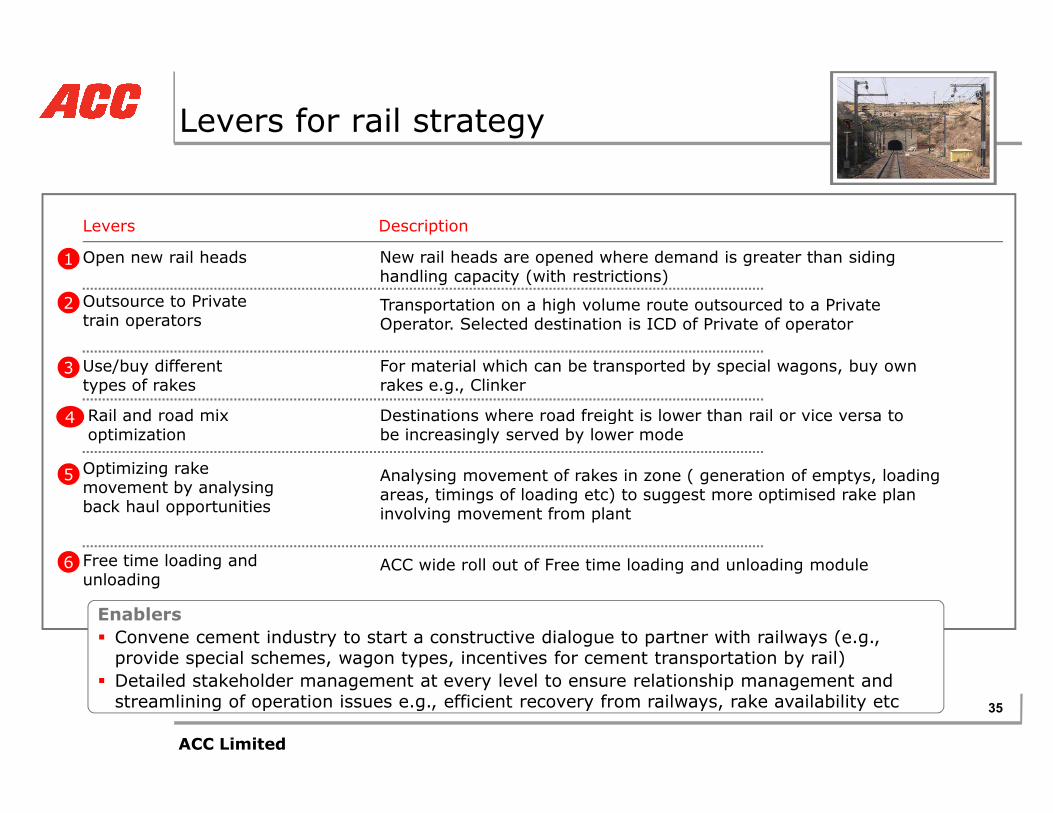
Levers for rail strategy
Description
2
Open new rail heads New rail heads are opened where demand is greater than siding handling capacity (with restrictions)
Transportation on a high volume route outsourced to a Private Operator. Selected destination is ICD of Private of operator
Outsource to Private train operators
1
Rail and road mix Destinations where road freight is lower than rail or vice versa to
Use/buy different types of rakes
For material which can be transported by special wagons, buy own rakes e.g., Clinker
Levers
3
ACC Limited
35
4 Rail and road mix optimization
Destinations where road freight is lower than rail or vice versa to be increasingly served by lower mode
Free time loading and unloading
ACC wide roll out of Free time loading and unloading module
5
Enablers§ Convene cement industry to start a constructive dialogue to partner with railways (e.g., provide special schemes, wagon types, incentives for cement transportation by rail)
§ Detailed stakeholder management at every level to ensure relationship management and streamlining of operation issues e.g., efficient recovery from railways, rake availability etc
Optimizing rake movement by analysing back haul opportunities
Analysing movement of rakes in zone ( generation of emptys, loading areas, timings of loading etc) to suggest more optimised rake plan involving movement from plant
6

1,082
491
1,761
34
0
7079 1,996
235
5
183
001,317235
Potential of third party logistics operators:Chanda- Turbhe to private operator has potential of saving ~ Rs 2 Cr
§ Container rakes to be used for transport of bagged cement subject to feasibility of loading 28MT per TEUAt unloading point,
Cost of transportation by Concor rakeRs/ ton
§ Total tonnage on route 1.4 lac tons
ACC Limited
36
1,916259103
1,198
0
223
TotalDam-ages
Second-ary Frt/ton
Warfage at des-tination
33
Handling charges
326
70
DC at des-tination
30
Frt/tonDC at source
§ At unloading point, container to be shifted to truck for transfer to warehouse or direct sale
§ Savings on account of reduced handling
Cost of transportation by IRrake
Rs/ ton
lac tons§ Savings/ ton Rs 155/ ton
§ Annual savings Rs 2.2 Cr

Projected Volume
Cement Production/ year Tons 1000
Clinker Volume Tons 451
Projected Volume with
own rake
Turn around time ( Own Clinker rake) Hrs 86
No. of trips in a year No. 100
Volume/ wagon Tons 66
Clinker Volume/rake Tons 3960
Total Volume/ Year Tons 396000
Freight per ton ( Chaibasa - Sindri ) Rs 389.7
Rebate per ton % 20§ IRR:
Buying a SPW rake, would lead to annualized savings of ~ Rs 2.5 Cr1
ACC Limited
37
Rebate per ton % 20
Savings/ ton Rs 77.9
Total Savings Rs Cr 3.1
Maintenance Cost
Maintenance cost Rs
5% of Undercarriage
cost with 5% escalation
Total maintenance cost Rs Cr 0.57
Investment Cost Cost of Rake Rs Cr 15
§ IRR: 14.36%
1: Analysis done for Chaibasa – Sindri route. To be followed by Jamul – Sindri, Damodar, Kharagpur
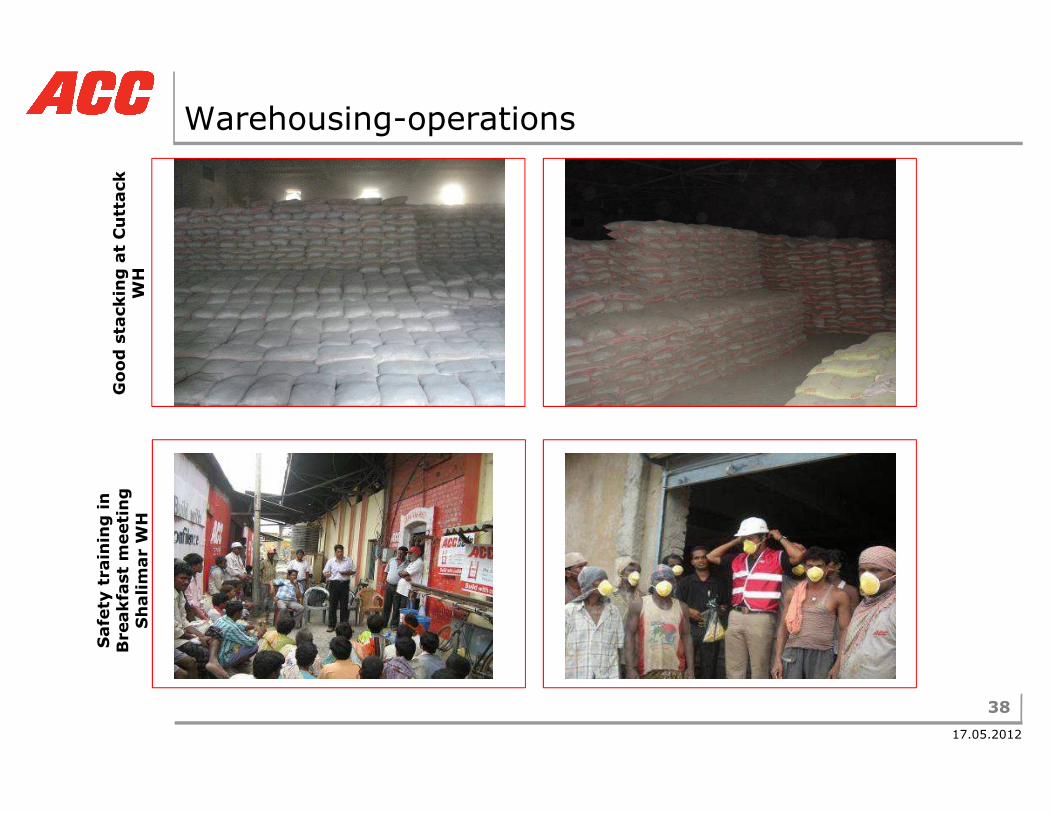
Warehousing-operationsGood stacking at Cuttack
WH
38
17.05.2012
Safety training in
Breakfast meeting
Shalimar WH

Our focus on reducing loading & unloading time
09-04-07/SSA/DJ
Our focus on reducing loading & unloading time
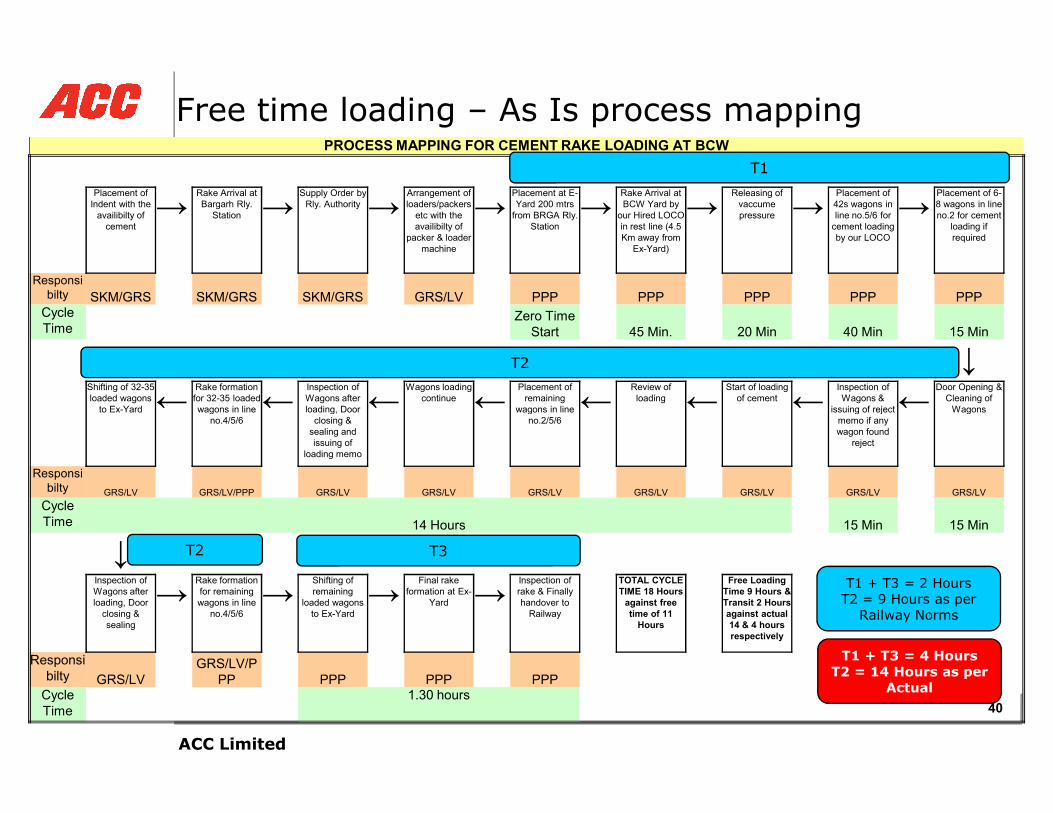
Free time loading – As Is process mappingPROCESS MAPPING FOR CEMENT RAKE LOADING AT BCW
Placement of Indent with the
availibilty of cement
→Rake Arrival at Bargarh Rly.
Station →Supply Order by
Rly. Authority →Arrangement of loaders/packers
etc with the availibilty of
packer & loader machine
→Placement at E-Yard 200 mtrs
from BRGA Rly. Station
→Rake Arrival at BCW Yard by
our Hired LOCO in rest line (4.5 Km away from
Ex-Yard)
→Releasing of
vaccume pressure →
Placement of 42s wagons in line no.5/6 for
cement loading by our LOCO
→Placement of 6-8 wagons in line no.2 for cement
loading if required
Responsibilty SKM/GRS SKM/GRS SKM/GRS GRS/LV PPP PPP PPP PPP PPP
Cycle Time
Zero Time Start 45 Min. 20 Min 40 Min 15 Min
↓Shifting of 32-35 loaded wagons
to Ex-Yard ←Rake formation for 32-35 loaded wagons in line ←
Inspection of Wagons after loading, Door ←
Wagons loading continue ←
Placement of remaining
wagons in line ←Review of
loading ←Start of loading
of cement ←Inspection of Wagons &
issuing of reject ←Door Opening &
Cleaning of Wagons
T1
T2
ACC Limited
40
to Ex-Yard ← wagons in line no.4/5/6
← loading, Door closing &
sealing and issuing of
loading memo
← ← wagons in line no.2/5/6
← ← ← issuing of reject memo if any wagon found
reject
← Wagons
Responsibilty GRS/LV GRS/LV/PPP GRS/LV GRS/LV GRS/LV GRS/LV GRS/LV GRS/LV GRS/LV
Cycle Time 14 Hours 15 Min 15 Min
↓Inspection of Wagons after loading, Door
closing & sealing
→Rake formation for remaining wagons in line
no.4/5/6→
Shifting of remaining
loaded wagons to Ex-Yard
→Final rake
formation at Ex-Yard →
Inspection of rake & Finally handover to
Railway
TOTAL CYCLE TIME 18 Hours against free time of 11 Hours
Free Loading Time 9 Hours & Transit 2 Hours against actual 14 & 4 hours respectively
Responsibilty GRS/LV
GRS/LV/PPP PPP PPP PPP
Cycle Time
1.30 hours
T2 T3
T1 + T3 = 2 HoursT2 = 9 Hours as per
Railway Norms
T1 + T3 = 4 HoursT2 = 14 Hours as per
Actual
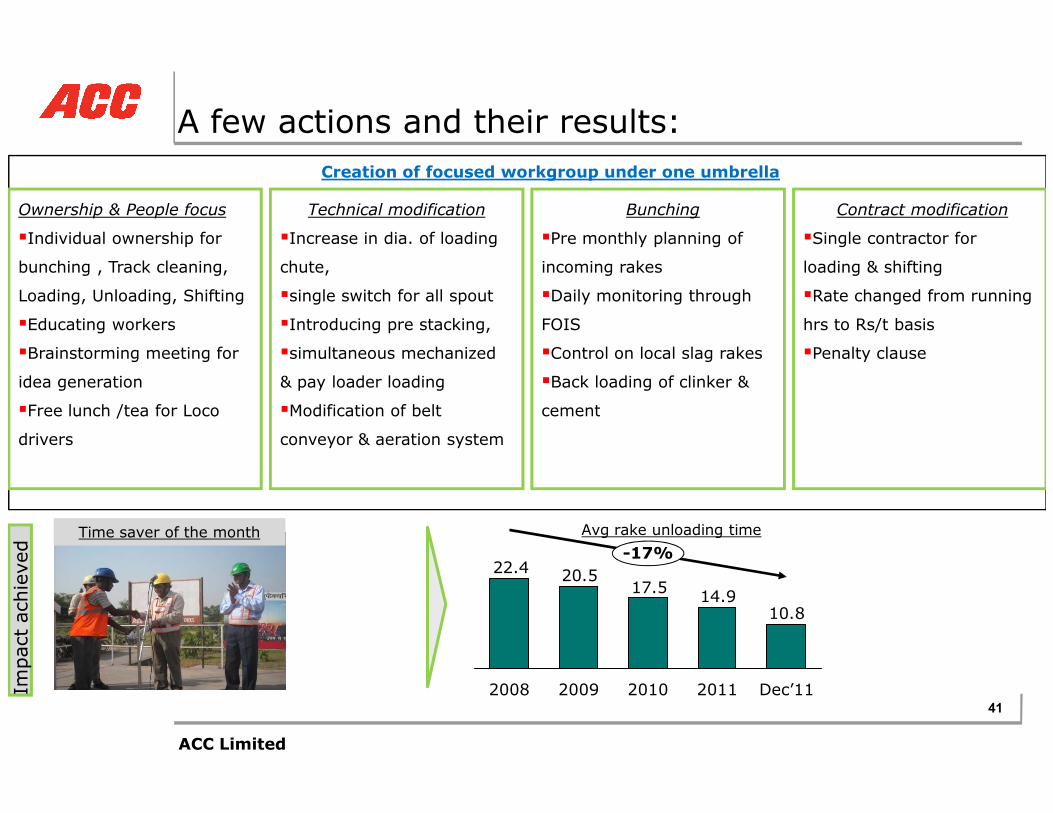
A few actions and their results:
High haulage time for rake
High Loading & Unloading time
Bunching
Unavailability of equipment
Unavailability of space
Workman unavailability
Delay in shifting
Unloading Space constraint
Maintenance
No of equipment low
Shift change/lunch/ tea break
Frequent absenteeism
Spout sizeCoal rakes Loco capacity
No. of shuntingSlag rakes Packer problem
Demurra
ge
Demurra
ge
Creation of focused workgroup under one umbrella
Ownership & People focus
§Individual ownership for
bunching , Track cleaning,
Loading, Unloading, Shifting
§Educating workers
§Brainstorming meeting for
idea generation
§Free lunch /tea for Loco
Contract modification
§Single contractor for
loading & shifting
§Rate changed from running
hrs to Rs/t basis
§Penalty clause
Technical modification
§Increase in dia. of loading
chute,
§single switch for all spout
§Introducing pre stacking,
§simultaneous mechanized
& pay loader loading
§Modification of belt
Bunching
§Pre monthly planning of
incoming rakes
§Daily monitoring through
FOIS
§Control on local slag rakes
§Back loading of clinker &
cement
ACC Limited
41
§Free lunch /tea for Loco
drivers
§Modification of belt
conveyor & aeration system
cement
Impact achieved
10.814.917.5
20.522.4-17%
Dec’112011201020092008
Avg rake unloading timeTime saver of the month

Zone coordinator concept to reduce transit time & increase direct despatch from railhead
Bihar
JharkhandWest
North East
Interchange point:
Jharsuguda,
Bondamunda
Susil Kr.Joshi
Interchange point:
Nimpura
Tapas Mukherjee
Interchange point:
Andal ,Asansol
Sandip Roy
42
17.05.2012
Jharkhand
Odissa
West Bengal
ChhattisgarhDaily tracking mechanism
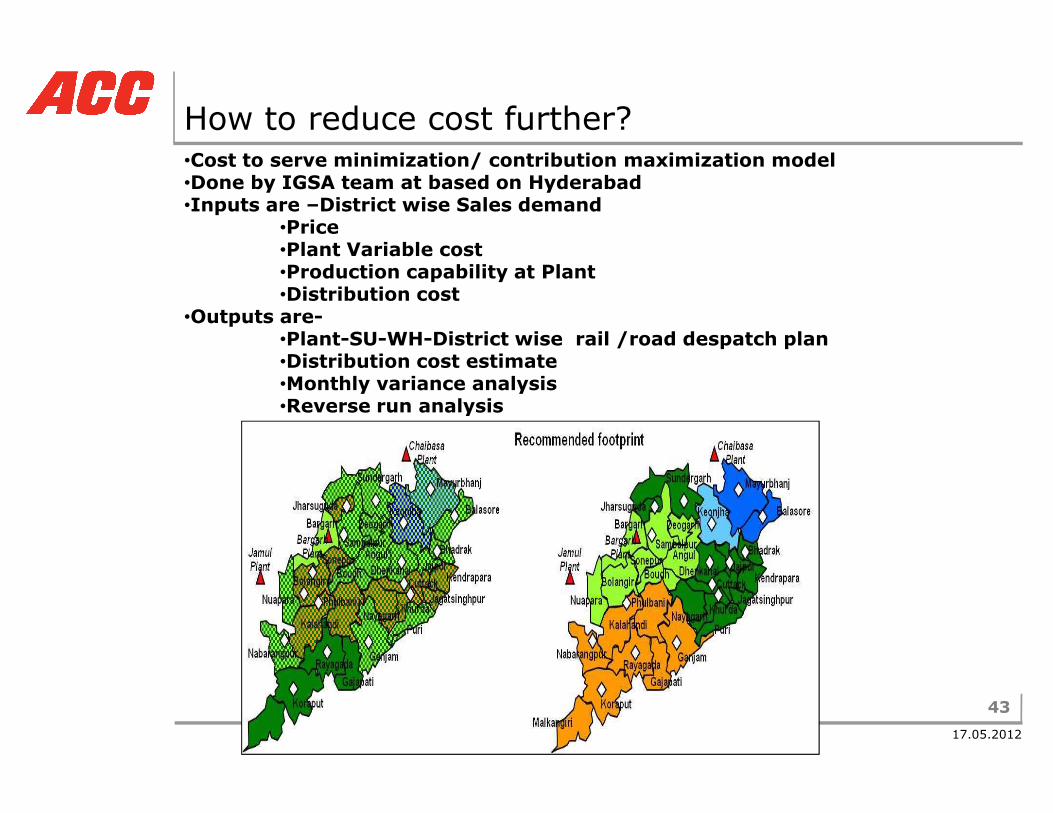
How to reduce cost further?•Cost to serve minimization/ contribution maximization model•Done by IGSA team at based on Hyderabad•Inputs are –District wise Sales demand
•Price•Plant Variable cost•Production capability at Plant•Distribution cost
•Outputs are-•Plant-SU-WH-District wise rail /road despatch plan•Distribution cost estimate•Monthly variance analysis•Reverse run analysis
43
17.05.2012
•Reverse run analysis
Bihar
Jharkhand West Bengal
North East
ChhattisgarhIntegrated nitGrinding Unit
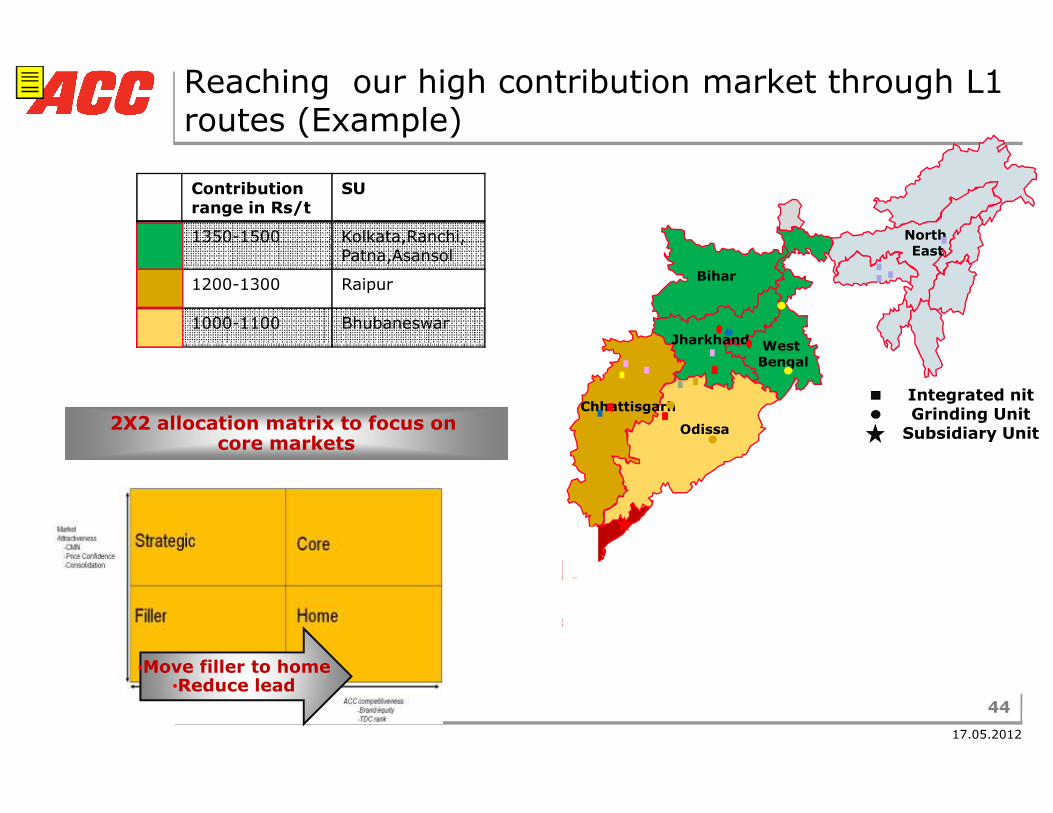
Contribution range in Rs/t
SU
1350-1500 Kolkata,Ranchi,Patna,Asansol
1200-1300 Raipur
1000-1100 Bhubaneswar
Reaching our high contribution market through L1 routes (Example)
44
17.05.2012
Odissa
Chhattisgarh Grinding UnitSubsidiary Unit2X2 allocation matrix to focus on
core markets
•Move filler to home•Reduce lead

Our concern for stakeholders
17.05.2012
Our concern for stakeholders

Various activities are undertaken to engage with logistics stakeholders
Eye camp for drivers in progress at Jamul Cement Works
Rest shelter for drivers at Chaibasa Cement
works
46
17.05.201217.05.2012
Drivers Training by Professionals :Damodhar

Sustainability
17.05.2012
Sustainability

17.05.2012
Launch of Institutionalizing Excellence
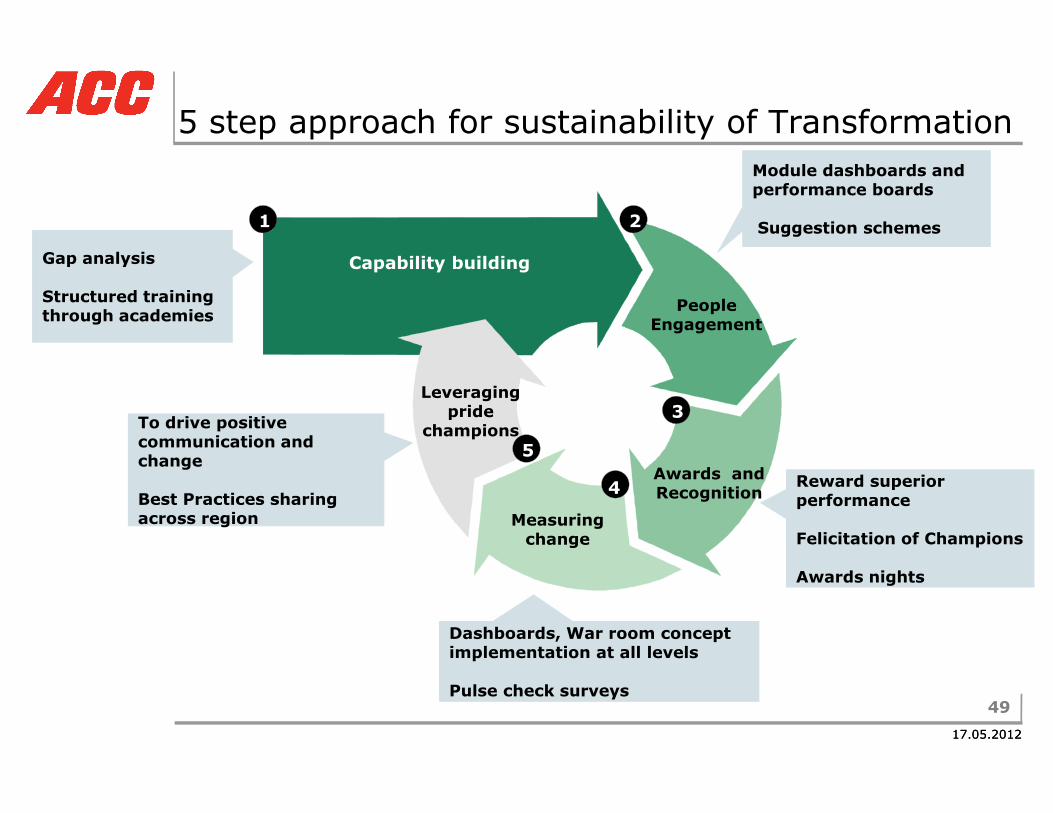
5 step approach for sustainability of Transformation
Gap analysis
Structured training through academies
Module dashboards and performance boards
Suggestion schemes
Capability building
People Engagement
Leveraging pride
1 2
3
49
17.05.201217.05.2012
Reward superior performance
Felicitation of Champions
Awards nights
Dashboards, War room conceptimplementation at all levels
Pulse check surveys
To drive positive communication and change
Best Practices sharing across region
Awards and Recognition
Measuring change
pride champions
3
4
5
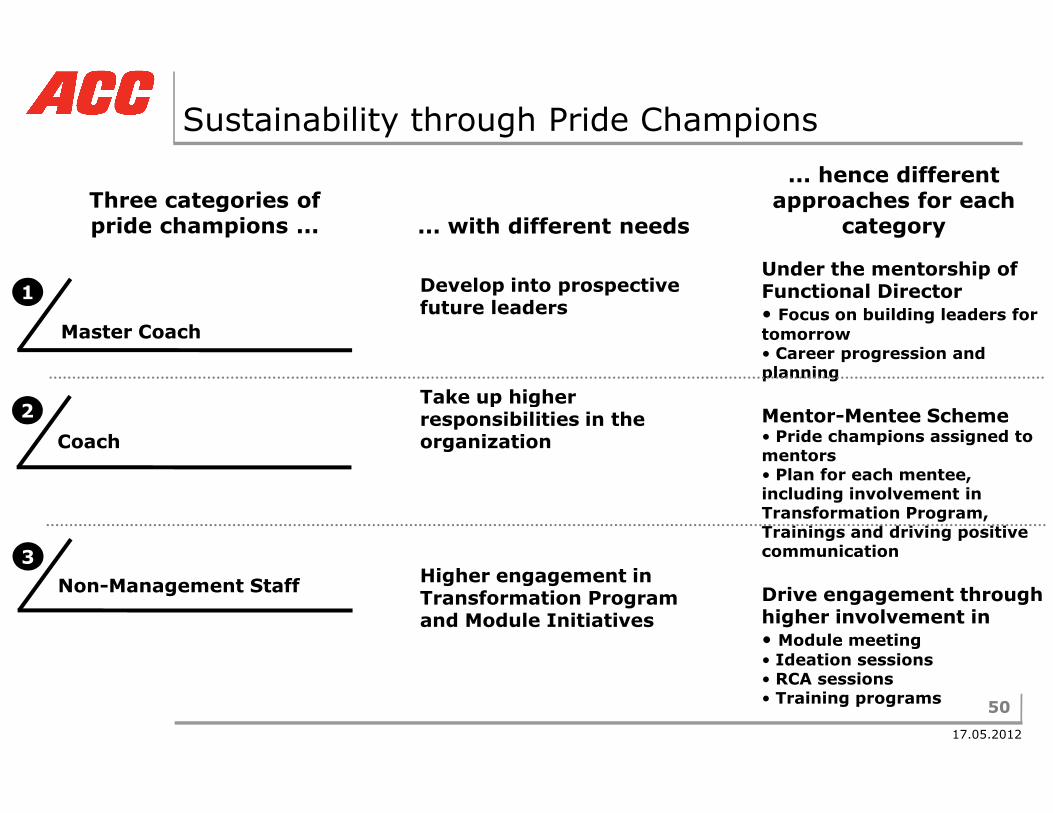
Sustainability through Pride Champions
Master Coach
Three categories of pride champions ...Three categories of pride champions ... ... with different needs... with different needs
Develop into prospective future leaders
Take up higher
... hence different approaches for each
category
... hence different approaches for each
category
Under the mentorship of Functional Director• Focus on building leaders for tomorrow• Career progression and planning
Mentor-Mentee Scheme
1
2
50
17.05.2012
Coach
Non-Management Staff
Take up higher responsibilities in the organization
Higher engagement in Transformation Program and Module Initiatives
Mentor-Mentee Scheme• Pride champions assigned to mentors• Plan for each mentee, including involvement in Transformation Program, Trainings and driving positive communication
Drive engagement through higher involvement in • Module meeting• Ideation sessions• RCA sessions• Training programs
2
3

Grinding§ Topic-wise centres of Excellence
�One team per major concept
Mining
A virtual centre of excellence structure to drive and support continuous improvement program
Clinkering
Engagement
§ Regional coordination of centre of excellence
� Sharing of “Best Practices”
51
17.05.2012
concept�Each team comprises of members from all plants
§ Implementation teams
�One team per plant� Includes plant members for each topic
�Each team sponsored by plant manager in respective plant
Jamul Chaibasa Sindri
Bargarh Damodhar
Packing & logistics Power plantSafety Maintenance
Procurement
Jamul Regional officeBargarh Chaibasa Sindri Damodhar

Academies & workshops conducted regularly for a highly motivated and capable force Engaging pride builders across the region for leading the transformation journey
“Creating a Winning Culture” Project 30 30 academy at Kolkata
What’s the Story?• Academies conducted forkey members from salesunits & coaches on 30:30tools and programs
• Mindset & Behaviour (M& B) workshop conductedwith SU Heads and 3 SUteams
52
17.05.201217.05.2012
“Creating a Winning Culture” workshop conducted at SUs
An inspirational moment at the coaches academy
Project 30 30 academy at Kolkata
Let the learnings roll…
• Pricing academy andLarge buyer academyplanned in Feb ’12• M & B sessionsplanned for all SUteams for “Creating aWinning Culture”

Pilot approach
Knowledge Sharing Platform
Sustainability through constant capability building
§ Centre of excellence§ Quarterly VCX academies§ Innovate to excel platform
§ Cross functional working group for pilotprojects & recognition scheme:§ Nano delivery, STO reduction,Demurrage reduction
53
17.05.2012
Platform
Focused training
§ Subject matter trainings organized byRITES, IIM s, CII & seminars§ In house training program on Business &financial acumen, Negotiation skills etc.
Emerging trends and way forward
17.05.2012
Emerging trends and way forward
§ Split location plants using the hub and spoke model is being increasingly adopted.
§ Ideal clinkering capacity will be 3.5 mio tonnes.
§ There is a marked movement towards consumption of bulk cement. Increasingly bulk cement will be transported.
Going forward…
55
17.05.2012
cement will be transported.
§ There will be more cement handling/packing units in the markets or close to the MIC sources
§ Last mile will be increasingly handled by road.
Going forward…
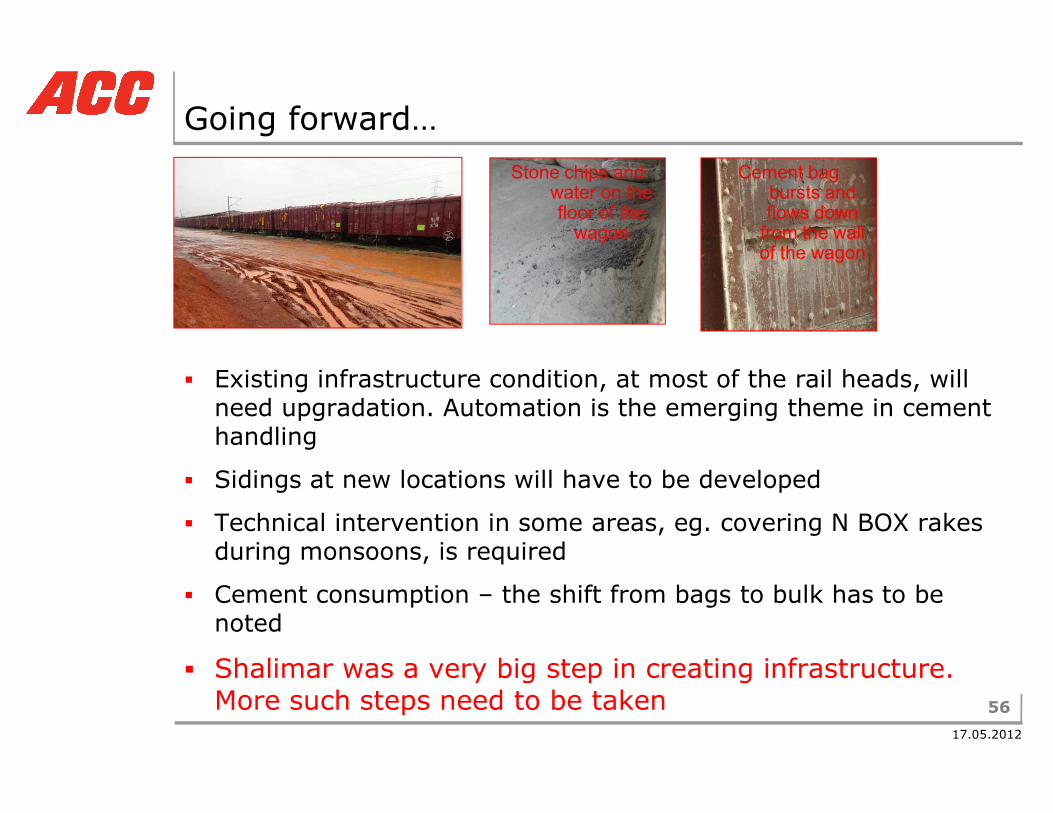
§ Existing infrastructure condition, at most of the rail heads, will need upgradation. Automation is the emerging theme in cement
Cement bag bursts and flows down
from the wall of the wagon
Stone chips and water on the floor of the
wagon
56
17.05.2012
need upgradation. Automation is the emerging theme in cement handling
§ Sidings at new locations will have to be developed
§ Technical intervention in some areas, eg. covering N BOX rakes during monsoons, is required
§ Cement consumption – the shift from bags to bulk has to be noted
§ Shalimar was a very big step in creating infrastructure. More such steps need to be taken
§ ACC will be investing in greenfield unit in West Bengal
§ ACC will increase capacity at its Sindri unit. Clinker will go from Chaibasa
§ ACC is increasing clinkering capacity at Jamul
ACC’s expansion plans in the East.
57
17.05.2012
§ After Jamul, ACC will start working on more clinkering capacity in Chattisgarh.
58
17.05.2012