16th annual ucla lake arrowhead symposium on the transportation- land use-environment connection....
TRANSCRIPT

16th annual UCLA Lake Arrowhead Symposium on the Transportation- Land Use-Environment Connection.
Axel FriedrichUmweltbundesamt (UBA)
Germany
WHAT IN THE WORLD? TRANSPORTATION ENERGY AND
GREENHOUSE GAS EMISSION PLANNING OUTSIDE OF THE U.S.
Europe
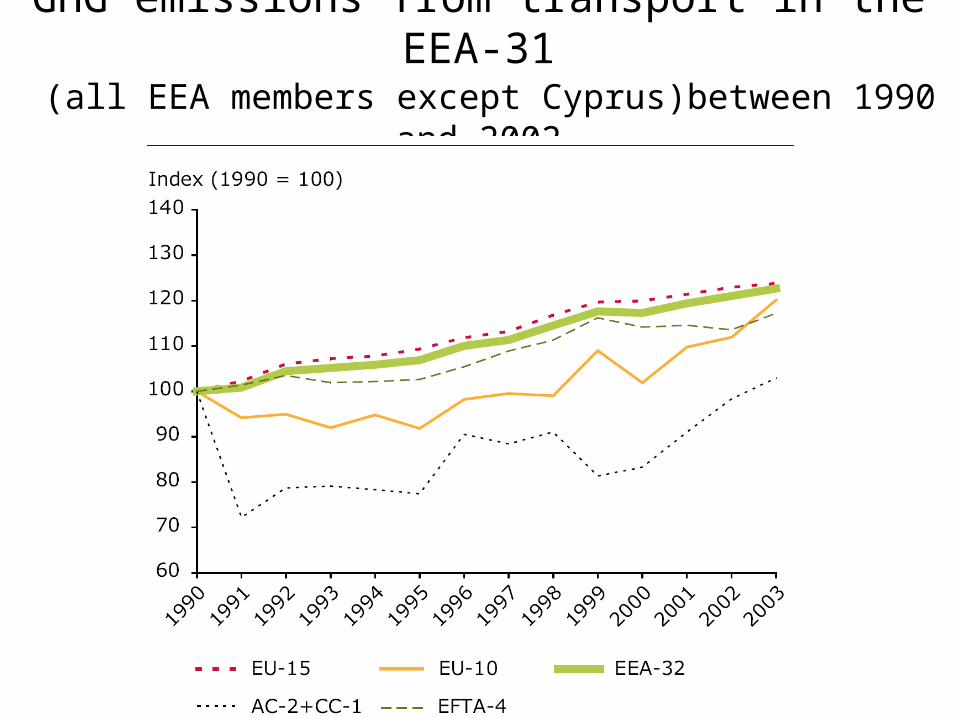
GHG emissions from transport in the EEA-31 (all EEA members except Cyprus)between 1990 and 2002
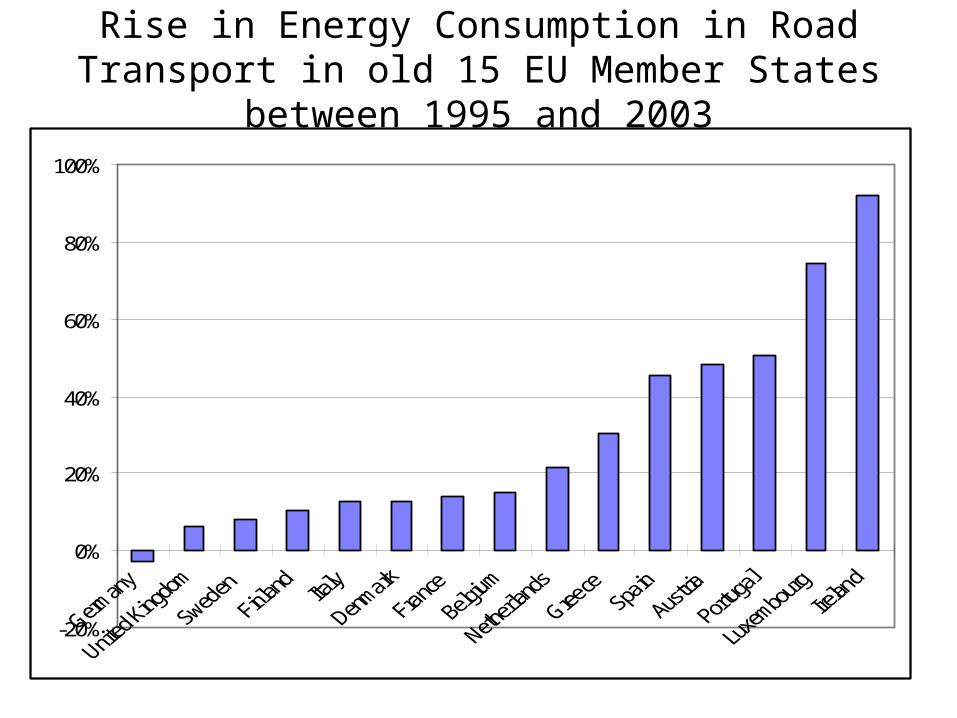
Rise in Energy Consumption in Road Transport in old 15 EU Member States between 1995 and 2003
-20%
0%
20%
40%
60%
80%
100%

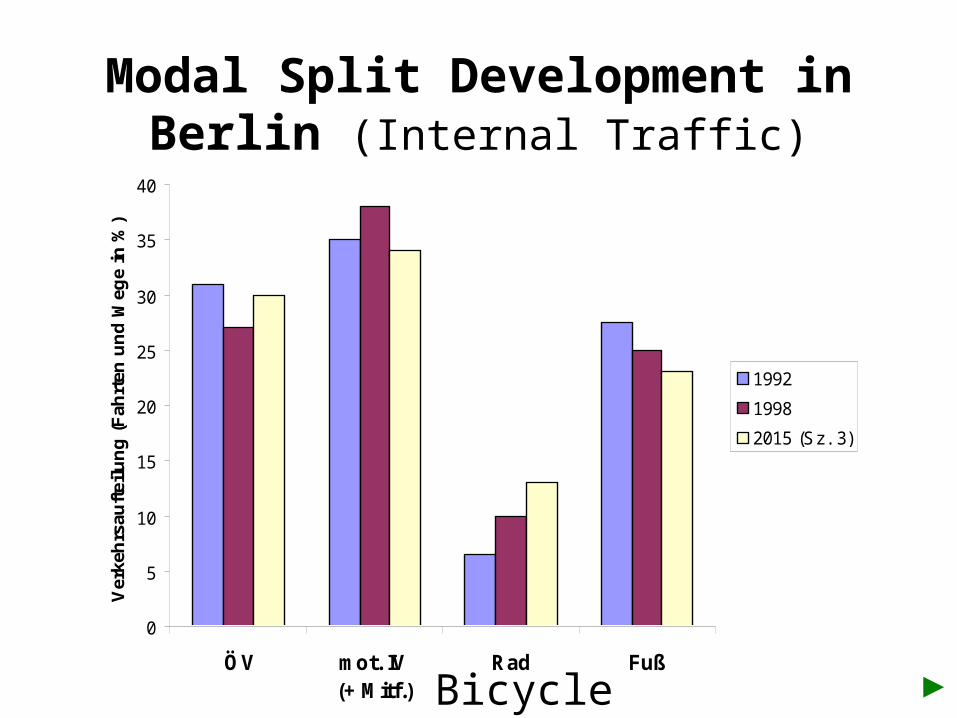
Entwicklung des Modal Split in Berlin (Binnenverkehr)
0
5
10
15
20
25
30
35
40
ÖV mot. IV (+ Mitf.)
Rad Fuß
Ver
keh
rsau
ftei
lun
g (
Fah
rten
un
d W
ege
in %
)
1992
1998
2015 (Sz. 3)
Modal Split Development in Berlin (Internal Traffic)
Bicycle

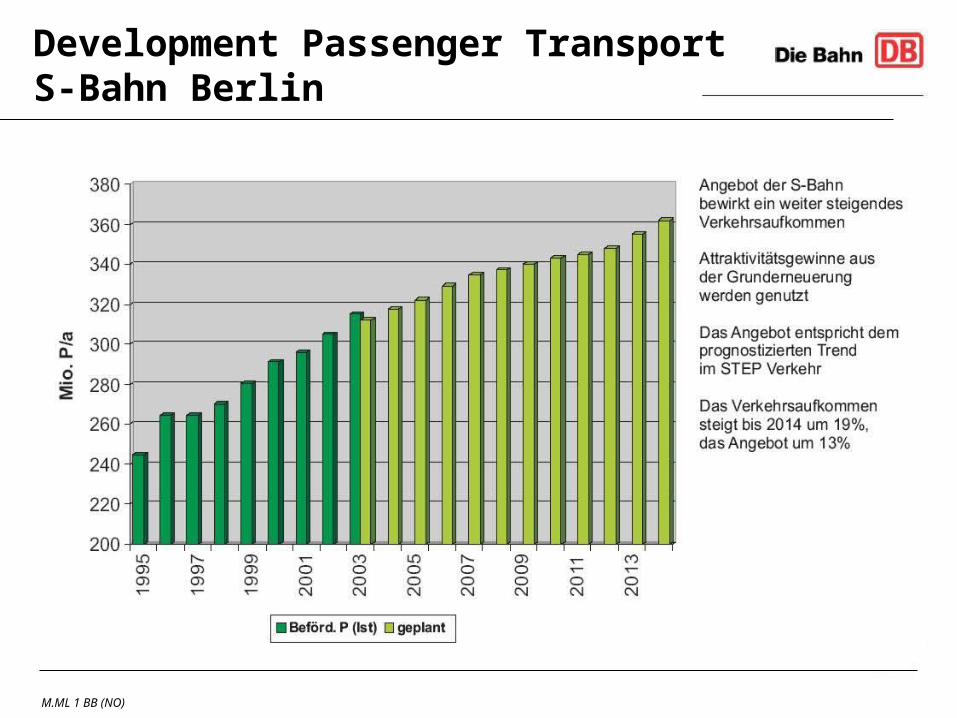
Development Passenger TransportS-Bahn Berlin
M.ML 1 BB (NO)
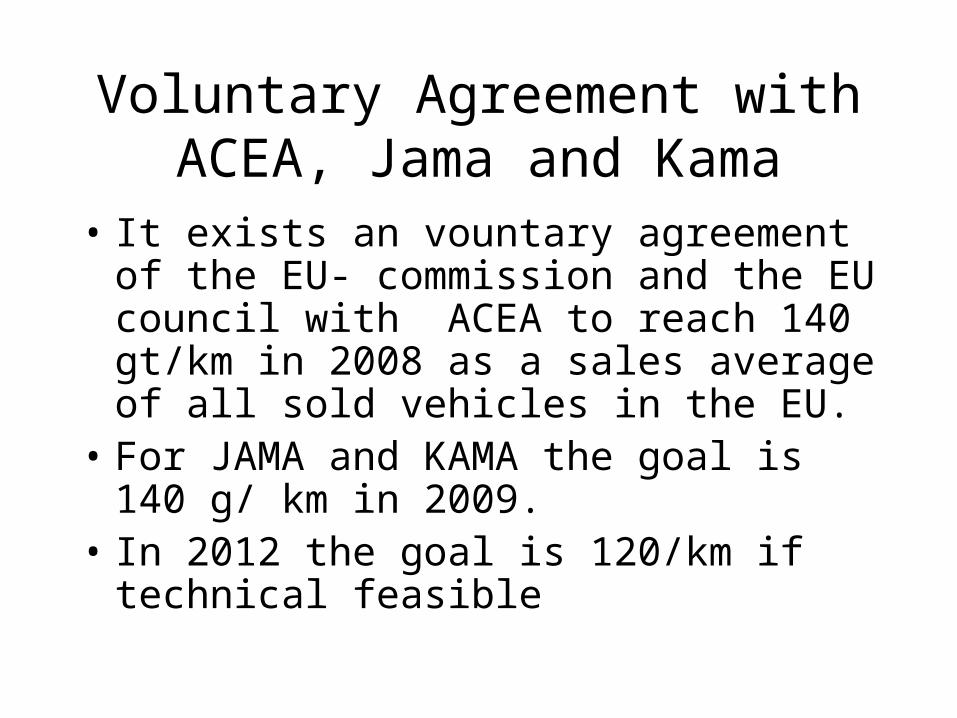
Voluntary Agreement with ACEA, Jama and Kama
• It exists an vountary agreement of the EU- commission and the EU council with ACEA to reach 140 gt/km in 2008 as a sales average of all sold vehicles in the EU.
• For JAMA and KAMA the goal is 140 g/ km in 2009.
• In 2012 the goal is 120/km if technical feasible
100
110
120
130
140
150
160
170
180
190
200
CO
2 (
g/k
m)
Petrol
Diesel
All fuels
Objectives
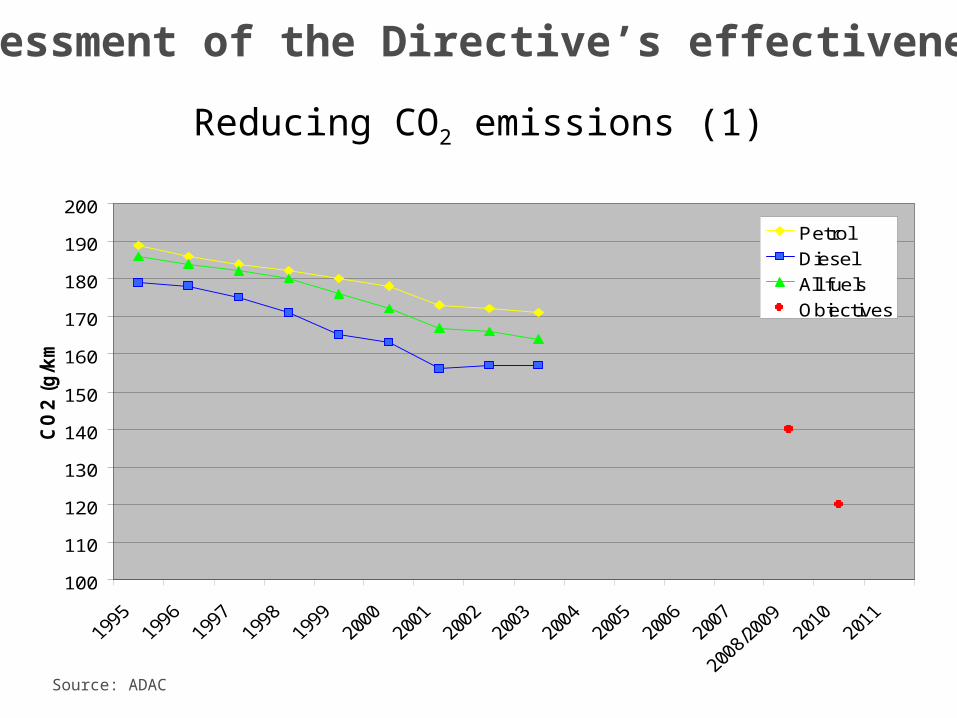
Reducing CO2 emissions (1)
Assessment of the Directive’s effectiveness
Source: ADAC
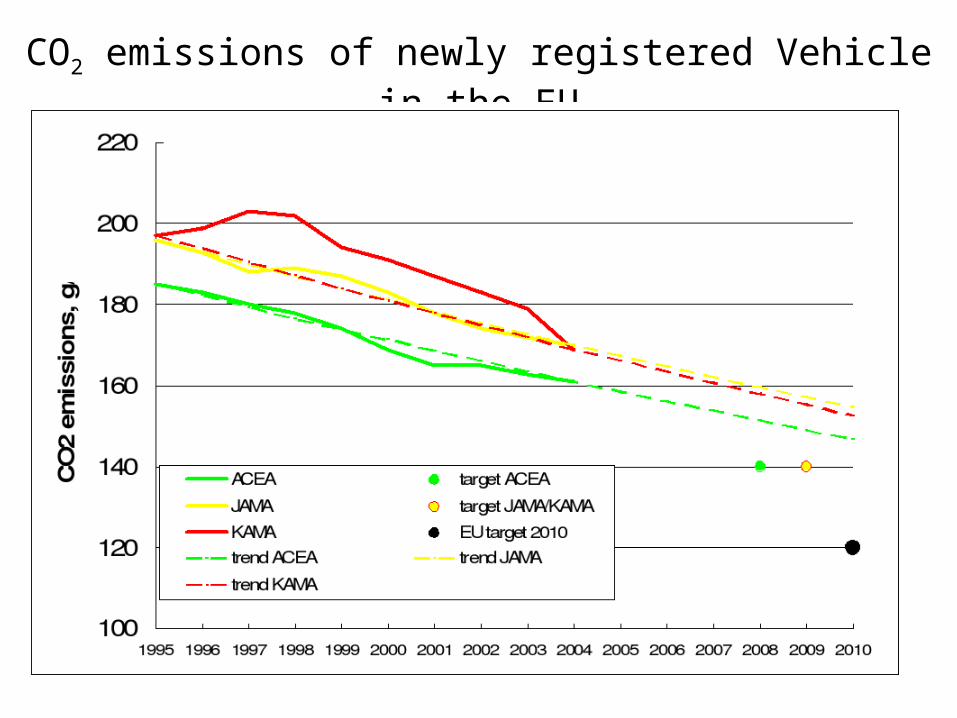
CO2 emissions of newly registered Vehicle in the EU
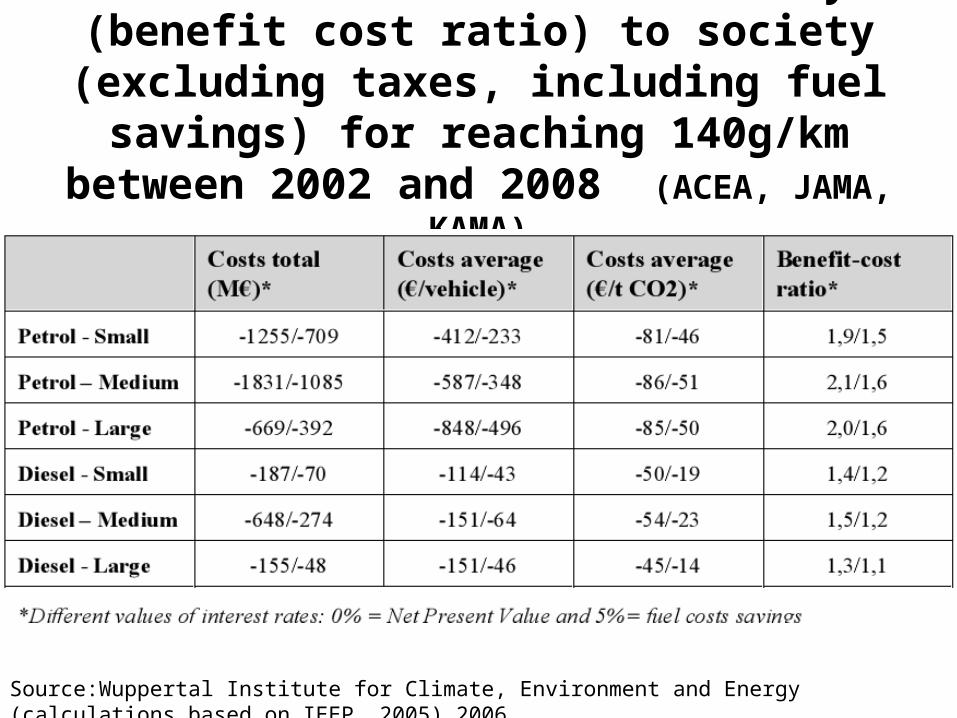
Net-costs and cost efficiency (benefit cost ratio) to society (excluding taxes, including fuel savings) for reaching 140g/km between
2002 and 2008 (ACEA, JAMA, KAMA)
Source:Wuppertal Institute for Climate, Environment and Energy (calculations based on IEEP, 2005) 2006
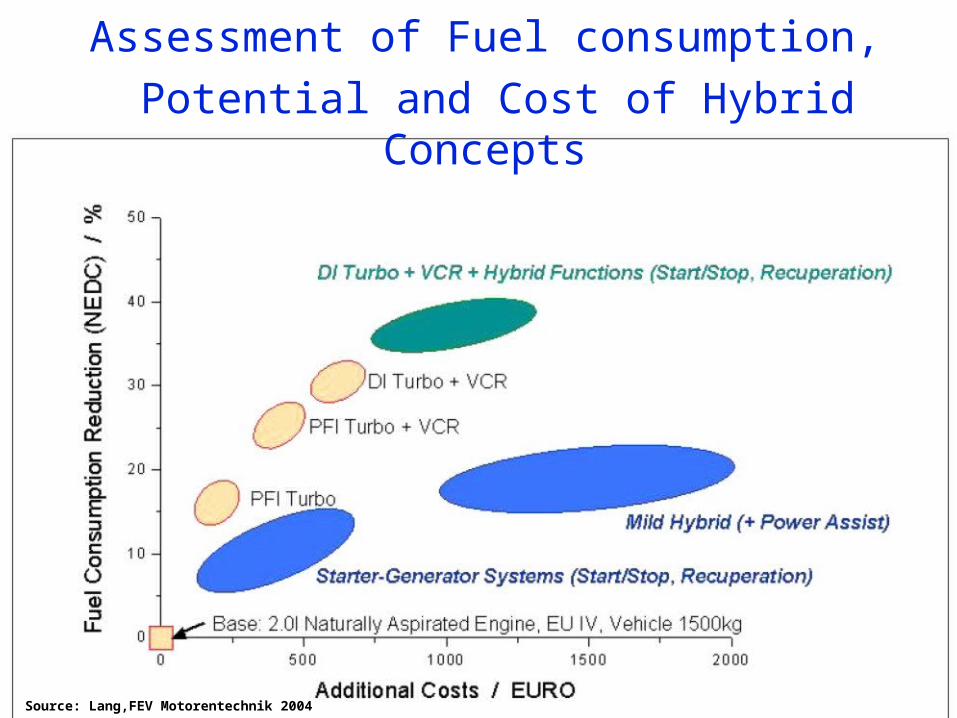
Source: Lang,FEV Motorentechnik 2004
Assessment of Fuel consumption,
Potential and Cost of Hybrid Concepts
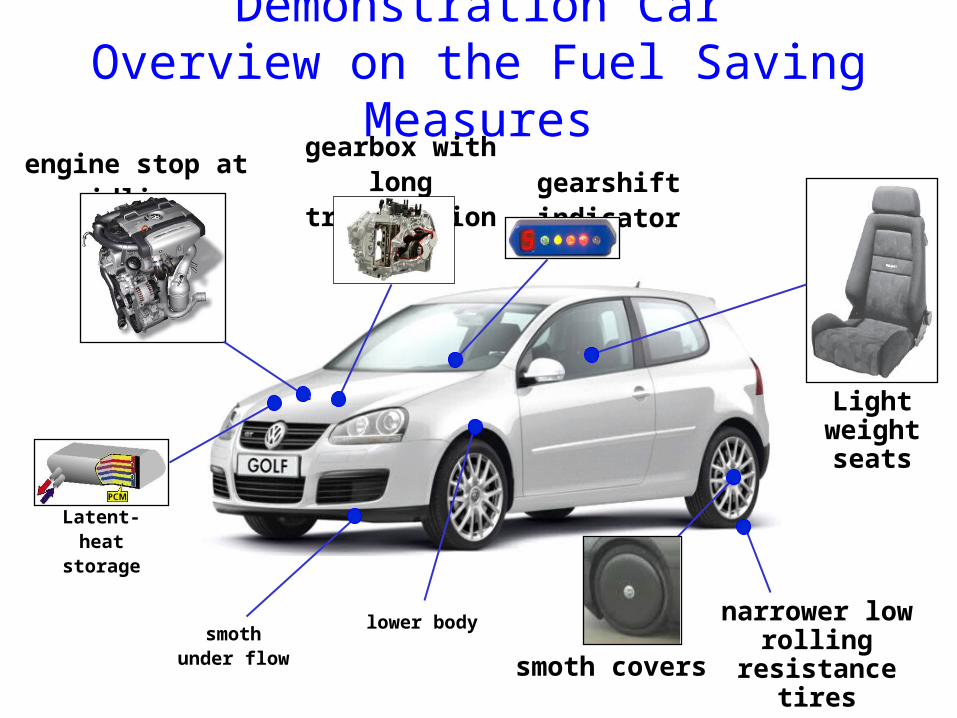
Demonstration CarOverview on the Fuel Saving Measures
gearbox with long transmission
narrower low rolling
resistance tiressmoth coverssmoth under
flow
lower body
engine stop at idling
gearshift indicator
Latent- heat storage
Light weight seats
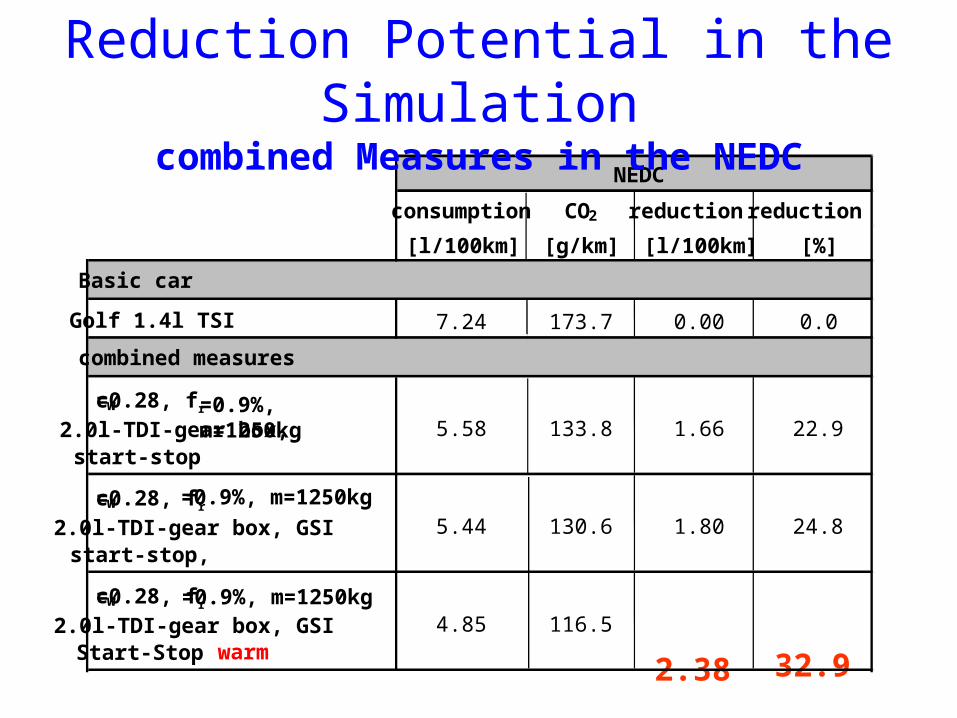
consumption CO2 reduction reduction
[l/100km] [g/km] [l/100km] [%]
Golf 1.4l TSI 7.24 173.7 0.00 0.0
cw=0.28, fr =0.9%, m=1250kg2.0l-TDI-gear box,start-stop
5.58 133.8 1.66 22.9
cw=0.28, fr=0.9%, m=1250kg
2.0l-TDI-gear box, GSIstart-stop,
5.44 130.6 1.80 24.8
cw=0.28, fr=0.9%, m=1250kg2.0l-TDI-gear box, GSIStart-Stop warm
4.85 116.5 2.38 32.9
combined measures
NEDC
Basic car
Reduction Potential in the Simulationcombined Measures in the NEDC

Taxes
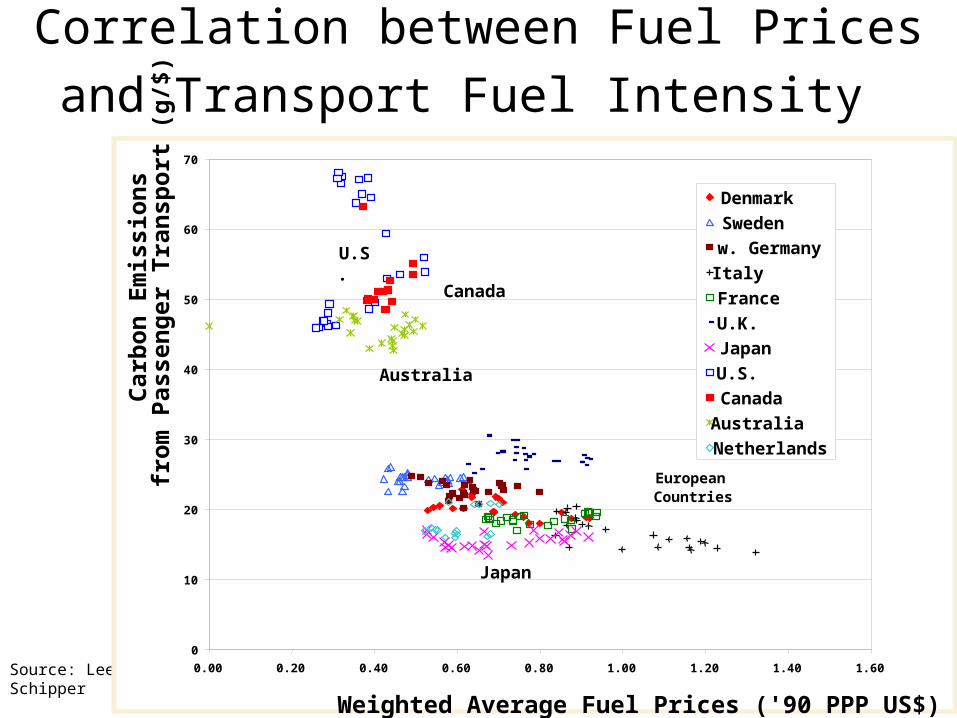
Correlation between Fuel Prices and
Transport Fuel Intensity
Source: Lee Schipper
0
10
20
30
40
50
60
70
0.00 0.20 0.40 0.60 0.80 1.00 1.20 1.40 1.60
Weighted Average Fuel Prices ('90 PPP US$)
Car
bo
n E
mis
sio
ns
fro
m P
asse
ng
er T
ran
spo
rt (
g/$
)
Denmark
Sweden
w. Germany
Italy
France
U.K.
Japan
U.S.
Canada
Australia
Netherlands
European Countries
Australia
U.S.
Canada
Japan

Average Fuel Prices in 2003 vs. Transport Energy Intensity of old EU15 Member States
(in grams of road transport fuel per € of GDP)
24
26
28
30
32
34
36
38
0.70 0.80 0.90 1.00 1.10 1.20
road fuel price in 2003 (€/litre))
roa
d f
ue
l us
e (g
/€)
Source: Transport and Environment Reporting Mechanism data, T&E analysis
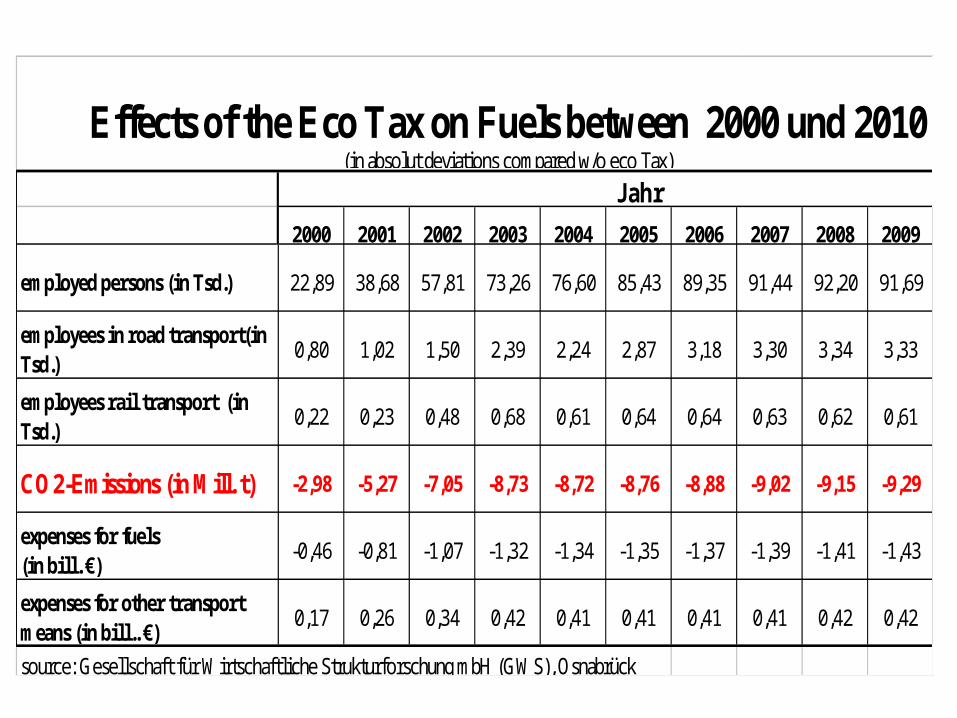
2000 2001 2002 2003 2004 2005 2006 2007 2008 2009
employed persons (in Tsd.) 22,89 38,68 57,81 73,26 76,60 85,43 89,35 91,44 92,20 91,69
employees in road transport(in Tsd.)
0,80 1,02 1,50 2,39 2,24 2,87 3,18 3,30 3,34 3,33
employees rail transport (in Tsd.)
0,22 0,23 0,48 0,68 0,61 0,64 0,64 0,63 0,62 0,61
CO2-Emissions (in Mill. t) -2,98 -5,27 -7,05 -8,73 -8,72 -8,76 -8,88 -9,02 -9,15 -9,29
expenses for fuels (in bill. €)
-0,46 -0,81 -1,07 -1,32 -1,34 -1,35 -1,37 -1,39 -1,41 -1,43
expenses for other transport means (in bill.. €)
0,17 0,26 0,34 0,42 0,41 0,41 0,41 0,41 0,42 0,42
source: Gesellschaft für Wirtschaftliche Strukturforschung mbH (GWS), Osnabrück
Effects of the Eco Tax on Fuels between 2000 und 2010 (in absolut deviations compared w/o eco Tax)
Jahr
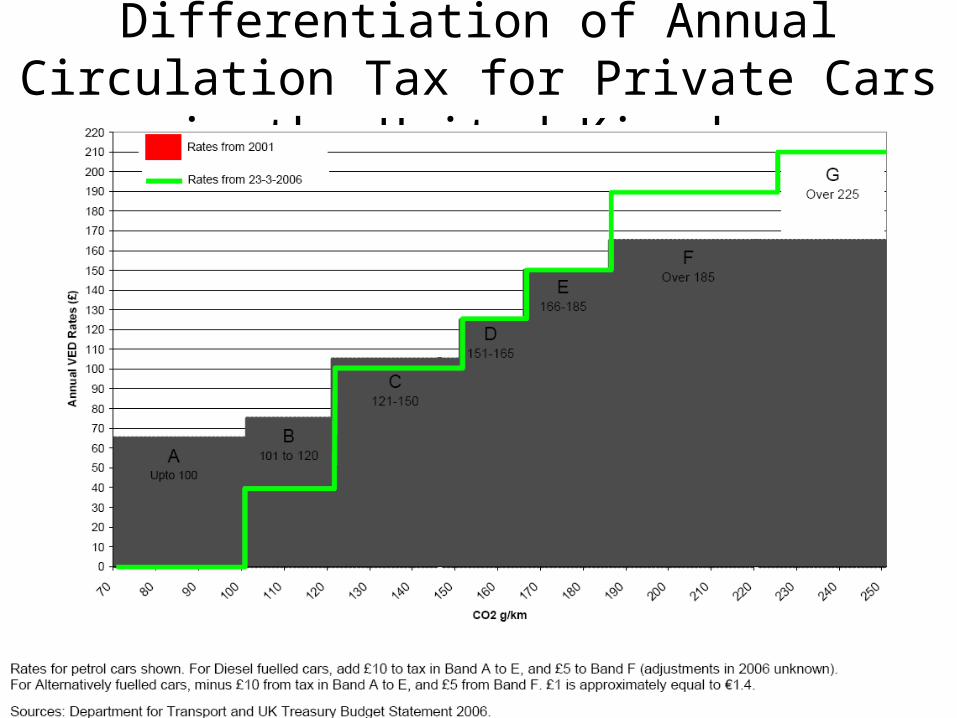
Differentiation of Annual Circulation Tax for Private Cars in the United Kingdom
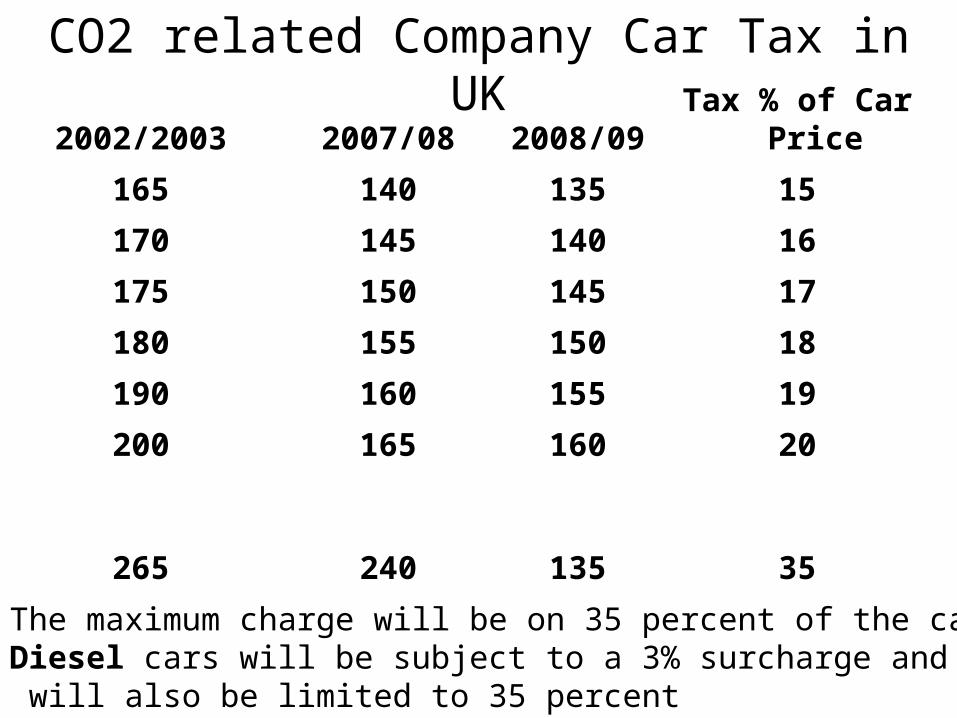
2002/2003 2007/08 2008/09Tax % of Car
Price
165 140 135 15
170 145 140 16
175 150 145 17
180 155 150 18
190 160 155 19
200 165 160 20
265 240 135 35
CO2 related Company Car Tax in UK
The maximum charge will be on 35 percent of the car list price. Diesel cars will be subject to a 3% surcharge and this charge will also be limited to 35 percent

New Car Average CO2 Emissions in UK
Source: Driver Vehicle Licensing Agency, UK
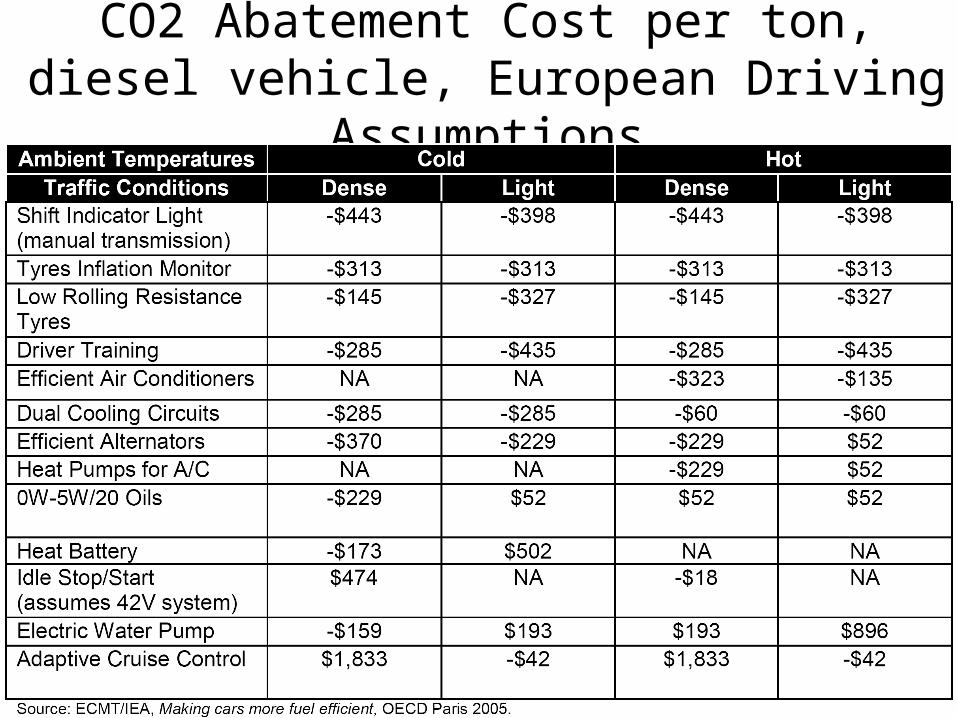
CO2 Abatement Cost per ton, diesel vehicle, European Driving Assumptions

HDV
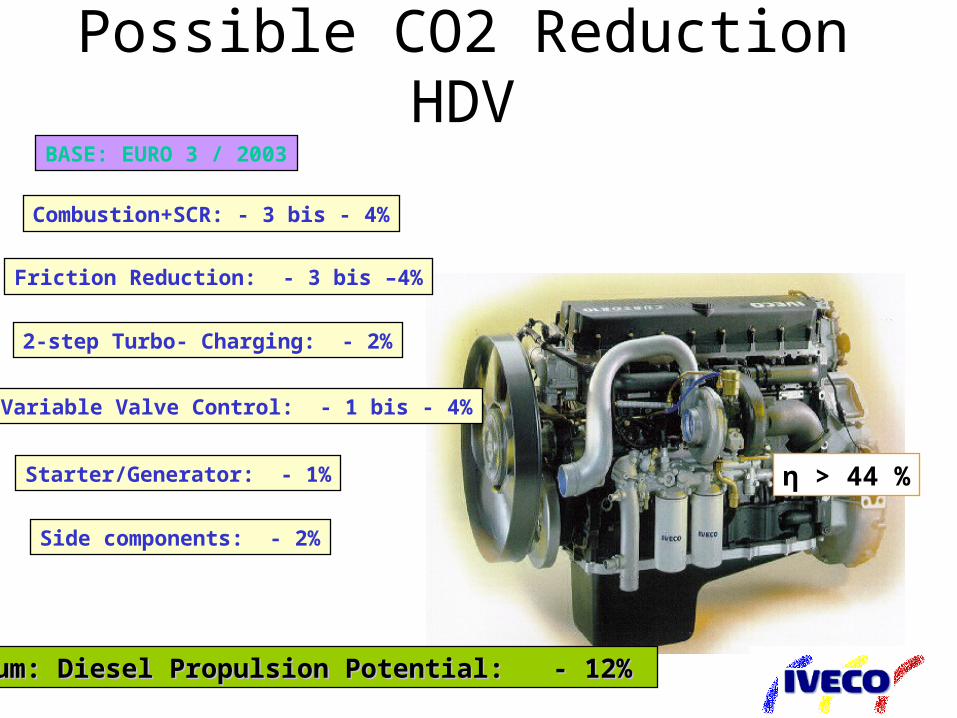
Possible CO2 Reduction HDVBASE: EURO 3 / 2003
Combustion+SCR: - 3 bis - 4%
2-step Turbo- Charging: - 2%
Variable Valve Control: - 1 bis - 4%
Friction Reduction: - 3 bis –4%
Side components: - 2%
Starter/Generator: - 1%
Sum:Sum: Diesel Diesel PropulsionPropulsion Potential: - 12% Potential: - 12%
η > 44 %

Mode Shift
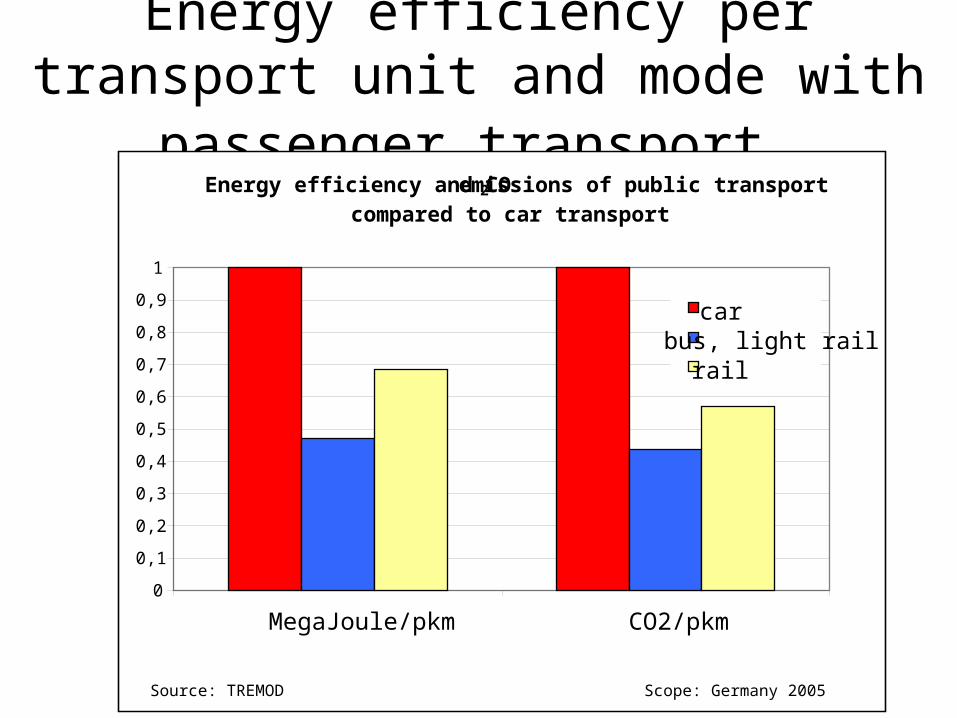
Energy efficiency per transport unit and mode with passenger transport
Energy efficiency and CO2 emissions of public transport compared to car transport
0
0,1
0,2
0,3
0,4
0,5
0,6
0,7
0,8
0,9
1
MegaJoule/pkm CO2/pkm
carbus, light railrail
Scope: Germany 2005Source: TREMOD

Energy efficiency per transport unit and mode with Freight Transport
Energy efficiency and CO 2 emissions of road freight compared to rail and inland waterways
0
0,1
0,2
0,3
0,4
0,5
0,6
0,7
0,8
0,9
1
MegaJoule/tkm CO2/tkm
roadrailinland shipping
Source: TREMOD Scope: Germany 2005
Entwicklung des Modal Split in Berlin (Binnenverkehr)
0
5
10
15
20
25
30
35
40
ÖV mot. IV (+ Mitf.)
Rad Fuß
Ver
keh
rsau
ftei
lun
g (
Fah
rten
un
d W
ege
in %
)
1992
1998
2015 (Sz. 3)
Modal Split Development in Berlin (Internal Traffic)
Bicycle
Development Passenger TransportS-Bahn Berlin
M.ML 1 BB (NO)
Implementation of the EU Bio Fuels
Directive
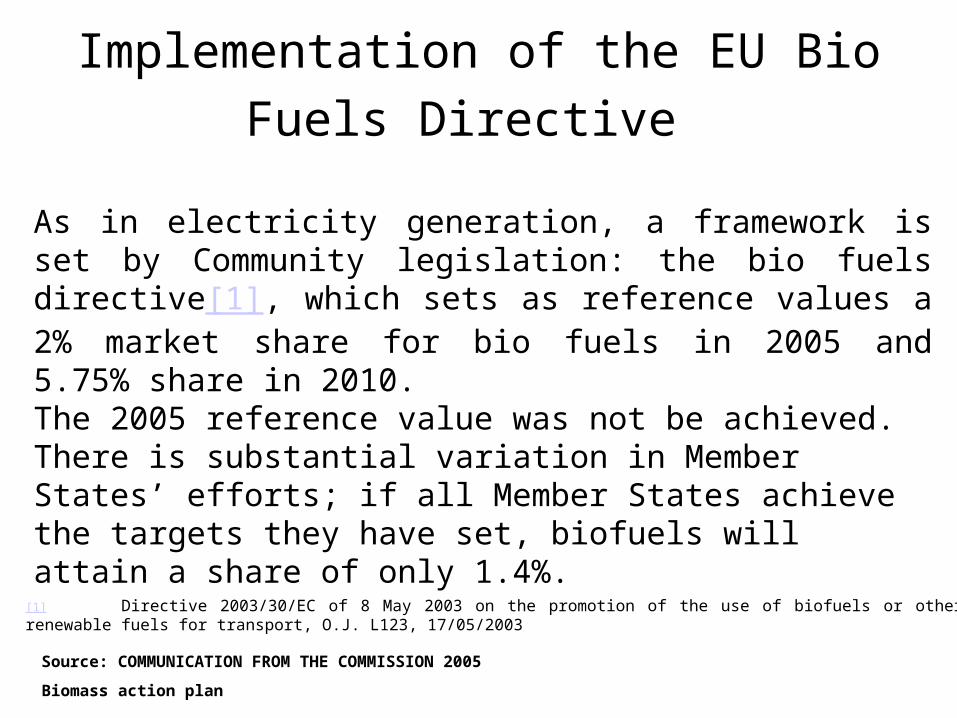
As in electricity generation, a framework is set by Community legislation: the bio fuels directive[1], which sets as reference values a 2% market share for bio fuels in 2005 and 5.75% share in 2010.The 2005 reference value was not be achieved. There is substantial variation in Member States’ efforts; if all Member States achieve the targets they have set, biofuels will attain a share of only 1.4%.
[1] Directive 2003/30/EC of 8 May 2003 on the promotion of the use of biofuels or other renewable fuels for transport, O.J. L123, 17/05/2003
Source: COMMUNICATION FROM THE COMMISSION 2005
Biomass action plan

Bio Fuels
Implementation of the EU Biofuels Directive
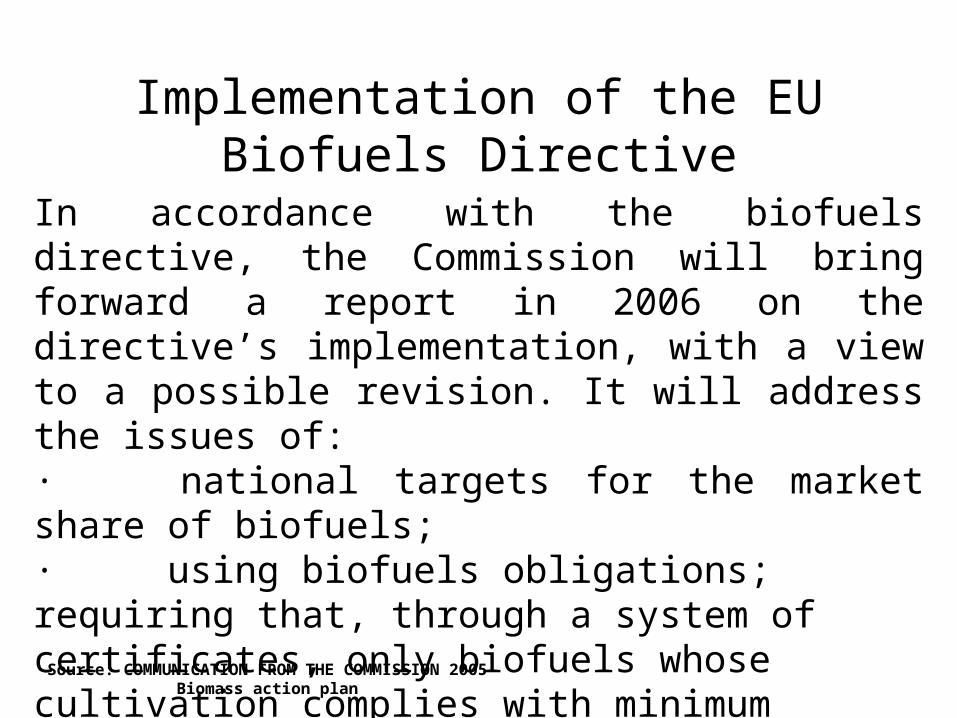
In accordance with the biofuels directive, the Commission will bring forward a report in 2006 on the directive’s implementation, with a view to a possible revision. It will address the issues of:· national targets for the market share of biofuels; · using biofuels obligations; requiring that, through a system of certificates, only biofuels whose cultivation complies with minimum sustainability standards will count towards the targets.
Source: COMMUNICATION FROM THE COMMISSION 2005Biomass action plan

Address: 068440 Dessau POB 1406 Tel: +49 340 2103 2562
