16. village level survey report shiromoni...
TRANSCRIPT

169
16. VILLAGE LEVEL SURVEY REPORT
To fulfil the objective of my study, I have chosen the two villages, namely;
Shiromoni under the block of Jamalpur, Dist. Burdwan and the other village is
Berachampa under the Deganga block-I, Dist. North 24-Parganas. Our sample survey
consists of 2 villages covered by 2 different gram panchayats (GPs) or local
governments. For each of these villages, author visited the concerned Head of the
Panchayats to collect information like vested land, issue of land titles (pattas), registered
tenants, class-wise composition of panchayat members, etc.
I have also conducted the household survey to collect the socio-economic status
of the villagers, ownership pattern of the farmers, use of modern equipments and loan
distribution etc., of the concerned villages.
From these surveys, I have collected the data on two villages and I made an
empirical study to show how the changing trends in agrarian relations at the macro-level
are reflected at the micro-level.
Secondly, caste is an important indicator of social status in Hindu Society, its
peculiarity being that it is confined to Hindu Society. Ghurye defined caste as social
grouping characterized by (1) segmental division of society; (2) hierarchy (3) restrictions
on feeding and social intercourse (4) civil and religious privileges and disabilities of
different sections (5) lack of unrestricted choice of occupation and (6) restrictions of
marriage. Hindu society is divided into a multitude of castes and sub-castes1.
For operational convenience, I have made a three-fold classification of castes.
These are S/C=Scheduled Caste, S/T=Scheduled Tribe, Brahmin and Non-Brahmins i.e.,
General Castes. Besides these, there are also two main religious people inhabited in these
villages, they are Muslim and Buddhist.
The questionnaire used for this field survey work is given in Appendix-I.
Reference :
1. Ghurye, G.S. : Caste and Race In India, Popular Prakashan, Bombay. Ch.I

170
EMPIRICAL FINDINGS
A : Field Survey Report of Shiromoni village
Shiromoni village is located in the Jamalpur block of Burdwan district. The
village is governed by Abujhati-I Gram Panchayat. Its J.L. No. is 1302. The name of the
mouza is also Shiromoni mouza. The Left Front has formed the panchayat body in this
village. The nearest railway station is at Jhapandanga (Howrah-Burdwan chord rail link).
Burdwan sadar is just 30 minutes by train from this station. The Durgapur express way
runs beside this village. A canal known as Binod Canal runs through the middle of the
village and this helps in irrigation in some of the agricultural land of this village. Nearly
80 per cent of the villagers are engaged in agriculture or agriculture related work and the
rest are engaged in either small-scale industries and cottage industries or employed in
service sector. The land of this region is quite fertile. So multi-cropping is procticed. The
main crops are paddy, jute and vegetables. There is one primary school in this mouza and
a Madhyamik school for boys and girls just 1 km away, located at Jhapandanga. There is
one Co-operative Society in this village which provides loan to the villagers. The socio-
economic profile of the villagers (community-wise) after land reform programme is as
follows :

171
(i) Age-sex compositions :
In table-1, the age and sex composition of the Shiromoni village is presented. It
shows that 33 males and 23 females belong to the age group of 0-4 years. Of the 33
males, 7(21.2%) belong to the Scheduled Castes, 11(33.3%) belong to the Scheduled
Tribes and 15(45.5%) under the General Castes. Of the 23 females aged 0-4 years,
5(21.7%) belong to the Scheduled Castes, 7(30.4%) belong to Scheduled Tribes and
11(47.9%) belong to General Castes.
Next under the age group of 5-14 years, a total of 73 males and 60 females are
found. Amongst the 73 males, 25(34.3%) belong to the Scheduled Castes, 21(28.8%)
belong to the Scheduled Tribes and 27(36.9%) represent the General Castes. Likewise in
the case of 60 females, 20(33.4%) belong to Scheduled Castes, 19(31.6%) belong to the
Scheduled Tribes and 21(35.0%) are to the General Castes.
In the age group between 15-44 years, there are 145 males and 117 females. With
reference to males, there are 55(37.9%) belong to the Scheduled Castes, 48(33.2%)
belong to the Scheduled Tribes and 42(28.9%) represent the General Castes. In the case
of females, 43(36.7%) belong to Scheduled Castes, 37(31.6%) belong to the Scheduled
Tribes and 37(31.6%) under the General Castes.
Under the age group of 45-59 years, we find a total of 47 males and 44 females.
Amongst the males, 18(38.3%) belong to the Scheduled Castes, 12(25.5%) belong to
Scheduled Tribes and 17(36.2%) represent the General Castes. Of the 44 females,
17(38.7%) belong to Scheduled Castes, 14(31.8%) are to Scheduled Tribes and
13(29.5%) belong to the General Tribes.
Finally in the age group of 60 and above, there are 31 males and 20 females. In
the case of males, there are 11(35.4%) belong to Scheduled Castes, 8(25.8%) belong to
the Scheduled Tribes and 12(38.8%) are to General Castes. And in the case of females,
there are 9(45%) are in the Scheduled Castes, 3(15%) belong to Scheduled Tribes and
8(40%) belong to the General Castes.

172
Table-I
Age-sex composition of the Shiromoni Village
Name of
the
Commun
-ity
Age group (yrs.) Total
population
0-4 5-14 15-44 45-59 60+ Total
M F M F M F M F M F M F
S/C 07
(21.
2%)
05
(21.
7%)
25
(34.
3%)
20
(33.
4%)
55
(37.
9%)
43
(36.
7%)
18
(38.
3%)
17
(38.
7%)
11
(35.
4%)
09
(45.
0%)
116 94
S/T 11
(33.
3%)
07
(30.
4%)
21
(28.
8%)
19
(31.
6%)
48
(33.
2%)
37
(31.
6%)
12
(25.
5%)
14
(31.
8%)
08
(25.
8%)
03
(15.
0%)
100 80
General 15
(45.
5%)
11
(47.
9%)
27
(36.
9%)
21
(35.
0%)
42
(28.
9%)
37
(31.
6%)
17
(36.
2%)
13
(29.
5%)
12
(38.
8%)
08
(40.
0%)
113 90
Total 33
(100%)
23
(100%)
73
(100%)
60
(100%)
145
(100%)
117
(100%)
47
(100%)
44
(100%)
31
(100%)
20
(100%)
329 264
=593
Source : Field Survey & Local Panchayat
NB : S/C= Scheduled Caste, S/T=Scheduled Tribe, General= General Caste
(ii) Occupational distribution:
The occupational pattern of the sample households of Shiromoni village has given
below :
Table-II
Occupational distribution of the sample house-holds
Name of
the
communi
ty
Agricultural
labourer
Cultivation Petty
Business
Animal
husbandry
Service Others Total
M F M F M F M F M F M F M F
S/C 32
(36.3%
)
17
(33.3%
)
41
(61.2%
)
17
(58.
7%)
03
(21.
5%)
01
(33.
3%)
- 03
(33.
3%)
03
(21.5%
)
- 02
(18.2%
)
- 81 38
S/T 41
(46.6%
)
31
(60.8%
)
11
(16.5%
)
07
(24.
1%)
01
(7.1
%)
- - 01
(11.
1%)
01
(7.1%)
- 03
(27.2%
)
01
(25
%)
57 40
General
Castes
15
(17.1%
)
03
(5.9%)
15
(22.3%
)
05
(17.
2%)
10
(71.
4%)
02
(66.
7%)
08
(100
%)
05
(55.
6%)
10
(71.4%
)
02
(100%)
06
(54.6%
)
03
(75
%)
64 20
Total 88
(100%)
51
(100%)
67
(100%)
29
(100
%)
14
(100
%)
03
(100
%)
08
(100
%)
09
(100
%)
14
(100%)
02
(100%)
11
(100%)
04
(100
%)
202 98
=300
Source : Field Survey

173
Table-II shows that 88 males and 51 females are agricultural labourers. Of the 88
male agricultural labourers, 32(36.3%) are from SC, 41(46.6%) from ST and 15(17.1%)
are from General Castes. Of the 51 female agricultural labourers, 17(33.3%) are from SC,
31(60.8%) belong to S/T and 3(5.9%) are from General Castes.
Likewise in the cultivation category, the SC community represents 41(61.2%)
males and 17(58.7%) females, while in the S/T community there are 11(16.5%) males
and 7(24.1%) females and in the General Caste category 15(22.3%) males and 5(17.2%)
females out of total 67 males and 29 females.
In the case of petty business category, 14 males and 3 females are found.
Amongst the 14 males, 3(21.5%) belong to the S/C, 1(7.1%) belong to the S/T
community and 10(71.4%) under the General Castes. Of the 3 females, 1(33.3%) is
belong to S/C, none is found in the S/T community and 2(66.7%) represent the General
Castes.
In the animal husbandry sector, there are 8 males and 9 females. Out of 8 males
there are none found in the S/C and S/T communities, only 8(100%) belong to the
General Castes. Out of 9 females, 3(33.3%) belong to the S/C, 1(11.1%) is belonging to
the S/T and 5(55.6%) are to the General Castes.
Likewise in the service sector category, the SC community represents 3(21.5%)
males and none found in female category, in the S/T community, 1(7.1%) male and none
female is found and in the General Caste category there are 10(71.4%) males and
2(100%) females out of total 14 males and 2 females respectively.
Last in the others categories, 2(18.2%) males belong to SC and none female is
found. 3(27.2%) male and 1(25%) female belong to the ST community and 6(54.6%)
male and 3(75%) female are in the General Castes out of total 11 males and 4 females
respectively in the Shiromoni village.
The agricultural labourers surpass the other categories in sheer numbers.

174
(iii) Land Distribution :
Table-III provides average of the ceiling surplus land and patta (legal rights)
distribution, which achieved by local panchayats under the land reform programme.
Table – III
Land Reforms Implemented : Sample Average
Source : Field Survey and Local Panchayat
Above Table shows the numbers of beneficiaries with patta holders, total numbers
of beneficiaries with percentage and area of land distributed in bighas among the
beneficiaries.
In the category of numbers of beneficiaries with patta (legal rights) holders, the
total numbers of 24 males and 4 females have been benefited under the distribution of
vested 0-1 bigha land and. Of the 24 males, 11(45.8%) are from S/C, 6(25.0%) from S/T
and 7(29.1%) to General Castes. Of the 4females, 3(75.0%) are from S/C, 1(25.0%) is
from S/T and none in the General Caste.
13 males and 2 females owning 1-2 bighas benefited from land reforms. Amongst
13 males, 6(46.2%) belong to S/C, 3(23.0%) from S/T and 4(30.8%) are belonging to
General Castes. In the category of females, 1(50%) from S/C, none in the S/T and 1(50%)
is belonging to General Caste category.
The total numbers of beneficiaries are 43 persons under the land reform
programme in this village. Out of them 21(48.9%) beneficiaries belong to S/C, 10(23.2%)
belong to S/T and 12(27.9%) are in the General Caste Category.
Under the vested land distribution programme, 40 bighas have been distributed
among the poor families under the supervision of local panchayat. 20(50.0%) bighas
Name of the
community
Numbers of beneficiaries (persons in sex ratio)
& patta (legal rights) holders
Total
number of
beneficiari
es and
percentage
Area of
land
distributed
(in bigha)
0-1
bigha
1-2 bigha
M F M F Total (%)
S/C 11(45.8%) 3(75.0%) 6(46.2%) 1(50%) 21(48.9%) 20(50.0%)
S/T 6(25.0%) 1(25.0%) 3(23.0%) - 10(23.2%) 9 (22.5%)
General
Caste
7(29.1%) - 4(30.8%) 1(50%) 12(27.9%) 11(27.5%)
Total 24(100%) 4(100%) 13(100%) 2(100%) 43(100%) 40(100%)

175
distributed to the S/C communities, 9(22.5%) bighas distributed to the S/T families and
rest 11(27.5%) bighas have been distributed to the General Caste category.
If we compare with the total number of beneficiaries and total vested land
distribution it is seen that 48.9% S/C community holding 50.0% of land, 23.2% S/T
community having 22.5% land and 27.9% General Caste community holding 27.5% of
land under vested land programme.
Scheduled Caste families have been benefited more than other two categories and
S/T families.
(iv) Bargadars (sharecroppers) registration :
Table –IV shows the number of recorded bargadars (sharecroppers) in the village
of Shiromoni under the land reform programme with active control of local panchayat
who owning 0-2 bighas.
Table –IV
Recording of Bargadars (sharecroppers)
Source : Field Survey & Local Panchayat
The number of recorded bargadars represents 40 males and 4 females. Out of 40
males, 17(42.5%) belong to S/C, 11(27.5%) from S/T and 12(30.0%) belonging to
General Caste community. On the other hand out of 04 females, 2(50.0%) are from S/C,
1(25.0%) belong to S/T and the rest 1(25.0%) is recorded as bargadar in the General
Caste community.
The above table also shows the community-wise beneficiaries of bargadari
(sharecropping) in this village. In case of SC community, 17 male and 12 female
comprise a sum of 19 and percentage-wise 43.1% out of total 44 recorded bargadars. In
the S/T Category, male 11 and female 1 were recorded representing 27.2% of total
Name of the
community
Number of recording
bargadars
(sharecroppers) in sex
ratio
Total number of
bargadars (sharecroppers)
community wise recorded
Areas of
lands
recorded
(in bighas)
M F Total (%) (Total %)
S/C 17(42.5%) 2(50.0%) 19 (43.1%) 20 (50.0%)
S/T 11(27.5%) 1(25.0%) 12 (27.2%) 9 (22.5%)
General Caste 12(30.0%) 1(25.0%) 13 (29.5%) 11 (27.5%)
Total 40(100%) 4(100%) 44 (100%) 40(100%)

176
bargadars. In General Caste community 12 male and 1 female persons totaling 13 were
recorded as bargadars (29.5%). 40 bighas of land has registered as barga land
(sharecropping). The SC community registered 21 bighas as bargadar (sharecroppers),
which is 50.0% of total barga land. The S/T community gets 9 bigha (22.5%) and General
Caste community allotted 11 bigha which is 27.5% out of total 40 bighas. In comparison
between total bargadars and total barga land, it is observed that the S/C community
comprises 43.1% holding 50.0% of total barga land. The S/T community represents
27.2% against 22.5% of barga land and the General Caste community, 29.5 % owning
27.5% out of total 40 bighas barga land under the land reform programme in this village.
This indicates that the S/T community is more deprived in comparison to others
as they represent 27.2% beneficiaries holding only 22.5% barga land.
(v) Owner cultivator-cum-share croppers :
Table-V
Owner cultivator –cum- share cropper
No. of ST
households share
cropping land of the
size of 1-2 bighas
No. of SC
households share
cropping land of the
size of 1-2 bighas
No. of General Caste
households share
cropping land of the
size of 1-2 bighas
Total no. of
house holds
3(20%) 5(33.3%) 7(46.7%) Total=15(100%)
Source : Field Survey
The Table -V shows the owner cultivator-cum-share-croppers in the Shiromoni
village where cultivation of land owned by an owner cultivator and of other’s land as a
share cropper has involved 15 households which is needless to mention here that these
categories are poor and marginal peasants trying to supplement the income from the
cultivation of the land in their ownership with that from the tillage of other’s soil as crop-
sharers. The households are primarily owner-cultivators, share-cropping being their
supplementary means of hard ship livelihood.
The above table also shows that 3(20%) households in the S/T community,
5(33.3%) households in S/C category and 7(46.7%) households in the General caste are
as owner-cultivator-cum-sharecroppers with cropping land of 1-2 bighas distributed to 15
house holds in this village.
177
(vi) Condition of the Agricultural Labourers :
The agricultural labourers get hardly six months work in this village. Their daily
wages are Rs.60/- and 1Kg. of rice per day. During the rest of the period these labourers
visit to the other district especially to Hooghly district for agricultural and other works.
The average monthly income of agricultural worker is Rs.1500/- and average monthly
expenditure is Rs.1200/-, if husband and wife both work in the cultivation season. It may
be mentioned that the wives of the most agricultural labourers works as daily wage basis.
The economic conditions of these families/households are very grim. They can afford
meal only once a day to their children in off season. These children hardly study up to the
level of primary schools. They are unable continue their studies due to poverty. Most of
the children of agricultural labourers are admited to primary school for attraction of mid
day meal.
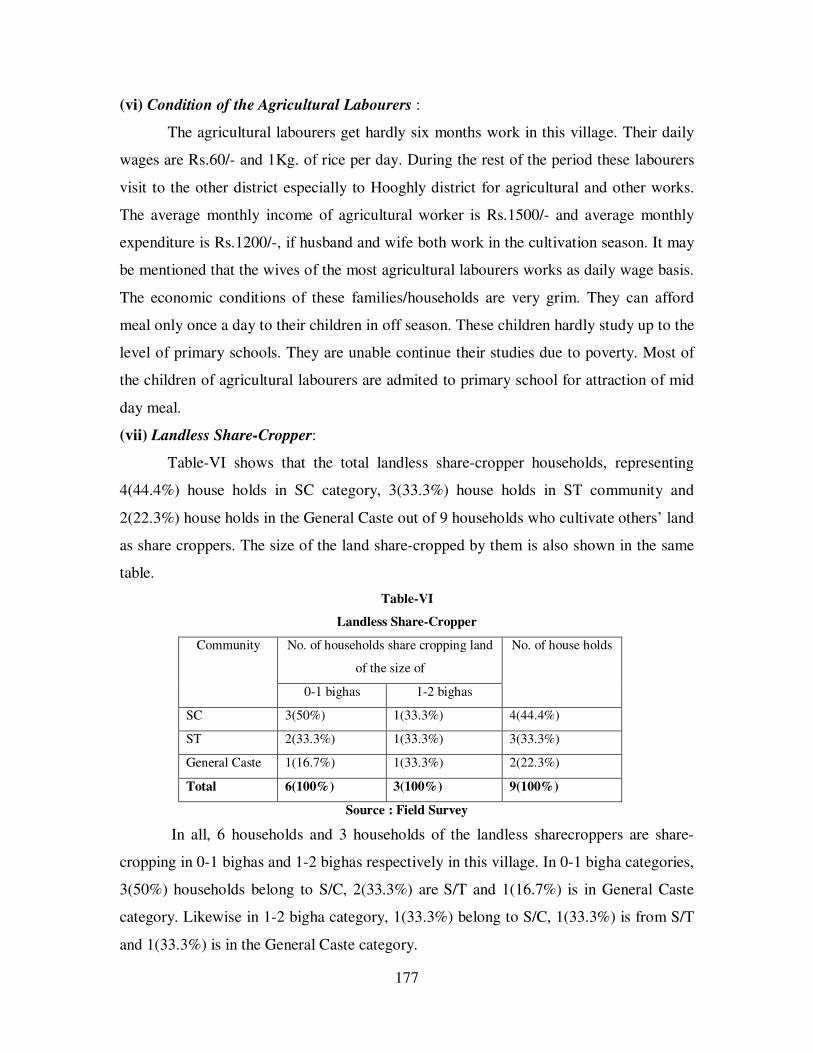
(vii) Landless Share-Cropper:
Table-VI shows that the total landless share-cropper households, representing
4(44.4%) house holds in SC category, 3(33.3%) house holds in ST community and
2(22.3%) house holds in the General Caste out of 9 households who cultivate others’ land
as share croppers. The size of the land share-cropped by them is also shown in the same
table.
Table-VI
Landless Share-Cropper
Community
No. of households share cropping land
of the size of
No. of house holds
0-1 bighas 1-2 bighas
SC 3(50%) 1(33.3%) 4(44.4%)
ST 2(33.3%) 1(33.3%) 3(33.3%)
General Caste 1(16.7%) 1(33.3%) 2(22.3%)
Total 6(100%) 3(100%) 9(100%)
Source : Field Survey
In all, 6 households and 3 households of the landless sharecroppers are share-
cropping in 0-1 bighas and 1-2 bighas respectively in this village. In 0-1 bigha categories,
3(50%) households belong to S/C, 2(33.3%) are S/T and 1(16.7%) is in General Caste
category. Likewise in 1-2 bigha category, 1(33.3%) belong to S/C, 1(33.3%) is from S/T
and 1(33.3%) is in the General Caste category.

178
Being otherwise very poor, these landless households eke out their living as crop-
shares to keep them alive. Born in the soil and wedded to it, they live to live on it, though
the soil hardly returns them enough bounty. Some of the share-croppers of this village
have failed to record their names as sharecroppers due to their ignorance about the
procedure and formalities.
(viii) Agricultural System :
Some big farmers are using almost all the agricultural land with modern
equipments like tractors, fertilizers, pesticides, shallow machines etc. But, by and large,
ploughing is still done in the traditional way with a pair of bullocks and the traditional
langol (a wooden plough with an iron spare). Spades (Kodal), small hooks (nirani) for
the weeding and sickles (kaste) for harvesting in the agricultural cycle. The fertile land
promotes multi-crop production. The existing canal helps in irrigation (as already
mentioned). There are some personal and private shallows, tube-wells etc. and one
government sponsored deep tube-well for irrigating agricultural land.
(ix) Cultivation of Paddy :
All the agriculturist households of the village grow paddy using implements like
plough, harrow, sickle, tractor, spade, fertilizer and engaging agricultural labourer, etc.
for the purpose. In monsoon when rain starts the season of agriculture begins in Bengal.
But with the development of agricultural systems the season starts earlier. In the month of
March-April the boro cultivation is initiated. In early June with the onset of monsoons,
the Aus paddy cultivation starts after one or two heavy showers and at the end of August
the peasants of the Shiromoni village prepares for Aman cultivation. After harvesting, as
and when paddy is ripe, the stalks of ripe paddy are reaped in the middle with sickles or
reaper machine. The paddy usually brought home either in bullock carts, tractors or by
the cultivators themselves.

179
(x) Harvesting Expenses :
The harvesting expenses of Aman Paddy of this village is given below (Table-
VII):
Table-VII
Harvesting Expenses of Aman Paddy per bigha
Sl. No. Harvesting Expenses Amount (Rs.)
1 Tractor Expenses @ Rs.150/- per hour
x 2=30 hrs.
375=00
2 Agricultural Labour expenses :
(a) Resizing field
(b) Paddy Plant (roya)
(c) Weeding
@ Rs.60/- x 1=
@ Rs.60/- x 6=
@ Rs.60/- x 2=
60=00
360=00
120=00
3 Seeds cost @ Rs.200 per bigha 200=00
4 Paddy Cutting, Bundles etc. @ Rs.60/- x 3= 180=00
5 Carrying charges from field @ Rs.60/- x 3= 180=00
6 Jharai @ Rs.60/- x 3= 180=00
7 Fertilizers Charges @ Rs.10/-x 20 bags 200=00
8 Pesticides Spray @ Rs. 150/- per lit. 150=00
Total Expenses : 2005=00
Source : Field Survey
10 jute bags rice are obtained from 1 bigha of land (1 bag contains of 60 kg. of
rice). These bags have been sold in the open market of this village at a average rate of Rs.
300/- per bag. Thus the total earning of a peasant amounted to Rs.300/- x 10= Rs.3000/-.
And their expenses amounted to Rs.2005/-. The net income of a peasant is Rs.(3000-
2005)=995/- per bigha. If a marginal peasant has 3 bighas of cultivation land, he can earn
hardly Rs.995/- x 3= Rs.2885/- in a year through Aman cultivation. Including the earning
from cultivation of aus, vegetables, etc., one can earn around Rs.4000/- per annum. The
monthly average income of a marginal peasant owning 1-3 bighas of land is estimated at
Rs.333=34 only.

180
(xi) Monthly Income :
It is very difficult to get a correct idea of the income of a household. Even then an
attempt is made from field investigation in Table VIII, which shows the distribution of
the households by income.
Table-VIII
Monthly Income & Occupation
Occupation
1
Households with monthly income of No. of
households
7
Less than
Rs.1000/-
2
Rs.1001/- to
Rs.2000/-
3
Rs.2001/- to
Rs.3000/-
4
Rs.3001/- to
Rs.4000/-
5
Rs.4000/- to
Rs.5000/-
6
Cultivation 14(93.3%)* 4(44.4%) 3(27.2%) 3(30.0%) 6(50.0%) ** 30
Business 1(6.6%) 2(22.2%) 2(18.1%) 4(40.0%) 3(25.0%) 12
Other
Services
- 3(33.3%) 6(54.6%) 4(40.4%) 3(25.0%) 16
Total 15(100%) 9(100%) 11(100%) 10(100%) 12(100%) 58
Remarks :* cultivator category includes the Agricultural Labourer
**cultivator category includes the trade
Source : Field Sources
The collected data of monthly income and occupation of Shiromoni villagers
Reveals that 15 households have income are less than Rs.1000=00. Of these 14(93.3%)
households are cultivators, including agricultural labourers and 1(6.6%) household in
Business sector and none in other services.
In column 3, it is seen that 9 households whose monthly income is Rs.1000=00 to
Rs.2000=00. Of these households, 4(44.4%) households are cultivator, 2(22.2%)
households are in business sector and 3(33.3%) households engaged in other services.
In column no. 4 shows 11 households, whose monthly income is in between
Rs.2001=00 to Rs.3000=00. Of these 3(27.2%) households belong to cultivators,
2(18.1%) households belong to business sector and 6(54.6%) households are in other
services.
In column no. 5 represent 10 households, whose monthly income is Rs.3001=00
to Rs.4000=00. Amongst, 3(30.0%) households are engaged in cultivation, 4(40.0%)
households are in business sector and other 4(40.0%) households are in other services.

181
In column no. 6 shows, there are only 12 households, whose monthly income is
Rs.4001=00 to Rs.5000=00. Of these, 6(50.0%) households are engaged in cultivation,
3(25.0%) in business sector and other 3(25.0%) in other services.
It shows that the cultivator including agricultural labourers, whose monthly
income is less than Rs.1000=00 are more numbers (93.3%) than other categories.
(xii) Monthly Expenditure :
It is also a very difficult task to ascertain its expenditure on different heads. Most
of the households hand to mouth existence, with limited income and have professed their
ignorance of the idea of budget.
Table-IX
Head wise monthly expenditure of rural poor households
Occupation Head Total
expenditure
No. of
Households Food &
Clothing
Misc. and
Fuel
Children
education and
medical treatment
Cultivation* Rs.800/- Rs.100/- Rs.100/- Rs.1000/- 25(45.5%)
Agricultural
Labourer
Rs.500/- Rs.50 Rs.50/- Rs.600/- 15(27.2%)
Other Labourers Rs.600/- Rs.50/- Rs.50/- Rs.700/- 15(27.2%)
Total Rs.2300/- 55(100%)**
Remarks: * Poor cultivators including sharecroppers whose land holding 1-2 bigha
** Average of family members are 4 persons
Source : Field Survey
Table-IX shows the average sample head wise monthly expenditure of the rural
households in Shiromoni village. Out of the interviewed 55 households, whose family
members are in average four persons. The cultivators are mainly poor and marginal
peasants including sharecroppers who are holding land 1-2 bigha. Of these 25(45.5%)
households have monthly expenditure less than Rs.1000/-, while 15(27.2%) households
of agricultural labourers comprise monthly average expenditure less than Rs.600/- only.
On the other hand, 15(27.2%) households engaged in other labourers jobs, have their
monthly average expenditure less than Rs.700/-. Most of the poor and marginal peasants
and agricultural labourers households are not in position to spend a penny on education

182
and treatment for their children. Naturally most of these categories are indebted in this
village.
(xiii) Indebtedness :
The Shiromoni village where most of the households enjoy very little economic
opportunities are in indebted position. The villagers mostly comprise of poor and
marginal peasant and especially the agricultural workers are in very much economic
crisis. As a result, they take loan to meet their means of livelihood with high interest. The
Table-X shows the utilization of loans in different purposes.
Table-X
Purpose of Loans
Purposes of Loans No. of households
in debt
Percentage of
Indebted households
Amount of
Loan
Percentage to
total loan
Domestic needs 24 48% Rs.20000 64.51%
Marriage Ceremony 8 16% Rs.4000 12.90%
Sraddha Ceremony 3 6% Rs.1000 3.23%
Worship of a deity 2 4% Rs.500 1.61%
Cultivation of land 5 10% Rs.2500 8.06%
Purchase of land 2 4% Rs.1000 3.23%
Misc. 6 12% Rs.2000 6.46%
Total 50 100% Rs.31000 100%
Source : Field Survey
The investigation in 50 households reveals that most of the households i.e. 24
households or 48% of the total households incurred loan for domestic needs including
medical treatment, followed by 8 households or 16% incurred 12.90%, 3 households or
6% took 3.23% of total loan respectively for marriage and sraddha ceremony purposes.
Only 2(4%) households incurred 1.61% of loan for worship of a deity. In all, 5(10%)
households incurred 8.06% loan for cultivation of land and 2 (4%) households taken
3.23% loan for purchase of agricultural land. The remaining 6 households or 12% of the
total households incurred 6.46% misc. loan of the total loan of Rs.31000/-. Here it should
be mentioned that most of the loan are taken from private sources and some from
commercial banks.
Table XI shows an important survey based on above similar questionnaire
conducted by the author in 120 households (covering about 400 people) of Shiromoni
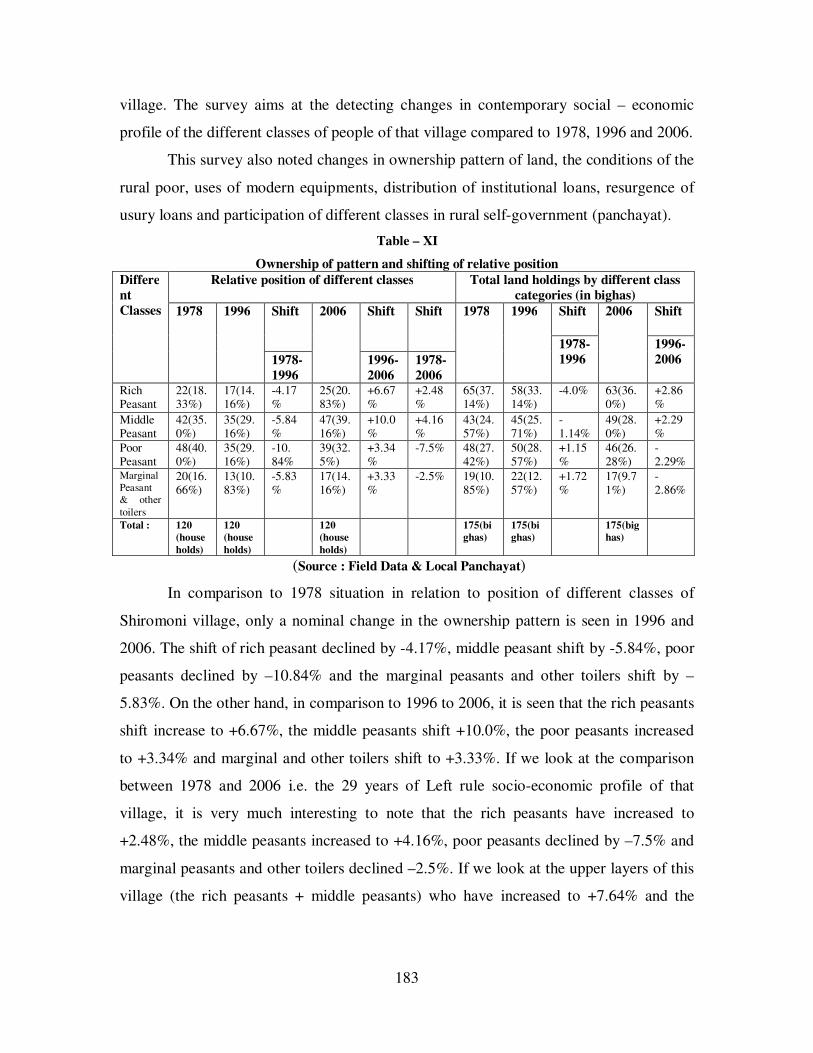
183
village. The survey aims at the detecting changes in contemporary social – economic
profile of the different classes of people of that village compared to 1978, 1996 and 2006.
This survey also noted changes in ownership pattern of land, the conditions of the
rural poor, uses of modern equipments, distribution of institutional loans, resurgence of
usury loans and participation of different classes in rural self-government (panchayat).
Table – XI
Ownership of pattern and shifting of relative position
Differe
nt
Classes
Relative position of different classes Total land holdings by different class
categories (in bighas)
1978 1996 Shift 2006 Shift Shift 1978 1996 Shift
2006 Shift
1978-
1996
1996-
2006 1978-
1996
1996-
2006
1978-
2006 Rich Peasant
22(18.33%)
17(14.16%)
-4.17 %
25(20.83%)
+6.67%
+2.48%
65(37.14%)
58(33.14%)
-4.0% 63(36.0%)
+2.86%
Middle Peasant
42(35.0%)
35(29.16%)
-5.84 %
47(39.16%)
+10.0%
+4.16%
43(24.57%)
45(25.71%)
-1.14%
49(28.0%)
+2.29%
Poor Peasant
48(40.0%)
35(29.16%)
-10. 84%
39(32.5%)
+3.34 %
-7.5% 48(27.42%)
50(28.57%)
+1.15%
46(26.28%)
-2.29%
Marginal
Peasant
& other
toilers
20(16.66%)
13(10.83%)
-5.83 %
17(14.16%)
+3.33 %
-2.5% 19(10.85%)
22(12.57%)
+1.72%
17(9.71%)
-2.86%
Total : 120
(house
holds)
120
(house
holds)
120
(house
holds)
175(bi
ghas)
175(bi
ghas)
175(big
has)
(Source : Field Data & Local Panchayat)
In comparison to 1978 situation in relation to position of different classes of
Shiromoni village, only a nominal change in the ownership pattern is seen in 1996 and
2006. The shift of rich peasant declined by -4.17%, middle peasant shift by -5.84%, poor
peasants declined by –10.84% and the marginal peasants and other toilers shift by –
5.83%. On the other hand, in comparison to 1996 to 2006, it is seen that the rich peasants
shift increase to +6.67%, the middle peasants shift +10.0%, the poor peasants increased
to +3.34% and marginal and other toilers shift to +3.33%. If we look at the comparison
between 1978 and 2006 i.e. the 29 years of Left rule socio-economic profile of that
village, it is very much interesting to note that the rich peasants have increased to
+2.48%, the middle peasants increased to +4.16%, poor peasants declined by –7.5% and
marginal peasants and other toilers declined –2.5%. If we look at the upper layers of this
village (the rich peasants + middle peasants) who have increased to +7.64% and the

184
lowest rungs are (poor + marginal peasants + other toilers including agricultural
labourers) declined by –10.0%.
According to the position of land holdings between 1978 and 1996, the rich
peasants who owns 15-30 bighas declined by -4.0% and middle peasants who own 5-10
bighas declined by -1.14% respectively but on the other hand the poor peasants land
holdings 1-5 bighas increased to 1.15% and marginal peasants and other toilers including
agricultural labourers land holding 0-1 bigha increased to 1.72%. But these features
between 1996 and 2006 have completely changed. The rich peasants land holdings
increased to +2.86% the middle peasants land holdings increased to +2.29% and on the
other hand the poor peasants land holdings declined by -2.29% and the marginal and
other toilers land holdings declined by -2.86% respectively.
The above data shows that the increasing of numbers of households and land
holdings of both rich and middle peasants in this village and thus, a continuation of
gradual strengthening of the position of the rural rich.
Now the sample of the expenditure on modern equipments in different categories
of peasants in Shiromoni village is presented in Table-XII.
Table –XII
Modern Agricultural Equipment used by different categories of peasants
Class Expenses for
modern
Agricultural
equipment
Percentage of
expenses
Total
households
with
percentage
Rich Peasants Rs.1000/- 43.4% 5(20%)
Middle Peasants Rs.800/- 34.7% 8(32%)
Poor & Marginal Peasants
Rs.500/- 21.7% 12(48%)
Total Rs.2300(100)% - 25(100%)
(Source : Field Data)
It is seen that 5(20%) households of rich peasants (who own 15-30 bighas) can
bear the expenses more than 40% for modern agricultural-machinery alongwith fertilizers
averaging Rs.1000/- which is 43.4% of total expenditure of Rs.2300/-, 8 (32%)
households of middle peasants who own (5-15 bighas) borne the expenses of Rs.800/-
(34.7%), while poor and marginal peasants (who own 1-5 bighas) consisting of 12(48%)
households can only use an average of Rs.500/-for the modern equipments which is
21.7% of total expenditure of Rs.2300/-.

185
So, the poor and marginal peasants who are more in numbers than other
categories can hardly afford more expenses for modern cultivation due to their poverty.
Table-XIII shows the usury loan, co-operative loan and bank loan of this village
which taken by different classes in the financial year of 2005-06.
Table –XIII
Distribution of loans among different classes
(Financial year 2005-2006) Class No. of
families
Total amount of usury loan (Rs.)
Takers of usury loan
Average amount per family (Rs.)
Total Co.op. loan (Rs)
Takers of Co.op. loan
Average amount per family (Rs)
Total amount of Bank loan (Rs)
Takers of Bank loan
Average amount per family (Rs)
Rich
peasant
30 10,000 4(10.
2%)
2,500 60000 6(28.
5%)
10,000 25,000 5(50
%)
5,000
Middle
peasant
40 15,000 5(12.
8%)
3,000 50000 10(47
.6%)
5,000 20,000 4(40
%)
5,000
Poor &
marginal
peasant
45 60,000 30(76
.9%)
2,000 10000 5(23.
8%)
2,000 1,000 1(10
%)
1,000
Total 115 85000 39(10
0%)
7500 120000 21(10
0%)
17000 46000 10(10
0%)
11000
(Source : Field Data)
It is found that 4(10.2%) rich peasants have taken usury loan of Rs.10000/-
(average Rs.2500/-) out of 30 households, 5 (12.8%) middle peasants took Rs.15000/-
(average Rs.3000/-) out of 40 households and poor and marginal peasants of 30(76.9%)
households out of total 45 households took Rs.60000/- (average Rs.2000/-) as usury loan.
Likewise co-operative loan, 6(28.5%) rich peasant took Rs.60000/- (average Rs.10000/-).
10(47.6%) middle peasant took loan Rs.50000/- of an average Rs.5000/- and 5(23.8%)
poor and marginal peasants took Rs.10000/- (average Rs.2000/-) as co-operative loan.
Same as bank loan, 5(50%) rich peasant took loan Rs.25000/- (average Rs.5000), 4(40%)
middle peasants took Rs.20000/- (average Rs.5000/-) and last of all only 1(10%) poor
and marginal peasant took the bank loan of Rs.1000/- of an average Rs.1000/-.
From the above table it appears that cooperative has never challenged the existing
marketing system by building up an alternative cooperative marketing mechanism. This
system never succeeded in providing real relief to the poor. In the absence of a proper
marketing mechanism, the small and poor peasants cannot make enough profit and as a
result there has been default in timely repayment and once they default, they are naturally
excluded from the ambit of the scheme. In this way the poorer sections are gradually
being cast outside the domain of all institutional help and the richer ones are tightening

186
their grip over these institutions. It has been observed in some cases that influential
persons in the cooperative bodies are drawing ‘loans’ indiscriminately to fund personal
usury ‘business’ which is perhaps the most lucrative one in these days.
(xiv) Role of Panchayat : The name of Gram Panchayat (local government) of this
village is Abujhati-I is governed by the Left Front from the very beginning when the Left
Front Government came into the power in West Bengal. This Gram Panchayat undertook
the land reform programme. The excess land was distributed to the needy peasants in
1980. They also allotted the legal rights on pattas (legal rights) of the lands. Panchayat
also registered the names of sharecroppers as bargadars. This panchayat also undertook
various programmes like, aforestation, road construction and other development plans
(yoyana). Food for work has already been implemented and by this the agricultural
labouers get few days work during the off-season. A total of 30 families have been
enlisted in BPL (Below Poverty Line) list. The villagers have brought corruption charges
against some of the present board members.
A sample survey of different class representative in the gram panchayat members
from time to time is shown in table –XIV, which shows that the representations of rich
and other middle class peasants have increased during the periods 1978 to 1996 and from
1996 to 2006.
In the categories of middle peasants as well as poor peasants and agricultural
labourers, the representations decreased over the years out of total 15 members of
Abujhati Gram Panchayat-I.
Table – XIV
Class-wise composition of panchayat member
Classes 1978 1996 2006
Rich Peasant 3(20%) 4(26.6%) 5(33.3%)
Other middle Class 4(26.6%) 5(33.3%) 6(40.0%)
Middle peasant 5(33.3%) 4(26.6%) 3(20.0%)
Poor Peasant & agricultural labourer 3(20.0%) 2(13.3%) 1(6.6%)
Total Nos. 15 15 15
(Source : Field Data)
Table above gives a sad picture belying all Left Front claims of participation of
poor sections in the pachayats in West Bengal. The present report shows that in 1978 the
members are 79.9% of rich, middle peasants and other rural middle class families
(including school teachers, service holders etc. who are among the most well off sections
187
in the countryside now a days). The corresponding figures in 1996 and 2006 stand at
86.5% and 93.3% respectively.
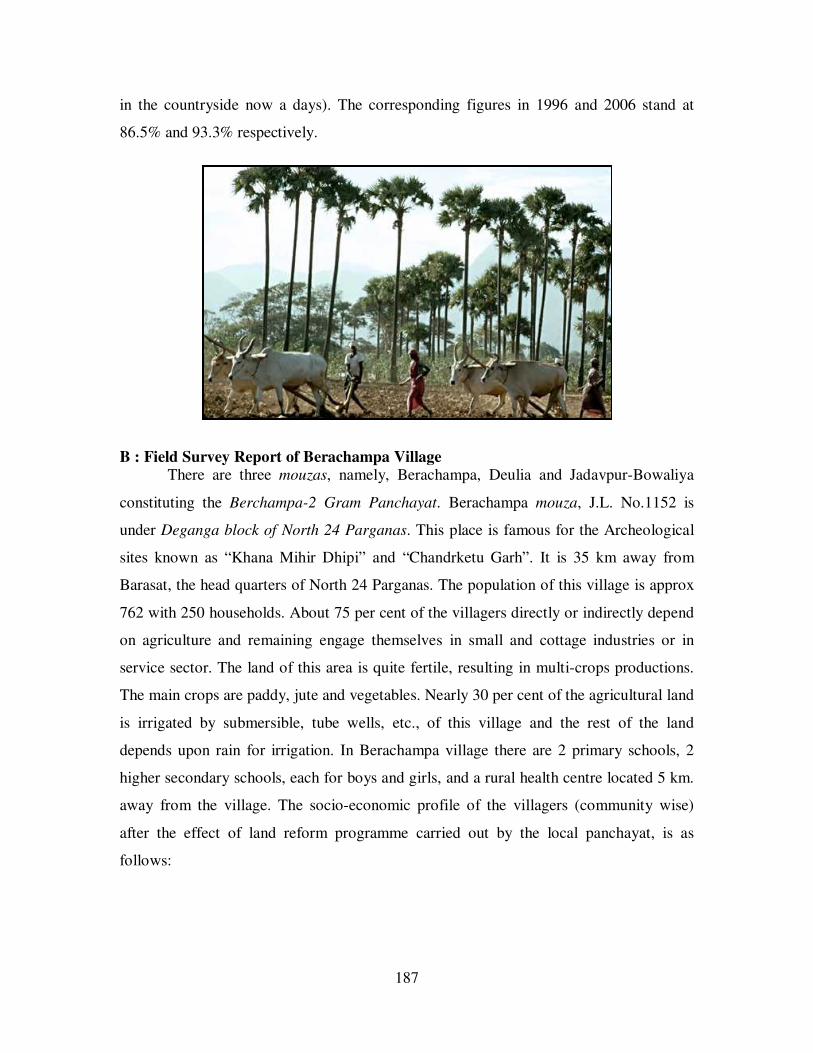
B : Field Survey Report of Berachampa Village There are three mouzas, namely, Berachampa, Deulia and Jadavpur-Bowaliya
constituting the Berchampa-2 Gram Panchayat. Berachampa mouza, J.L. No.1152 is
under Deganga block of North 24 Parganas. This place is famous for the Archeological
sites known as “Khana Mihir Dhipi” and “Chandrketu Garh”. It is 35 km away from
Barasat, the head quarters of North 24 Parganas. The population of this village is approx
762 with 250 households. About 75 per cent of the villagers directly or indirectly depend
on agriculture and remaining engage themselves in small and cottage industries or in
service sector. The land of this area is quite fertile, resulting in multi-crops productions.
The main crops are paddy, jute and vegetables. Nearly 30 per cent of the agricultural land
is irrigated by submersible, tube wells, etc., of this village and the rest of the land
depends upon rain for irrigation. In Berachampa village there are 2 primary schools, 2
higher secondary schools, each for boys and girls, and a rural health centre located 5 km.
away from the village. The socio-economic profile of the villagers (community wise)
after the effect of land reform programme carried out by the local panchayat, is as
follows:

188
(i) Age-sex compositions :
Table-I
Age-sex composition of Berachampa Village
Name of
the
Commu-
nity
Age group (yrs.) Total
population
0-4 5-14 15-44 45-59 60+ Total
M F M F M F M F M F M F
S/C 19
(34.
5%)
17
(36.
1%)
35
(33.
9%)
31
(34.
8%)
56
(37.1
%)
45
(36.
5%)
28
(35.
8%)
27
(43.
5%)
14
(41.
1%)
09
(45%)
152 129
S/T 16
(29.
1%)
11
(23.
4%)
31
(30.
1%)
27
(30.
3%)
43
(28.4
%)
37
(30.
1%)
21
(26.9
%)
14
(22.
5%)
08
(23.
5%)
03
(15%)
119 92
General 20
(36.
3%)
19
(40.
4%)
37
(35.
9%)
31
(34.8
%)
52
(34.4
%)
41
(33.
3%)
29
(37.1
%)
21
(33.
8%)
12
(25.
2%)
08
(40%)
150 120
Total 55
(100%)
47
(100%)
103
(100%)
89
(100%)
151
(100%)
123
(100%)
78
(100%)
62
(100%)
34
(100%)
20
(100%)
421 341
=762
Source : Field Survey & Local Panchayat
NB : S/C= Scheduled Caste, S/T=Scheduled Tribe, General= General Caste
The above table-I shows the age-sex composition of the surveyed households
community wise. In the case of SC there is 19(34.5%) males & 17(36.1%) females in the
age group between 0-4 years followed by 16(29.1%) male and 11(23.4%) female persons
in the case of S/T families and finally in the case of General Caste there are 20(36.3%)
male and 19(40.4%) female persons. Within this age group there are total 55 male and 47
females.
Next under the age group of 5-14 years there are a total of 103 males. Of these,
35(30.1%) persons belong to S/C, 31(34.8%) persons are in S/T and rest 37(35.9%)

189
persons belong to General Castes. Likewise, in the case of 89 females, 31(34.8%) belong
to S/C, 27(30.3%) are to S/T and others 31(34.8%) belong to the General Castes.
In the age group of 15-44 years, we find total 151 males. Of these, 56(37.1%)
belong to S/C, 43(28.4%) are in S/T community and rest 52(34.4%) belong to General
Caste. In case of female, 45(36.5%) belong to S/C community, 37(30.1%) are from S/T
and 41(33.3%) belong to General Caste.
Under the age group of 45-59 years, there are 28(35.8%) male and 27(43.5%)
females belonging to S/C community followed by 21(26.9%) male and 14(22.5%) female
in the S/T community and 29(37.1%) male and 21(33.8%) female are in General Caste.
The total numbers of 78 male and 62 female are in this group.
Finally in the age group of 60 years and above there are 14(41.1%) male and
9(45%) female in SC community followed by 8(23.5%) male and 3(15%) female in the
S/T community, 12(25.2%) male with 8(40%) female represents in the General Caste
category and the total is 34 male and 20 female respectively.

190
(ii) Occupational distribution:
The occupational pattern of the sample households of Berachampa village has
given below Table-II :
Table-II
Occupational distribution of the sample house-holds
Name
of the
commu
nity
Agricultural
labourer
Cultivation Petty
Business
Animal
husbandry
Service Others Total
M F M F M F M F M F M F M F
S/C 45
(49.4
%)
31
(56.3
%)
37
(50.
6%
)
23
(62.1
%)
20
(52.
6%
)
05
(62.
5%
)
06
(31.
5%
)
02
(22.
2%
)
15
(41.6
%)
03
(60.0
%)
11
(52.3
%)
03
(37.5
%)
134 67
S/T 31
(34.1
%)
19
(34.5
%)
11
(15.
1%
)
07
(18.9
%)
01
(2.6
%)
- 05
(26.
3%
)
02
(22.
2%
)
01
(2.7%
)
- 03
(14.2
%)
01
(12.5
%)
52 29
General
Caste
15
(16.4
%)
05
(9.1%
)
25
(34.
2%
)
07
(18.9
%)
17
(44.
7%
)
03
(37.
5%
)
08
(42.
1%
)
05
(55.
5%
)
20
(55.5)
02
(40.0
%)
07
(33.3
%)
04
(50.0
%)
92 26
Total 91
(100%)
55
(100%)
73
(100
%)
37
(100%)
38
(100
%)
08
(100
%)
19
(100
%)
09
(100
%)
36
(100%)
05
(100%)
21
(100%)
08
(100%)
278 122
=400
Source : Field Survey
Table above shows that in the category of agricultural labourers, 45(49.4%) male
and 31(56.3%) females belonging to SC community. Likewise in the case of S/T
community, we see 31(34.1%) male and 19(34.5%) female and in the General Caste
category, there is 15(16.4%) male and 5(9.1%) female out of total 91 male and 55 female
respectively in this village.
In the cultivator category, 37(50.6%) male and 23(62.1%) female belong to SC
community. In S/T community, there are 11(15.1%) male and 7(18.9%) female and last
General Caste category, 25(34.2%) male and 7(18.9%) female representing out of total
73 male and 37 female.

191
In the case of petty business, it is found 20(52.6%) male and 05(62.6%) female
belonging to SC community, in the S/T community there is 1(2.6%) male and none
female and in the General Caste Category, there is 17(44.7%) male and 3(37.5%) female
out of total 73 male and 37 female respectively.
In case of animal husbandry, there are 19 males. Of these 6(31.5%) belong to S/C,
5(26.3%) in S/T and 8(42.1%) belong to General Castes. Likewise in female, it is found
total 9 females. Of these 2(22.2%) in S/C, 2(22.2%) belong to S/T and rests 5(55.5%) are
in General Castes.
In the service sector, the SC community, there are 15(41.6%) males and 3(60.0%)
females. In the S/T community, there is 1(2.7%) male and none female and in the General
Caste category there is 20(55.5%) male and 2(40.0%) female out of total 36 males and 5
females.
And in others it is seen that 11(52.3%) males and 3(37.5%) female belong to S/C
community. In the ST community, there is 3(14.2%) male and 1(12.5%) female and in
the General Caste category, 7(33.3%) male and 4(50.0%) female represents out of total
21 male and 8 female.

192
(iii) Land Distribution :
Table-III provides the average of land ceiling surplus and patta (legal rights)
distribution organised by local panchayat under the land reform programme. Author
himself on the basis of field survey and from local panchayat collected data on land titles
distributed for the relevant village.
Table-III
Land Reforms Implemented : Sample Average
Source : Field Survey and Local Panchayat
Above Table shows the numbers of beneficiaries with patta holders, total numbers
of beneficiaries with percentage and area of land distributed in bighas among the
beneficiaries.
In this category, we find that 32 males and 10 females have been given 0-1 bigha
of land. Of the 32 males, 15(46.8%) belong to S/C, 8(25.0%) are from S/T and 9(28.1%)
to General Castes. Of the 10 females, 5(50%) are from S/C, 2(20%) from S/T and 3(30%)
belong to General Castes.
5 males and 2 females have been given 1-2 bighas of land. Amongst, 5 males,
2(40.0%) belong to S/C, 1(20.0%) from S/T and 2(40.0%) are belonging to General
Castes. In the category of females, 1(50%) represent S/C, 1(50.0%) is found in the S/T
and none to General Caste category out of total 2 females.
The total numbers of beneficiaries are 49. Out of them 23(46.9%) beneficiaries
belong to S/C, 12(24.4%) represents to S/T and 14(28.5%) are in the General Caste
Category.
Name of the
community
Number of beneficiaries (persons in sex
ratio) & patta (legal rights) holders
Total
number of
beneficiaries
and
percentage
Area of
land
distributed
(in bigha) 0-1
bigha 1-2 bigha
M F M F Total (%)
S/C 15 (46.8%)
5 (50.0%)
2 (40.0%)
1 (50.0%)
23 (46.9%) 24 (52.1%)
S/T 8 (25.0%)
2 (20.0%)
1 (20.0%)
1 (50.0%)
12 (24.4%) 10 (21.7%)
General Caste
9 (28.1%)
3 (30.0%)
2 (40.0%)
-
14 (28.5%) 12 (26.1%)
Total 32 (100.0%)
10 (100.0%)
5 (100.0%)
2 (100.0%)
49(100%) 46(100%)

193
Under the vested land distribution programme, 46 bighas have been distributed
among the poor families. Amongst, 24(52.1%) bighas distributed to the S/C communities,
10(27.1%) bighas distributed to the S/T families and rest 12(26.1%) bighas have been
distributed to the General Castes.
On the above table, it is seen that the 46.9% Scheduled Caste families holding
52.1% of land have been benefited more than other two categories and S/T communities
who comprises 24.4% and holding 21.7% of total vested distributed land are the deprived
one.
(iv) Bargadars (sharecroppers) registration :
Table –IV shows the number of recorded bargadars (sharecroppers) in the village
of Berachampa under the land reform programme who are holding 0-2 bighas.
Table –IV
Recording of Bargadars (sharecroppers)
Source : Field Survey & Local Panchayat
Above table shows the recorded bargadars (sharecroppers), which represents 47
males and 13 females. In case of SC community, there are 19(40.4%) males and
8(61.5%) females. In the S/T community, 13(27.6%) males and 3(23.1%) females and in
General Caste community 15(31.9%) males and 2(15.3%) females were recorded as
bargadars.
The above table also shows the community-wise beneficiaries. The S/C
communities comprise 27(45%), S/T represents 16(26.6%) and the General Castes are
17(28.3%), out of total 60 beneficiaries.
60 beneficiaries were recorded as bargadars. 62 bighas were recorded as barga
land. If we compare the total number of beneficiaries and total barga land, we see 45.0%
Name of the
community
Number of bargadars
(sharecroppers)
persons in sex ratio
Total number of
bargadars
(sharecroppers)
recorded
Areas of lands
recorded
(in bighas)
M F Total (%) (Total %)
S/C 19(40.4%) 8(61.5%) 27 (45.0%) 29 (46.7%)
S/T 13(27.6%) 3(23.1%) 16 (26.6%) 15 (24.1%)
General Caste 15(31.9%) 2(15.3%) 17 (28.3%) 18 (29.1%)
Total 47 13 60 (100%) 62(100%)

194
S/C community shares 46.7% of barga (recorded) land. 26.6% S/T community shares
24.1% land and 28.3% General Caste community holding 29.1% of total recorded (barga)
land. So, it is seen that the S/C communities have been benefited on the basis of above
data.
(v) Owner cultivator-cum-share croppers :
Table-V
Owner cultivator –cum- share cropper
No. of SC
households share
cropping land of
the size of 1-2
bighas
No. of ST
households share
cropping land of
the size of 1-2
bighas
No. of General
Caste households
share cropping land
of the size of 1-2
bighas
Total no. of
house holds
11(55.0%) 6(30.0%) 3(15.0%) Total=20
Source : Field Survey
The Table-V shows the owner cultivator-cum-share-croppers of Berachampa
village where a piece of cultivation land owned by an owner cultivator and of other’s
land as a share-cropper. The cultivators are mainly poor and marginal and 20 households
involved in this village.
On the above table, we find that among those owning 1-2 of land, 11(55.0%)
belong to S/C community, 6(30.0%) belong to S/T community and 3(15.0%) belonging
to General Caste category.
(vi) Condition of the Agricultural Labourers :
The agricultural labourers get hardly six months work in this village and their
daily wages average Rs.50/- and 1Kg. of rice per day during cultivation season. During
the rest of the period these labourers visit urban areas especially, Kolkata or Barasat for
various of works. Most of the wives of the agricultural labourers families works as daily
wage basis. The economic condition of these families is very grim. They can afford meal
only once a day to their children in off-season. Their children hardly continue their
studies up to primary level due to poverty. Most of the children of agricultural labourers
are admitted to primary school for the attraction of mid day meal. I have observed this in
Shiromoni village. Some times, local panchayat tries to involve agricultural labourers in
different types of rural programmes and training during the off-season.

195
(vii) Landless Share-Cropper:
The landless sharecropper households are very poor and maintain their existence
in pitiable struggle to get some land for cultivation on crop-share to keep them alive.
Table-VI shows that the total landless share-cropper households, representing
11(44.0%) house holds in SC category, 6(24.0%) house holds in S/T community and
2(32.0%) house holds in the General Caste category out of total 25 households who
cultivate others’ land as share croppers. The size of the land share-cropped by them is
shown below :
Table-VI
Landless Share-Cropper
Community
No. of households share cropping land
of the size of
No. of house holds
0-1 bighas 1-2 bighas
SC 8(42.1%) 3(50.0%) 11(44.0%)
ST 5(26.3%) 1(16.6%) 6(24.0%)
General Caste 6(31.5%) 2(33.3%) 8(32.0%)
Total 19(100%) 6(100%) 25(100%)
Source : Field Survey
In all, 19 households are share-cropping 0-1 bighas. 6 households sharecrop 1-2
bighas in this village. It shows 8(42.1%) households are S/C, 5(26.3%) are ST and
6(31.5%) belonging to General Caste category share cropping of the size of 0-1 bighas. In
the size of 1-2 bigha category, 3(50.0%) belong to S/C, 1(16.6%) is S/T and 2(33.3%) are
General Castes.
(viii) Agricultural System :
The cultivation land of this village is very fertile which promotes production of
multi-crops. 40% of the agricultural land is irrigated by submersible, private tube wells
etc. and rest of the land depends upon rain for irrigation. The cultivators are also using
high yielding seeds, chemical fertilizers, bio-fertilizers, tractors etc. for modern
cultivation.
(ix) Cultivation of Paddy :
Most of the cultivators of this village depend entirely on monsoon for their
cultivation. All the agriculturist households of this village grow paddy in monsoon
months (June-July) when rain starts in Bengal. But with the development of agricultural

196
systems the season starts earlier. In the month of March-April the boro cultivation is held.
In early June with the onset of monsoons, after one or two heavy showers, the Aus paddy
cultivation starts and at the end of August the peasants of the Berachampa village
prepares for Aman cultivation. Harvesting usually commences on at the beginning of
January. When the paddy is ripe it reaped in the middle with sickles or reaper machine.
The paddy is usually brought home either in bullock carts, tractors or by the cultivators
themselves as mentioned in Shiromoni village.
(x) Harvesting Expenses :
The harvesting expenses of Aman Paddy of this village is given below:
Table-VII
Harvesting Expenses of Aman Paddy per bigha
Sl. No. Harvesting Expenses Amount (Rs.)
1 Tractor Expenses @ Rs.160/- per hour
x 2=00 hrs.
300=00
2 Agricultural Labour expenses :
(a) Resizing field
(b) Paddy Plant (roya)
(c) Weeding
@ Rs.50/- x 2=
@ Rs.50/- x 4=
@ Rs.50/- x 3=
100=00
200=00
150=00
3 Seeds (swarna, ranjit etc.) cost @ Rs.150 per bigha 150=00
4 Paddy Cutting, Jharai, Bundles etc.
as per contract
@ Rs.500=00 500=00
5 Carrying charges from field @ Rs.60/- x 3= 180=00
6 Jharai @ Rs.60/- x 3= 180=00
7 Fertilizers Charges @ Rs.5/-x 20 kgs. 100=00
8 Pesticides Spray @ Rs. 150/- per lit. 150=00
Total Expenses : 2010=00
Source : Field Survey
Ten jute bags of rice are obtained from 1 bigha of land, 1 bag consists of 60 kgs.
rice. These bags have been sold in the open market of this village at an average rate of
Rs. 300/- per bag. Thus the total earning of a peasant amounted to Rs.300/- x 10=
Rs.3000/-. And their expenses amounted to Rs.2010/- or around Rs.2000/-. Thus the net
income of a peasant is Rs.(3000-2000)= 1000/- per bigha. If a marginal peasant have 3
bighas of cultivation land then he can earn hardly Rs.1000/- x 3= Rs.3000/- in a year by

197
Aman cultivation. If the earning by other cultivation of Aus, vegetables etc. are included,
he can earn around Rs.4000/- per annum. The monthly average income of a marginal
peasant who owns 1-3 bighas of land is Rs.4000/12=Rs.334/- only.
(xi) Monthly Income :
Table VIII shows the distribution of the households by income of Berachampa
village.
Table-VIII
Monthly Income & Occupation
Occupation
1
Households with monthly income of No. of
households
7
Less than
Rs.1000/-
2
Rs.1001/- to
Rs.2000/-
3
Rs.2001/- to
Rs.3000/-
4
Rs.3001/- to
Rs.4000/-
5
Rs.4000/- to
Rs.5000/-
6
Cultivation 15(83.3%)* 5(41.6%) 4(33.3%) 6(42.8%) 5(55.5%) ** 35
Business 1(5.5%) 4(33.3%) 3(25.0%) 4(28.5%) 3(33.3%) 15
Other
Services
2(11.1%) 3(25.0%) 5(41.6%) 4(28.5%) 1(11.1%) 15
Total 18(100%) 12(100%) 12(100%) 14(100%) 9(100%) 65
Remarks :* cultivator category includes the Agricultural Labourer
**cultivator category includes the trade
Source : Field Sources
The data of monthly income and occupation of the villagers of Berachampa
Represent that 18 households’ income are less than Rs.1000=00. Of these 15(83.3%)
households are cultivators where the agricultural labourers included. 1(5.5%) household
engaged in Business and 2(11.1%) are found in other services.
In column 3, we find that 12 households whose monthly income is Rs.1000=00 to
Rs.2000=00. Of these, 5(41.6%) households are cultivator, 4(33.3%) households are
engaged in business and 3(25.0%) households are in other services.
Column no. 4 shows 12 households whose monthly income varies between
Rs.2001=00 to Rs.3000=00. Of these 4(33.3%) households belong to cultivators,
3(25.0%) households belong to business and 5(41.6%) households belong to other
services.
In column no. 5, present 14 households whose monthly income is Rs.3001=00 to
Rs.4000=00. Of these 6(42.8%) households are engaged in cultivation as cultivators,

198
4(28.5%) households in business and other 4(28.5%) households engaged in other
services.
Column no. 6 shows 9 households with higher income of Rs.4001=00 to
Rs.5000=00. Where 5(55.5%) households engaged in cultivation, 3(33.3%) households in
business and rest 1(11.1%) household in other services.
It shows that the cultivator which includes agricultural labourers, whose monthly
income is less than Rs.1000=00, are more in numbers (93.3%) than other categories and
their economic condition is very poor which may be referred to BPL list.
(xii) Monthly Expenditure :
It is very difficult task to ascertain its expenditure on different heads. But we have
tried here to put an idea by our field investigation.
Table-IX
Head wise monthly expenditure of rural poor households
Occupation Head Total
expenditure
No. of
Households Food &
Clothing
Misc. and
Fuel
Children
education and
medical treatment
Cultivation* Rs.1200/- Rs.100/- Rs.100/- Rs.1400/- 20(50.0%)
Agricultural
Labourer
Rs.800/- Rs.50 Rs.50/- Rs.900/- 10(25.0%)
Other Labourers Rs.700/- Rs.50/- Rs.50/- Rs.800/- 10(25.0%)
Total Rs.3100/- 40(100%)**
Remarks: * Poor cultivators including sharecroppers whose land holding 1-2 bigha
** Average of family members are 4 persons
Source : Field Survey
Table-IX shows the average sample head-wise monthly expenditure of the rural
poor households in Berachampa village. Out of 40 households, with family members
averaging 4 persons, 20(50%) households comprised of poor and marginal peasants
including sharecroppers holding 1-2 bigha of land having a monthly expenditure up to
Rs.1400/-. 10(25.0%) households of agricultural labourers’ having a monthly expenditure
of Rs.900/- only and 10(25.0%) households of other labourers jobs, spend up to Rs.800/-.
Naturally most of these households are debt. In this respect, the condition of these
households resembles that of their counterparts in Shiromoni village.

199
(xiii) Indebtedness :
Table-X shows of indebtedness of villagers in Berachampa village. It is seen that
most of the households i.e. 30 households (60%) incurred loan for domestic needs
including medical treatment i.e. Rs.30000/-(78.9%) of the total loan of Rs.38000/-, 5
households (10%) incurred loan of Rs.2500/-(6.5%) for marriage ceremony and 2(4%)
households took loan of Rs.300/- (0.7%) for sraddha ceremony, 2% or 1 household
incurred of Rs.200/-(0.5%) of total loan for worship of a deity, 7.8% loan incurred by 7
households (14%) for cultivation of land and 3.9% or Rs.1500/- took loan by 3
households (6%) for purchase land and 2 households (4%) out of a total of 50 households
incurred Rs.500/- (1.3%) for misc. purposes. Most of these loans are taken from the
private sources and some from commercial bank.
Table-X
Purpose of Loans
Purposes of Loans No. of households
in debt
Percentage of
Indebted households
Amount of
Loan
Percentage to
total loan
Domestic needs 30 60% Rs.30000/- 78.9%
Marriage Ceremony 5 10% Rs.2500/- 6.5%
Sraddha Ceremony 2 4% Rs.300/- 0.7%
Worship of a deity 1 2% Rs.200/- 0.5%
Cultivation of land 7 14% Rs.3000/- 7.8%
Purchase of land 3 6% Rs.1500/- 3.9%
Misc. 2 4% Rs.500/- 1.3%
Total 50 100% Rs.38000/- 100%
Source : Field Survey

200
Table XI shows the changes in ownership pattern of land, uses of modern
equipments, distribution of institutional loans and resurgence of usury loans and
participation of different classes in rural self-government (local panchayat) of
Berachampa village during 1978 to 2006.
Table – XI
Ownership of pattern and shifting of relative position
Differe
nt
Classes
Relative position of different classes Total land holdings by different class
categories (in bighas)
1978 1996 Shift 2006 Shift Shift 1978 1996 Shift
2006 Shift
1978-
1996
1996-
2006 1978-
1996
1996-
2006
1978-
2006 Rich Peasant
22(22.0%)
20(20.0%)
-2.0% 25(25.0%)
+5.0% +3.0% 80(45
.71%)
55(31
.42%)
-
14.29
%
70(40.
0%
+8.58
%
Middle Peasant
30(30.0%)
25(25.0%)
-5.0% 35(35.0%)
+10% +5.0% 50(28
.57%)
40(22
.85%)
-
5.72%
50(28.
57%)
+5.72
%
Poor
Peasant
30(30.
0%)
25(25.
0%)
-5% 28(28.
0%)
+3.0% -2.0% 40(22
.85%)
65
(37.1
4%)
+14.2
%
45(25.
71%)
-
11.43
% Marginal
Peasant
& other
toilers
25(25.0%)
15(15.0%)
-10% 20(20.0%)
+5.0% -5.0% 5(2.8
5%)
15(8.
57%)
+5.72
%
10(5.7
1%)
-
2.86
%
Total : 100
(house
holds)
100
(house
holds)
100
(house
holds)
175(bi
ghas)
175(bi
ghas)
175(big
has)
(Source : Field Data and Local Panchayat)
In comparison with 1978 and 1996 the relative positions of different classes of
Berachampa village, we see rich peasants decreased by -2.0%, middle peasant declined
by -5.0%, poor peasants also declined by -5.0% and marginal peasants including other
toilers decreased by -5.0%. On the other hand, in comparison to 1996 - 2006, it is seen
that the rich peasants shift increased to +5.0%, the middle peasants shift +10.0%, the
poor peasants increased to +3.0% and marginal with other toilers shift +5.0%
respectively. If we look at the comparison between 1978 and 2006 in the 29 years of Left
rule, we find that the rich peasants have increased to +3.0%, the middle peasants
increased to +5.0%, poor peasants declined by -2.0% and marginal peasants including
other toilers declined by -5.0%. If we look at the upper classes of this village (the rich
peasants + middle peasants) who have increased to +8.0% and the lowest rungs (poor +
marginal peasants + other toilers including agricultural labourers) declined by -7.0%.
201
According to the position of land holdings between 1978 and 1996, the rich
peasants holding 15-30 bighas of land declined by -14.29% after the Left Front
Government came to the power in West Bengal in 1977 and introduced land reform
programme. The middle peasants who holding 5-10 bighas also came down by -5.72%
and on the other hand the weaker sections like poor and marginal peasants who holdings
1-5 bighas are found increased to +14.29% and +5.72% respectively due to of land
reform programme. But the reverse features are shown in comparison between 1996 and
2006, the investigation shows that the rich peasants increased to +8.58%. The middle
peasants also increased +5.72%. The poor peasants (who owns 1-3 bighas) have heavily
lost their land and declined by 11.43% and other toilers category (who owns 0.1<1
bighas) decreased by 2.86%.
The rich and middle peasant sections are increasing in 2006 compare to 1996 of
this village and these sections are shaped by the constraints of production on the one hand
and political allegiance on the other.
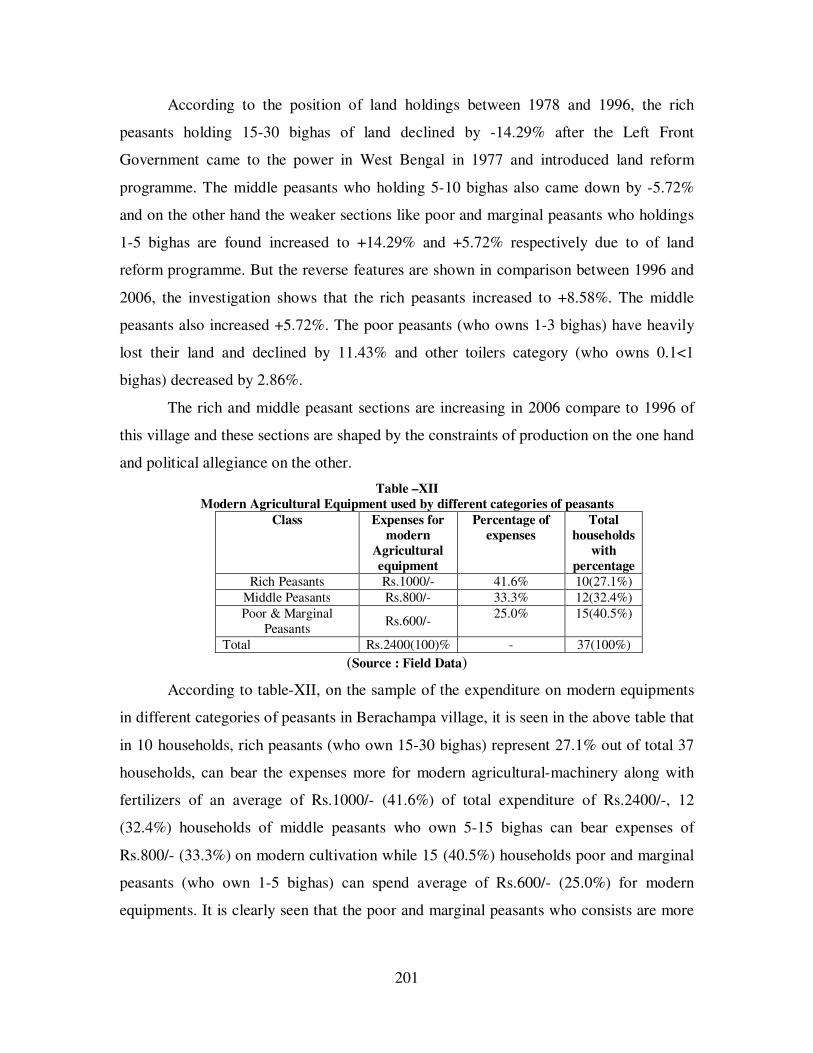
Table –XII
Modern Agricultural Equipment used by different categories of peasants
Class Expenses for
modern
Agricultural
equipment
Percentage of
expenses
Total
households
with
percentage
Rich Peasants Rs.1000/- 41.6% 10(27.1%)
Middle Peasants Rs.800/- 33.3% 12(32.4%)
Poor & Marginal
Peasants Rs.600/-
25.0% 15(40.5%)
Total Rs.2400(100)% - 37(100%)
(Source : Field Data)
According to table-XII, on the sample of the expenditure on modern equipments
in different categories of peasants in Berachampa village, it is seen in the above table that
in 10 households, rich peasants (who own 15-30 bighas) represent 27.1% out of total 37
households, can bear the expenses more for modern agricultural-machinery along with
fertilizers of an average of Rs.1000/- (41.6%) of total expenditure of Rs.2400/-, 12
(32.4%) households of middle peasants who own 5-15 bighas can bear expenses of
Rs.800/- (33.3%) on modern cultivation while 15 (40.5%) households poor and marginal
peasants (who own 1-5 bighas) can spend average of Rs.600/- (25.0%) for modern
equipments. It is clearly seen that the poor and marginal peasants who consists are more

202
in numbers than other categories can not afford more expenses for modern cultivation
due to their poverty.
Table -XIII shows the usury loan and bank loan of this village which have been
taken by different classes in the financial year of 2005-06.
Table –XIII
Distribution of loans among different classes
(Financial year 2005-2006)
Class No. of
families
Total
among of
usury loan
(Rs.)
Takers of
usury loan
Average
amount per
family (Rs.)
Total
amount
of Bank
loan (Rs.)
Takers of
Bank
loan
Average
amount
per
family (Rs.)
Rich
Peasant
20 10,000 4(15.3%) 2,500 30,000 10(22.2%) 3,000
Middle
Peasant
30 15,000 3(11.5%) 5,000 40,000 15(33.3%) 2,667
Poor
Peasant
40 30,000 15(57.6%) 2,000 5000 5(12.5%) 500
Marginal
Peasant
and Other
Toilers
10 5,000 4(15.3%) 1,250 5000 10(22.2%) 500
Total : 100 60,000 26(100%) 10,750 80,000 40 6,667
(Source : Field Data & local bank)
It is seen that 4(15.3%) rich peasants have taken usury loan of Rs.10000/- and in
average of Rs.2500/- out of 20 households, 3(11.5%) middle peasants took Rs.15000/-
(average Rs.5000/-) out of 30 households, poor peasants 15(57.6%) households out of
total 40 households took Rs.30000/- (average Rs.2000/-) and marginal peasants and other
toilers 4(15.3%) households out of total 10 households took Rs.5000/-(average Rs.1250/-
) as usury loan. Likewise bank loan is also reflected in the table. It is observed on the
above table that the poorer sections are gradually being cast outside the domain of all
institutional help and the richer are tightening their grip over these institutions during
Left rule in rural Bengal.
Role of Gram Panchayat : The Berachampa No. 2 Gram Panchayat was formed after
the elections in 1978 and took some remarkable steps for the improvement in the field of
agriculture. These are : (i) recovery of vested land (ii) enrolment of share croppers (iii)
providing proper wages to agricultural workers (iv) construction of rural roads (v)
improvement of water & irrigation facilities (vi) improvement the rural health centre (vii)
various self employment scheme (viii) providing loan at minimum interest etc.

203
Adopting these programmes, the panchayat has helped the villagers especially the
small, marginal and Agricultural labourers. Under the self-employment scheme, many
unemployed youths and small cottage industries have become established after obtaining
the training provided by the Panchayat. The Panchayat also utilized the fund under the
“Jawhar Rojgar Yojana” “IRDP”, etc. properly.
But in 90’s the work under these schemes declined because the fund provided to
them had decreased to a very great extent. As per the allegations of the villagers, the
corruption of some of the panchayat members was also one of the factors resulting in this
decline. The agricultural workers and unemployed youths were much affected due to the
stoppage of “food against work” Project. The repair and construction of the road and
water and irrigation projects has come to a halt because of shortage of funds. The
“Antyodaya and Annapurna Yojana” could not be implemented properly. There have
been many allegations regarding the distribution of BPL (Below Poverty Line) cards. The
villagers have accused the panchayat members of political favouritism. But it can not be
denied that in spite of all these existing problems, there has been a remarkable
improvement in the village benefiting all the villagers especially the poor, unemployed
and landless labourers.
A sample survey of different class representative in the gram panchayat members
from 1978-2006 in Berachampa Gram Panchayat-2 is shown in Table-XIV.
Table – XIV
Class-wise composition of panchayat member
(Source : Field Data)
It is seen that the representation of rich and other middle class peasants have
increased from 1978 to 1996 and from 1996 to 2006. In the categories of poor peasants
and as well as agricultural labourers, the representations decreased over the years out of
total 15 members.
It is revealed from the above table more than 12 members are representing from
rich, middle peasants and other rural middle class families (including school teachers,
Classes 1978 1996 2006
Rich Peasant 4(26.6%) 5(33.3%) 6(40.0%)
Other middle Class 3(20.0%) 4(26.6%) 5(33.3%)
Middle peasant 5(33.3%) 4(26.6%) 3(20.0%)
Poor Peasant & agricultural
labourer
3(20.0%) 2(13.3%) 1(6.6%)
Total Nos. 15 15 15

204
service holders etc. who are among the most well off sections in the countryside now a
days). Only 3 members came from lower middle class, poor peasants and agricultural
labourer families in 1978 out of total 15 members panchayat. The corresponding figures
in 1996 and 2006 increased at 13 and 14 members respectively of rich, middle peasants
and middle classes. On the other hand the rural sections stand at 1 and 2 member
respectively of Berachampa gram panchayat –2 of Berachampa village (North 24-
Parganas District).
The picture tells us that panchayat movement did a good deal of mass
involvement in its early days but after 29 years of Left rule the rich people have
strengthened their position in the institution of self-governance.
C. Effects of New Economic Policy on villagers
Important changes in cultivation (e.g. multi-cropping, the shift from rain-fed to
irrigation dependent farming in many areas) and a certain degree of development of
productive forces (in inputs like HYV seeds, machinery, techniques, skills) over the past
two decades have led to appreciable changes in inter-class and intra-class relations in the
society of both villages.
Consequently, the cost of agricultural production has increased because the cost
of chemical fertilizers, pesticides and irrigation which has increased many folds. The
increases in price of agri-inputs are attributed to the implementation of New Economic
Policy.
A growing diversification of the rural economy is manifested in the proliferation
of off-farm employment and sideline occupations and a large number of small cultivators
especially agricultural labourers shift from cultivation to “house hold industries, small
rural industries, salaried jobs” etc. The workforce engaged in cultivation has come down
due to decline in profits and the pressure of Globalization.
The fertility of land has decreased considerably due to use of high amount of
pesticides, insecticides, chemicals etc. especially for the boro paddy cultivation and
vegetables. For this modern cultivation a greater volume of groundwater is needed.
Withdrawal of excessive ground water results in the receding of water table in both the
villages. Shortage of drinking water occurs in the summer seasons.

205
During my survey I was surprised to find that most of the marginal and small
peasants are not interested in the cultivation of boro rice production due to its heavy
harvesting expenses. Only the middle class peasants are interested for cultivation boro
rice. On the contrary, the bargadars (sharecroppers) including the poor and marginal
peasants have contract with rich peasants for cultivation of boro rice.
In many cases, the small and marginal peasants’ have been found to sell their
piece of land in both the villages, which they have under by the Land Reform
Programme.
To conclude, the agricultural labourers, especially, the landless agricultural
labourers have increased tremendously and they have hardly managed six months job in
the villages.
In both the villages viz-a-viz Shiromoni and Berachampa, it is found that most of
the landless families are having only 1.55 kathas of homestead land. That the number and
percentage of agricultural labourers and poor peasants having land up to 1 acre is
extremely rare. However, the percentages of poor, marginal peasants and agricultural
labourers have increased both in the villages during 1996-2006.
CONCLUDING REMARKS
During the two rounds of my fieldwork in Shiromoni and Berachampa village a
total of 200 farmers were interviewed of which 105 owned all of the land they cultivated.
They had acquired this land through purchase, inheritance or land reform. 4 farmers
owned a portion of the land they farmed and were bargadars or tenants a portion of their
total holding, 50 farmers were bargadars on all of the land they cultivated and 41
interviewees neither owned nor sharecropped land, but worked as landless agricultural
labourers. The largest landowning farmer at Shiromoni village cultivates 31 bighas. The
largest land owner cultivates 24 bighas at Berachampa village. However, the average
holding size of owner-cum-bargadar and bargadars only were 2-5 bighas and 1-3 bighas
respectively.

206
Farmer-Interviewees by Village and Agricultural Landholding
Village Owners only Owners/Bargadars Bargadars only Landless Total
Shiromoni 50 1 30 19 100
Berachampa 55 3 20 22 100
Total 105 4 50 41 200
Source : field survey
Rice is the most commonly cultivated crop of the farmers. Some were able to
plant two crops of paddy per year, but many stated that lack of access to water and high
prices of inputs kept them from cultivating a second crop. A few farmers grew boro rice,
jute, etc. as their second crop and a handful of farmers owned or leased mango gardens
during mango season. Corn, pulses, potatoes and other vegetables fruits are grown as the
Rabi season cultivation.
The present survey shows the community-wise age-sex ratio, occupational
pattern, land distribution, recording of bargadars, landless sharecroppers, conditions of
agricultural labourers etc. of both the villages. It is found that the land reform has had a
significant impact on both the villages. Peasants reported that above-ceiling land had
been redistributed to poor farmers in the villages. Most of this land had been allocated as
agricultural land parcels, although some had been allocated as homestead plots. Those
who received vested agricultural land received very small amounts, ranging from 0.1 to 2
bighas. Most interviewees reported that all or the great majority of those who received
vested agricultural land in their villages had been poor, marginal, agricultural labourer or
completely landless. Some peasants stated that not all households in their village had
received vested agricultural land under land reform distribution programme. At least
some peasants stated that households that were close to the party in power were more
likely to receive benefits. One peasant of Berachampa village stated that most of the
vested agricultural land was given to bargadars rather than those who had not access to
land. Most interviewees who commented on the relative effectiveness of the land
redistribution stated that those who had received agricultural land had realized significant
livelihood improvements with some exceptions. After implementation of new economic
policy in India when inputs of the cultivation has been raised much and the stagnation of
land reform programme in rural Bengal, it was too much difficult for the peasants to
continue cultivation. They are not getting proper price for their crops. Some peasants of

207
both the villages admitted that some of those beneficiaries had mortgaged their land away
to big farmers. A farmer of the Shiromoni village who had received vested land reported
that while the former owner had produced three crops per year, he was only able to
produce two crops per year. At least some households in 5 of the two villages where
above-ceiling land had been redistributed had received homestead plots in the land
reform or other government schemes. The homestead plots allocated were extremely
small, typically about 1700 square feet or less. Even on such tiny plots, these
interviewees and other who had received tiny household plots were growing vegetables
or hand planted fruit trees for household consumption. Agricultural labourers who lacked
home plots told of the difficulties they faced. They often leased small shelters from larger
farmers for whom they worked as labouers or bargadars. Those who sharecropped said
they could not risk recording as a bargadar because they would be evicted from their
home. Others also discussed the perils and powerlessness of being an at-will residential
tenant in a shelter owned by their employer, suggesting that receiving even a small
homestead plot could provide substantial social and economic benefits.
Regarding Operation barga, it is mentioned that it is widely evident, although not
universally implemented. It appears, consistent with village-level studies that a minority
of bargadars has chosen not to record their rights, usually because they wanted to
maintain, or feared not maintaining a good relationship with the landowner. Recorded
bargadars (and al least some unrecorded bargadars) have received significant benefits
from the anti-eviction and rent control provisions in the law and as a result have been
empowered in their relationships with landlords. The most significant finding concerning
bargadar relationships, is that many recorded bargadars have made or are now making
voluntary arrangements with their landowners in which they receive full ownership of a
portion of the barga land in exchange for releasing their barga rights to the remaining
land. It has also been observed that the S/T communities especially, the females of all
communities are heavily deprived.
For share cropping arrangements the land reform act provides that the bargadar
must turn over 50% of the crop if the landowner supplies the non-labour inputs and 25%
of the crop if the bargadar provides such inputs. But I found different sharecropping
arrangements between landowners and bargadars in both the villages. Some where

208
bargadar provides all inputs and receives 75% of crop, bargadar provides all inputs and
receives 67% of crop, landowner provides cash inputs and crop split 50 : 50, bargadar
provides all inputs and receives 75% of crop and bargadar receives 50% of crop if owner
provides cash inputs and 75% of crop if bargadar provides all inputs. One recorded
bargadar, I interviewed, who was paying more than the legal limit realized that he was
legally entitled to keep a larger share but he gave three reasons for his decision to give
the landowner more than legally required share : (1) the landowner was very poor (2) the
bargadar had a close, trustful relationship with the landowner and (3) the landowner used
the proceeds for betterment of the village. In other interview, 4 bargadars of these two
villages informed that they had not recorded their rights due to some reasons. In 3 of the
4 cases the share arrangements were less favourable to the bargadar than those provided
by barga law.
The agrarian structure of West Bengal before the reforms was characterized by
both a relatively high incidence of landlessness and a relatively equal distribution of
landholdings among those with land. It is estimated that the incidence of landlessness in
pre-reform, rural West Bengal was at least one-third. Despite land reform successes in
West Bengal, rural landlessness remains a significant problem in many localities.
National Sample Survey data from 1996-1997 indicates that 9% of all agricultural rural
households in West Bengal still owned absolutely no land at that time, slightly higher
than the all-India figure of 8.1%. Another 44.5% are marginal landowners in West
Bengal, owning less than 1 bigha. The corresponding all-India figure is 34.3%. My field
work results are consistent with village-level data indicating that much of the
landlessness in West Bengal is concentrated in “pockets”. 50 peasants of the Shiromoni
village reported that at least half of the village households were landless and also fifty
peasants of the Berachampa village stated that three-quarters of the households in the
village were landless. While some landless households in villages I visited, were earning
income from other sources, the great majority relied on agricultural labour as the primary
source of household income. The wages of Agricultural labourers ranged from 50-60
rupees per day for males and 40-50 rupees for females with average of 1kg. rice in 2006.
Interviews from both the villages reported that agricultural wages had increased over the
past five years. The reported increases ranged from 60 to 100% over the ten-year period.

209
Earlier official data shows that real wages of agricultural labourers had already risen
sharply in the 1980s, shadowing the trend in agricultural output during this period.
According to data furnished by the Economic and Statistical Department, Govt. of
West Bengal, despite some amount of trimming of the big holdings, number of owners
holding more than 10 acres of land remains the same in the 90s as in the pre-1978 period.
The present investigation shows an increase in the number of both big landlords
(jotedars) (who own 30 bighas of land or more) and rich peasants (who own 15-30
bighas) use more than 30% of modern agro-machinery. Thus, a gradual strengthening of
the position of the rural rich is seen. As far as the lowest rungs are concerned, a slight
decline in the landless and other toilers’ category (who own 0.1-1 bighas) is evident. The
poor peasants (who own 1-3 bighas, and are basically toilers too), if taken together, the
rural poor constitute the largest cross-section of the rural population that has swelled up
in the Left Front rule. The maximum differentiation and flux has been experienced by the
middle peasants by about 14.8% (total of both villages), through an upward mobility.
They have transformed themselves into rich peasants and 1.2% (total of both villages)
raised into landlords (jotedars), while a big section has slipped into lower categories,
16% (total of both villages) to poor peasantry and 4% (total of both villages) to the
landless.
The investigation shows an increase of the poor peasantry and agricultural
labourers. It is found that a small piece of vested land received by an agricultural labourer
may turn him into a poor peasant, as he immediately does not cease to be an agricultural
labourer in a practical sense, for he has to earn livelihood for more than half the year by
selling labour power in others’ land. Viewed in this perspective, the actual increase in
total member of toiling people in rural society, a resulting shrinkage of jobs and a
stagnation of agricultural production after a certain degree of development, unveils the
contemporary crisis-ridden picture of agriculture in West Bengal. Capital crunch is a
constant problem for these weaker sections and further aggravated by the unprecedented
rise in fertilizer and fuel prices. In recent years, government has taken decision to
purchase barga land from the land owner and resale it to the bargadars (sharecroppers).
As far as loan is concerned, a concentration of the same is seen in the hands of the
creamy layers. After coming to the power the Left Front Government announced that

210
they would help with greater extent to the farmers in cultivation with co-operative loans.
But till today the co-operative movement is not spread out so far to the expected extent. It
could never succeed in providing real relief to the poor. In the absence of a proper Govt.
help the small and poor peasants are gradually being cast outside the domain of all
institutional help and are compelled to that loan from money lenders (mahajans).
The more interesting finding is that a large number of middle peasants take
recourse to mahajani loans because what they get from the formal credit market does not
suffice for modern cultivation. Usurious capital thus remains the main source of credit
not only for the poor but also for the lower-middle peasants too.
The investigation relating to the panchayats, reveals a tightening grip of the rich at
the expense of the poor. The State Panchayat Insititute (an organization of the state
government), in a survey after the 1998 elections, had pointed out the predominance of
rich peasants and businessmen in panchayat samitis and zilla parishads (the upper two
tiers of the three tier system). The poorer sections controlled the lowest body i.e. the gram
panchayat, according to them. But the present investigation, on the contrary, portrays a
different scenario, one of increase in number of rich people at all three levels in these two
villages.
In this survey it is also found that the rich and upper middle peasants have better
access to capital-intensive technology, actually consolidated their relatively small
(compared to the past and to certain other part of rural Bengal) advantage in land holding.
They have also diversified into sundry agro-related business like mini rice mills,
fertilizers and pesticides relating business, petty money lending and so on; but land till
remains the base of their socio-economic prosperity and influence. They often appoint
managers to supervise their sprawling operations, send their sons (rarely daughters too)
for higher education in metropolitan centres and maintain close relations with dominant
political parties. They wield the maximum social authority and control political power at
local levels.
In the 1990s when the new economic policy was introduced in India and its
impact immediate fell on Bengal’s agricultural system immediately. Moreover, the
Government of West Bengal had almost stopped their Land Reform Programme at that
time. We find that the upper layers of these villages vis a vis Shiromoni and Berachampa

211
like all other villages in West Bengal has come back to the situation like that in early
1978.
A P P E N D I X - I
Questionnaire for field survey
Date of interview ______________________
Respondent ______________ District __________ Thana/Taluk _________
Panchyat ______________________ Village ___________________
Respondent information 1. Gender: Male ______ Female ______Community belong ____________
2. What is your age? ______ years
3. Profession :
Peasant____________ Landless Agricultural worker__________ Others_________
4. Farming experience:
Agricultural farming experience: ______ years
5. Total cultivated land: ______ bigha
Source of seeds: self / outside
6. Land tenure status
Owner-operated: ______ bigha
Rented in: ______ bigha
Mortgage in: ______ bigha
7. Vested land distribution:
Alloted _______________ Beneficiary’s name_______________
Barga registration (specify) ____________bigha
patta holders ______________
8. Labour force data:
Age
Below 14 years _____
Between 15 to 59 years _____
Above 59 years _____
9. Level of education:
Primary _____
Secondary _____
College and above _____
Illiterate _____
10. Are you a member of any farmers’ organization? Yes / No
If yes, which farmers’ organizations are you a member of? ( )
______ Farmers’ association ______ Village co-operative society
______ Marketing co-operative society ______ Milk co-operative society
11. Have you attended any training conducted by local panchayat? Yes / No
If yes, what was the training about?

212
12. When did you take action to apply pesticides? ( )
______ After initial attack
______ Without observing any insect
______ As per government recommendations
______ Schedule-based sprays
______ Not at all
13. List the number of times you applied pesticides at particular stage(s) of the crop.
What chemicals did you apply during those stages?
14. How do you spray pesticide(s)? ( )
______ With sprayer machine
______ Other means (please specify): _____________________________
15. Do you wash your hands after spraying? Yes / No
If yes, with: water only / use soap / use soil
16. In the last cropping season did you borrow money for cultivation?
Yes / No
If yes, from which of these sources did you borrow money? ( )
______ Bank (government/private) at an interest rate of ______%
______ Co-operative society at an interest rate of ______%
______ Private source at an interest rate of ______%
______ Relative/friend at an interest rate of ______ %
17. What was your rice/jute yield and market price for last season?
______ kg. per bigha, and sold at a price of ______ Taka or Rs./kg
18. How much money did you spend last season for cultivation? (Taka or Rs./bigha)
______ Human labor ______ Animal labor
______ Machine power ______ Sprayer machine
______ Seed ______ Cowdung /oil cake
______ Farmyard manure ______ Urea______
______ Pesticides______ Irrigation
______ Rental value of land ______ Others (specify)________
19. What was the net return from cultivation last year? ____________ Taka/Rs./ha
20. How do you dispose of crop residue? ( )
______ Stack along bunds. If yes, for how long? ________________
______ Use as fuel
______ Burn in field after drying
21. When do you plow the field after uprooting? ( )
______ Immediately
______ After one week
______ After one month
22. Do you provide advice to other farmers regarding cultivation? (Yes/No)
23. Do you grade the harvest (Yes / No)
24. Where do you sell your production? ( )
______ Farm sale
______ Local market sale
______ Others (please specify): ___________________________________

213
25. Types of intermediaries to whom you sell your production:
______ Wholesaler
______ Retailer
______ Commission Agent
______ Consumer
26. Month wise sale of production (kg):
______ January ______ February ______ March
______ April ______ May ______ June
______ July ______ August ______ September
______ October ______ November ______ December
27. Did you change your cropping pattern during the last 2–3 years? (Yes / No)
Reason for your action (changing or not changing):
28. Please complete:
Pattern and land area (bigha)
Kharif_______________
Rabi________________
29. Month wise income :
January to December_______________
30. Utilization of loans:
Head wise _________________
31. Fertility of land after using fertilizers :
Yes/No__________________ your experience_______________________
32. Reverse tenancy :
Yes/No__________________________
33. Choose to other profession:
Yes/No_____________________ if yes why ________________________