16 may 2018 · • current economic position of tidal stream. ... –co-operative model ... force...
TRANSCRIPT

16 May 2018
Market pull – Revenue support for ocean energy

Agenda
Moderator: Kasparas Kemeklis, Ocean Energy Europe, ETIP Ocean
Presentations:
Niamh Kenny - DP Energy
Shelley MacDougall - Acadia University
Q&A session with the audience
2

Click to edit Master title style
Revenue Support Mechanism Not a want – a must have!
Niamh Kenny – Business Development Manager
Click to edit Master title styleRevenue Support Mechanisms
• What is it all about? What are revenue support mechanism/subsidies?
• Why does the marine energy sector need them?
• Wind and Solar – brief case study on how renewables have been supported from new industries to current position.
• Current economic position of tidal stream.
• Back to the beginning – why do we need them?

Click to edit Master title styleTypical Early Stage Supports
• Taxation– Production tax credits based on production output
– Tax relief for investors
• Feed in Tariffs – FiT’s– Fixed price tariff as a long term agreement – 10 – 20years
• Alternate offerings– Renewable Energy Guarantee of origin (REGoOs)
– Renewable Obligation Certificates (ROCs)
– Contracts for Difference (CfD)
• Ownership structure incentives– Co-operative model
– Community ownership
Click to edit Master title style
• Revenue support mechanisms and subsidies provide government with a strategy to socialise the cost of providing public goods and services.
• In this case the public good is reducing green house gas emissions, combatting climate change and increasing the deployment of renewable energy technology.
• Energy and electricity have been socialised for decades, since electrification began, and infrastructure continues to be supported at national level for all types of generation.
What are they for?
Click to edit Master title styleDenmark – The Wind Story
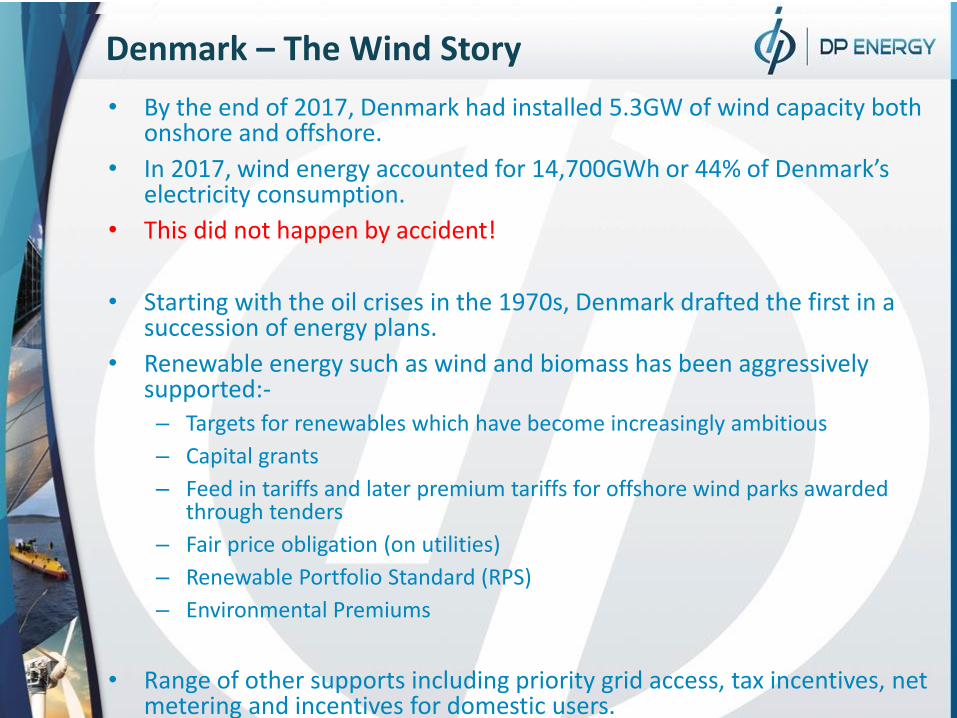
• By the end of 2017, Denmark had installed 5.3GW of wind capacity both onshore and offshore.
• In 2017, wind energy accounted for 14,700GWh or 44% of Denmark’s electricity consumption.
• This did not happen by accident!
• Starting with the oil crises in the 1970s, Denmark drafted the first in a succession of energy plans.
• Renewable energy such as wind and biomass has been aggressively supported:-
– Targets for renewables which have become increasingly ambitious
– Capital grants
– Feed in tariffs and later premium tariffs for offshore wind parks awarded through tenders
– Fair price obligation (on utilities)
– Renewable Portfolio Standard (RPS)
– Environmental Premiums
• Range of other supports including priority grid access, tax incentives, net metering and incentives for domestic users.

Click to edit Master title styleDenmark – Renewable Energy Planning
Firs
t En
ergy
Pla
n 1
97
6
Seco
nd
En
ergy
Pla
n 1
98
1
Sub
sid
ies
for
win
d a
nd
bio
mas
s
Thir
d E
ner
gy P
lan
19
90
Feed
in T
arif
f
Fou
rth
En
ergy
Pla
n 1
99
6FI
T an
d f
ocu
s o
n o
ffsh
ore
Elec
tric
ity
mar
ket
liber
alis
atio
n
19
99
-20
08
: R
enew
able
Po
rtfo
lio
Stan
dar
d (
RP
S)
Ph
ase
6 –
reju
ven
atio
n a
nd
st
ren
gth
enin
g w
ind
sec
tor
20
09
-2
01
2:
Envi
ron
men
tal p
rem
ium
Source: GWEC, 2013

Click to edit Master title styleGermany – World’s 1st Major Renewable Economy
• Key Drivers for renewables – “Energiewende”
– Climate Change – cleaner, greener
– Reduce dependence on fossil fuels
– Reduction of GHG emissions
– Phase out of dependence on nuclear and coal generation.
– Encourage community projects owned by citizens through cooperatives

Click to edit Master title styleGerman Targets
Target 2015 2020 2030 2040 2050
Green house gas emissions (base yr. 1990)
-27.2% -40% -55% -70% -80-95%
RE share of gross final energy consumption
14.9% 18% 30% 45% 60%
RE share of gross electricity consumption
31.6% 35% 50% 65% 80%
Primary energy consumption (base yr 2008)
-7.6% -20% up to -50%
Gross electricity consumption (base yr 2008)
-4.0% -10% up to -25%

Click to edit Master title styleGermany’s Growth in Renewables
Successive governments have supported renewable proliferation through: • Revenue support – FIT and then
auction based mechanisms
• Tax relief and support
• Aggressive targets for utilities and significant users
• German consumers paid €25 billion EEG levy on their bills in 2016 – it is one of the most expensive retail markets in the world - yet
• 88% of German’s said that they generally approved of the ‘Energiewende’ in 2017
Source: Federal Ministry for Economic Affairs and Energy, 2017

Click to edit Master title styleU.S. Government Energy Subsidies
Study for DBL investors
– Subsidies for energy are as old as the nation
– The study finds that the first 15 years are the critical to developing new technologies.
• Federal support during first 15 years
– Nuclear = $3.3billion
– Oil & Gas = $1.8 billion
– Renewables =$400 million
Credit: Nancy Pfund and Ben Headley
Click to edit Master title styleUS Government Support for Wind
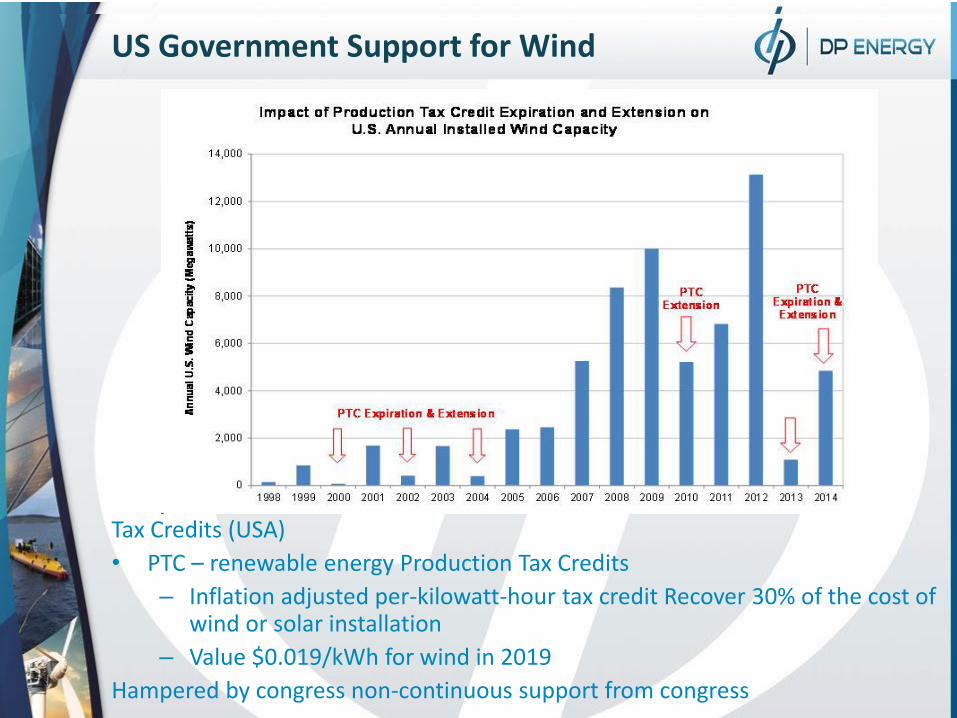
Tax Credits (USA)
• PTC – renewable energy Production Tax Credits
– Inflation adjusted per-kilowatt-hour tax credit Recover 30% of the cost of wind or solar installation
– Value $0.019/kWh for wind in 2019
Hampered by congress non-continuous support from congress

Click to edit Master title styleThe Offshore Wind Story
• Europe has led the way since 1991 installing the first offshore wind farm.
• In the UK the strike price for offshore wind has dropped from £140/MWh in 2014 to £57.50 in the last auction round in 2017 for projects to be built in 2022/2023
• Zero subsidy wind farms to be built in Germany and Netherland (although infrastructure is provided).
Revenue support mechanisms have boosted the market, increased no. of MW installed and driven down the price.

Click to edit Master title styleMain Factors Leading to Reduced Costs
• Massive proliferation and deployments in the last 10 years supported by strong revenue support mechanisms
– United Kingdom 5,100MW
– Germany 4,108 MW
– China 1,627 MW
– Denmark 1,271 MW
– Netherlands 1,118 MW
– Belgium 712 MW
• Technology developments – projects planned for 2023/2024 assuming 12-15MW turbines
– Capacity factor
– 30 year project life cycle
• Cost of capital
– A drop of 1% point in the WACC is = 6% reduction in LCOE
• Increased competition
– Turbines
– Developers
– Installation
• Exploitation of economies of scale
– Co-location
– Greater standardisation
– Improved procurement
Overall 18GW of installed
Offshore Wind installed in 17
markets

Click to edit Master title styleThe Economics of Marine Energy
• Offshore renewable energy catapult in the UK published a report called ‘Tidal Stream and Wave Energy – Cost Reduction and Industrial Benefit’ in April 2018
– Tidal stream has potential to reach LCOE of £150/MWh by 100MW installed, reducing to £90/MWh by 2GW.
– Further reductions are possible with additional focus on innovation and continued reductions in cost of capital towards levels coming through in offshore wind.
– The report recommends a revenue support mechanism to accelerate the maturity of the technology to support cost reductions.

Click to edit Master title styleFinancing a tidal energy project today
• Current financial model for a ‘pre’ commercial tidal array would look something like this.
• The model is predicated on revenue support mechanism is the region of €350 per MWh over 15 years.
• Model includes export credit underwriting for debt and accelerated capital allowances etc.
30%
40%
30%
Grant Equity Debt
Early stage tidal farms need significant revenue support and other incentives to be ‘investable’

Click to edit Master title style
1. It is impossible to fund pre-commercial and early commercial arrays without revenue certainty.
2. New technologies are inherently risky – the revenue support mechanism mitigates this risk for investors.
3. Revenue support mechanisms have been shown in countless reports across all renewable energy sectors to be a catalyst to drive down price – to the point that they are no longer needed.
4. New wind and solar projects are now cheaper than new gas! This is the pathway to a carbon free future.
5. ORE Catapult modelling found that the tidal stream industry could generate a net cumulative benefit to the UK exchequer, through employment and export benefits. They predict a net GVA benefit of £1.4billion even allowing for revenue support of £1.3billion.
6. Revenue Support mechanisms are a tried and tested way to increase deployment of new technologies and drive down price.
Why is revenue support important?


Market pull: Revenue Support for Ocean Energy
Tidal Energy in Nova Scotia
Shelley MacDougall, Ph.D., Professor Emerita
Acadia Tidal Energy Institute, Acadia University
Nova Scotia, Canada
European Technology and Innovation Platform for Ocean Energy (ETIP Ocean)
Webinar - 16 May 2018

Nova Scotia: Technology-push, market-pull and
enabling mechanisms (to date)
Technology-push mechanisms facilitate the development of technology.
R&D grants for technology development (OERA, NRCan)
Capital grants for demonstration projects (SDTC)
Investment tax incentives (SR&ED tax credit, accel. depreciation, flow-through shares)
Market-pull mechanisms create a demand or price for renewable electricity. These provide some confidence in
there being a market for the electricity and the price to be received per unit delivered.
Nova Scotia’s renewable energy targets (25% by 2015, 40% by 2020)
Feed-in tariff (FIT, COMFIT, 2017 amendments)
Enabling actions help remove barriers to development or facilitate progress.
Establishing and streamlining consenting and permitting processes (MRe Act),
SEA, EA, building infrastructure, test facilities and demonstration sites (FORCE),
Collecting and disseminating data (e.g. resource measurements, site characterization,
value proposition).
S. MacDougall, Ph.D.

Three pathways to TE development in Nova Scotia
1. FORCE demonstration site for large-scale in-stream tidal
5 berths, large-scale in-stream tidal devices, small arrays, 25 MW
total for FORCE;
Utility-grade, subsea cable, connected to transmission grid;
FIT CA $0.53/kWh, allows developer to enter a 15-year PPA with NSPI;
5 berths were awarded in 2009, 2011, 2014.
2. Small- and community-scale
5 FITs (COMFIT) awarded in 2011 for 3.55 MW total;
For arrays of small-scale devices (<500 kW);
Feed-in tariff of CA$ 0.652/kWh, 15-year PPA;
Digby Gut, Petit Passage, Grand Passage, Bra D’Or Lakes.
3. Legislative changes (2017) and new projects 2 Areas of Marine Renewable Energy Priority (AMREP): Bay of Fundy, Bras d’Or Lakes;
4 Marine Renewable Electricity Areas (MREA): FORCE, Digby Gut, Grand Passage, Petite
Passage;
S. MacDougall, Ph.D. Images from NS Department of Energy

Three pathways (con’t)3. (con’t) Amendments further define the licensing and permitting regime:
Licenses
For electricity generation in established MREAs;
Process underway to transition berth-holders at FORCE to licenses;
New entrants required to apply.
Demonstration permit (grid-connected devices)
For new entrants;
5-year permit; renewable up to 18, 5 MW limit per project, sited in an AMREP, incl. 15-year PPA;
The rate paid is project-specific, determined by Minister.
Required of developer: environmental and resource assessment, consultation, environmental
monitoring, regular reporting, performance criteria, rent, insurance for liability, and financial
security for decommissioning, connection to grid.
Demonstration permits awarded to date (10 MW newly available): 5 MW - Big Moon Power (2018–2023) for construction, installation, operation and decommissioning of 5
generators, short-term demonstration, in Fundy AMREP, PPA with price set at CA $0.35 kWh.
Permits (infrastructure and non-grid connected devices)
For activities that support licensed projects, up to ten years;
Within AMREPs, predominantly outside MREAs;
Two permits have been awarded: FORCE – For subsea electrical cables and associated equipment for the FORCE MREA,
Big Moon Power – Apr 2018 to Jun 2019 - Construction, installation, operation and decommissioning of one
unconnected generator at the Big Moon Canada Permit Area within the Fundy AMREP.
S. MacDougall, Ph.D.

MacDougall 2016, citing Bloomberg 2010; Ghosh & Nada 2010; Kalamova et al 2011; MacDougall 2013; ORE Catapult 2014.
Stages, financing, government supports
New technology-push by Gov. of Canada
The Pan-Canadian Framework on Clean Growth and Climate Change and 2017 federal budget, administered by Natural Resources Canada (NRCan):
Clean Growth in Natural Resources Program (CGNR):
To support clean technology research, development and demonstrations in Canada’s natural resource sectors;
$155M over 4 years, applications were due Feb 2018.
Emerging Renewable Power Program (ERPP):
To support the deployment of emerging renewable energy technologies not yet commercially established in Canada;
$200 million over 5 years under the Green Infrastructure Fund; applications were due in April 2018.
Clean Energy for Rural and Remote Communities Program:
To reduce reliance on diesel in rural and remote communities and industrial sites by supporting the transition to more sustainable energy solutions;
$220M over 6 years (start in 2018/19) under the Green Infrastructure Fund; proposals due 17 May 2018. May be an additional call in the fall.
S. MacDougall, Ph.D.

Other Provinces
Ontario
FIT program includes waterpower projects, including river hydrokinetic.
Generating capacity 10 kW – 5500 kW, 40 year contract FIT 24.6/kWh.
British Columbia
British Columbia and the Government of Canada partnering to spur development
and commercialization of new technologies to reduce emissions and create jobs.
$40 million joint fund; leverage private-sector investments.
Joint call over a 3 continuous intake period to seek out clean-energy projects and
technologies to mitigate or avoid provincial GHG emissions, including prototype
deployment, field testing and commercial-scale demonstration projects.
S. MacDougall, Ph.D.
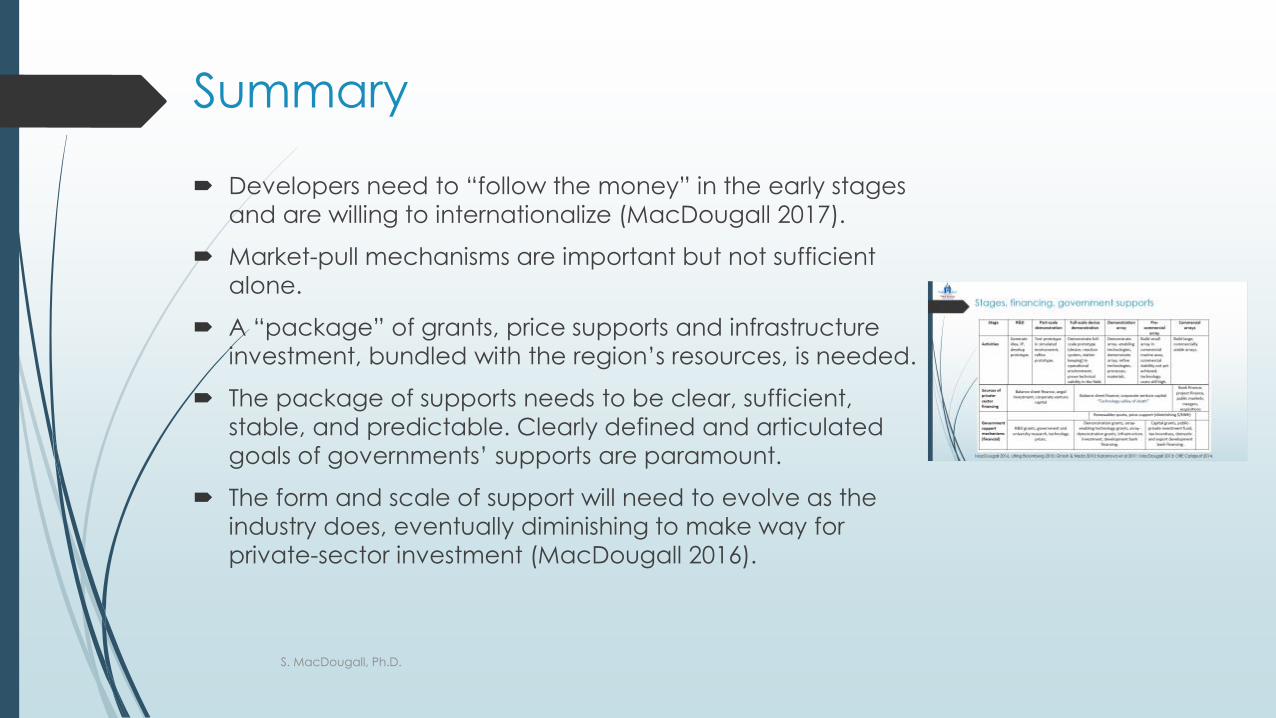
Summary
Developers need to “follow the money” in the early stages
and are willing to internationalize (MacDougall 2017).
Market-pull mechanisms are important but not sufficient
alone.
A “package” of grants, price supports and infrastructure
investment, bundled with the region’s resources, is needed.
The package of supports needs to be clear, sufficient,
stable, and predictable. Clearly defined and articulated
goals of governments’ supports are paramount.
The form and scale of support will need to evolve as the
industry does, eventually diminishing to make way for
private-sector investment (MacDougall 2016).
S. MacDougall, Ph.D.

References and links https://report2017.ocean-energy-systems.org/international-activities/canada/ocean-energy-
policy/
MacDougall, S. (2016). Funding and financial Supports for tidal energy development in ova Scotia, http://www.oera.ca/wp-content/uploads/2016/12/2016-09-09-TE-Funding-Financial-Supports_FINAL.pdf
MacDougall, S.L., (2017). Confronting the financing impasse: Risk management through internationally staged investments in tidal energy development, International Journal of Marine Energy, 18, 78-87.
https://energy.novascotia.ca/renewables/marine-renewable-energy
https://energy.novascotia.ca/renewables/marine-renewable-energy/permits
Marine Renewables Canada policy briefs www.marinerenewables.ca
S. MacDougall, Ph.D.