16 li-y modeling sen preheating with fluent and...
TRANSCRIPT

CCC Annual ReportUIUC, August 14, 2013
Yonghui Li
Department of Mechanical Science & Engineering
University of Illinois at Urbana-Champaign
Modeling SEN Preheating with
FLUENT and GASEQ
University of Illinois at Urbana-Champaign • Metals Processing Simulation Lab • Yonghui Li • 2
• Initial Casting Immersion Possible skullingin mold and associated defects
Project Background(long term goals)
• SEN Preheating
Transport the preheatedSEN
• Cool down process
• 3D commercial software modelLong time& expansive
1D User friendly Visual Basic Application
Prevent thermal shock cracks
Flame Temperature VBA Model predicts flame temperature, convection coefficients etc. in preheating.
Heat Transfer VBA Model predicts SEN temperature histories during preheating, cool-down and casting.

University of Illinois at Urbana-Champaign • Metals Processing Simulation Lab • Yonghui Li • 3
Experiment: preheating experiment photo[1]
Temperature is measured here, the flame temperature measurement is at this axial level, which is 394mm in x-coordinate in FLUENT mode.
University of Illinois at Urbana-Champaign • Metals Processing Simulation Lab • Yonghui Li • 4
Model Approach
Combustion, Fluid flow, and Heat Transfer in and near Nozzle with 2-D axisymmetric FLUENT model
Post processing to get air entrainment,temperature distribution, heat transfer coefficients
Transient Heat Transfer VBA Model of nozzle predicts temperature histories
Given air entrainment, Gaseq outputs flame temperature, heat transfer coefficients

University of Illinois at Urbana-Champaign • Metals Processing Simulation Lab • Yonghui Li • 5
Mixture composition and mass flow rate
All Runs Flow rate (SCFM) Flow rate (m3/s)Gage
Pressure(PSI)Gage Pressure
(kPa)
Oxygen 6 6.972*10-4 45 310.30
Gas(CH4) 7.5(wrong, not use) 2.195*10-3 9 62.06
Gas flow data [1]
Blue flame color Complete combustionHigh temperature
Experimental conservation
Suspect measured flow ratesLess accurate than the pressures
Assume pressures and O2 flow rate (less total flow rate) measured accurate
⁄ /
∗∗ 310300 101325 ∗ 6.972 ∗ 108.314 ∗ 293.15 1.177 10 /∗ 32 ∗ 16 4.709 10 /
1 310300 101325 293.15 6.972 102 62060 101325 293.15 8.782 10 m3/s
Mass flow rate at mixture inlet
University of Illinois at Urbana-Champaign • Metals Processing Simulation Lab • Yonghui Li • 6
Measurements[1] for model calibration
1. Measured gas temp (TC2) and refractory wall temperatures (TC3-6) (RUN2)Thermocouple TC2 TC3 TC4 TC5 TC6
X* (mm) 775 394 538 394 538
Y* (mm) 76 48 48 69 69
Temperature (oC) 1077 584 554 453 397
X: Distance from top air inlet;Y: Distance from top air inlet.
2. Measured gas temperature across inner bore (X=394mm)Distance from SEN center (mm) 0 5 10 15 20 25 30 35 40
Measured temperature (oC) 1432 1422 1403 1387 1337 1278 1204 1090 885
3. The shape of flame 4. SEN outside wall temperature

University of Illinois at Urbana-Champaign • Metals Processing Simulation Lab • Yonghui Li • 7
0 50 100 150 200 250 300 350 400
200
400
600
800
1000
1200
1400
Tem
per
atu
re (
deg
C)
Time (min)
TC1 TC2 TC3 TC4 TC5 TC6
Background: Torch preheating experiment for model validation
Set-up[1] Thermal Couple temperature histories (Run2)
SEN wall temperature
Gas temperature
University of Illinois at Urbana-Champaign • Metals Processing Simulation Lab • Yonghui Li • 8
Model assumptions
• FLUENT simulation is 2D asymmetric. – The two SEN ports are simplified as a ring shaped port with the same
exit area.• Assume the distance from the rosebud tip to where the combustion starts
is very short, and can be neglected in the fluid flow model. So the temperature at the edge between the flowing gas and where combustion starts is 3105oC and the absolute pressure is 1atm.
• The rosebud tip is simplified as annular ring as following.
24*1.6mm diameter
1*0.8mmdiameter
Simplified as
Mixture inlet
17.4mm diameter of outer ring of holes
University of Illinois at Urbana-Champaign • Metals Processing Simulation Lab • Yonghui Li • 9
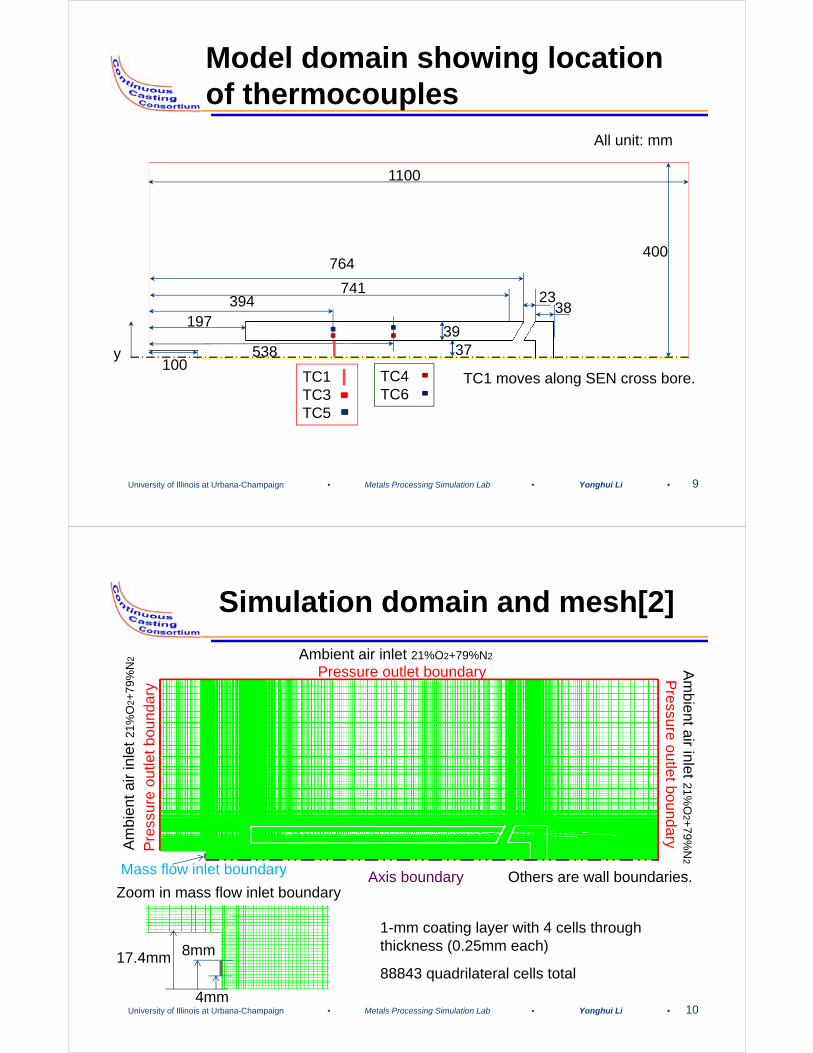
Model domain showing location of thermocouples
197394
538 37
TC1TC3 TC5
TC4 TC6
39
All unit: mm
741
764
y
400
1100
23
100TC1 moves along SEN cross bore.
38
University of Illinois at Urbana-Champaign • Metals Processing Simulation Lab • Yonghui Li • 10
Simulation domain and mesh[2]
Pressure outlet boundary
Mass flow inlet boundary Axis boundary Others are wall boundaries. Zoom in mass flow inlet boundary
4mm
8mm17.4mm
1-mm coating layer with 4 cells through thickness (0.25mm each)
Pre
ssur
e ou
tlet b
ound
ary
88843 quadrilateral cells total
Am
bien
t air
inle
t 21%
O2+
79%
N2
Am
bient air inlet 21%O
2+79%
N2
Ambient air inlet 21%O2+79%N2
Pressure outlet boundary

University of Illinois at Urbana-Champaign • Metals Processing Simulation Lab • Yonghui Li • 11
Fluent Model Settings[3]
Model
Steady state, 2D Axisymmetric, 9.81m/s2 gravity
Energy conservation, P1 radiation
Turbulence model: Standard k-epsilonEnhanced Wall Function
Non-premixed species model
Chemistry: Steady Flamelet State Relation, operating pressure 101325Pa, non-adiabatic, Import CHEMKIN Mechanism (GRI-Mech 3.0 CHEMKIN file[4] of natural gas combustion, FLUENT thermo.dbfile of gas-phase thermodynamic database)
Boundary: (Mole fraction)Fuel (3104.67℃) 0.3333CH4, 0.6667O2Oxid (26.85℃): 0.7899 N2, 0.2101 O2
University of Illinois at Urbana-Champaign • Metals Processing Simulation Lab • Yonghui Li • 12
Model Settings
Material
PDF, Specific heat: mixing law, Thermal conductivity 2.7006W/m K, Viscosity 9.32e-5 kg/m s [5], refractive index=1, scattering coefficient =0, wsggm-domain-based absorption coefficient.
Solid material setting in slide 16.
Solver Pressure based solver
Pressure Schemes
SIMPLE, Second Order Upwind
Steady laminar flamelet approach models a turbulent flame brush as an ensemble of discrete. The advantage of the laminar flamelet approach is that realistic moderate non-equilibrium chemical kinetic effects can be incorporated into turbulent flames.
GRI-Mech 3.0 is an “optimized mechanism” database designed to model natural gas combustion, contains 325 reactions and 53 species.

University of Illinois at Urbana-Champaign • Metals Processing Simulation Lab • Yonghui Li • 13
K-epsilon Turbulence Model
Case 1(default)* Case 2[6]
Cmu 0.09 0.09
C1-Epsilon 1.44 1.44
C2-Epsilon 1.92 1.87
TKE Prandtl Number 1 1
TDR Prandtl Number 1.3 1.3
Energy Prandtl Number 0.85 0.7
Wall Prandtl Number 0.85 0.7
PDF Schmidt Number 0.85 0.7
* Recommanded by Nakod P. from Ansys technique support.
University of Illinois at Urbana-Champaign • Metals Processing Simulation Lab • Yonghui Li • 14
Reasons for ~3000oC Fuel Boundary Temperature
Result of 526.85oC Fuel Boundary Temperature
Through iterations,mean temperature at f = 1 is assumed as 3104.67oC.
f = 1 Fuel mixture inlet
f = 0 Outlet (oxidant = air ) boundary
At fuel mixture inlet
Stoichiometric combustion
Maximum temperature should be at fuel mixture inlet.
Air entrains down the flameResult of 3104.67oC Fuel Boundary Temperature
0
500
1000
1500
2000
2500
3000
3500
0 0.2 0.4 0.6 0.8 1
Mea
n t
emp
erat
ure
(oC
)
Mean mixture fraction
526.85C 2832.60C 3104.67C
University of Illinois at Urbana-Champaign • Metals Processing Simulation Lab • Yonghui Li • 15
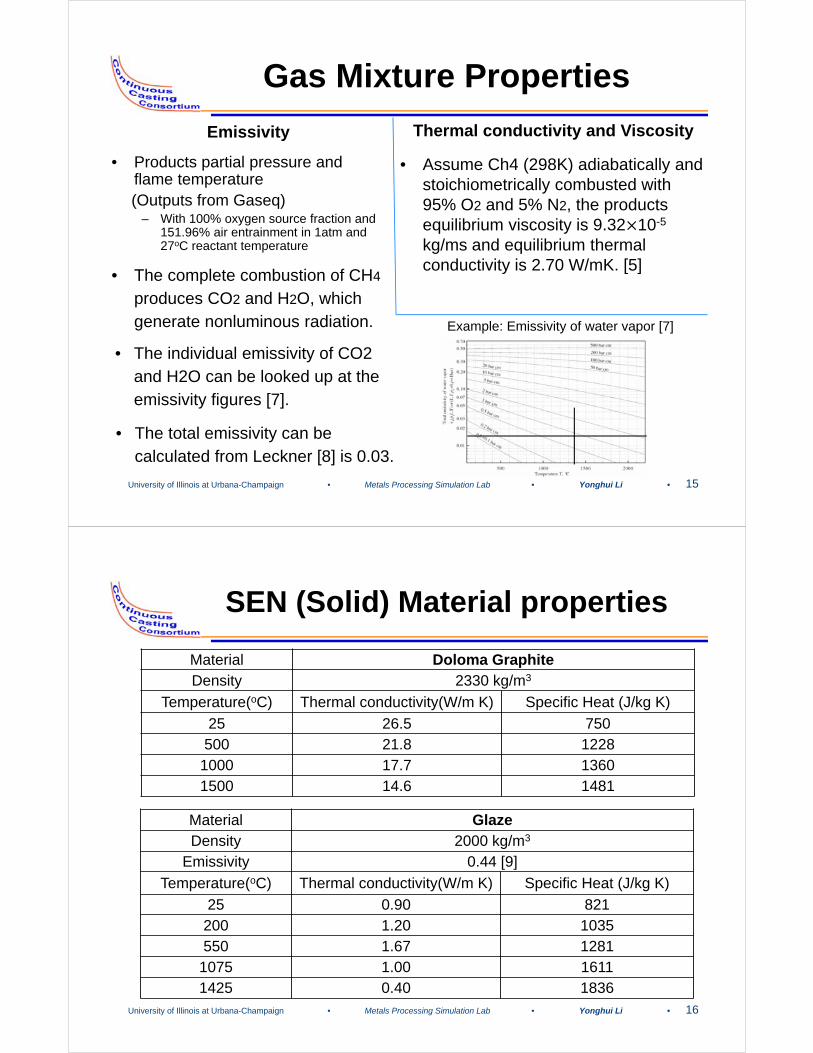
Gas Mixture Properties
• Products partial pressure and flame temperature(Outputs from Gaseq)
– With 100% oxygen source fraction and 151.96% air entrainment in 1atm and 27oC reactant temperature
• The complete combustion of CH4
produces CO2 and H2O, which generate nonluminous radiation. Example: Emissivity of water vapor [7]
• The total emissivity can be calculated from Leckner [8] is 0.03.
• Assume Ch4 (298K) adiabatically and stoichiometrically combusted with 95% O2 and 5% N2, the products equilibrium viscosity is 9.32 10-5
kg/ms and equilibrium thermal conductivity is 2.70 W/mK. [5]
Emissivity Thermal conductivity and Viscosity
• The individual emissivity of CO2 and H2O can be looked up at the emissivity figures [7].
University of Illinois at Urbana-Champaign • Metals Processing Simulation Lab • Yonghui Li • 16
SEN (Solid) Material properties
Material Doloma GraphiteDensity 2330 kg/m3
Temperature(oC) Thermal conductivity(W/m K) Specific Heat (J/kg K)
25 26.5 750500 21.8 1228
1000 17.7 13601500 14.6 1481
Material GlazeDensity 2000 kg/m3
Emissivity 0.44 [9]
Temperature(oC) Thermal conductivity(W/m K) Specific Heat (J/kg K)
25 0.90 821200 1.20 1035550 1.67 1281
1075 1.00 16111425 0.40 1836

University of Illinois at Urbana-Champaign • Metals Processing Simulation Lab • Yonghui Li • 17
Boundary conditions
Mass flow rate (g/s) 4.709
Initial Gauge Pressure (Pa) 0
Turbulent Kinetic Energy (m2/s2)
0
Turbulent Dissipation Rate (m2/s3)
0
Temperature (℃) 3104.67
Mean Mixture Fraction 1
Mixture Fraction Variance 0
Radiation Boundary temperature
InternalEmissivity
0.03
Gauge Pressure (Pa) 0
Turbulent Kinetic Energy (m2/s2)
0
Turbulent Dissipation Rate (m2/s3)
0
Backflow Temperature (℃) 26.85
Mean Mixture Fraction 0
Mixture Fraction Variance 0
Radiation Black body temp. (℃)
26.85
InternalEmissivity
10-11
Mass Flow Inlet Pressure Outlet
Air (oxidant)
Fuel
University of Illinois at Urbana-Champaign • Metals Processing Simulation Lab • Yonghui Li • 18
Initialization conditions
Non-premixed model Initialization Value
Initialization Method Standard Initialization
Compute From Mixture inlet
Reference Frame Relative to Cell Zone
Temperature (℃) 3104.67
Axial Velocity (m/s) 26.48
Turbulent Kinetic Energy (m2/s2) 0
Turbulent Dissipation Rate (m2/s3) 0
Mixture Fraction Variance 0
Mean Mixture fraction 1

University of Illinois at Urbana-Champaign • Metals Processing Simulation Lab • Yonghui Li • 19
Gas Temperature Validation (measured by Thermocouple 1)
0
200
400
600
800
1000
1200
1400
1600
0 10 20 30 40
Gas
tem
per
atu
re (
oC
)
Distance from the centerline of SEN (mm)
MeasuredSimulated
University of Illinois at Urbana-Champaign • Metals Processing Simulation Lab • Yonghui Li • 20
Solid Temperature Validation (measured by Thermocouple 3-6)
0
100
200
300
400
500
600
700
800
35 45 55 65 75
Refr
acto
ry te
mpe
ratu
re (o C
)
Distance from SEN inner wall (mm)
Measured TC3 Measured TC4 Measured TC5Measured TC6 Simulated TC3&5 Simulated TC4&6

University of Illinois at Urbana-Champaign • Metals Processing Simulation Lab • Yonghui Li • 21
Model validation: Temperature
0
200
400
600
800
1000
1200
1400
1600
0 10 20 30 40 50 60 70 80
Tem
per
atu
re (
oC
)
Distance from the center of SEN (mm)
Gas simulated Simulated TC4&6 Simulated TC3&5Gas measured TC3 measured TC5 measuredTC4 measured TC6 measured Outer wall measured
Bore with Gas SEN Refractory
Inner Glaze Outer Glaze
University of Illinois at Urbana-Champaign • Metals Processing Simulation Lab • Yonghui Li • 22
Adjust Gas Temperature Measurement
Where is the corrected temperature; / is measured temperature by the thermocouple; is Stefan-Boltzmann constant; / is probe emissivity (0.14 was recommended for uncoated platinum Type B thermocouple); h is convection coefficient for gas flowing over probe (1000 W/m2K is used).
The gas temperature measurements must be corrected for the errors due to radiation, convection, and wire conduction from the thermocouple junction. Conduction is neglected for wires over 1mm long[10]. The radiation from the environment to the junction has been neglected. Simplify into:/ / / /
0
200
400
600
800
1000
1200
1400
1600
0 10 20 30 40
Gas t
empe
ratu
re (o C
)
Distance from the centerline of SEN (mm)
Simulated
Corrected
Measured

University of Illinois at Urbana-Champaign • Metals Processing Simulation Lab • Yonghui Li • 23
Gas Temperature profiles across SEN at different axial distances down SEN
0
500
1000
1500
2000
2500
3000
0 5 10 15 20 25 30 35 40
Gas t
empe
ratu
re (o C
)
Distance from the center of SEN (mm)
MeasurementSEN topLine 240Line320TC1&3&5 cross boreTC4&6 cross bore
University of Illinois at Urbana-Champaign • Metals Processing Simulation Lab • Yonghui Li • 24
SEN Outer Wall Temperature
0
100
200
300
400
500
600
0 100 200 300 400 500 600
SEN
out
er w
all t
empe
ratu
re (o C
)
Distance from the SEN top (mm)
Simulated
Infra-red photo

University of Illinois at Urbana-Champaign • Metals Processing Simulation Lab • Yonghui Li • 25
Temperature ContourValidate the Flame Shape
Temperature (oC)
97mm
37m
m
Flame shape comparison
2000oC
University of Illinois at Urbana-Champaign • Metals Processing Simulation Lab • Yonghui Li • 26
Velocity Contour and Vector
Velocity (m/s)

University of Illinois at Urbana-Champaign • Metals Processing Simulation Lab • Yonghui Li • 27
Zoom in Velocity VectorVelocity (m/s)
Air entrainment at SEN inlet
Top of SEN
Mixture Inlet
University of Illinois at Urbana-Champaign • Metals Processing Simulation Lab • Yonghui Li • 28
N2 Mole Fraction
O2 Mole Fraction
Mole fraction of Reactants
CH4 Mole Fraction

University of Illinois at Urbana-Champaign • Metals Processing Simulation Lab • Yonghui Li • 29
CO2 Mole Fraction
Mole fraction of Main Productions
CO Mole Fraction
H2O Mole Fraction
University of Illinois at Urbana-Champaign • Metals Processing Simulation Lab • Yonghui Li • 30
Compositions down Nozzle Centerline
Top of SENTC1 Cross
BoreTC4 Cross
BoreCenter of
Port InsideCenter of
Port Outside
Temperature 2975oC 1770oC 1928oC 1914oC 1181oC
N2 26.97% 60.60% 63.47% 64.90% 63.41%O2 10.80% 16.40% 16.50% 16.90% 17.10%
H2O 17.30% 9.36% 9.88% 10.60% 8.27%CO 10.53% 2.48% 1.17% 0.33% 2.02%CO2 4.82% 3.53% 4.46% 5.21% 3.14%OH 8.72% 1.55% 1.28% 0.60% 1.07%O 7.68% 3.00% 1.48% 0.46% 2.52%H 7.62% 2.08% 0.68% 0.15% 1.75%
H2 5.24% 0.85% 0.40% 0.12% 0.64%Sum 99.68% 99.85% 99.32% 99.27% 99.92%
MinorNO, CH3, N, HCO, HO2, CH2O, CH2OH, CH2, C, CH2<S>, CH, NH, NO2, H2O2, HCCO, HNO, N2O, CH3O, CH3OH, HCN, CH4
Mole fraction of compositions down the nozzle centerline
30 species total.

University of Illinois at Urbana-Champaign • Metals Processing Simulation Lab • Yonghui Li • 31
Oxygen Source Fraction and Air Entrainment
• Definitions[11]– Oxygen source fraction is the ratio of oxygen amount relative to
stoichiometric reaction oxygen requirement. The oxygen source fraction of stoichiometric combustion is 100%.
– Air Entrainment is the ratio of current amount of air relative to the amount of air needed for stoichiometric combustion.
• Equations[11]
– – ∗∗ ∗ ∗ ∗
• Input of Oxygen Source Fraction for FLUENT and Output Air Entrainment
Air Entrainment Flow Rate (kg/s)
Mixture Inlet 4.709 10-3
SEN Upper Inlet 29.376 10-3
Entrained Air 24.667 10-3
Air Entrainment 151.955%
Oxygen Source Fraction is 100%.
University of Illinois at Urbana-Champaign • Metals Processing Simulation Lab • Yonghui Li • 32
Two methods[11] to obtain air entrainment from FLUENT
• Method 1 – Increment of the mass flow rate
is caused by entrained air.
• Method 2– Based on N2 mass balance
(barely N2 participates reaction)
Total Mass Flow Rate (kg/s)
Mixture Inlet 4.709 10-3
SEN Upper Inlet 29.376 10-3
Entrained Air 24.667 10-3
Air Entrainment 152.0%
Specific Mass Flow Rate (kg/s)
N2 SEN Upper Inlet 4.709 10-3
CH4 Mixture Inlet 29.376 10-3
Air Entrainment 152.2%
30.15% ∗ ∗∗ 2 ∗ 7921 ∗The increase of total mass flow rate is caused by entrained air.

University of Illinois at Urbana-Champaign • Metals Processing Simulation Lab • Yonghui Li • 33
Flame Temperature VBA Model[12] Predicted by Gaseq[13]
• In the condition of 27 oC and 1 atm, the flame temperature is 1346oC.• The maximum reactants temperature is 726oC (999K). With 1 atm, the flame
temperature is 1881oC. • Gaseq predicts products average temperature for equilibrium adiabatic conditions.
University of Illinois at Urbana-Champaign • Metals Processing Simulation Lab • Yonghui Li • 34
Flame Temperatures Predicted by Gaseq
1000
1500
2000
2500
3000
0 50 100 150 200
Flam
e Te
mpe
ratu
re (o C
)
Air Entrainment (%)
Reactant 27C Reactant 527CReactant 277C Reactant 726C
100% oxygen source mole fraction1 atm pressure.
Close match
Temperature (oC)
Most SEN inner gas temperature predicted by FLUENT is around 2000oC.
Estimate Reactant Temperature (max)

University of Illinois at Urbana-Champaign • Metals Processing Simulation Lab • Yonghui Li • 35
Flame Temperatures Predicted by Gaseq
1000
1500
2000
2500
3000
0 50 100 150 200
Flam
e Te
mpe
ratu
re (o C
)
Air Entrainment (%)
Reactant 27C Reactant 527CReactant 277C Reactant 726C
1000
1500
2000
2500
0 50 100 150 200Fl
ame
Tem
pera
ture
(o C)
Air Entrainment (%)
Reactant 27C Reactant 277CReactant 527C
100% oxygen source mole fraction1 atm pressure.
40% oxygen source mole fraction1 atm pressure.
University of Illinois at Urbana-Champaign • Metals Processing Simulation Lab • Yonghui Li • 36
Results assuming equilibrium combustion: too hot
0
500
1000
1500
2000
2500
3000
0 10 20 30 40 50 60 70 80
Tem
per
atu
re (
oC
)
Distance from the center of SEN (mm)
Gas measuredTC3 measuredTC5 measuredTC4 measuredTC6 measuredGas simulatedSimulated TC4&6
State Relation Equilibrium
Fuel Stream Rich Flamability limit
0.8
Boundary, fuel, mixture inlet temperatures
526.85oC
Emissivity 0.7*
* 0.7 high emissivity for luminous flame.
Different Model Settings:
Total Mass Flow Rate (kg/s)
Mixture Inlet 4.709 10-3
SEN Upper Inlet 11.266 10-3
Entrained Air 6.557 10-3
Air Entrainment 40.0%
Equilibrium assumption causes too much earlylexpansion of the flame, which prevents air entrainment. Less air entrainment increases gas temperature in nozzle.
All identical except:

University of Illinois at Urbana-Champaign • Metals Processing Simulation Lab • Yonghui Li • 37
Conclusions
• 2D steady-state axisymmetric non-equilibrium combustion model is developed using FLUENT, with Non-premixed Species Flamelet Model and 88843 quadrilateral cell mesh.
• The experiment volume flow rate is corrected based on measured pressure, due to white/blue flame observation (very near stoichiometric).
• The shape of the flame down rosebud matches well with experimental photo.
• Model matches with measured temperatures of TC1 within 67oC error. After correcting for convection and radiation heat loss, the model matches mostly within 8oC error and 39oC near boundary.
• The predicted SEN wall temperatures match experiments in the acceptable domain.
• Flame temperature model with Gaseq can predict the flame temperature by given measurement and air entrainment.
University of Illinois at Urbana-Champaign • Metals Processing Simulation Lab • Yonghui Li • 38
Future Work
• Transient heat flow in nozzle wall

University of Illinois at Urbana-Champaign • Metals Processing Simulation Lab • Yonghui Li • 39
Acknowledgments
• Continuous Casting Consortium Members(ABB, ArcelorMittal, Baosteel, MagnesitaRefractories, Nippon Steel and Sumitomo Metal Corp., Nucor Steel, Postech/ Posco, Severstal, SSAB, Tata Steel, ANSYS/ Fluent)
• Rob Nonnington from Magnesita Refractories
University of Illinois at Urbana-Champaign • Metals Processing Simulation Lab • Yonghui Li • 40
Reference
[1] LWB Report 10.0 CCC heat flow_RCN[2] Gambit software 2.4.6[3] FLUENT 13.0 [4] Gregory P. Smith, David M. Golden, Michael Frenklach, Nigel W. Moriarty, Boris Eiteneer, Mikhail Goldenberg, C. Thomas Bowman, Ronald K. Hanson, Soonho Song, William C. Gardiner, Jr., Vitali V. Lissianski, and Zhiwei Qin http://www.me.berkeley.edu/gri_mech/[5] Charles E. Heat Transfer in Industrial combustion, p469[6] R.W. Bilger, Prog. Energy Combustion. Sci., 1, 87-109, 1976[7] The CRC Handbook of Mechanical Engineering, F. Kreith, Ed., 1998, 4-74. [8] B. Leckner, Spectral and total emissivity of water vapor and carbon dioxide, Comb. Flame, 19, 33-48, 1972[9] Boca Raton, Courtesy of CRC Press, Normal Total Emissivities of Various Surfaces as a Function of Temperature[10] D. Bradley and K. J. Matthews, Measurements of high gas temperatures with fine wire thermocouples, J. Mech. Eng. Sci. 10(4),299-305, 1968[11] Y. Li, oxygen source fraction and AE 20130622.docx report[12] V. Singh, Flame temperature VBA model, Excel software[13] Gaseq, http://www.gaseq.co.uk/, Chemical equilibrium program