16 07 for web site
TRANSCRIPT

Slides Produced by Lacy Williams, Joyner Fine Properties
www.RichmondHousingToday.com
The Greater Richmond Real Estate Market
Lacy WilliamsJoyner Fine Properties
July 2016
11

Slides Produced by Lacy Williams, Joyner Fine Properties
www.RichmondHousingToday.com Background
• This report is designed to provide information on the Richmond VA housing Market as well as the National Market.
• Graphs in this report on the National Market are obtained from Keeping Current Matters, the National Association of Realtors (NAR) and other sources. For additional information on Keeping Current Matters, or to subscribe to this service, please go to www.KeepingCurrentMatters.com. For additional information on the National Association of Realtors, go to www.realtor.org.
• The graphs and analysis of the Richmond area are produced by Lacy Williams of Joyner Fine Properties using the Central Virginia Regional Multiple Listing Service (CVRMLS) data. Data was extracted in July 2016 for most of the graphs. The Greater Richmond area is defined as the city of Richmond and the counties of Henrico, Chesterfield, Hanover, Goochland and Powhatan.
22

Slides Produced by Lacy Williams, Joyner Fine Properties
www.RichmondHousingToday.com
National Economic Data
33

Slides Produced by Lacy Williams, Joyner Fine Properties
www.RichmondHousingToday.com U.S. PopulationSource: National Association of Realtors 4/16

Slides Produced by Lacy Williams, Joyner Fine Properties
www.RichmondHousingToday.com Jobs, Jobs, Jobs(
In thousands 8 million lost … 14 million gained)
Source: National Association of Realtors 4/16

Slides Produced by Lacy Williams, Joyner Fine Properties
www.RichmondHousingToday.com
State Level Employment Change
66
Source: National Association of Realtors 4/16

Slides Produced by Lacy Williams, Joyner Fine Properties
www.RichmondHousingToday.com
Where Are People Moving To?
77
Highest InBound States:1. Oregon2. South Carolina3. Vermont4. Idaho5. North Carolina6. Florida7. Nevada8. District of Columbia9. Texas10.WashingtonHighest Outbound States11.New Jersey12.New York13.Illinois14.Connecticut15.Ohio16.Kansas17.Massachusetts18.West Virginia19.Mississippi20.Maryland

Slides Produced by Lacy Williams, Joyner Fine Properties
www.RichmondHousingToday.com Employment Rate
88
Source: Bureau Of Labor Statistics 7/16

Slides Produced by Lacy Williams, Joyner Fine Properties
www.RichmondHousingToday.com Gross Domestic Product
99
Source: National Association of Homebuilders 7/16

Slides Produced by Lacy Williams, Joyner Fine Properties
www.RichmondHousingToday.com Virginia State Growth
1010
Source: National Association of Homebuilders 7/16

Slides Produced by Lacy Williams, Joyner Fine Properties
www.RichmondHousingToday.com
US Home Ownership Rate
1111
Source: National Association of Realtors 4/16

Slides Produced by Lacy Williams, Joyner Fine Properties
www.RichmondHousingToday.com
Federal Debt … Cumulative
Federal Debt in Millions
Source: National Association of Realtors 4/16
Slides Produced by Lacy Williams, Joyner Fine Properties
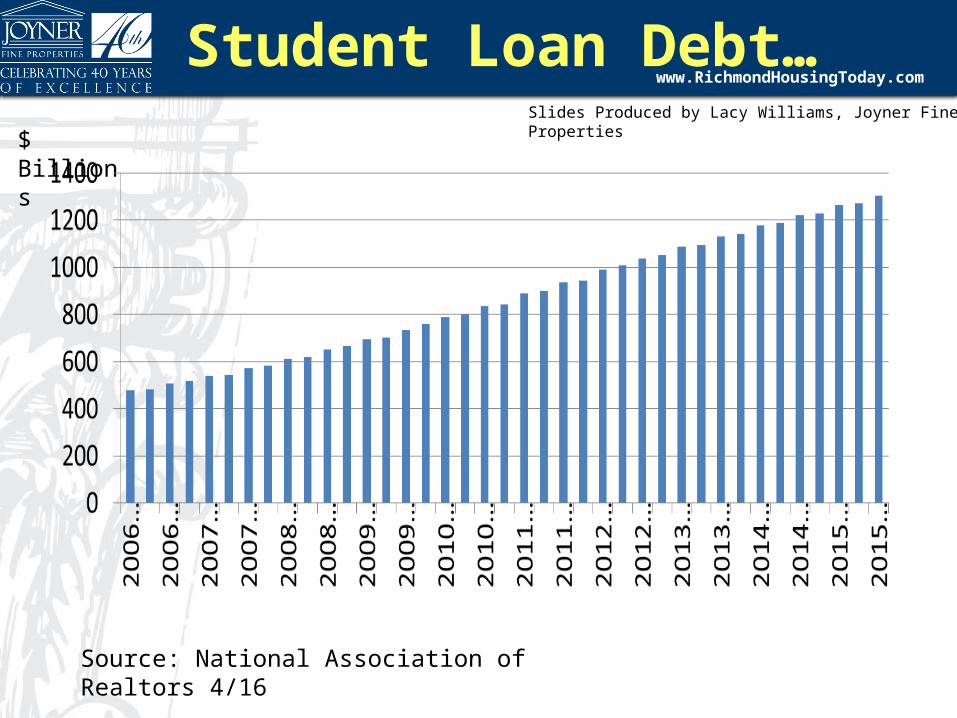
www.RichmondHousingToday.com Student Loan Debt…
$ Billions
Source: National Association of Realtors 4/16
Slides Produced by Lacy Williams, Joyner Fine Properties
www.RichmondHousingToday.com
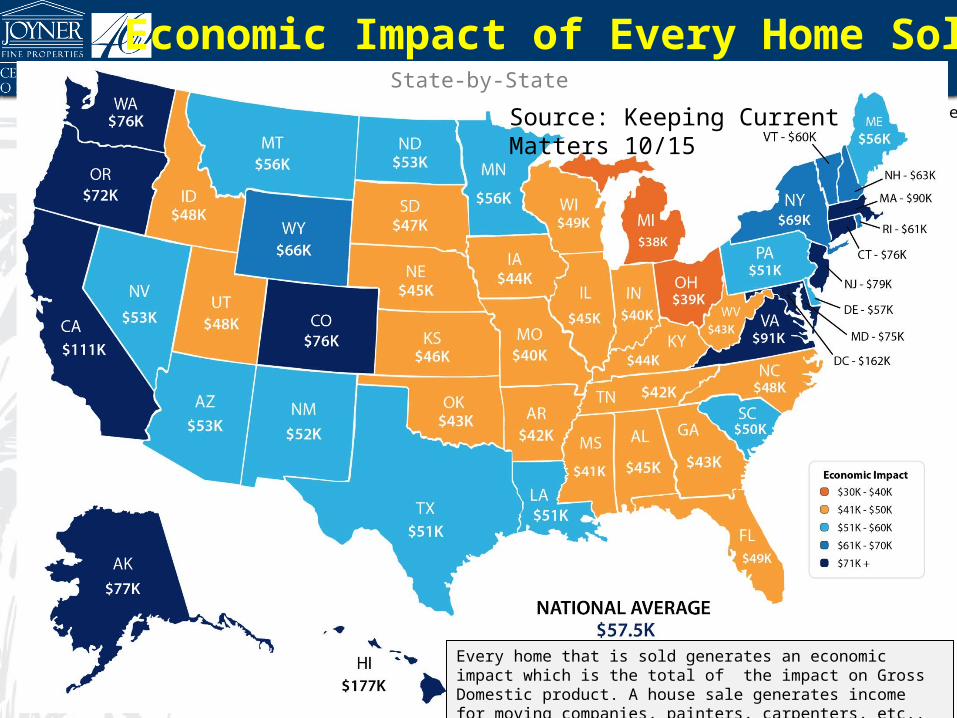
Economic Impact of Every Home SoldState-by-State
Source: NAR
Source: Keeping Current Matters 10/15
Every home that is sold generates an economic impact which is the total of the impact on Gross Domestic product. A house sale generates income for moving companies, painters, carpenters, etc..

Slides Produced by Lacy Williams, Joyner Fine Properties
www.RichmondHousingToday.com
NationalNumber of Sales
1515

Slides Produced by Lacy Williams, Joyner Fine Properties
www.RichmondHousingToday.com
“With last month's gain, sales are now up 4.5% from May 2015 and are at their highest annual pace since February 2007.”
- Lawrence Yun NAR’s Chief Economist
Source: Keeping Current Matters July 16

Slides Produced by Lacy Williams, Joyner Fine Properties
www.RichmondHousingToday.com
Existing Home Sales – Moderate Recovery
Source: National Association of Realtors 4/16

Slides Produced by Lacy Williams, Joyner Fine Properties
www.RichmondHousingToday.com
Freddie Mac
Existing Home Sales in thousands
Source: Keeping Current Matters July 16

Slides Produced by Lacy Williams, Joyner Fine Properties
www.RichmondHousingToday.com
Y-O-Y by region
Existing Home Sales by Region
NAR 5/2016
West
Source: Keeping Current Matters 6/16

Slides Produced by Lacy Williams, Joyner Fine Properties
www.RichmondHousingToday.com Very Cyclical Vacation Home Sales
(50% Decline and 100% increase)
Source: National Association of Realtors 4/16

Slides Produced by Lacy Williams, Joyner Fine Properties
www.RichmondHousingToday.com
NAR 7/2016
Change in Sales by Price Range
Source: Keeping Current Matters July 16

Slides Produced by Lacy Williams, Joyner Fine Properties
www.RichmondHousingToday.com
Inventory of Homes
2222

Slides Produced by Lacy Williams, Joyner Fine Properties
www.RichmondHousingToday.com
The Impact of Monthly Housing Inventory on Home Prices
LESS THAN 6 MONTHS
BETWEEN5-6 MONTHS
GREATER THAN7 MONTHS
SELLERS MARKETHomes prices will appreciate
NEUTRAL MARKETHomes prices
will only appreciate with
inflation
BUYERS MARKETHomes prices will depreciate
Source: Keeping Current Matters 7/14
Inventory is the average mount of time it takes to sell a house. A balanced market is an inventory of about 6 months. If inventory is less than 6 months, A Sellers market occurs with appreciating prices. If inventory is above 7 months, A Buyers market occurs with depreciating prices. .
Slides Produced by Lacy Williams, Joyner Fine Properties
www.RichmondHousingToday.com
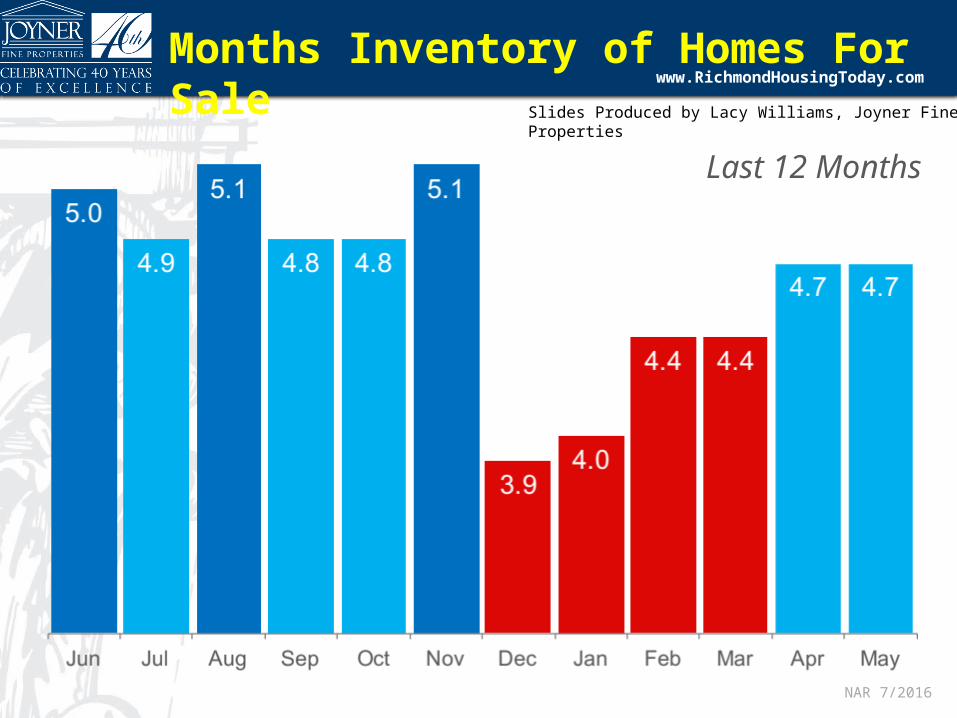
NAR 7/2016
Last 12 Months
Months Inventory of Homes For Sale

Slides Produced by Lacy Williams, Joyner Fine Properties
www.RichmondHousingToday.com
Multifamily Housing Starts: Adequate
Source: National Association of Realtors 4/16

Slides Produced by Lacy Williams, Joyner Fine Properties
www.RichmondHousingToday.com
Single-family Housing Starts: Grossly Inadequate
Thousand units
Source: National Association of Realtors 4/16

Slides Produced by Lacy Williams, Joyner Fine Properties
www.RichmondHousingToday.com New Home Sales in thousands
Freddie MacSource: Keeping Current Matters July 16
Slides Produced by Lacy Williams, Joyner Fine Properties
www.RichmondHousingToday.com
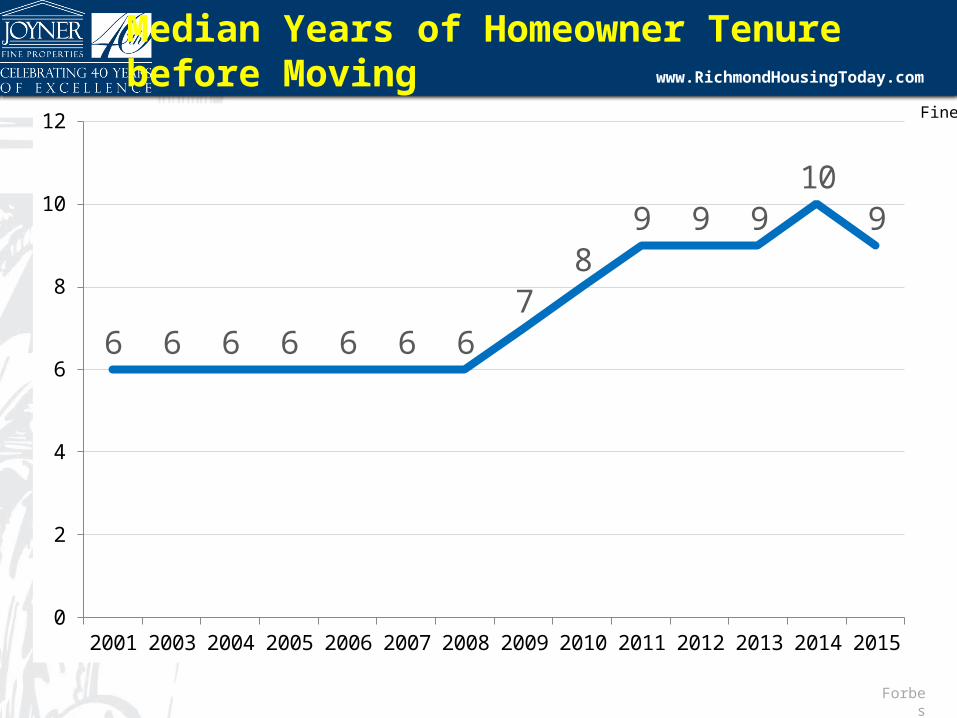
Forbes
6 6 6 6 6 6 67
89 9 9
109
0
2
4
6
8
10
12
2001 2003 2004 2005 2006 2007 2008 2009 2010 2011 2012 2013 2014 2015
Median Years of Homeowner Tenure before Moving
Pent-Up Seller Demand
Source: Keeping Current Matters 6/16

Slides Produced by Lacy Williams, Joyner Fine Properties
www.RichmondHousingToday.com
Rising Housing Wealth
$ billion
Source: National Association of Realtors 4/16

Slides Produced by Lacy Williams, Joyner Fine Properties
www.RichmondHousingToday.com
Prices
3030

Slides Produced by Lacy Williams, Joyner Fine Properties
www.RichmondHousingToday.com
FHFA
Year-Over-Year Price Change By State
Source: Keeping Current Matters 6/16

Slides Produced by Lacy Williams, Joyner Fine Properties
www.RichmondHousingToday.com
CoreLogic
Forecasted Year-Over-Year Price Change
Source: Keeping Current Matters July 16

Slides Produced by Lacy Williams, Joyner Fine Properties
www.RichmondHousingToday.com
Home Price Expectation Survey 2016 2Q
Projected Mean Price Appreciation
Source: Keeping Current Matters 6/16

Slides Produced by Lacy Williams, Joyner Fine Properties
www.RichmondHousingToday.com
$43,198
Increased home equity based on price appreciation projected by the Home Price Expectation Survey
potential growth in family wealth over the next five years based solely on increased home equity
Home Price Expectation Survey 2016 2Q
Increase in Home Equity
Source: Keeping Current Matters 6/16

Slides Produced by Lacy Williams, Joyner Fine Properties
www.RichmondHousingToday.com
35%
7%10%
January 2012 - Today
NAR 5/2016
Percentage of Distressed Property Sales
Source: Keeping Current Matters 6/16

Slides Produced by Lacy Williams, Joyner Fine Properties
www.RichmondHousingToday.com
Percentage of Price Adjustments
Zillow
“Buyers looking for the most expensive homes will find somewhat softening prices, a relatively larger selection of homes to choose from and more limited competition” Zillow
Source: Keeping Current Matters 6/16
Slides Produced by Lacy Williams, Joyner Fine Properties
www.RichmondHousingToday.com
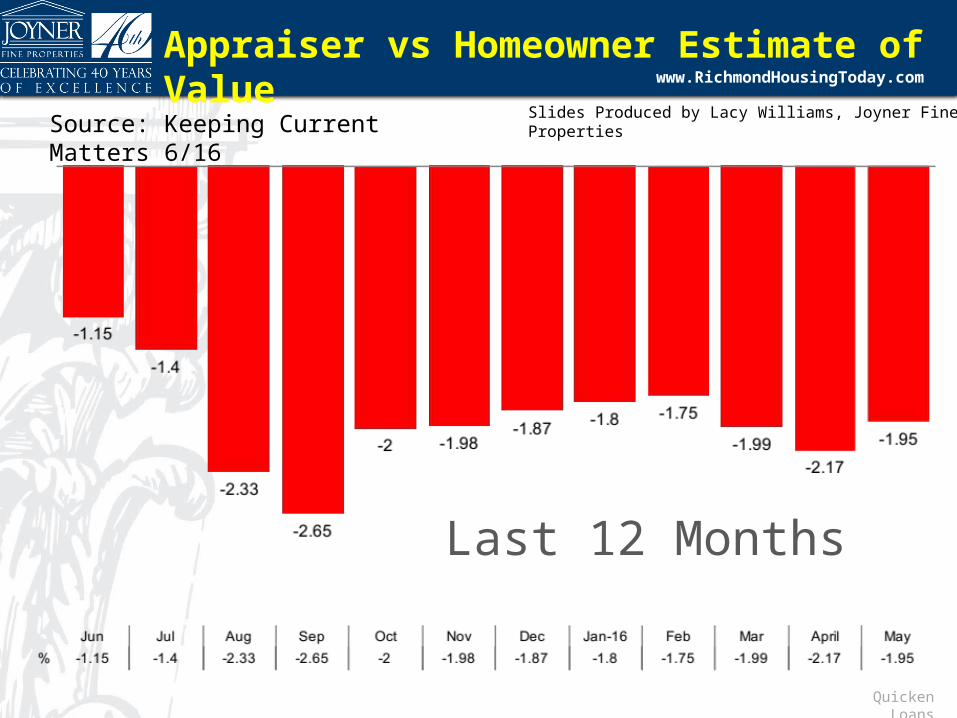
Quicken Loans
Appraiser vs Homeowner Estimate of Value
Last 12 Months
Source: Keeping Current Matters 6/16

Slides Produced by Lacy Williams, Joyner Fine Properties
www.RichmondHousingToday.com
Source: CoreLogic
Price & Time Since The Peak
Source: Keeping Current Matters 1/16

Slides Produced by Lacy Williams, Joyner Fine Properties
www.RichmondHousingToday.com
The Interest Rate
3939

Slides Produced by Lacy Williams, Joyner Fine Properties
www.RichmondHousingToday.com
A Look Back at Mortgage Rates
Record Date Average 30 year fixed rate mortgage
Approximate Payment on a $200K Mortgage*
All-Time
LOW 11/21/12 3.31% $877
All Time
HIGH 10/9/81 18.63% $3,177
*Monthly mortgage payments are principal and interest only, based on a $200,000 fully amortizing mortgage.
Freddie Mac
Source: Keeping Current Matters 5/15

Slides Produced by Lacy Williams, Joyner Fine Properties
www.RichmondHousingToday.com
Freddie Mac 6/2016
Freddie Mac 30 Year Fixed Rates
Source: Keeping Current Matters 6/16

Slides Produced by Lacy Williams, Joyner Fine Properties
www.RichmondHousingToday.com
Quarter Fannie Mae
Freddie Mac MBA NAR Average
of All Four
2016 2Q 3.6 3.7 3.8 3.9 3.8
2016 3Q 3.7 3.9 3.9 4.0 3.9
2016 4Q 3.7 4.1 4.1 4.1 4.0
2017 1Q 3.7 4.2 4.2 4.3 4.1
Mortgage Rate Projections
6/2016Source: Keeping Current Matters 6/16

Slides Produced by Lacy Williams, Joyner Fine Properties
www.RichmondHousingToday.com
Greater Richmond Housing Market
4343
Note: All Greater Richmond graphs include the city of Richmond and the counties of Henrico, Hanover, Chesterfield, Goochland and Powhatan. Data for most graphs is taken from the Central Virginia Regional Multiple List Service (CVRMLS)

Slides Produced by Lacy Williams, Joyner Fine Properties
www.RichmondHousingToday.com
Number of Jobs in Richmond
4444
Source: National Association of Realtors
1000
s of
Ful
l Tim
e Jo
bs
Slides Produced by Lacy Williams, Joyner Fine Properties
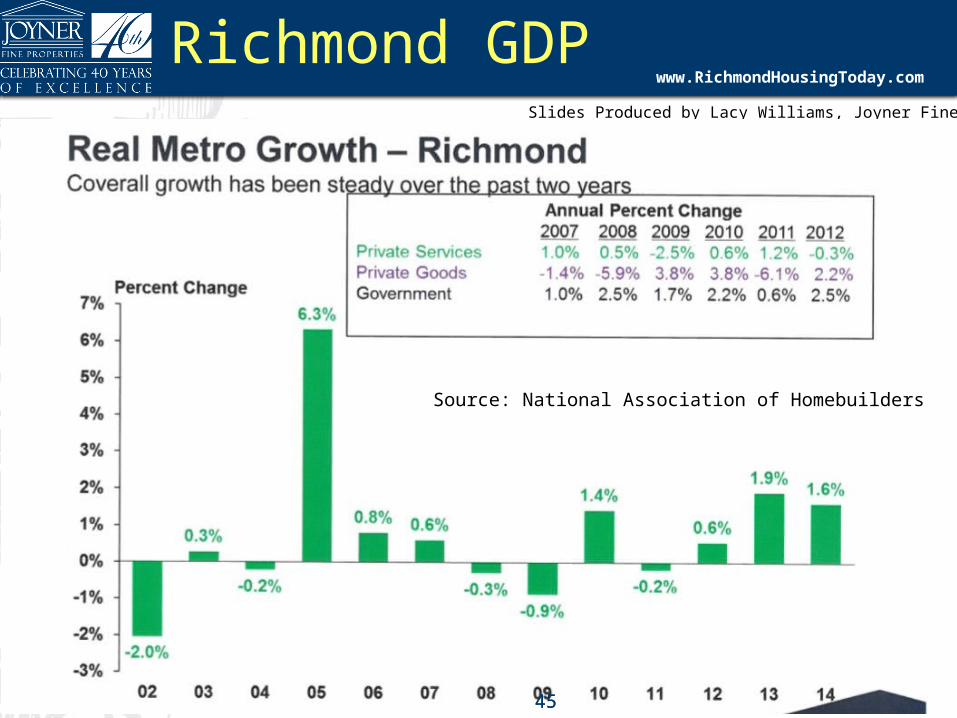
www.RichmondHousingToday.com Richmond GDP
4545
Source: National Association of Homebuilders

Slides Produced by Lacy Williams, Joyner Fine Properties
www.RichmondHousingToday.com
Market Indicator #1:Sales are Up!!!
4646

Slides Produced by Lacy Williams, Joyner Fine Properties
www.RichmondHousingToday.com
2002
2003
2004
2005
2006
2007
2008
2009
2010
2011
2012
2013
2014
2015
2016
thru
6/30
02000400060008000
1000012000140001600018000
12737
15262155331645015074
12644
9482906985749051101771054511400
12841
6637
Greater Richmond Single Family Sales by Year
Year
No
of C
lose
d Sa
les
Single Family Sales by Year
47472015 Single Family sales were up 12.4% from 2014! And Single Family sales are up 51% since 2010. 2016 should be higher than 2015.
Source: CVRMLS Data 7/8/16

Slides Produced by Lacy Williams, Joyner Fine Properties
www.RichmondHousingToday.com
Number of Single Family House Sales by Year
4848
Sales in 2015 were higher than 2014 sales in almost all months. 2016 has been higher than 2015 in most months.
Source: CVRMLS data 7/8/16
Jan Feb Mar Apr May Jun Jul Aug Sept Oct Nov Dec400
600
800
1000
1200
1400
1600
1800
Greater Richmond Single Family Sales by Month and Year
20122013201420152016
Slides Produced by Lacy Williams, Joyner Fine Properties
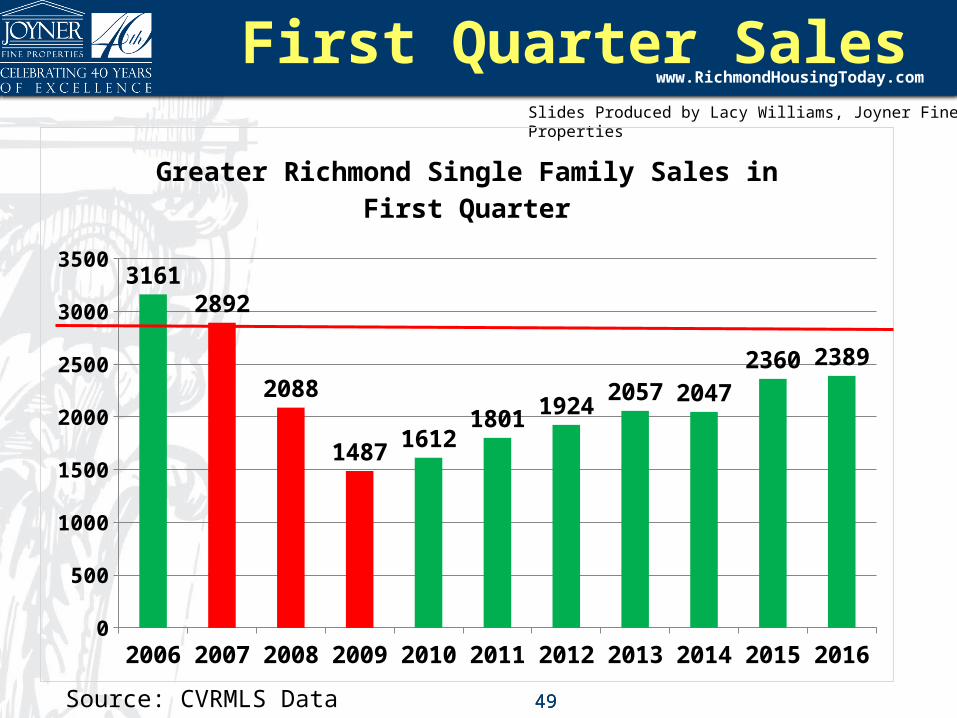
www.RichmondHousingToday.com First Quarter Sales
4949
200620072008200920102011201220132014201520160
500
1000
1500
2000
2500
3000
35003161
2892
2088
148716121801192420572047
23602389
Greater Richmond Single Family Sales in First Quarter
Source: CVRMLS Data 7/8/16
Slides Produced by Lacy Williams, Joyner Fine Properties
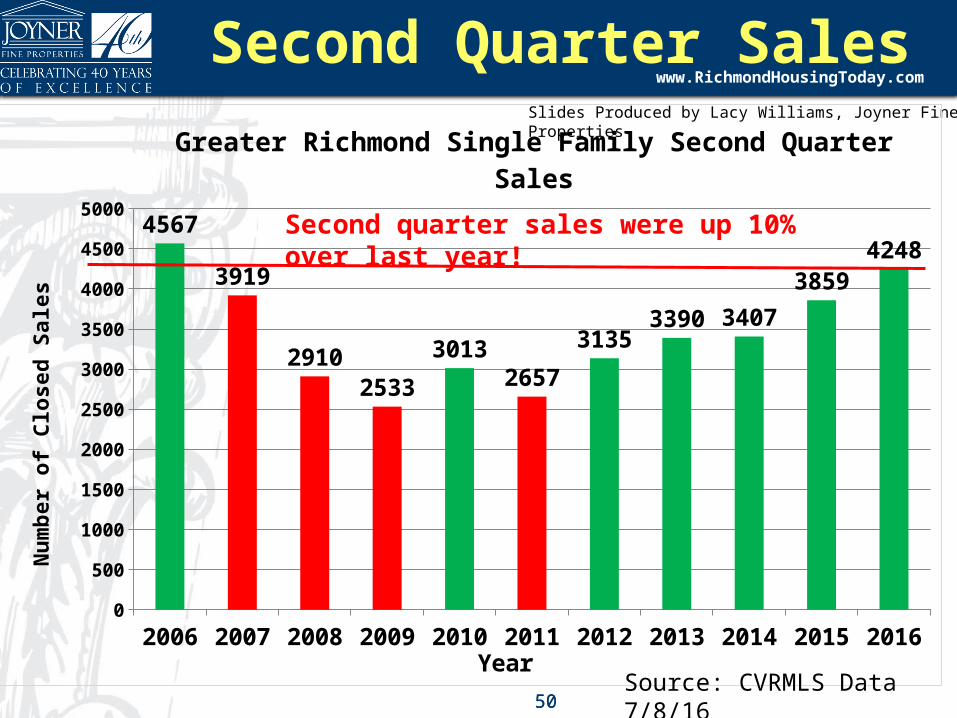
www.RichmondHousingToday.com Second Quarter Sales
5050
2006 2007 2008 2009 2010 2011 2012 2013 2014 2015 20160
500
1000
1500
2000
2500
3000
3500
4000
4500
5000 4567
3919
29102533
30132657
31353390 3407
38594248
Greater Richmond Single Family Second Quarter Sales
Year
Num
ber
of C
lose
d Sa
les
Source: CVRMLS Data 7/8/16
Second quarter sales were up 10% over last year!
Slides Produced by Lacy Williams, Joyner Fine Properties
www.RichmondHousingToday.com
2002 2003 2004 2005 2006 2007 2008 2009 2010 2011 2012 2013 2014 2015 2016 thru 6/30
0
500
1000
1500
2000
2500
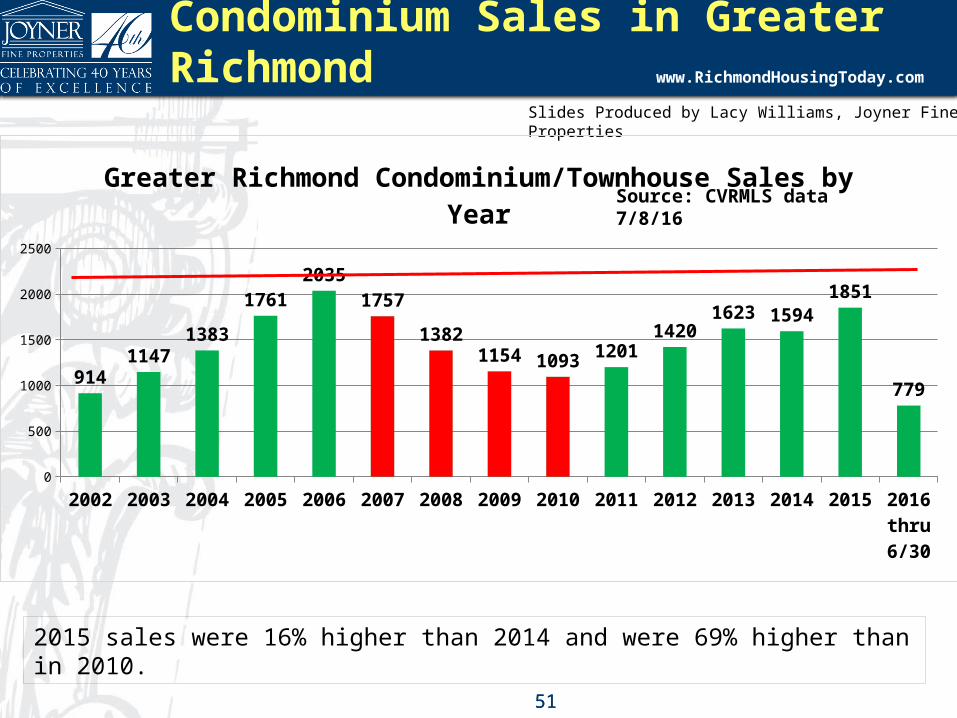
9141147
1383
17612035
1757
13821154 1093 1201
14201623 1594
1851
779
Greater Richmond Condominium/Townhouse Sales by Year
Condominium Sales in Greater Richmond
5151
2015 sales were 16% higher than 2014 and were 69% higher than in 2010.
Source: CVRMLS data 7/8/16
Slides Produced by Lacy Williams, Joyner Fine Properties
www.RichmondHousingToday.com
Year Over Year Change in Number of Sales
5252Source: CVRMLS 7/9/16
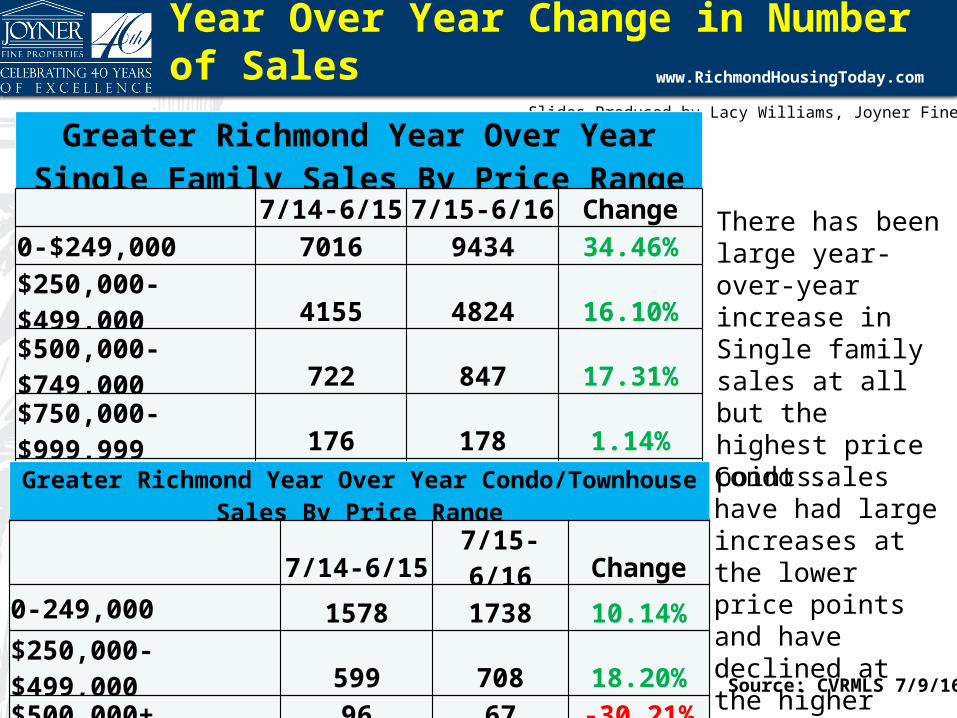
There has been large year-over-year increase in Single family sales at all but the highest price points.
Greater Richmond Year Over Year Single Family Sales By Price Range
7/14-6/15 7/15-6/16 Change0-$249,000 7016 9434 34.46%
$250,000-$499,000 4155 4824 16.10%
$500,000-$749,000 722 847 17.31%
$750,000- $999,999 176 178 1.14%$1,000,000+ 76 63 -17.11%
Greater Richmond Year Over Year Condo/Townhouse Sales By Price Range
7/14-6/15 7/15-6/16 Change0-249,000 1578 1738 10.14%$250,000-$499,000 599 708 18.20%$500,000+ 96 67 -30.21%
Condo sales have had large increases at the lower price points and have declined at the higher price points.
Slides Produced by Lacy Williams, Joyner Fine Properties
www.RichmondHousingToday.com
Who Are Richmond’s Largest Builders?
5353
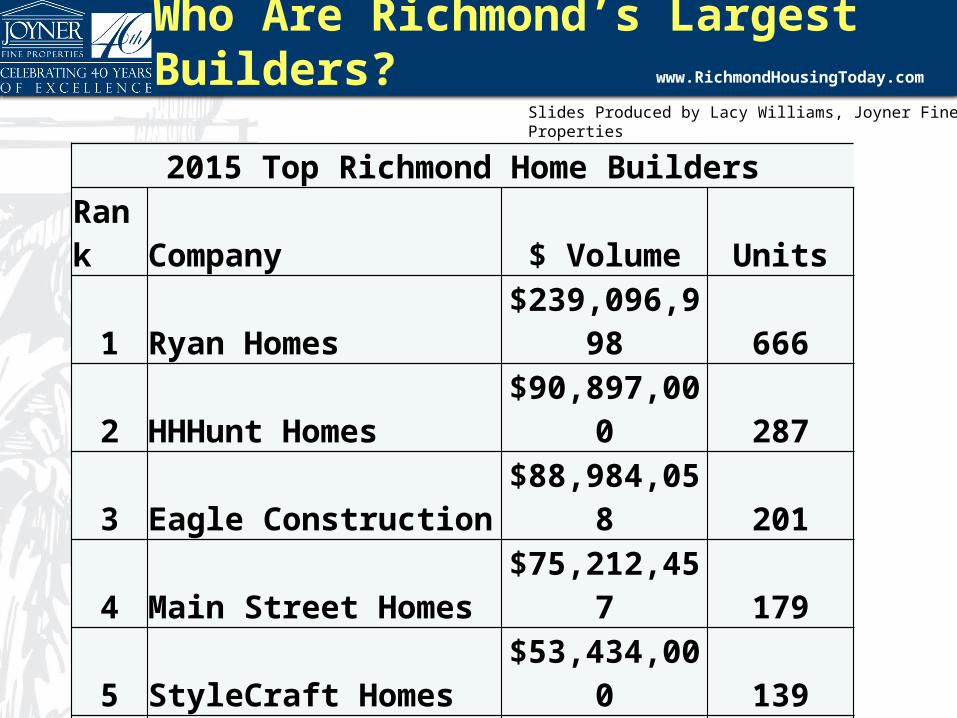
2015 Top Richmond Home BuildersRank Company $ Volume Units
1 Ryan Homes$239,096,9
98 666
2 HHHunt Homes$90,897,00
0 287
3 Eagle Construction$88,984,05
8 201
4 Main Street Homes$75,212,45
7 179
5 StyleCraft Homes$53,434,00
0 139
6 Boone Homes$38,058,58
7 52
7 R-CI Builders$23,769,42
4 68
8Lifestyle Home Builders
$23,362,189 49
9Craftmaster Homes Inc
$21,845,907 66
10 Biringer Builders$20,322,60
9 30
10 Liberty Homes$17,500,00
0 83

Slides Produced by Lacy Williams, Joyner Fine Properties
www.RichmondHousingToday.com
Market Indicator #2:Inventory is Low!!!
5454
Slides Produced by Lacy Williams, Joyner Fine Properties
www.RichmondHousingToday.com
Jan Feb Mar Apr May Jun Jul AugSept Oct Nov Dec0.0
2.0
4.0
6.0
8.0
10.0
12.0
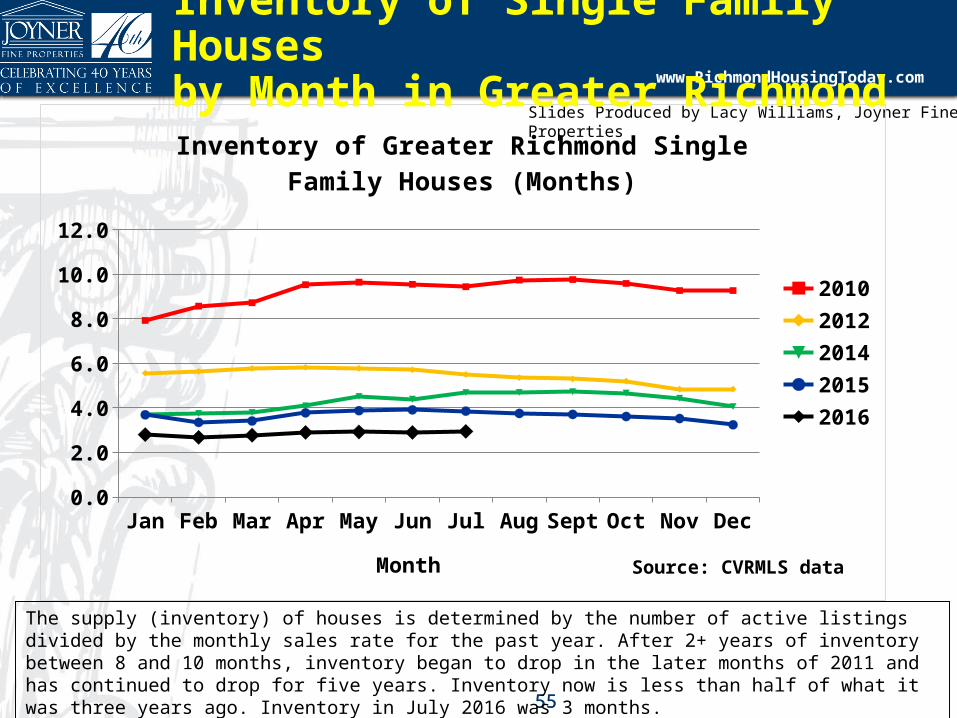
Inventory of Greater Richmond Single Family Houses (Months)
20102012201420152016
Month
Inventory of Single Family Houses by Month in Greater Richmond
5555
The supply (inventory) of houses is determined by the number of active listings divided by the monthly sales rate for the past year. After 2+ years of inventory between 8 and 10 months, inventory began to drop in the later months of 2011 and has continued to drop for five years. Inventory now is less than half of what it was three years ago. Inventory in July 2016 was 3 months.
Source: CVRMLS data

Slides Produced by Lacy Williams, Joyner Fine Properties
www.RichmondHousingToday.com
Single Family Inventory by Area
5656
Source: CVRMLS data 7/10/16
The inventory of single family homes in the city of Richmond, Henrico, and Chesterfield are indicative of a Seller’s market. We have a shortage of inventory in most areas. The red line represents a normal market.
Richmon
d
Henric
o
Cheste
rfield
Hanov
er
Gooch
land
Powha
tan
Great
er R
ichmon
d0.01.02.03.04.05.06.0
2.2 2.6 3.2 3.35.2 4.6
3.0
Greater Richmond Single Family Inventory By Area 7/11/16
Area
Mon
ths
of I
nven
tory
Slides Produced by Lacy Williams, Joyner Fine Properties
www.RichmondHousingToday.com
5757
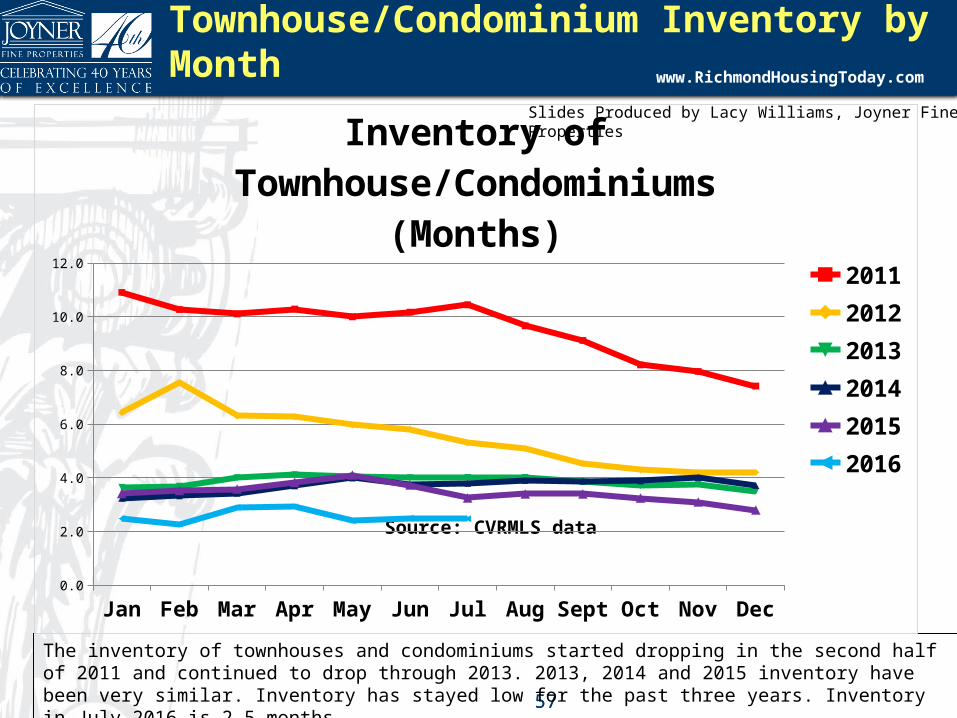
Townhouse/Condominium Inventory by Month
The inventory of townhouses and condominiums started dropping in the second half of 2011 and continued to drop through 2013. 2013, 2014 and 2015 inventory have been very similar. Inventory has stayed low for the past three years. Inventory in July 2016 is 2.5 months.
Source: CVRMLS data
Jan Feb Mar Apr May Jun Jul Aug Sept Oct Nov Dec0.0
2.0
4.0
6.0
8.0
10.0
12.0
Inventory of Townhouse/Con-dominiums (Months)
201120122013201420152016
Slides Produced by Lacy Williams, Joyner Fine Properties
www.RichmondHousingToday.com
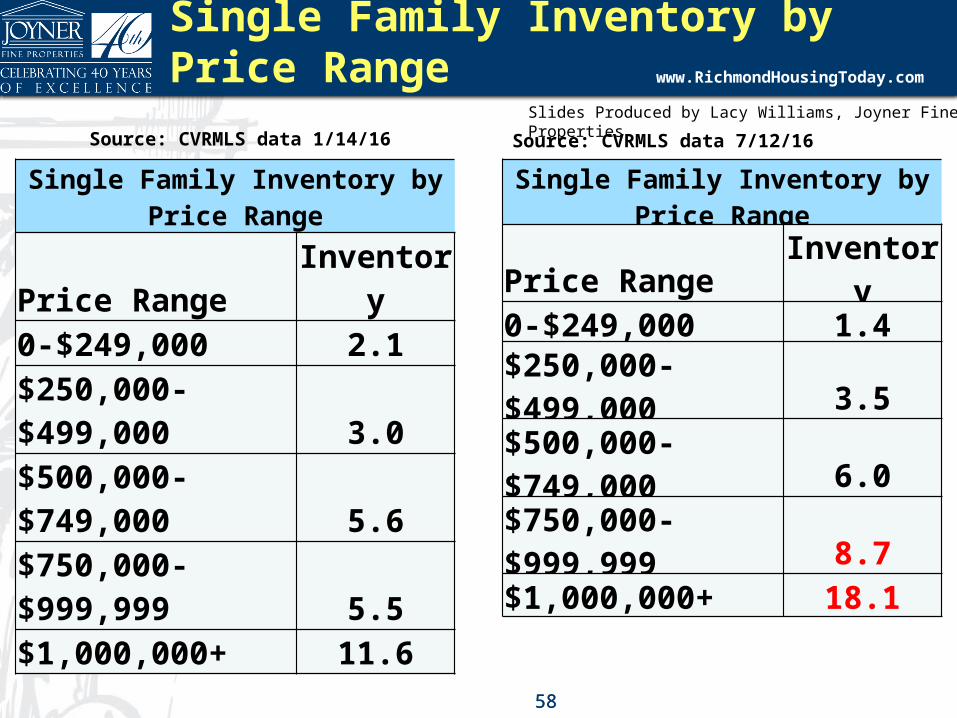
Single Family Inventory by Price Range
Single Family Inventory by Price Range
Price Range Inventory0-$249,000 2.1$250,000-$499,000 3.0$500,000-$749,000 5.6$750,000-$999,999 5.5$1,000,000+ 11.6
5858
Source: CVRMLS data 1/14/16
Single Family Inventory by Price Range
Price Range Inventory0-$249,000 1.4$250,000-$499,000 3.5$500,000-$749,000 6.0$750,000-$999,999 8.7$1,000,000+ 18.1
Source: CVRMLS data 7/12/16

Slides Produced by Lacy Williams, Joyner Fine Properties
www.RichmondHousingToday.com
Inventory by Price Range
5959
Condominium/Townhouse Inventory by Price Range
Price Range Inventory
0-249,000 1.8$250,000-$499,000 2.9$500,000+ 13.7
Condominium Inventory By Price Range
Price Range Inventory
0-249,000 2.5$250,000-$499,000 2.9$500,000+ 9.9
Source: CVRMLS data 1/14/16 Source: CVRMLS data 7/12/16

Slides Produced by Lacy Williams, Joyner Fine Properties
www.RichmondHousingToday.com New Construction
6060
Source: National Association of Homebuilders
Slides Produced by Lacy Williams, Joyner Fine Properties
www.RichmondHousingToday.com
Market Indicator #3:Prices are rising!!!
6161
Slides Produced by Lacy Williams, Joyner Fine Properties
www.RichmondHousingToday.com
6262
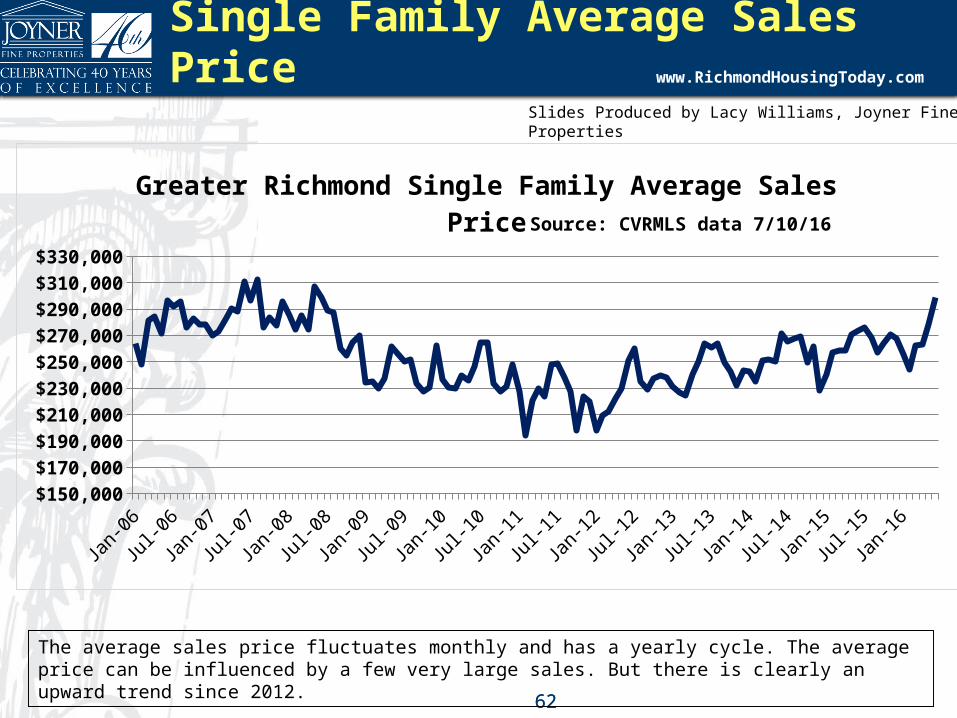
The average sales price fluctuates monthly and has a yearly cycle. The average price can be influenced by a few very large sales. But there is clearly an upward trend since 2012.
Single Family Average Sales Price
Source: CVRMLS data 7/10/16
Jan-06
Jul-0
6
Jan-07
Jul-0
7
Jan-08
Jul-0
8
Jan-09
Jul-0
9
Jan-10
Jul-1
0
Jan-11
Jul-1
1
Jan-12
Jul-1
2
Jan-13
Jul-1
3
Jan-14
Jul-1
4
Jan-15
Jul-1
5
Jan-16
$150,000$170,000$190,000$210,000$230,000$250,000$270,000$290,000$310,000$330,000
Greater Richmond Single Family Average Sales Price

Slides Produced by Lacy Williams, Joyner Fine Properties
www.RichmondHousingToday.com
Jan-
06Ju
l-06
Jan-
07Ju
l-07
Jan-
08Ju
l-08
Jan-
09Ju
l-09
Jan-
10Ju
l-10
Jan-
11Ju
l-11
Jan-
12Ju
l-12
Jan-
13Ju
l-13
Jan-
14Ju
l-14
Jan-
15Ju
l-15
Jan-
16$80.00$90.00
$100.00$110.00$120.00$130.00$140.00$150.00
Greater Richmond Single Family Average Price Per Square Foot
Single Family Price Per Square Foot
6363
Price per square foot is a better indication of what is really happening. Note that the trend is definitely upward since 2012. There are always seasonal variations with lower prices during the winter months.
Source: CVRMLS data 7/10/16
Slides Produced by Lacy Williams, Joyner Fine Properties
www.RichmondHousingToday.com
2002
2003
2004
2005
2006
2007
2008
2009
2010
2011
2012
2013
2014
2015
2016
th
ru
6/30
$60.00$70.00$80.00$90.00
$100.00$110.00$120.00$130.00$140.00$150.00
$92.
37
$99.
65
$107
.60 $1
23.3
8
$135
.82
$139
.64
$132
.43
$117
.82
$112
.24
$104
.98
$106
.16
$113
.02
$115
.19
$120
.55
$123
.59
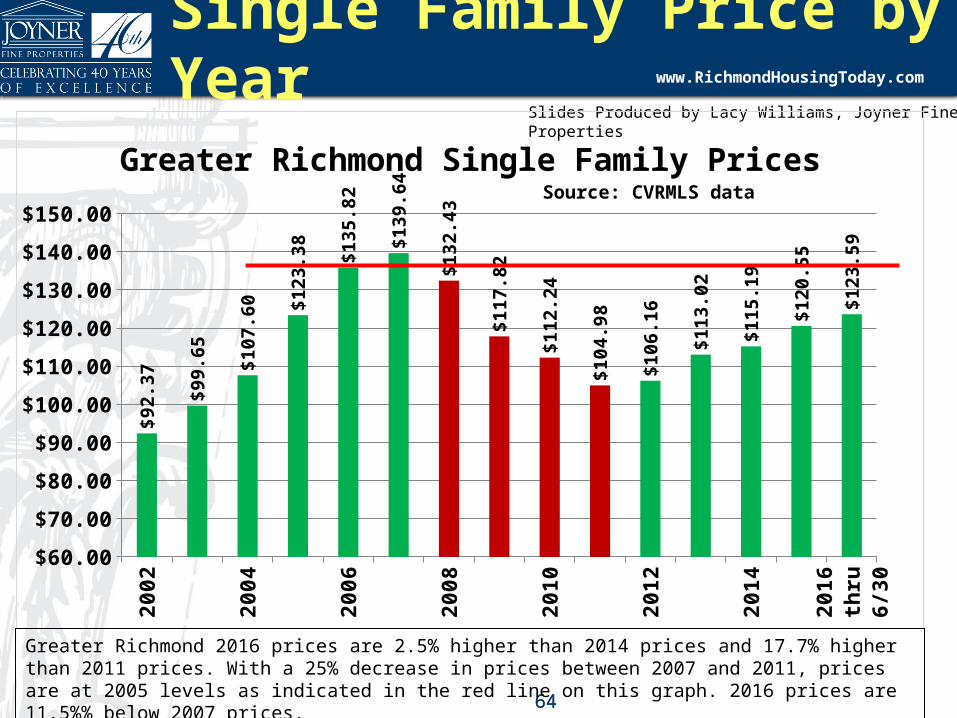
Greater Richmond Single Family Prices
Single Family Price by Year
6464
Greater Richmond 2016 prices are 2.5% higher than 2014 prices and 17.7% higher than 2011 prices. With a 25% decrease in prices between 2007 and 2011, prices are at 2005 levels as indicated in the red line on this graph. 2016 prices are 11.5%% below 2007 prices.
Source: CVRMLS data

Slides Produced by Lacy Williams, Joyner Fine Properties
www.RichmondHousingToday.com
2003
2004
2005
2006
2007
2008
2009
2010
2011
2012
2013
2014
2015
2016
thru
6/30
-15.0%
-10.0%
-5.0%
0.0%
5.0%
10.0%
15.0%
20.0%
7.9%8.0%
14.7%10.1%
2.8%
-5.2%
-11.0%
-4.7%-6.5%
1.1%
6.5%1.9%
4.7%2.5%
Greater Richmond Single Family Percent Change in Price Per Sq Ft
Year to Year
Single Family Year over Year Price Change
6565
Year over year price change shows that after 4 years of declines, prices started to increase in 2012 and have continued to increase in 2013 and 2014.. In this graph, the 7.9% increase in 2003 is the increase in prices between 2002 and 2003 etc. In 2015, prices were up 4.7% over 2014. 2016 is up 2.5% from 2015.
Source: CVRMLS data 7/10/16

Slides Produced by Lacy Williams, Joyner Fine Properties
www.RichmondHousingToday.com Condo/Townhouse Prices
6666
Jan-
06A
pr-0
6A
ug-0
6D
ec-0
6M
ar-0
7Ju
l-07
Nov
-07
Feb-
08Ju
n-08
Oct
-08
Jan-
09M
ay-0
9Se
p-09
Dec
-09
Apr
-10
Aug
-10
Nov
-10
Mar
-11
Jul-
11O
ct-1
1Fe
b-12
Jun-
12Se
p-12
Jan-
13M
ay-1
3Se
p-13
Dec
-13
Apr
-14
Aug
-14
Nov
-14
Mar
-15
Jul-
15O
ct-1
5Fe
b-16
$150,000
$170,000
$190,000
$210,000
$230,000
$250,000
$270,000
Condominium/Townhouse Average Sales Price
Month
Ave
rage
Sal
es P
rice
Slides Produced by Lacy Williams, Joyner Fine Properties
www.RichmondHousingToday.com
Jan-
06M
ay-0
6Se
p-06
Jan-
07M
ay-0
7Se
p-07
Jan-
08Ju
n-08
Oct
-08
Feb-
09Ju
n-09
Oct
-09
Feb-
10Ju
n-10
Oct
-10
Mar
-11
Jul-
11N
ov-1
1M
ar-1
2Ju
l-12
Nov
-12
Mar
-13
Aug
-13
Dec
-13
Apr
-14
Aug
-14
Dec
-14
Apr
-15
Aug
-15
Jan-
16M
ay-1
6
$80.00$90.00
$100.00$110.00$120.00$130.00$140.00$150.00$160.00$170.00$180.00
Price Per Square Foot for Condominium/Townhouse Sales
Month
Pric
e Pe
r Sq
Ft
for
Clo
sed
Sale
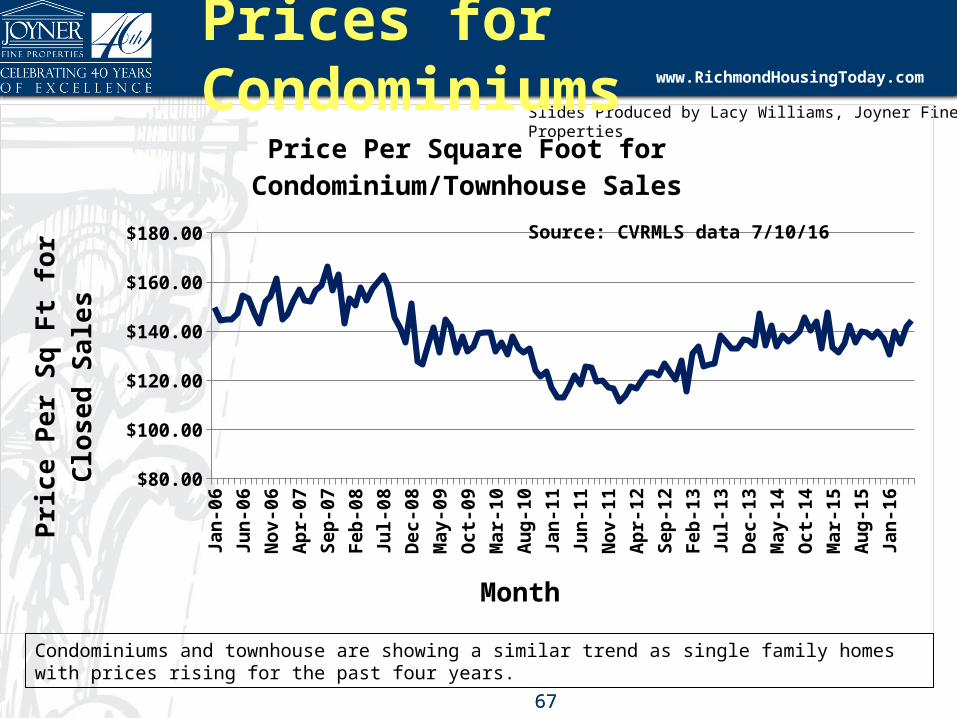
sPrices for Condominiums
6767
Condominiums and townhouse are showing a similar trend as single family homes with prices rising for the past four years.
Source: CVRMLS data 7/10/16

Slides Produced by Lacy Williams, Joyner Fine Properties
www.RichmondHousingToday.com
2002
2003
2004
2005
2006
2007
2008
2009
2010
2011
2012
2013
2014
2015
2016
thru
6/30
$60.00$80.00
$100.00$120.00$140.00$160.00
$91$100
$113$133
$149$154$153$136$132
$119$121$130$139$137$139
Greater Richmond Condominium/Townhouse Prices
Year
Pric
e Pe
r Sq
uare
Foo
tCondominium/Townhouse Prices
6868
Condominium prices in 1.1% higher than 2015. There was a 23% decrease in prices between 2007 and 2011. Current prices are above 2005 prices as shown in the red line..
Source: CVRMLS data
Slides Produced by Lacy Williams, Joyner Fine Properties
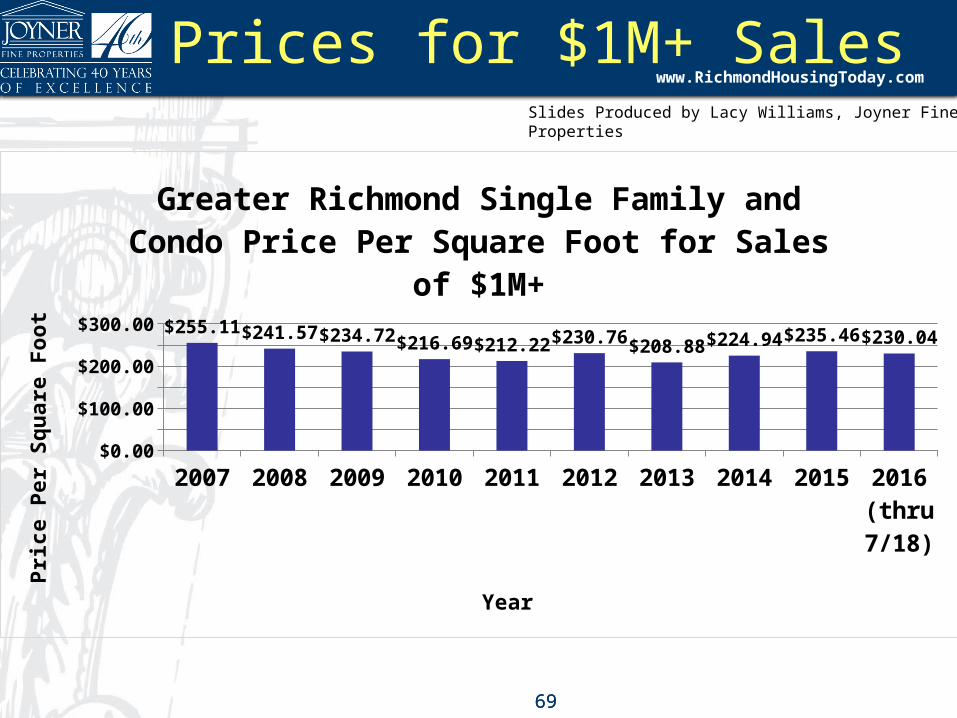
www.RichmondHousingToday.com Prices for $1M+ Sales
6969
2007 2008 2009 2010 2011 2012 2013 2014 2015 2016 (thru 7/18)
$0.00$50.00
$100.00$150.00$200.00$250.00$300.00 $255.11$241.57$234.72$216.69$212.22$230.76$208.88$224.94$235.46$230.04
Greater Richmond Single Family and Condo Price Per Square Foot for Sales of
$1M+
Year
Pric
e Pe
r Sq
uare
Foo
t

Slides Produced by Lacy Williams, Joyner Fine Properties
www.RichmondHousingToday.com
Single Family Buyers By Price Range
2016 First Half Greater Richmond Single Family
Sales By Price Range$500,000-$749,000 429$750,000- $999,999 84$1,000,000-$1,499,000 31$1,500,000-$1,999,999 4$2,000,000+ 2
7070
Slides Produced by Lacy Williams, Joyner Fine Properties
www.RichmondHousingToday.com
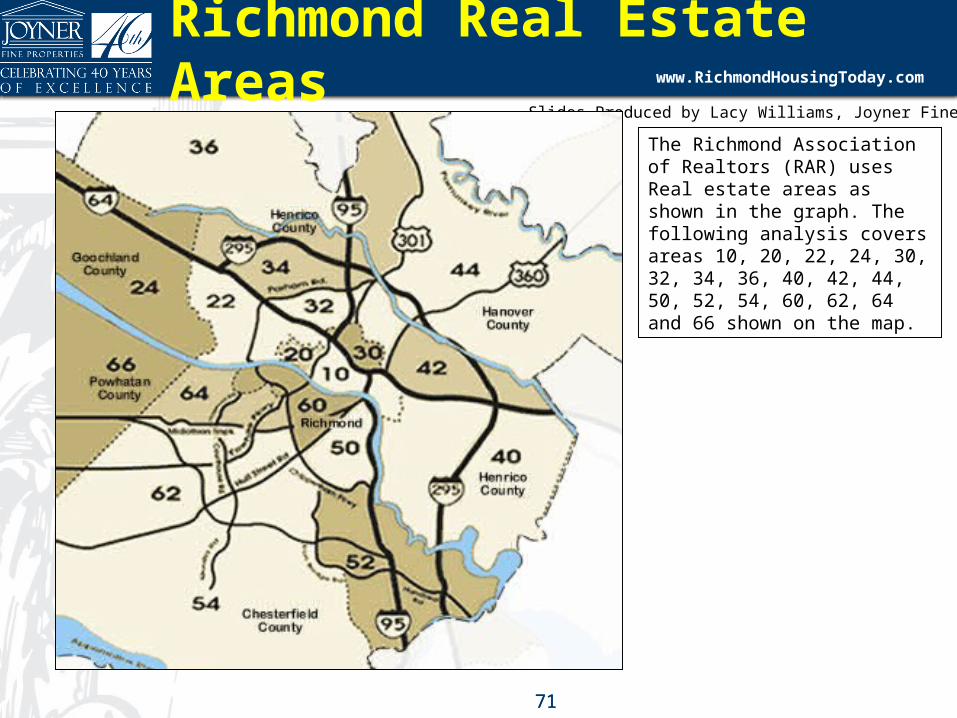
Richmond Real Estate Areas
7171
The Richmond Association of Realtors (RAR) uses Real estate areas as shown in the graph. The following analysis covers areas 10, 20, 22, 24, 30, 32, 34, 36, 40, 42, 44, 50, 52, 54, 60, 62, 64 and 66 shown on the map.

Slides Produced by Lacy Williams, Joyner Fine Properties
www.RichmondHousingToday.com
10 20 22 24 30 32 34 36 40 42 44 50 52 54 60 62 64 660
50
100
150
200
250
300
350
400
450
9841
215
143
79 88
254257
152
89147
87
336
421
112
423
179169
Single Family Active Listings By Area (7/11/16)
Area
No
of A
ctiv
e Li
stin
gsActive Single Family Listings By Area
7272
The number of active listings by area as shown. Inventory varies by area with area 62 having the highest number of homes for sale and Area 20 having the lowest.
Source: CVRMLS data 7/11/16

Slides Produced by Lacy Williams, Joyner Fine Properties
www.RichmondHousingToday.com
10 22 30 34 40 44 52 60 64
All
Ric
hmon
d
$0$100,000$200,000$300,000$400,000$500,000
$273
,246 $4
57,0
69$3
28,4
91$4
57,1
09$1
79,3
56$1
75,9
62 $351
,027
$314
,313
$172
,273
$131
,153
$248
,853
$79,
641
$198
,540
$237
,640
$217
,615
$298
,382
$349
,478
$284
,533
$269
,874
Average Sales Price By Area (7/15-6/16)
Area
Ave
rage
Sal
es P
rice
Single Family Greater Richmond Sales Price by Area
7373
The average single family house sale in greater Richmond is $269,874 shown by the red line.
Source: CVRMLS data 7/11/16

Slides Produced by Lacy Williams, Joyner Fine Properties
www.RichmondHousingToday.com
Greater Richmond Single Family Price per Square Foot 3/14-2/15)
7474Source: CVRMLS 7/11/16
10 20 22 24 30 32 34 36 40 42 44 50 52 54 60 62 64 66
All Rich
mond
$0.00
$50.00
$100.00
$150.00
$200.00
$250.00$1
49.3
1$2
05.3
3$1
41.5
9$1
59.0
5$1
02.4
3$1
07.1
6$1
38.1
5$1
26.0
8$9
7.49
$84.
45$1
18.6
1$6
0.29 $9
8.14
$108
.12
$116
.00
$118
.45
$124
.64
$129
.75
$122
.81
Price per Square Foot By Area (4/15-3/16)
Area
Pric
e pe
r Sq
uare
Foo
t
Slides Produced by Lacy Williams, Joyner Fine Properties
www.RichmondHousingToday.com
10 20 22 24 30 32 34 36 40 42 44 50 52 54 60 62 64 66
All Rich
mond
0.0
1.0
2.0
3.0
4.0
5.0
6.0
1.6 1.52.2
5.2
2.5 2.22.9
3.9 3.6
2.5 2.7
4.03.3 3.2
2.22.9
3.5
4.6
3.0
Greater Richmond Single Family Inventory by Area
Area
Mon
ths
of I
nven
tory
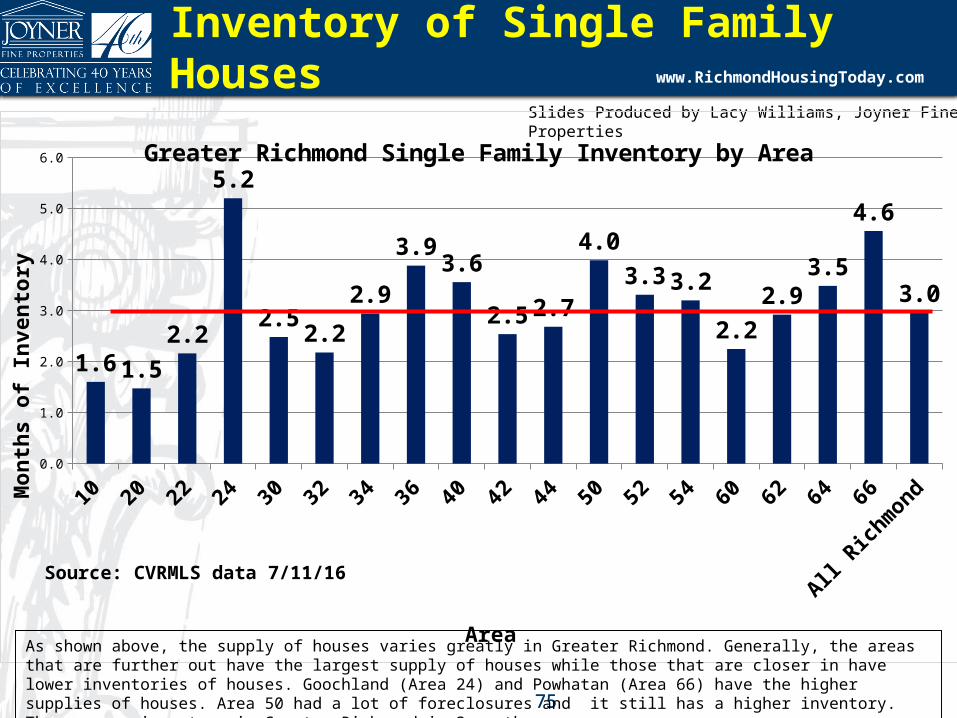
Inventory of Single Family Houses
7575
As shown above, the supply of houses varies greatly in Greater Richmond. Generally, the areas that are further out have the largest supply of houses while those that are closer in have lower inventories of houses. Goochland (Area 24) and Powhatan (Area 66) have the higher supplies of houses. Area 50 had a lot of foreclosures and it still has a higher inventory. The average inventory in Greater Richmond is 3 months.
Source: CVRMLS data 7/11/16

Slides Produced by Lacy Williams, Joyner Fine Properties
www.RichmondHousingToday.com
The Odds of Selling in Greater Richmond in 2015
7676
Source: CVRMLS 1/14/16
The odds of selling your house are determined by all properties that were listed during 2015 and all properties that were sold in 2015. The odds of selling a condo in 2015 were 75%
10 20 22 24 30 32 34 36 40 42 44 50 52 54 60 62 64 66
All Rich
mond
0.00%
20.00%
40.00%
60.00%
80.00% 71.9
9%77
.83%
75.4
7%61
.22%
64.7
9%78
.84%
70.7
5%65
.73%
69.6
6%73
.98%
73.1
6%62
.75%
68.0
1%66
.18%
78.6
5%68
.94%
67.4
3%62
.35%
69.7
1%
The Odds of Selling Your House in 2015
Area
The
Odd
s of
Sel
ling
Your
Hou
se

Slides Produced by Lacy Williams, Joyner Fine Properties
www.RichmondHousingToday.com
The Odds of Selling By Price Range
7777
Listed
7/15-6/16Sold
7/15-6/16Odds of Selling
0-$249,000 9224 7366 79.86%$250,000-$499,000 7239 4842 66.89%$500,000-$749,000 1519 848 55.83%$750,000- $999,999 339 178 52.51%$1,000,000+ 186 63 33.87%
Slides Produced by Lacy Williams, Joyner Fine Properties
www.RichmondHousingToday.com
Summary
7878

Slides Produced by Lacy Williams, Joyner Fine Properties
www.RichmondHousingToday.com NAR Economic Forecast2014 2015 2016
Forecast
2017Foreca
stGDP Growth
2.6% 2.1% 1.6% 2.2%
Job Growth +3.0 million
+2.6 million
+1.6 million
+2.2 million
CPI Inflation
1.6% 0.3% 1.7% 3.0%
10-year Treasury
2.6% 2.1% 2.1% 2.8%
Source: National Association of Realtors 4/16

Slides Produced by Lacy Williams, Joyner Fine Properties
www.RichmondHousingToday.com NAR Housing Forecast
2014 2015 2016 Foreca
st
2017 Foreca
stNew Home Sales
437,000 500,000 540,000 600,000
Existing Home Sales
4.9 million
5.3 million
5.4 million
5.5 million
Median Price Growth
+ 5.7% + 6.8% +4.5% 3.2%
30-year Rate
4.2% 3.9% 3.9% 4.6%Source: National Association of Realtors 4/16

Slides Produced by Lacy Williams, Joyner Fine Properties
www.RichmondHousingToday.com Summary
• Sales are up Single Family up 6.7%
• Inventory is low Single Family 3 mo.
• Prices are rising Single Family up 4.7%
• The interest rate is low and might rise
• The upper end market is weak!
8181

Slides Produced by Lacy Williams, Joyner Fine Properties
www.RichmondHousingToday.com
Questions?Lacy.Williams@joynerfineproper
ties.comLacy Williams
Joyner Fine Properties804-864-0316
8282