15th annual comparative analysis of the racine …
TRANSCRIPT

15TH ANNUAL COMPARATIVE ANALYSIS OF THE
RACINE UNIFIED SCHOOL DISTRICT Demographics, attendance, finances,
student engagement, and achievement
November 2012
Research by: Anne Chapman, Researcher
Jeff Schmidt, Researcher Brian Peterson, Research Intern
Anneliese Dickman, Research Director
Rob Henken, President
Sponsored by: Education Racine Inc. & The Johnson Foundation

15th Comparative Analysis of RUSD Page 2
TABLE OF CONTENTS
INTRODUCTION ................................................................................................................................................................ ....... 3
NEW SYSTEMS FOR STANDARDS AND ACCOUNTABILITY ................................................................................... 6
Common Core State Standards ................................................................................................................ 6
Assessing the new standards: SMARTER Balanced Assessment .............................................................. 7
The end of No Child Left Behind: The Wisconsin NCLB waiver ................................................................ 8
DISTRICT CONTEXTUAL INFORMATION .................................................................................................................... 13
Community demographics ..................................................................................................................... 13
Enrollment and student demographics .................................................................................................. 15
Student engagement .............................................................................................................................. 18
STUDENT PERFORMANCE ................................................................................................................................................ 22
North Star Vision and scorecard comparison ......................................................................................... 22
WKCE reading and math trends ............................................................................................................. 41
Racine’s Parental Private School Choice Program .................................................................................. 44
Measures of Academic Progress (MAP) individual growth scores in reading and math........................ 45
Achievement growth and value-added analysis ................................................................................. 49
DISTRICT FINANCES ............................................................................................................................................................ 56
District revenues ..................................................................................................................................... 56
District expenditures .............................................................................................................................. 58
Staffing characteristics ........................................................................................................................... 61
Effects of state budget legislation on regional schools .......................................................................... 65
Impact of state budget provisions in Racine and RUSD’s response ....................................................... 66
APPENDIX I – PEER DISTRICT COMPARISON ........................................................................................................... 68
APPENDIX II – SCHOOL-BY-SCHOOL DATA................................................................................................................ 75
APPENDIX III – DEFINITION OF TERMS ................................................................................................................... 107

15th Comparative Analysis of RUSD Page 3
INTRODUCTION The 15th Annual Comparative Analysis of the Racine Unified School District introduces a wealth of new information reflecting the profound changes in state policy that have occurred over the past year in regard to education accountability and finance. It begins with an overview of the key policy changes that are already shaping the way the Racine Unified School District (RUSD) instructs students and measures performance. Among those changes are the adoption of the new Common Core State Standards, implementation of a new student assessment to replace the Wisconsin Knowledge Concepts Examination (WKCE), introduction of school report cards that include measures of student growth for the first time, and a new way of evaluating teachers that incorporates student performance. The traditional backbone of the report – analysis of academic performance, district finances, and contextual factors using comparisons with peer districts1
– includes several new components as well. In addition to individual student growth analysis measured by MAP testing, this year’s report includes a peer analysis of achievement growth based on a value-added growth model, which measures the impact of teachers and the school environment on growth in student learning. The report also provides a glimpse of student achievement in the new Racine Parental Private School Choice Program. Finally, the report highlights how RUSD has responded to the fiscal pressures of the state budget and focuses on support services expenditures as a potential opportunity for financial efficiency.
Major Findings2
• North Star scorecard: Consistent with last year’s findings, the district generally did not meet the grade level targets it set for its district-wide North Star vision. This suggests the targets are in need of revisiting, especially as student growth takes on increased relevance in a statewide accountability system and current state assessments are phased out. It is anticipated that a new superintendent will investigate the need for revisions to the North Star framework in light of past performance and new state objectives and measures.
• High school completion: The state’s focus on college and career readiness sharpens attention on the
district’s high school completion rate, which showed a modest gain in 2010-11 to 73.2%. All student subgroups except white students increased their graduation rate over 2009-10, with African American students showing the most dramatic rise—7.4 percentage points to 60.6%.
• WKCE proficiency rates: The 2011-12 school year brought mixed results in overall district reading
and math proficiency. Historically, reading proficiency rates in the district have been among the 1 The 10 peer districts used for comparative purposes throughout this report consist of the 10 largest public school districts in Wisconsin excluding Milwaukee Public Schools. 2 Findings are based on the latest available data. Where possible, we use 2011-12 data. In some cases, the most recent data are from 2010-11.

15th Comparative Analysis of RUSD Page 4
lowest relative to peer districts and have tended to rise slightly between 4th and 8th grades, only to drop precipitously in 10th grade. In 2011-12, however, the reading proficiency of Racine 10th graders jumped seven percentage points to 59%. As with reading, Racine’s math performance is lower than its peer districts and the state average. Unlike last year, however, when the district showed no progress over the prior year, 2011-12 saw Racine’s math proficiency improve slightly in all three grades.
• Individual student growth: The district’s measures of individual student achievement growth in reading and math show that it still has a lot of ground to cover to improve the proportion of students who hit their individual growth targets. It does appear, however, that younger cohorts are showing more rapid growth than older cohorts, perhaps an indicator that early childhood initiatives in the district are having a beneficial effect.
• Value-added growth: RUSD’s average value-added growth over the past three years is equivalent to
average growth statewide and outpaces growth in three peer districts, including Waukesha. The district’s value-added growth in math lagged the state average and was the lowest of the peer districts. However, analysis of value-added growth at the school level showed that all but two of RUSD’s 21 elementary schools met or exceeded the state average in reading, while all but six did so in math. Notably, the majority of these schools started below the state average in WKCE achievement. These results show how value-added growth analysis paints the picture of achievement with a different brush and highlights the progress of all students, as opposed only to those who meet proficiency standards in a given year.
• Student engagement: In recognition of the need for students to be present in school in order to
learn, measures of student engagement figure prominently in the state’s new school accountability index and school report cards. In 2010-11, Racine reduced its truancy rate slightly to 15.2%, interrupting a three-year climb. Meanwhile, attendance and dropout rates remained flat at about 93% and 4.6%, respectively.
• Contextual factors: The district’s overall performance, its progress in narrowing achievement gaps,
and its access to financial resources are shaped by distinct demographic trends. Against a backdrop of slightly declining enrollment, Racine ranks first among 10 peer districts in student poverty rates with a one-year increase of about three percentage points to 60.7% in 2011-12. This constitutes an increase of almost 30 percentage points over 10 years and is more than three percentage points higher than Green Bay, the district with the next highest proportion of low-income students. RUSD also is the peer district with the highest, and steadily rising, minority enrollment at 55.6%. Although the district saw an increase in property wealth and personal income per pupil since last year, it remains below the median among peer districts. Finally, the share of Racine adults with college degrees dropped by 6.6 percentage points since 2010-11, which is about 10 percentage points below the state average and places RUSD last among 10 peer districts – a concerning indicator for the district’s economic and academic outlook.

15th Comparative Analysis of RUSD Page 5
• School finance: RUSD moved up from seventh to sixth among peer districts in terms of property tax
levy per pupil, but is still well below many of its peer districts and the state. Despite its heavy reliance on state aid, RUSD also moved down from second to third place among peers this year, receiving close to 60% of its overall operations revenue from the state. RUSD maintained its top position in terms of federal aid, which comprises 10% of its revenue. RUSD expects both state and federal aid to decrease significantly going forward. In light of such heavy reliance on dwindling public sources, we looked at RUSD’s spending on support services as a potential opportunity for cost cutting. Our analysis revealed, however, that RUSD does not differ greatly from its peers, suggesting that cuts to support services do not present a clear opportunity for RUSD to achieve major efficiencies.
On the whole, this year’s report continues to paint a picture of a district with a needier student population than that of its peer districts, a heavier reliance on state and federal aid, far lower student achievement, and expenditures that put it in the middle of the pack. New district initiatives around student engagement and early childhood education appear to be having an impact, however, and individual schools in the district appear to be making good progress in catching up to higher achievers.

15th Comparative Analysis of RUSD Page 6
NEW SYSTEMS FOR STANDARDS AND ACCOUNTABILITY Significant changes to education policy that are taking shape at both the state and federal level will have a profound impact on districts like RUSD. On the state level, the two most consequential changes will be the implementation of the new Common Core State Standards and the creation of the SMARTER Balanced Assessment to replace the WKCE. Meanwhile, the state’s recent waiver from the federal No Child Left Behind Act (NCLB) is triggering a series of additional changes to the manner in which schools are held accountable for academic success. In this section, we discuss the key role these reforms will play in shaping the face of public education in Wisconsin, and how they will impact efforts to evaluate RUSD’s current and future performance and accountability efforts. Common Core State Standards The Common Core State Standards (CCSS) for English language arts and math were created by the National Governor’s Association for Best Practices, the Council of Chief State School Officers, and a nationwide team of education experts. The standards provide a framework intended to prepare K-12 students for postsecondary education and the workforce. Drafted in 2009 and finalized in 2010 after public comment and revision, the standards have now been adopted by 45 states and the District of Columbia. Wisconsin adopted them in June 2010. The CCSS will replace the state’s previous English and math Wisconsin Model Academic Standards (WMAS) in Fall 2014.3
Unlike the WMAS, which provide learning criteria for 4th, 8th, and 12th grades only, the CCSS provide a grade-by-grade rubric for grades K-12 of skills and content knowledge students should master by the end of each academic year. The CCSS also aim for a more rigorous level of understanding than the WMAS. The new standards are intended to prepare students to be college- and career-ready, whereas the WMAS are intended to see students through high school graduation only.
Although currently there are no plans to create CCSS for other academic subjects, literacy in topics beyond English and math is promoted through the Common Core State Standards for Literacy. The literacy standards are meant to supplement, rather than replace, state standards in other subjects such as history and science. Wisconsin has adopted the Common Core Standards for Literacy and will use them in conjunction with the WMAS for subjects beyond English and math. For teachers, the CCSS emphasize student development rather than teaching methods. Under the CCSS, districts are free to employ whatever pedagogy they feel works best in order to help students reach their developmental goals. In general, the standards avoid prescribing specific texts or teaching methods.
3 While the Common Core includes only math and English language arts, the state is in the process of revising standards in other subject areas as well. New science standards will be in place by 2013, for example.

15th Comparative Analysis of RUSD Page 7
Assessing the new standards: SMARTER Balanced Assessment In order to gauge student progress in meeting the new standards, the U.S. Department of Education (USED) awarded Race to the Top grants in 2010 to two national organizations to develop standardized tests that align with the CCSS: The SMARTER Balanced Assessment Consortium (SBAC) and the Partnership for Assessment of Readiness for College and Careers (PARCC). The SBAC consists of 24 states, including Wisconsin, which joined the SBAC at the recommendation of the DPI’s Next Generation Assessment Task Force. The task force was charged in 2008 with determining how the state might best move to a balanced assessment capable of providing formative, benchmark, and summative measures throughout a student’s K-12 experience.4
The SBAC currently is conducting pilot exams across the country and plans to release the new SMARTER Balanced Assessment (SBA) in 2014, at which time it will replace the WKCE as Wisconsin’s state standardized exam.
Like the WKCE, the SBA will be a criterion-referenced exam as opposed to a norm-referenced exam. Criterion-referenced exams are designed to assess student mastery of specific content, while norm-referenced exams (such as the Iowa Test of Basic Skills) measure an individual’s score relative to the scores of others. Unlike the WKCE, the SBA will not simply benchmark a student’s achievement at one point in time. Instead, the SBA will provide benchmarks at several points during the year and also will provide formative assessment of specific skills and content so that teachers can adapt their plans to meet students’ learning needs. The SBA is “balanced” because it also provides a summative assessment at the end of the year to measure students’ abilities to problem-solve using the skills and content knowledge obtained over the course of the year. A major component of the summative assessment will be a series of performance tasks focused on real-world issues. The SBA will be conducted on a computer and will provide virtually immediate feedback to teachers. Except for performance tasks, the SBA will be computer-adaptive, meaning that as a student progresses through the exam, the questions may become more or less difficult depending on the student’s performance on the previous questions. This allows the achievement of students working at grade levels above or below their age group to be more accurately measured. The SBA also will be designed to measure individual student achievement growth over time using a variety of growth measurement methodologies, including value-added growth analysis, a method that controls for certain student characteristics to isolate the educational value of the classroom or school environment.
4Formative tests are used to inform teachers about individual students’ understanding of a subject during the school year, so that teaching methods or content can be adjusted. Benchmark assessments track the progress of the classroom, school, or district as a whole against a set of content standards. Summative tests measure individual students’ comprehensive understanding and/or skills at the end of the school year. http://www.dpi.state.wi.us/oea/pdf/NGTFbr.pdf

15th Comparative Analysis of RUSD Page 8
The end of No Child Left Behind: The Wisconsin NCLB waiver In July 2012, Wisconsin was granted a waiver from the No Child Left Behind portions of the federal Elementary and Secondary Education Act (ESEA). The waiver application, filed by the state’s Department of Public Instruction (DPI), outlines multiple changes to Wisconsin’s education policies. Wisconsin is one of 26 states that has been granted waivers from NCLB. States applying for waivers from NCLB must agree to:
• Create or adopt college and career-ready standards in reading and math (such as the Common Core State Standards)
• Develop a differentiated recognition and accountability system to replace the system required under NCLB
• Develop a support system for effective instruction and leadership • Reduce duplication of services and unnecessary burdens from schools
In addition to adopting the Common Core State Standards and the SMARTER Balanced Assessment, Wisconsin is changing state education policy in numerous ways under the newly approved waiver: the number of math, science, and elective credits required for graduation will increase; a school accountability index has been created and new annual school report cards have been issued; a teacher evaluation system has been created; and “Focus” and “Priority” schools have been identified to receive greater resources and/or state intervention.5
School accountability index and school report cards One of the more immediate and tangible outcomes parents have seen as a part of the state’s waiver are new annual school report cards first released in late October of this year. The report cards rate school performance on a new accountability index, scoring each school on a scale of 0-100 across two components: 1) a composite score of four priority areas; and 2) three student engagement indicators. Priority area scores measure student achievement, student growth, school progress in closing racial achievement gaps, and whether students are on track to graduate or are preparing for postsecondary options. The three student engagement categories measure test participation, absenteeism, and dropout rates against statewide standards. Schools with engagement indicators below statewide standards have points deducted from their priority area composite scores. Schools with engagement indicators at or above the state standards, however, do not have points added to their composite score. Thus, if all of a school’s engagement indicators meet or exceed the state benchmark, then the school’s final score will simply be a composite of the four
5 For an in-depth discussion of each of these policy changes, please see the Forum’s 2012 report, Public Schooling in Southeast Wisconsin. http://www.publicpolicyforum.org/pdfs/2012SchoolingReport.pdf

15th Comparative Analysis of RUSD Page 9
priority area scores. Schools’ overall scores fall into one of five score categories that range from “Fails to Meet Expectations” to “Significantly Exceeds Expectations.”6
In addition to including an overall school score, the report cards provide parents with new school-wide WKCE reading and math scores assessed with a more rigorous definition of proficiency based on national standards. Specifically, DPI has raised the WKCE benchmarks used to determine reading and math proficiency to align with the standards used in the National Assessment of Educational Progress (NAEP) as a way to prepare districts for the 2014-15 rollout of the SBA. The NAEP is a standardized assessment created by the National Assessment Governing Board that is administered annually to a sample of students from each state. The NAEP proficiency categories are the same as the WKCE categories (below basic, basic, proficient, advanced). When the NAEP definitions are applied to the scale scores of the WKCE, however, the proportion of Wisconsin students deemed proficient or advanced is much smaller due to the more rigorous NAEP definitions. Parents can see WKCE scores that reflect the more rigorous NAEP standards in the new school report cards. The old WKCE scoring standards no longer will be used going forward. Tables 1 and 2 show the statewide WKCE proficiency rates under the old and new scoring standards. Table 1: Percentage of Wisconsin students scoring proficient or advanced in reading under old and new definitions of proficiency, grades 3rd-8th and 10th 2007 - 2008 2008 - 2009 2009 - 2010 2010 - 2011 2011 - 2012
Reading Old New Old New Old New Old New Old New All Students 81.9% 34.6% 81.4% 35.1% 81.6% 35.5% 83.0% 35.5% 81.9% 35.8% Asian 73.8% 24.8% 73.9% 26.9% 75.6% 28.3% 79.2% 30.2% 78.8% 31.7% African American 56.5% 11.0% 56.9% 12.1% 57.6% 12.2% 59.9% 12.6% 58.7% 13.4% Hispanic 64.7% 14.7% 64.8% 15.6% 66.3% 16.2% 69.7% 17.0% 68.3% 17.6% American Indian 73.2% 19.8% 70.9% 19.9% 71.4% 20.2% 75.8% 22.1% 74.2% 22.5% White 87.6% 40.5% 86.9% 40.9% 87.0% 41.4% 88.3% 41.6% 87.4% 41.9%
Table 2: Percentage of Wisconsin students scoring proficient or advanced in math under old and new definitions of proficiency, grades 3rd-8th and 10th 2007 - 2008 2008 - 2009 2009 - 2010 2010 - 2011 2011 - 2012
Math Old New Old New Old New Old New Old New All Students 74.7% 43.1% 76.7% 45.0% 77.3% 46.8% 77.2% 46.7% 78.0% 48.1% Asian 73.5% 41.1% 76.2% 44.4% 78.1% 47.1% 78.4% 48.4% 80.0% 49.9% African American 39.7% 13.7% 44.4% 15.6% 46.4% 17.0% 46.2% 17.4% 47.5% 18.2% Hispanic 55.7% 21.7% 59.9% 23.9% 61.9% 26.6% 62.6% 27.3% 64.2% 28.4% American Indian 61.5% 26.1% 62.4% 26.4% 63.6% 27.2% 65.9% 29.7% 66.7% 31.5% White 81.7% 49.6% 83.2% 51.5% 83.4% 53.4% 83.7% 53.5% 84.3% 55.2%
6 School report cards are available on the DPI website at http://dpi.state.wi.us/reportcards/districts.html. Appendix II includes links to school report cards for each RUSD school.

15th Comparative Analysis of RUSD Page 10
Focus and Priority schools While the waiver frees states from many of the most onerous NCLB requirements, states still must measure the progress of each school toward meeting annual measureable objectives (AMOs) for each demographic subgroup of students. The bottom 10% of schools receiving federal Title I funds, as reflected by achievement gaps between subgroups or overall low performance in particular subgroups, are considered “Focus” schools. The lowest performing 5% of schools receiving Title I funds based on school-wide standardized test performance are “priority” schools (Table 3). Under the waiver, Wisconsin must identify Focus and Priority schools every four years. Table 3: Focus and Priority schools as defined by the NCLB waiver
Focus Priority 10% of all Title I schools with the largest average subgroup gaps in reading, mathematics, or graduation rate; or with the lowest average subgroup performance in the state.
5% of all Title I schools with the lowest reading and mathematics performance in the state
Priority schools will be required to contract with a state-approved education consultant to diagnose and review the school’s policies, structure, and practices to identify barriers that may be inhibiting positive student outcomes. They also must develop a reform plan that outlines steps they will take to improve reading and math scores and obtain approval from DPI. Plans may include changes such as extended learning time, targeted reading and math support, or additional professional development for teachers. If a Priority school fails to make acceptable progress in meeting AMOs after four years, the state superintendent may intervene in the school. The state superintendent can close the school or require the school board to reopen the school under a contract with an education management organization. Focus schools will be required to participate in an online state-directed self assessment, which will be used to identify aspects of the school needing improvement. Focus schools will work with the state’s Response to Intervention (RtI) Center to implement educational or structural changes that address barriers to test score improvement.7
Like Priority school reform plans, RtI plans must be approved by DPI before implementation. If a Focus school begins meeting AMOs, it can be taken off the list before the four-year period is up. If the school has not met AMOs for four consecutive years, then the school is subject to re-identification as a Focus school.
Each Priority school will receive $500,000 over a two-year period to help offset the costs of implementing education reforms. Priority schools also will be granted special flexibility in how federal Title I funds can be used within the school, including the ability to fund school-wide programs even if the school’s poverty rate is less than 40%. Focus schools will receive the same Title I fund flexibility but, unlike Priority schools, will not receive dedicated funding to offset reform costs. DPI is assessing its
7 For more information on Response to Intervention please see the RtI Center website: http://www.wisconsinrticenter.org/

15th Comparative Analysis of RUSD Page 11
budget situation to determine if there are any additional ways the department can help mitigate reforms costs for Focus schools. In May 2012, DPI identified 59 Priority and 118 Focus schools across the state, including three Priority and 31 Focus schools among RUSD and its peer districts (Table 4). Eight of RUSD’s schools were categorized by DPI as Focus schools, and two were named Priority schools. Tables 5 and 6 show the school name, whether the school was identified as in need of improvement, and the school’s specific focus area. Because Focus schools can be identified based on performance gaps, high-performing schools can fall into the Focus school category. Table 4: Peer District Focus and Priority Schools Number of Focus
Schools Number of Priority
Schools Madison 10 0 Kenosha 6 0 Racine 8 2 Green Bay 3 1 Appleton 1 0 Waukesha 0 0 Eau Claire 1 0 Janesville 1 0 Sheboygan 1 0 Oshkosh 0 0 Milwaukee 44 53 State of Wisconsin 118 59
Table 5: RUSD Focus schools identified by DPI for 2012-2016
School In Need of
Improvement 2010-11? Focus Area
Fratt Elementary No Reading Gillmore Middle No Math Janes Elementary No Reading Julien Thomas Elementary No Reading Mitchell Elementary Yes Math Mitchell Middle No Math Starbuck Middle Yes Math Wadewitz Elementary No Reading
Table 6: RUSD Priority schools identified by DPI for 2012-2016
School In Need of Improvement
2010-11? Goodland Elementary No Knapp Elementary No

15th Comparative Analysis of RUSD Page 12
Teacher evaluation system Before a 2014-15 statewide roll-out of the new Wisconsin Educator Effectiveness System, RUSD will be among a sample of Wisconsin districts in the 2013-14 school year to train current staff members to pilot the teacher practice, principal practice, and student learning components of the system.8 Three teachers and the principal from RUSD’s Julian Thomas Elementary School volunteered to participate in the statewide pilot of the new system, which will incorporate their feedback when the system rolls out for all schools statewide. The pilot model uses both announced and unannounced classroom observations to pinpoint numerous specific techniques, practices, and behaviors that are widely recognized in the field to be rigorous standards of professional practice. The new system, based on both educator practice and student learning, will be incorporated into a teacher handbook for 2013-14 after the current teachers’ contract has expired.9
8 http://www.racine.k12.wi.us/?do=parents.content&pageID=1009 9 http://www.journaltimes.com/news/local/wisconsin-granted-no-child-left-behind-waiver/article_757ea144-c7cb-11e1-bbed-0019bb2963f4.html; http://dpi.wi.gov/tepdl/edueff.html

15th Comparative Analysis of RUSD Page 13
DISTRICT CONTEXTUAL INFORMATION The condition of a district’s finances and its student achievement are grounded in the make-up of the community in which it sits. For instance, student performance generally is correlated with demographics such as household income and parents’ educational attainment. Moreover, because Wisconsin’s system of school finance ensures that property taxes comprise a large share of local school districts’ budgets, a community’s property wealth impacts its financial capacity. Finally, data on indicators of student engagement – such as attendance and truancy – paint a picture of parental involvement and its impact on student achievement. This section presents data on community demographics, including personal income, property wealth, and educational attainment; student demographics, including poverty and race; and student engagement, including attendance, habitual truancy, high school dropouts, suspensions, and expulsions.
Community demographics As shown in Table 7, although RUSD ranks first among peer districts in the percentage of low-income students enrolled, it ranks closer to the median in measures of income. Between 2009-10 and 2010-11, the share of low-income students attending RUSD schools rose by 2.2 percentage points to 60.7% overall. This constitutes an increase of almost 30 percentage points over 10 years and is more than three percentage points higher than Green Bay, the district with the next highest proportion of low-income students. Chart 1 shows the steady climb in RUSD’s percentage of students qualifying for federal lunch assistance programs, from 35% in 2002-03 to almost double that level today. Chart 2 illustrates how RUSD’s student population consistently has outpaced the largest peer districts and the state as a whole in terms of the proportion of low-income students. In light of this pattern, one might expect the district to rank low in measures of income. Although all of RUSD’s income measures fall well below the statewide average, RUSD’s 2010-11 income per tax return actually rose slightly over the prior year to $48,132, placing it at the median among the 10 peer districts. Income per pupil for RUSD also rose by about $30,000, changing its rank to seventh from eighth in 2009-10. Property value per pupil climbed as well, but not enough to change RUSD’s rank as sixth highest among the 10 districts.

15th Comparative Analysis of RUSD Page 14
Table 7: Community demographics among peer districts, 2011 Community Demographics
free or
reduced lunch
Rank Income per
return Rank Income per
pupil Rank Property value
per pupil Rank Madison 56.6% 3 $54,022 3 $290,244 1 $949,491 1 Kenosha 49.3% 5 $47,048 7 $128,153 10 $419,734 9 Racine 60.7% 1 $48,132 5 $163,551 7 $492,677 6 Green Bay 57.1% 2 $47,920 6 $176,976 6 $442,542 7 Appleton 37.3% 9 $52,613 4 $196,919 4 $547,079 5 Waukesha 34.7% 10 $60,410 2 $253,656 3 $780,483 2 Eau Claire 41.4% 8 $71,362 1 $271,951 2 $593,438 3 Janesville 55.3% 4 $45,227 9 $159,785 8 $422,769 8 Sheboygan 48.3% 6 $43,074 10 $144,170 9 $402,870 10 Oshkosh 44.3% 7 $46,259 8 $185,524 5 $549,511 4 Milwaukee 83.4% $36,165 $124,412 $367,024 State of Wisconsin 42.5% $50,693 $174,346 $630,301
Chart 1: RUSD free or reduced-price lunch eligibility, 2002-03 to 2011-12
Chart 2: Free or reduced-price lunch eligibility, 2008-09 to 2011-12
35%
61%
0%
10%
20%
30%
40%
50%
60%
70%
2002-03 2003-04 2004-05 2005-06 2006-07 2007-08 2008-09 2009-10 2010-11 2011-12
0%
10%
20%
30%
40%
50%
60%
70%
Madison Racine Kenosha Green Bay Wisconsin
2008-09 2009-10 2010-11 2011-12

15th Comparative Analysis of RUSD Page 15
Table 8 ranks metropolitan areas surrounding the same 10 peer districts by level of adult educational attainment using data from the U.S. Census Bureau’s annual American Community Survey. Between 2010 and 2011, the number of adults over 25 years old who have obtained a college degree (defined as an associate’s degree or higher) in the Racine metropolitan area fell by 6.6 percentage points to about 24%, which is about 10 percentage points below the state average. This percentage places the area last among its peer districts and even below MPS, which improved marginally to 27.5% in 2011. Not surprisingly, the percentage of adults over 25 with no college education rose by about the same amount since 2010 to 54.2%, putting Racine at the top among its peer cities in the “no college” rankings. Racine saw minimal movement in the percentage of its adult residents obtaining some college education, dropping less than one percentage point between 2010 and 2011. To put these trends in perspective, it should be noted that most of the peer districts and the state overall followed similar trends. Table 8: Educational attainment of adults over 25 among peer districts, 2011 Community Demographics
Educational Attainment
No college Some college College degree Rank Madison 22.4% 17.9% 59.7% 1 Kenosha 46.3% 22.2% 31.5% 5 Racine 54.2% 21.4% 24.4% 10 Green Bay 49.1% 21.2% 29.6% 7 Appleton 39.5% 20.4% 40.2% 4 Waukesha 36.0% 21.4% 42.6% 3 Eau Claire 34.4% 21.2% 44.4% 2 Janesville 45.8% 22.8% 31.4% 6 Sheboygan 52.6% 22.8% 24.6% 9 Oshkosh 49.8% 21.2% 28.9% 8 Milwaukee 50.7% 21.7% 27.5% State of Wisconsin 43.9% 21.2% 34.9%
Enrollment and student demographics RUSD’s total enrollment in 2011-12 continued its relatively flat 10-year trajectory, dropping off from the previous year by 291 students (1.4%), as seen in Chart 3. Although this decline is relatively small relative to the district’s total enrollment, it marks a larger enrollment loss than any of the three largest comparison districts and is partially attributable to the new school choice program. Kenosha’s enrollment fell by only 81 students, and Green Bay gained 260 students, bringing it within 173 students of RUSD’s enrollment. Madison’s enrollment spiked sharply upward, interrupting a steady nine-year flat trend, presumably because of an increase in enrollment of about 2,000 new four-year-old Kindergarten students.10
10 http://host.madison.com/wsj/news/local/education/local_schools/madison-school-district-getting-extra-m-in-state-aid/article_5fc92846-16e1-11e2-8479-0019bb2963f4.html

15th Comparative Analysis of RUSD Page 16
Chart 3: Public school enrollment, 2002-03 to 2011-12
As has been the case throughout the past decade, the percentage of minority students enrolled among the four largest peer districts has climbed steadily (Chart 4), with RUSD remaining the consistent leader, at 55.6% minority enrollment in 2011-12. This is about double the rate of minority enrollment statewide, but only one percentage point higher than the Madison district. MPS – which is not shown here – has a minority enrollment rate of almost 86%. RUSD’s minority enrollment is roughly split between African American students and Hispanic students, while about 4% of its minority enrollment consists of students classifying themselves as either Asian, American Indian, Pacific Islander or two or more races. Chart 4: Minority student enrollment, 2002-03 to 2011-12
15,000
17,000
19,000
21,000
23,000
25,000
27,000
29,000
2002-03 2003-04 2004-05 2005-06 2006-07 2007-08 2008-09 2009-10 2010-11 2011-12
Madison Racine Kenosha Green Bay
0%
10%
20%
30%
40%
50%
60%
2002-03 2003-04 2004-05 2005-06 2006-07 2007-08 2008-09 2009-10 2010-11 2011-12
Madison Racine Kenosha Green Bay

15th Comparative Analysis of RUSD Page 17
As shown in Chart 5, since 2007-08, RUSD has ranked first among the four largest comparison districts in percentage of enrollment represented by students with disabilities, hovering around 17% for eight of the past 10 years. Although Madison’s percentage of students with disabilities mirrored that of RUSD until about 2009-10, this portion of its student population began to shrink in that year. Chart 5: Special education enrollment, 2007-08 to 2011-12
Among the four largest comparison districts, RUSD consistently ranks second in terms of private school enrollment levels. This figure inched up in 2011-12 relative to the previous year by about 1.5%, about the same percentage change as total public school enrollment declined over the same period. This movement is likely due to the start of a new private school voucher program in Racine. Over the past five years, in contrast, private school enrollment has fallen faster in Racine than in the other three large districts. At 3,637 students in 2011-12, private enrollment in Racine now almost matches the level in Green Bay and is down 11.7% since 2007-08, as compared to a drop of only about 2% in Madison and 8% in Kenosha and Green Bay over the same timeframe. Chart 6: Private school enrollment in peer communities, 2007-08 to 2011-12
0
500
1,000
1,500
2,000
2,500
3,000
3,500
4,000
4,500
5,000
2007-08 2008-09 2009-10 2010-11 2011-12
Madison Racine Kenosha Green Bay
0
500
1,000
1,500
2,000
2,500
3,000
3,500
4,000
4,500
2007-08 2008-09 2009-10 2010-11 2011-12
Appleton
Racine
Kenosha
Green Bay

15th Comparative Analysis of RUSD Page 18
Student engagement Since 2007-08, attendance in RUSD has remained at roughly 93%, as shown in Chart 7. The district’s rate of 93.3% in 2010-11 was up slightly from the year before, keeping it roughly in step with Kenosha and Green Bay, but still lowest among its peer districts and one-and-a-half percentage points behind the statewide average. Chart 7: Attendance rates, 2001-02 to 2010-11
Note: Attendance data for Green Bay in 2006-07 appears to be skewed due to a reporting abnormality that year. Chart 8 shows that during 2010-11, RUSD reversed a three-year upward trend in truancy rates that followed a five-year drop. The percentage of students classified as habitually truant fell by 0.3 percentage points to 15.2%, which still was almost double the average statewide truancy rate of 8.6%. By comparison, Madison’s truancy rate declined similarly (by 0.4 percentage points), while both Kenosha and Green Bay saw definitive upticks in truancy, increasing by about one full percentage point to 19.2% and 17.7% respectively. The RUSD dropout rate (Chart 9) held steady at 4.6% in 2010-11, an improvement over the slight jump in the previous year but still well above its peer districts and the Wisconsin average of 1.5%. Chart 8: Habitual truancy rates, 2001-02 to 2010-11
Note: Truancy data for Green Bay in 2007-08 appears to be skewed due to a reporting abnormality that year.
94.1% 93.3%
88%
90%
92%
94%
96%
98%
100%
2001-02 2002-03 2003-04 2004-05 2005-06 2006-07 2007-08 2008-09 2009-10 2010-11
Madison Racine Kenosha Green Bay
0%
5%
10%
15%
20%
25%
2001-02 2002-03 2003-04 2004-05 2005-06 2006-07 2007-08 2008-09 2009-10 2010-11
Madison Racine Kenosha Green Bay

15th Comparative Analysis of RUSD Page 19
Chart 9: Dropout rates, 2001-02 to 2010-11
Note: Dropout data for RUSD in 2003-04 appears to be skewed due to a reporting abnormality that year. Chart 10 shows RUSD’s performance over 10 years in terms of both suspensions (left axis) and expulsions (right axis). The district showed improvement in 2010-11, reversing a two-year upward trend in both areas. The percentage of school days lost due to suspension in 2010-11 fell 1.7 percentage points (a change of about 12%) to 12.2%. At the same time, the percentage of enrolled students expelled dipped to 0.5% (a one-year drop of more than 28%). Nonetheless, these rates remain significantly higher than the average statewide suspension and expulsion rates of 5.5% and 0.1% respectively. Chart 10: RUSD suspension and expulsion rates, 2001-02 to 2010-11
The recent improvements in truancy, dropouts, and other disengagement behaviors may reflect recent efforts to reinvigorate the community’s response to low student engagement. In reaction to high truancy figures in RUSD in the early 2000s, and in recognition of the harmful social and economic impacts of truancy and dropping out of high school, RUSD was one of the first school districts in
0%
1%
2%
3%
4%
5%
6%
7%
2001-02 2002-03 2003-04 2004-05 2005-06 2006-07 2007-08 2008-09 2009-10 2010-11
Madison Racine Kenosha Green Bay
0.0%
0.2%
0.4%
0.6%
0.8%
1.0%
1.2%
0%
2%
4%
6%
8%
10%
12%
14%
16%
2001-02 2002-03 2003-04 2004-05 2005-06 2006-07 2007-08 2008-09 2009-10 2010-11
Expu
lsio
n ra
te
Susp
ensi
on ra
te
Suspension Expulsion

15th Comparative Analysis of RUSD Page 20
Wisconsin to adopt a comprehensive, community-developed truancy plan. Developed in the mid 2000s, the plan resulted in a spectrum of new partnerships and community structures aimed at wrapping support-based interventions around families and holding both parents and students accountable for truancies. RUSD developed collaborations with entities involved in workforce development, human services, law enforcement, and municipal court as well as private sector actors, the University of Wisconsin-Parkside, United Way, the City of Racine, and The Johnson Foundation. These networks garnered new funding and structures to launch a public awareness campaign, develop alternative education for pregnant teens, engage with truants in school as an early-intervention tool, hold “in-school” municipal court, provide dedicated Racine Police Department truancy officers, and create after-school mentoring programs.11
Nevertheless, after seeing truancy rates drop every year between 2000-01 and 2006-07, RUSD saw those rates climb back up again over the next three years (as shown in Chart 7). As a result, community stakeholders are working to find ways to refocus the attention on the problem and to energize ordinary community members to take action. During the spring of 2010, more than 7,000 Racine County middle and high school students participated in a survey to measure protective factors (called developmental assets) and risk-related behaviors affecting the health and well being of youth in the community. The survey calculated percentages of youth that reported having any of 40 assets, eight deficits shown to hinder asset development, 24 risk-taking behaviors, and five thriving behaviors commonly accepted as important to healthy development.12
The survey found that Racine-area youth, on average, reported 17.9 out of 40 assets. Overall, 6th graders believed they possessed 20.4 assets, while the mean number of assets for grades 7 through 12 hovered within one percentage point of the overall sample average. The most frequently reported external assets (experiences that surround a youth) were family support (65%), positive peer influence (60%), and a feeling of safety at home, school, and neighborhood (53%). Only 17% of survey participants reported spending at least three hours per week in activities related to the arts (such as music and theater). Prevalent internal assets (a child’s own commitments, values, and competencies) included 71% of participants reporting a positive view of the future, 65% reporting they act on convictions and stand up for their beliefs, and 65% believing they tell the truth even when it is not easy. The internal asset reported least frequently was reading for pleasure three or more hours per week, which was reported by only 23% of participants.13
The survey also groups 24 risk-taking behaviors in various combinations, such as those related to substance abuse, those associated with anti-social and violent behaviors, and those that occur with especially high frequency. Results directly related to truancy-associated risk-taking behaviors include: “skipped school once or more in the last four weeks,” reported by 13% of sixth graders and 24% of 12th
11 http://www.journaltimes.com/news/local/commentary----despite-efforts-racine-truancy-rate-is/article_d29225d8-4f8d-11e1-9678-0019bb2963f4.html 12 http://www.focusracine.org/uploads/7/3/4/5/7345999/report_-_rc.pdf 13 http://www.focusracine.org/uploads/7/3/4/5/7345999/report_-_rc.pdf

15th Comparative Analysis of RUSD Page 21
graders; and “has skipped school two or more days in the last four weeks and/or has below a C average,” which was reported by 26% of 6th graders and 21% of 12th graders. At the same time, 22% of 6th graders and 29% of 12th graders reported the “thriving indicator” that they get mostly A’s in school. The survey report then plots the number of reported risk-taking behaviors against the number of assets reported. Doing so demonstrates that for Racine County youth in the sample, there is a clear inverse relationship between the number of risk-taking behaviors in which youths engage and the number of assets they report, with an average of 8.2 risk behaviors among youths with between zero and 10 assets, compared to 0.9 risk-taking behaviors among youths with the ideal 31-40 assets.14
In December 2011, RUSD updated its five-year-old truancy plan with several revisions, many of which reflect the survey’s findings regarding the importance of strengthening developmental assets as a mechanism for reducing risk factors such as truancy. The new plan emphasizes parental responsibility for elementary-school aged students, while shifting the focus of responsibility to students themselves for truancies at the secondary level. It also replaces a lottery system for referring habitual truants to municipal court with a collaborative model that involves parents, administrators, faculty, and school social workers in returning students to school. When a truant student returns to school, he or she now will be met with a support team to put into place any accommodations, support interventions, or referrals the student needs to re-engage in school, close academic gaps, or address social and emotional needs.15
14 http://www.focusracine.org/uploads/7/3/4/5/7345999/report_-_rc.pdf 15 http://caledonia.patch.com/articles/racine-unified-changes-truancy-policy; http://www.journaltimes.com/news/local/new-unified-truancy-plan-has-court-parent-changes/article_f16b8bfc-2b07-11e1-b9f0-001871e3ce6c.html; www.cityofracine.org/WorkArea/DownloadAsset.aspx?id=857

15th Comparative Analysis of RUSD Page 22
STUDENT PERFORMANCE
North Star Vision and scorecard comparison RUSD implemented its North Star vision in 2009 as a collaborative effort involving the school board, district administrators, and unions representing teachers, administrators, and support staff. The district regards the North Star as a vision of quality and excellence for RUSD student achievement. The vision defines a path from Kindergarten through high school graduation with the ultimate goal of enabling all district students to graduate from high school ready for success in college or careers.16
The specificity of the North Star vision has allowed the district to maintain a united focus on these goals throughout transitions in leadership over the past two years.
Implicit in the North Star vision is a commitment to eliminating achievement gaps between students with differing external characteristics such as race and family income. To achieve this end, the coalition designed a path consisting of grade-level benchmarks, or measures of success, to which the district holds itself accountable to ensure students graduate either college- or career-ready. The illustration on the next page depicts the measures used for each benchmark and has been widely distributed to parents, teachers, and other district stakeholders. The annual release of the North Star District Scorecard reflects the district’s efforts to monitor progress toward reasonable, achievable targets for performance. The scorecard also is intended to help guide school-level planning such as target-setting and the development of School Improvement Plans. In this section, we highlight the district’s 2011-12 vision for each grade level, beginning with Grade 12. For each measure, we present several years of trend data, using results from the 2008-09 school year as a baseline. At each grade level, the analysis includes an examination of performance trends including those related to achievement gaps, comparisons between current achievement levels and the district’s targets, and a discussion of how well the targets fulfill their purpose of propelling the district toward the North Star vision while remaining reasonable and achievable. In addition, to the extent possible, we provide information on the district’s most recent efforts to improve specific outcomes. To aid readers’ interpretation of the tables, annual targets appear in italic type. Performance results are color-coded to show how they compare to the corresponding year’s target: green indicates the target was met or exceeded; yellow indicates performance improved but did not meet the target; and red indicates performance remained flat or declined. When the district exceeded both the current target and the following year’s target, the result appears in blue type, and the target for the following year has been increased and is underlined.
16 RUSD Results Monitoring Report, September 17, 2012

15th Comparative Analysis of RUSD Page 23

15th Comparative Analysis of RUSD Page 24
Grade 12 One of the district’s Grade 12 goals is to “improve the percentage of all students who graduate with a regular diploma.” As shown in Table 9, with a high school completion17
rate of 73.2% in 2010-11 compared to 73.0% during the previous year, RUSD makes a slight improvement, but still misses its 2008-09 baseline rate of 74.4%. As in several previous years, RUSD also falls short of the average high school completion rate for the state, which saw a slight gain of 0.6 percentage points to reach 90.5% in 2010-11, widening the RUSD-statewide gap to 17.3 percentage points (Chart 11).
Table 9: RUSD high school completion rates, 2005-06 to 2010-11 High school completion
2005-06 2006-07 2007-08 2008-09 2009-10 2010-11 All students 71.3% 75.1% 71.7% 74.4% 73.0% 73.2%
White 80.2% 83.9% 80.4% 82.9% 83.8% 81.3% African American 51.8% 58.2% 55.8% 57.6% 53.2% 60.6% Hispanic 62.2% 63.8% 61.1% 63.9% 66.3% 68.0% LEP n/a n/a 61.8% 71.7% 62.7% 66.0% Low SES n/a n/a 61.7% 63.2% 62.6% 63.0%
Encouragingly, although high school completion for minorities still lags significantly behind the district average, rates for students who are African American, Hispanic, have low English proficiency, or are of low socioeconomic status all improved in 2010-11. Moreover, the completion gap between African American and white students narrowed significantly to 20.7 percentage points, down nearly 10 percentage points from the previous year and halting a two-year widening trend. Part of this narrowing, it should be noted, is attributed to a 2.5 percentage point drop in high school completion for white students (Chart 12). The remainder of the progress in closing the gap, however, came from the 7.4% increase in high school completion on the part of African American students. The gap in high school completion between Hispanic and white students continues its four-year downward trend, dropping 4.2 percentage points in the past year to 13.3 points in 2010-11.
17 As in past annual editions of this analysis, we use high school completion data provided by DPI to assess district performance on this goal. The North Star scorecard uses rates of completion for career and technical certifications.
GRADE 12 VISION: All students will graduate successfully completing career or technical programs and/or graduate with an ACT score at or above the state average.

15th Comparative Analysis of RUSD Page 25
Chart 11: Statewide high school completion rates compared to RUSD, 2005-06 to 2010-11
Chart 12: RUSD high school completion rates by race, 2005-06 to 2010-11
The North Star scorecard also tracks success toward the Grade 12 vision by setting goals to “improve the RUSD average ACT score” and “increase the percentage of all students taking the ACT examination.” Improve ACT score The district set an overall 2011-12 target ACT score of 21.1, 0.5 points higher than its 2010-11 score of 20.6. As was the case in 2010-11, when it set a goal of increasing the average score by the same amount, the district fell short of hitting its target and actually fell to its lowest level (20.2) in at least five years. Since the 2006-07 school year, the district’s average ACT score trend has remained generally flat (Table 10), increasing only twice during that time and never by more than 0.2 points.
0% 10% 20% 30% 40% 50% 60% 70% 80% 90%
100%
2006-07 2007-08 2008-09 2009-10 2010-11
RUSD State
0%
10%
20%
30%
40%
50%
60%
70%
80%
90%
100%
2005-06 2006-07 2007-08 2008-09 2009-10 2010-11
White Black Hispanic

15th Comparative Analysis of RUSD Page 26
Table 10: RUSD ACT composite scores, 2006-07 to 2011-12 ACT composite score
2006-07 2007-08 2008-09 2009-10 2010-11 2011-12 actual
2011-12 target
All students 21.1 21.3 20.6 20.8 20.6 20.2 21.1 White 21.9 22.2 21.6 21.8 22.2 21.9 22.2 African American 17.4 16.9 16.1 16.9 17.1 16.6 17.3 Hispanic 18.8 20.1 18.8 19.2 18.4 18.5 19.6
Further insight into the district’s challenge in meeting its ACT goal can be gleaned by examining scores by racial breakdown. Unlike last year, when only Hispanic student performance declined over the prior year, in 2011-12 the overall score, the white student score, and the African American student score all declined, by 0.4, 0.3, and 0.5 points respectively. Although the Hispanic student score actually increased this year, it did so by only 0.1 points – not enough to pull up the overall average to reach the target. In addition, both the white and African American student average score decreases interrupted a two-year trend of improvement. Although it is difficult to ascertain the reason for the decline, it may be related to recent increases in ACT participation. According to the August 2012 scorecard, ACT targets are set to increase by 0.2 score points each year. In light of the magnitude of the changes in ACT scores among various student subgroups, the district may want to consider setting its ACT score targets to align more closely with past performance, rather than past targets. The district will need to consider its stakeholders’ tolerance for setting modest, meaningful targets, as compared to aiming high with the accompanying risk of missing the targets. Increase ACT participation The district’s actual 2011-12 performance in terms of the percentage of students taking the ACT is more promising (Table 11). Overall, the proportion of test takers climbed to 43%, its highest level since before 2006-07, and a jump of almost three percentage points over the prior year and 6.2 percentage points above the 2009-10 level. Each student subgroup also showed improvement, with an increase in white and African American test takers of 0.5 and 0.1 percentage points, respectively. The increase in the percentage of Hispanic ACT takers is unprecedented, spiking by 13 points to 40.9%. Table 11: Percentage of RUSD students taking the ACT, 2006-07 to 2011-12
ACT percent tested
2006-07 2007-08 2008-09 2009-10 2010-11 2011-12 actual
2011-12 goal
All students 36.0% 38.9% 38.8% 36.8% 40.3% 43.0% 44.8% White 39.9% 43.8% 46.3% 45.4% 47.8% 48.3% 52.3% African American 16.1% 18.9% 17.0% 17.3% 23.6% 23.7% 23.0% Hispanic 17.7% 23.3% 24.6% 22.9% 27.9% 40.9% 30.6%
However promising these results, they do not align very closely with the scorecard targets. It appears the 4.5-point increase expected overall was too high. Since 2006, the year-to-year change in the

15th Comparative Analysis of RUSD Page 27
percentage of ACT test takers district-wide has ranged between -2.0 and 3.5 percentage points. On the other hand, the targets for the percentage of African American and Hispanic test takers were too low. In the case of African American students, the target was set lower than the previous year’s performance. The target for Hispanic students was, in fact, 2.7 points higher than 2010-11 actual performance. This appeared reasonable given the relatively volatile range of past years’ changes in this measure between -1.7 and 5.6 percentage points. The 13-point jump in proportion of Hispanic ACT takers would have been difficult to predict and calls for some investigation on the part of district officials to uncover what might account for such a spike and how it could be replicated for other student groups and for the district as a whole. It also is worth noting that if a large number of these test takers were also students who had low English proficiency, then the spike could partially explain this year’s drop in the district’s average ACT scores. The district is setting up building blocks to improve its long-term ACT performance. In response to a DPI initiative to administer the ACT suite of testing to all students statewide for career planning and accountability, the district introduced EXPLORE and PLAN testing in all middle and high schools to better prepare students for the ACT. EXPLORE (generally taken in 8th and 9th grade) and PLAN (typically for 10th graders) assess English, math, reading and science and add measures of academic growth in earlier grades, allowing schools to intervene early to ensure that younger students are on track to finish high school ready for college or a career. The district plans to continue to administer EXPLORE and PLAN through the next school year and to base course scheduling and progress monitoring on the data generated from the new tests.18
These actions not only should increase the number of students taking the ACT, but also improve ACT scores. At a minimum, they should help the district set more appropriate goals for ACT passage and participation.
Grade 10 The goal for Grade 10 is to “improve the score of Full Academic Year (FAY) 10th grade students …meeting or exceeding the District Writing Proficiency Score (6) as measured by the WKCE Extended Writing Sample…” As was reported in last year’s analysis, the 2011-12 Grade 10 writing scores showed solid improvement district-wide as well as in all student subgroups, establishing a three-year upward trend. With the exception of African American students and students with disabilities, the percentage of Grade 10 students scoring at a proficient level exceeded all targets. Overall, 40.5% of all district students reached proficiency in writing, a proportion that exceeds the target by almost 10 percentage points and meets the district’s 41% target for white students alone, a promising development given the district’s persistent history of generalized racial achievement gaps. Contributing to such success are the consistent improvements in the proportion of proficient writers among minority 18 RUSD Results Monitoring Report, September 17, 2012; http://dpi.wi.gov/esea/pdf/summary.pdf
GRADE 10 VISION: All students will produce writing at the typical grade level in which they are enrolled, or exceed grade-level standards.

15th Comparative Analysis of RUSD Page 28
student subgroups, some of which are dramatic. For example, the proportion of African American students scoring proficient soared to 21.8%, slightly exceeding the overall district percentage of only two years ago. Similarly, the 2011-12 percentage of proficient Hispanic students reached almost 35%, exceeding the 2010-11 measure for the overall district. Nevertheless, these trends mask the reality that the racial achievement gap is, in fact, widening. Part of the reason for the jump in overall district proficiency is the dramatic spike in proficiency of white students of 14.7 percentage points to 52.7%, exceeding the improvements in all other subgroups. This has been a consistent trend over the past three years, as white, African American, and Hispanic students all have shown improvements, but white students accelerated faster than minority students. Whereas the white-African American gap in 2008-09 was 13.1 points, it was 30.9 points in 2011-12. Likewise, the white-Hispanic gap widened from 11.6 points in 2008-09 to 17.8 points in 2011-12. This is a concerning pattern despite undeniable strides forward among minority student groups. Table 12 shows how difficult the process of predicting performance and setting accurate targets can be. For example, targets for all students and white students each were exceeded by about 10 percentage points although they were three percentage points higher than the previous year’s performance. The Hispanic student target (31.7%) also was exceeded, despite being set 11 points higher than the 2010-11 actual percentage. In contrast, the 2011-12 target for African American students predicted performance more closely. Although it was set at about 10 points above the 2010-11 scores, the actual 2011-12 score fell short by 0.6 percentage points. These examples further illustrate a need for the district to examine what seems to predict student performance in various subjects, at various ages, and among various subgroups to better calibrate the scorecard targets to meaningfully drive forward progress in student outcomes. Table 12: RUSD 10th grade students proficient in writing, 2008-09 to 2011-12
Grade 10 Writing
2008-09 2009-10 2010-11 actual
2011-12 actual
2011-12 target
All Students 12.1% 20.9% 28.0% 40.5% 31.0% White 17.5% 27.0% 38.0% 52.7% 41.0% African American 4.4% 10.3% 12.3% 21.8% 22.4% Hispanic 5.9% 19.7% 20.7% 34.9% 31.7% LEP 4.6% 14.4% 17.5% 23.0% 22.6% Low SES 5.2% 13.8% 17.2% 30.0% 23.2% SwD 1.9% 3.8% 8.4% 16.3% 19.9%
* District projections

15th Comparative Analysis of RUSD Page 29
Chart 13: RUSD 10th graders proficient in writing by race, 2008-09 to 2011-12
Grade 9 The goal for Grade 9 is to “increase the percentage of 9th grade students who successfully complete Algebra I with a B or higher.” The state does not administer standardized tests to 9th grade students. For the purposes of setting North Star targets, RUSD measures 9th grade outcomes using Algebra grades as an alternative indicator of student performance, and we present the same data used in the district scorecard. In general, the district shows progress toward its Grade 9 vision but misses its overall target, as well as targets for all student subgroups. Compared to last year’s across-the-board upticks in all categories and dramatic increases in some cases (a 9.3 percentage point jump for all students, for example), 2011-12 performance was mixed. With a one-year increase of 1.6 percentage points in the portion of all students completing Algebra I with a B or better, the district is inching closer to its vision, missing its 37.3% target by about two percentage points. The percentage of white students, Hispanic students, students with low socioeconomic status, and students with disabilities with a B or above in Algebra all increased modestly as well, climbing by 0.9, 1.0, 2.0, and 3.0 points respectively. Students with low English proficiency showed a slight downward slide (1.1 points). African American students made the most progress toward the Grade 9 vision with a gain of 6.5 percentage points in the share of students earning a B or higher in Algebra (after a 2.7-point rise the previous year), narrowing the achievement gap as compared to white students by close to six percentage points. The racial student achievement gap is still wide, however, with 29.7 percentage points separating white and African American students, and 20 points separating white and Hispanic students. As Table 13 shows, Grade 9 algebra performance strikes a similar chord as outcomes in other grades – slight improvement in minority outcomes, yet a continued wide racial achievement gap. The
0.0%
10.0%
20.0%
30.0%
40.0%
50.0%
60.0%
2008-09 2009-10 2010-11 2011-12
White
Black
Hispanic
GRADE 9 VISION: All 9th grade students will do Algebra at grade level or exceed grade-level standards.

15th Comparative Analysis of RUSD Page 30
table also illustrates that the current Grade 9 algebra subgroup targets may not be generally attainable, given past performance. While the percentage of overall students and white students earning a B or better were targeted to increase 2.1 percentage points, minority students and students from other subgroups were slated to increase between 12 and 16 percentage points—significantly exceeding past trends. Table 13: RUSD 9th grade students successfully completing Algebra I with a “B” or higher, 2008-09 to 2011-12
Grade 9 Algebra I
2008-09 2009-10 2010-11 2011-12 actual
2011-12 target
All Students 28.3% 24.3% 33.6% 35.2% 37.3% White 36.0% 37.7% 47.2% 48.1% 50.2% African American 16.3% 9.4% 11.9% 18.4% 34.3% Hispanic 16.5% 12.1% 27.1% 28.1% 34.5% LEP 12.4% 5.6% 18.1% 17.0% 30.4% Low SES 18.1% 12.2% 22.4% 24.4% 36.1% SwD 2.6% 2.6% 4.0% 7.0% 20.6%
Grade 8 The goal for Grade 8 is to “improve the percentage of Full Academic Year (FAY) 8th grade students meeting or exceeding the District Writing Proficiency score (6)”. Table 14 shows the percentage of 8th grade students by student subgroup who scored proficient in writing during the past four academic years. At first glance, this table seems to show a significant district-wide decline in this metric overall – and within each subgroup – between 2010-11 and 2011-12. Closer analysis suggests, however, that the unprecedented growth in writing scores in 2010-11 may have been an aberration. Comparing the 2011-12 proficiency percentages with those from 2009-10 and 2008-09 (effectively skipping 2010-11 for the purposes of analyzing trends) reveals a more linear upward climb in almost all student subgroups. From this perspective, 2011-12 performance is much more promising, showing an increase in writing proficiency over 2009-10 of ten percentage points overall, and slightly higher jumps of 11.2 points for white students and 10.6 points for African American students. Table 14: RUSD 8th grade students proficient in writing, 2008-09 to 2011-12
Grade 8 Writing
2008-09 2009-10 2010-11 2011-12 actual
2011-12 target
2011-12 old target
All Students 10.2% 17.9% 47.4% 27.9% 50.4% 23.9% White 14.1% 25.0% 54.7% 36.2% 57.7% 31.0% African American 4.0% 8.2% 39.2% 18.8% 45.2% 22.0% Hispanic 6.7% 13.6% 42.4% 21.3% 48.2% 24.7% LEP 7.7% 13.2% 32.3% 12.4% 38.2% 25.7% Low SES 5.0% 11.4% 40.0% 21.9% 46.0% 23.0% SwD 2.4% 4.9% 21.5% 8.3% 27.5% 20.4%
GRADE 8 VISION: All students will produce writing at the typical grade level in which they are enrolled or exceed grade-level standards.

15th Comparative Analysis of RUSD Page 31
The district may wish to examine possible reasons for the unusual jump in writing scores during 2010-11 and whether it could be correlated with some factor in that year specific to the curriculum, student population, testing conditions, or some other factor. Assuming 2010-11 proficiency percentages were somehow skewed, an analysis of how well current performance aligns with the scorecard targets would not be fruitful. It is worth noting, however, that the district revised its 2011-12 targets upward to reflect what appeared to be a drastic surge in the percentage of 8th graders scoring proficient in writing in 2010-11. In light of the manner in which 2011-12 actual results align more closely with results from 2009-10 and 2008-09 than with those from the previous year, district officials may wish to revisit the original targets, which also are shown in Table 14. Grade 6 The goal for Grade 6 is to “improve the reading achievement of 6th grade students.” As was the case last year, the district failed to meet any of its Grade 6 reading targets.19 A brief look at the targets compared to current and historical performance trends suggest they were quite ambitious. With the exception of Hispanic students and students with low English proficiency, the percentage of 6th graders with a proficient reading score fell in 2011-12 compared to 2010-11. Overall, roughly 72% of the district’s 6th graders demonstrated reading proficiency on the WKCE,20
down four percentage points from 2010-11. The percentage of proficient white 6th graders dropped slightly, while the proficiency percentages for African American students and those of low socioeconomic status dropped decisively (by eight and 12 percentage points, respectively). Hispanic students and those with low English proficiency showed moderate improvement.
Table 15 shows wide achievement gaps for Grade 6 reading outcomes, similar to other subjects in other grade levels. The achievement gap between white and African American students had shown signs of improvement previously, declining for two straight years between 2007-08 and 2009-10, but since then it has widened again, returning to its 2006-07 level of 28.5 percentage points. Hispanic students, by contrast, are beginning to close the gap with their white counterparts, showing proficiency at a rate 15.2
19 Student achievement levels listed in this report for Grade 6, Grade 5, and Grade 3 are slightly different than those listed in the district scorecard because data in this report do not include students who took the Wisconsin Alternate Assessment (WAA) instead of the WKCE for reading and math assessment. These students consist primarily of students with disabilities, and therefore the SwD category does not appear in the tables for Grades 6, 5, and 3. 20 In this report, all WKCE results are reported using the proficiency definitions and cut scores that were in effect at the time the exam was administered. In the future, results will be reported using more rigorous definitions of proficiency.
GRADE 6 VISION: All students will read at the typical grade level in which they are enrolled or exceed grade-level standards.

15th Comparative Analysis of RUSD Page 32
percentage points below their white peers, a narrowing of almost 10 percentage points since 2006-07 and rapidly approaching the district average. Similarly, the achievement gap separating the overall class average from low SES and LEP students has diminished by about half over the past five years. Chart 14 compares Grade 6 reading performance in RUSD with the rest of the state and two peer districts. Although the state and all three districts declined in 2011-12 compared to 2010-11, RUSD fell by the largest amount, and continues to perform well below both peer districts overall. Table 15: RUSD 6th grade students proficient or advanced in reading, 2006-07 to 2011-12
Grade 6 Reading
2006-07 2007-08 2008-09 2009-10 2010-11 2011-12 actual
2011-12 target
All students 72.3% 74.9% 71.4% 77.5% 75.9% 71.9% 84.8% White 84.3% 87.5% 82.9% 85.5% 85.6% 84.5% 92.2% African American 55.9% 56.1% 57.7% 67.2% 64.0% 56.0% 77.6% Hispanic 59.3% 70.8% 63.8% 72.2% 68.7% 69.3% 82.5% LEP 49.6% 62.6% 54.8% 63.0% 59.2% 60.4% 73.1% Low SES 58.6% 63.3% 60.1% 68.5% 67.4% 65.4% 79.6%
Chart 14: 6th grade students proficient or advanced in reading, 2006-07 to 2011-12
Grade 5 The district’s goal for Grade 5 is to “improve the mathematics achievement of 5th grade students.” The district’s Grade 5 math performance looks much like its Grade 6 reading performance in that none of the targets were reached, the overall percentage of proficient students showed no improvement, and there was only slight improvement in subgroups in those instances where such improvement occurred. Table 16, which
60.0%
65.0%
70.0%
75.0%
80.0%
85.0%
90.0%
Racine Kenosha Green Bay State
2006-07
2007-08
2008-09
2009-10
2010-11
2011-12
GRADE 5 VISION: All students will do math at the typical grade level in which they are enrolled or exceed grade-level standards.

15th Comparative Analysis of RUSD Page 33
shows the district’s 2011-12 Grade 5 targets alongside the year’s actual performance, indicates the targets clearly overshoot historical performance, as was true for Grade 6 reading targets. Moreover, they exceed actual 2011-12 performance by just over 10 percentage points overall, and as much as 23 points in the case of African American students. Overall, the rate of proficiency in Grade 5 math remained flat at 64.5%. White students showed a slight improvement (1.6 percentage points over the prior year), as did Hispanic students (up 0.2 points to 61.3%) and LEP students (up 0.6 points to 57.4%). The achievement gaps between white students and minority students persist, however, as well as the gap between the overall district average and any of the student subgroups. At just over 22%, the proficiency gap between the district as a whole and African American students has barely budged since 2006-07; and the gap between white and African American students has widened to its highest level in at least five years (38.5 percentage points). Chart 15 shows that the relatively flat trend in the district’s Grade 5 math outcomes mirrors the stagnant pattern for the state overall. And, as was true with Grade 6 reading, RUSD continues to trail its peer districts in Kenosha and Green Bay in terms of overall 5th grade math proficiency, and it trails the state overall by about 14 percentage points. Table 16: RUSD 5th grade students proficient or advanced in math, 2006-07 to 2011-12
Grade 5 Mathematics
2006-07 2007-08 2008-09 2009-10 2010-11 2011-12 actual
2011-12 target
All students 61.7% 56.7% 64.0% 64.7% 64.5% 64.5% 74.6% White 75.2% 71.8% 75.1% 76.7% 78.6% 80.2% 85.3% African American 38.7% 34.6% 44.1% 47.5% 44.3% 41.7% 65.0% Hispanic 57.7% 48.2% 60.1% 58.7% 61.1% 61.3% 78.8% LEP 52.7% 41.7% 57.3% 55.2% 56.8% 57.4% 75.3% Low SES 47.6% 41.9% 50.7% 53.8% 55.3% 54.6% 71.3%
Chart 15: 5th grade students proficient or advanced in math, 2006-07 to 2010-11
0%
10%
20%
30%
40%
50%
60%
70%
80%
90%
Racine Kenosha Green Bay State
2007-08
2008-09
2009-10
2010-11
2011-12

15th Comparative Analysis of RUSD Page 34
Grade 4 The goal for Grade 4 is to “improve the percentage of Full Academic Year (FAY) 4th grade students meeting or exceeding the District Writing Proficiency score (6)”. Grade 4 is the first time the district examines writing proficiency for the purposes of meeting North Star scorecard targets. Overall, the district narrowly met its goal of demonstrating improvement, increasing the proportion of proficient 4th graders by 0.9 percentage points to 34.3%. It missed the corresponding target by 1.3 percentage points, however. The white student group was the only category that met its target. In addition, the proficiency rate for every other subgroup except for students with disabilities decreased compared to 2010-11 levels. This is the first time the district has seen any backslide in these measures since the 2008-09 baseline year, which could affect the district’s approach in setting realistic targets in subsequent years. Table 17: RUSD 4th grade students proficient in writing, 2008-09 to 2011-12
Grade 4 Writing
2008-09 2009-10 2010-11 2011-12 actual
2011-12 target
All Students 6.1% 29.6% 33.4% 34.3% 35.6% White 8.3% 36.4% 39.2% 42.7% 42.4% African American 3.1% 20.9% 24.7% 22.2% 32.6% Hispanic 4.2% 25.7% 33.9% 33.3% 37.7% LEP 4.0% 21.3% 31.3% 30.3% 33.3% Low SES 3.8% 23.6% 28.7% 28.1% 35.6% SwD 3.2% 10.4% 11.6% 14.4% 21.2%
Writing proficiency is targeted in grades 4, 8, and 10, with 10th graders having the largest achievement gaps between subgroups of students. Chart 16 shows the racial and socio-economic gaps in each grade in 2011-12. Chart 16: Writing test racial and socio-economic achievement gaps, 2011-12
0%
5%
10%
15%
20%
25%
30%
35%
Grade 4 Grade 8 Grade 10
African American-White Gap
Hispanic-White Gap
Low SES-All Student Gap
GRADE 4 VISION: All students will produce writing at the typical grade level in which they are enrolled or exceed grade-level standards.

15th Comparative Analysis of RUSD Page 35
Grade 3 The goal for Grade 3 is to “improve the reading achievement of 3rd grade students.” Table 18 shows that while RUSD failed to hit its 2011-12 targets, it did improve 3rd grade reading achievement, raising its overall 3rd grade proficiency rate by 2.6 percentage points to 68.2%, its highest level since 2007-08. This is still more than 10 percentage points below the state 3rd grade reading average of 78.8%, but it narrows the gap relative to the previous year by almost three percentage points. Compared to peer districts, RUSD narrowly beat the Green Bay average for the first time since 2006-07 and closed its gap with Kenosha by almost seven percentage points (see Appendix I for peer analysis). Table 18: RUSD 3rd grade students proficient or advanced in reading, 2006-07 to 2011-12
Grade 3 Reading
2006-07 2007-08 2008-09 2009-10 2010-11 2011-12 actual
2011-12 target
All students 69.8% 65.6% 62.9% 67.6% 65.6% 68.2% 73.0% White 78.6% 78.2% 76.0% 81.4% 75.4% 79.0% 85.6% African American 57.6% 51.1% 47.3% 47.8% 51.5% 55.4% 67.1% Hispanic 62.4% 55.2% 55.5% 62.3% 62.9% 64.0% 75.0% LEP 60.7% 51.5% 53.3% 60.6% 57.5% 59.7% 71.6% Low SES 58.6% 55.1% 51.7% 56.3% 57.4% 60.0% 71.3%
Looking at the attainability of the 3rd grade district targets strikes a familiar theme – they appear to be quite ambitious for most subgroups. For example, the target for the district average is about five percentage points higher than actual 2011-12 performance, which is at its highest point since 2006. The same is true for minority and disadvantaged student subgroups, whose performance was at least 11 percentage points below the 2011-12 target. While the district showed modest improvements across all subgroups, achievement gaps remain relatively wide (Chart 17). The proficiency level for African American students was the lowest among the subgroups, but this subgroup achieved the largest one-year improvement, climbing almost four percentage points to 55.4%. Yet, this is still more than 23 percentage points behind their white peers and about 13 points below the district average. The increase in Hispanic student proficiency was slight, rising 1.1 percentage points to 64%, and resulting in a wider gap relative to both the district average and white students in the 2011-12 school year. The disparity between the district average and LEP and Low SES students remains flat at about eight points.
GRADE 3 VISION: All students will read at the typical grade level in which they are enrolled or exceed grade-level standards.

15th Comparative Analysis of RUSD Page 36
Chart 17: RUSD racial achievement gap in 3rd grade reading, 2007-08 to 2011-12
Kindergarten The goal for Kindergarten is to “improve the reading achievement of all Kindergarten students.” As with Grades 3 and 6, the 2011-12 Kindergarten reading targets were not met (Table 19). With the exception of disabled students, Kindergarten reading scores improved across the board, however. Almost 31% of Kindergarteners were reading at a 1st grade level at the end of the year, up two percentage points from the previous year, but falling short of the target by 2.7 points. Targets for minority and disadvantaged student subgroups substantially outpaced actual performance, by as much as 12 percentage points in the case of African American students and about 20 percentage points for students with disabilities. Table 19: RUSD Kindergarten reading, 2008-09 to 2011-12
Kindergarten Reading
2008-09 2009-10 2010-11 2011-12 actual
2011-12 target
All Students 24.6% 25.2% 28.9% 30.9% 33.6% White 34.3% 36.6% 38.8% 42.8% 43.3% African American 12.3% 13.1% 16.7% 18.4% 30.3% Hispanic 17.4% 15.5% 22.4% 24.5% 35.4% LEP 13.0% 11.6% 20.3% 24.0% 31.0% Low SES 12.8% 17.2% 20.9% 21.2% 30.8% SwD 12.2% 15.0% 18.4% 10.3% 30.2%
The results of the Kindergarten North Star goal highlight the achievement deficit certain subgroups of students will carry with them throughout the remainder of their school career. The reading
0.0%
10.0%
20.0%
30.0%
40.0%
50.0%
60.0%
70.0%
80.0%
90.0%
2007-08 2008-09 2009-10 2010-11 2011-12
White
Black
Hispanic
KINDERGARTEN VISION: All students will read at the beginning 1st grade level or above by the end of Kindergarten.

15th Comparative Analysis of RUSD Page 37
achievement gap between white and African American students in Kindergarten is 24.4 percentage points (Chart 18). To achieve parity in later years, this gap must shrink dramatically. Chart 18: RUSD racial achievement gap in Kindergarten reading, 2008-09 to 2011-12
To tackle this problem, RUSD has undertaken several actions aimed at improving early childhood education. Beginning with the 2012-13 school year, RUSD is implementing the Phonological Awareness Literacy Screening (PALS-K), which is a DPI-selected Kindergarten assessment tool. Kindergarten classroom teachers will administer the PALS-K to identify students who need learning support in fundamental pre-literacy skills. Use of this tool will allow earlier intervention in Kindergarten classrooms for students who need it. In addition, recognizing that the district needs outside assistance to reach the North Star goals, RUSD is a member of the School Readiness Coalition Pilot Project. This collaboration between RUSD and five other organizations formed in 2010 with a shared belief in the importance of preparing children to enter school with the developmental skills necessary for academic success. 21 The coalition’s goal is to establish a common process for determining school readiness, monitoring student progress along the educational continuum from Kindergarten to the primary grades, and fostering continuous improvement of early childhood programs.22
So far, the pilot project has been developing and testing a screening instrument and data-sharing process for assessing the growth and development of four- and five-year-olds. Staff members from the coalition organizations administered the nationally accepted developmental screening tool, Ages & 21 School Readiness Coalition member organizations are RUSD, Racine Kenosha Community Action Agency for Head Start, Next Generation Now, 21st Century Preparatory School, United Way of Racine County, and The Johnson Foundation at Wingspread. 22 School Readiness Coalition Pilot Project: A report to the Boards of Directors, June 2012, found in the RUSD Superintendent’s report, file name: 20120618_Packet.pdf; http://www.johnsonfdn.org/aboutus/community/school-readiness
0%
5%
10%
15%
20%
25%
30%
35%
40%
45%
2008-09 2009-10 2010-11 2011-12
White
Black
Hispanic

15th Comparative Analysis of RUSD Page 38
Stages Questionnaires. The screenings are designed for use by parents and caregivers to determine whether children have mastered developmentally appropriate skills in the areas of communication, gross motor, fine motor, problem solving, and personal social. The coalition recently released a preliminary report documenting the data collected to date. The program screened 127 children, with 66 of those children receiving screenings at two different times. Findings from this initial sample were encouraging in that they did not identify a substantial percentage of children with severe developmental delays prior to entering Kindergarten. Specifically, among a sample of 114 children who were screened at about age five, 4% showed a delay in communication, 4% in fine motor skills, and 1% in gross motor skills. The screening tool also identified between 3% and 7% of children needing to be monitored for possible delays in at least one of the five developmental areas. These findings will help educators and parents identify children who need early intervention, and to provide age-appropriate learning activities for all children. In addition, the coalition is working with RUSD to enter the pilot data into Schoolnet, the district’s new information management software. As a result, the data will be linked to future student records that Kindergarten teachers can use to be better informed about their students and tailor their instruction accordingly, easing the transition to formal schooling. Going forward, project partners plan to expand the program to screen all participants twice, to screen a much larger pool of children, and to roll out a screening tool that looks at social emotional development. Finally, once the data collection process is well established, project planners hope to begin detailed analysis about patterns in developmental delays based on developmental stage, demographics, and parent education and resources – as a way to focus resources where they are needed most and at the earliest point in time. Assessing the North Star Scorecard – Is it working as intended? To gain wider perspective on how the district is progressing toward its North Star vision, it is helpful to remember the historical function of the annual scorecard, which is to set reasonable and achievable targets for district performance. Unfortunately, the mechanism for establishing targets may not meet that objective. At the time of the creation of the North Star vision, the district set annual targets that were intended to remain in place throughout the five-year period beginning in 2008-09 and ending in 2011-12. This scorecard follows a general rubric for setting targets that has resulted in targets being increased each year by a specified amount. Even if the target is missed in a given year, the next year’s target is increased over the previous year’s target. When the prior year’s performance exceeds its target, the scorecard generally revises its targets to increase over the prior year’s actual performance. This target-setting is done for each subgroup of students. For example, in the areas of high school completion, writing, reading, and math, targets increase from year to year by three percentage points for the White and All Students categories. For the African American, Hispanic, LEP, Low SES, and SwD categories, targets increase each year by six percentage points, under the rationale that these students

15th Comparative Analysis of RUSD Page 39
have more ground to cover to reach college and career readiness goals by the time they graduate. This reasoning is consistent with provisions in the state’s new accountability system that aim to narrow achievement gaps by expecting higher growth from students at lower levels of performance. Nevertheless, as this analysis demonstrates, the initial five-year North Star targets seem to have been out of reach in many cases, especially for minority students and those with economic disadvantages or disabilities. At the same time, the scorecard results hold promise when viewed from a different angle – the progression of grade-level results by subject. For instance, overall 2011-12 reading proficiency rates improve from 68.2% in 3rd grade to 71.9% in 6th grade. In math, although the percentage of students in all subgroups meeting the target declines between Grade 5 WKCE proficiency targets and Grade 9 algebra grades, the percentage of African American students meeting the 9th grade algebra target is greater than the percentage of African American students who meet proficiency standards in Grade 5 math. RUSD now has an opportunity to adjust its target-setting approach. The district has begun a planning process to establish targets for a new five-year North Star trajectory for the period between 2012-13 and 2016-17. Among the changes to the scorecard being considered, the district has discussed setting targets that align with the state’s 2016-17 AMO targets. In any case, the dramatic school accountability policy changes slated to roll out over the next couple of school years and the upcoming adoption of a new state assessment make this an opportune time for the district to reconsider and revise its target-setting practices. The district will need to explore strategies that balance the need to address high expectations for student achievement with the benefits of having a scorecard that accurately reflects the progress the district is making in the new policy environment and identifies attainable opportunities for moving the needle for the district’s struggling students. The district also could use this occasion to identify additional opportunities to hone the North Star scorecard as a tool for building district accountability. For example, the North Star focus on ACT participation and scores as measures of college and career readiness is aligned with DPI’s proposal to provide state funding for all juniors and seniors statewide to take the ACT. As the district considers how to restructure the North Star vision in light of the state’s school accountability transformation, it could consider enriching its college and career readiness focus to include wider-ranging measures. Examples of such measures might include: • More closely monitoring the effectiveness of AP and vocational courses by tracking the diversity of
AP and vocational course offerings or measuring participation and achievement gaps in AP exam performance and apprenticeship programs.
• Monitoring college matriculation and persistence rates of graduates and tying these data to students’ high school performance and access to AP courses.
• Given the state’s intensified focus on teacher performance, layering into the North Star scorecard measures of educator effectiveness alongside measures of student achievement.

15th Comparative Analysis of RUSD Page 40
• Aligning measures of student growth, especially in the younger grades, between the North Star vision and the new school report cards.
RUSD’s new instructional/management system (Schoolnet) would make changes in the North Star vision easier than ever to accomplish. The system allows teachers and administrators to access and analyze a comprehensive database of student data that includes test results, demographic information, classroom performance, attendance metrics, and best teaching practices. The district plans to use the system to enhance differentiation of instruction to meet students’ individual needs; encourage more teacher collaboration; monitor district performance on North Star accountability benchmarks; and align district curricula, lesson plans, and resources with the Common Core State Standards.23
Schoolnet also may help RUSD conduct deeper analyses of performance at individual schools to complement district-level analyses like this one. Such analyses not only would shed light on problems at individual schools, but also could highlight those that are achieving success and could serve as models for district-wide reforms. For example, DPI named three of the district’s elementary schools as Wisconsin Schools of Recognition – Jerstad-Agerholm, Roosevelt, and West Ridge (its third consecutive year of recognition). The designation recognizes schools that educate a high percentage of low-income students, demonstrate above-average scores on WKCE reading and math tests compared to similar schools, and meet adequate yearly progress for at least two consecutive years. In fact, Jerstad-Agerholm Elementary was one of 269 schools nationwide that gained recognition by the U.S. Department of Education’s 2012 Blue Ribbon Schools. These are schools that are meeting the challenges involved with educating students who are economically disadvantaged. Their recognition as exceptional schools suggests there are recipes for success within RUSD that could be replicated throughout the system to propel the district toward its North Star vision.
23 http://www.racine.k12.wi.us/?do=parents.content&pageID=165; http://www.journaltimes.com/news/local/unified-approves-electronic-data-bank-vendor/article_b5ea643e-4d3e-11df-ab95-001cc4c03286.html; RUSD Results Monitoring Report, September 17, 2012; Reinvesting in Racine, December 8, 2010

15th Comparative Analysis of RUSD Page 41
WKCE reading and math trends While North Star monitors RUSD’s progress in comparison to its own goals, this report has a 15-year history of comparing RUSD’s progress to that of its most similar peer districts. This peer comparison relies on state standardized tests and other data comparable across Wisconsin and collected by the Department of Public Instruction. In this section, we use those data to analyze long-term reading and math trends. Prior to the passage of the federal No Child Left Behind Act of 2001, Wisconsin administered the WKCE reading and math tests each year to students in 4th, 8th, and 10th grades only. This section includes analysis of this data, going back to the 2006-07 school year, as the data provide an additional dimension of district performance, helping to round out the overall picture of the district’s progress toward the North Star. Charts 19, 20, and 21 compare historical reading scores for RUSD with the Kenosha and Green Bay peer districts and the state. As shown, RUSD’s students follow a similar pattern as those in its peer districts and statewide in that average reading scores tend be higher in 8th grade as compared to 4th grade, but significantly lower in 10th grade as compared to 8th grade. As in previous years, RUSD’s aggregate reading level falls well below the state average and that of its peer districts in Kenosha and Green Bay. Reading scores in 4th and 8th grades fell statewide and in all three districts, with RUSD dropping its reading proficiency level to 69% in both 4th grade and 8th grade. The 8th grade drop stands out, as it represents a seven percentage-point dip and the first time the district has dropped below 70% in seven years. RUSD made the largest one-year jump in 10th grade reading proficiency, however, rising seven percentage points to 59% in 2011-12. Charts 22, 23, and 24 make a parallel comparison for math proficiency rates. A quick glance shows that math scores across the board generally are lower than reading scores and tend to be lower in each successive grade. As in the case of reading, average math proficiency among RUSD students is consistently below the state average and the Kenosha and Green Bay averages. RUSD is showing encouraging signs of improvement, however. The district’s 4th grade math proficiency rose three percentage points to 69% between 2010-11 and 2011-12, its highest level since before 2004. Its 8th grade rate held steady at about 60%, also its highest 8th grade math proficiency rate over the past seven years. Finally, unlike the state, Kenosha, or Green Bay, RUSD raised its 10th grade math proficiency rate in 2011-12, by two percentage points to 45%. This is still well below the 70% state average, but it is encouraging given the low 2010-11 proficiency rate. See Appendix I for tables with reading and math proficiency rates for all peer districts for grades 3, 4, 8, and 10.

15th Comparative Analysis of RUSD Page 42
Chart 19: 4th graders proficient or advanced in reading, 2007-08 to 2011-12
Chart 20: 8th graders proficient or advanced in reading, 2007-08 to 2011-12
Chart 21: 10th graders proficient or advanced in reading, 2007-08 to 2011-12
0% 10% 20% 30% 40% 50% 60% 70% 80% 90%
100%
Racine Kenosha Green Bay State
2007-08 2008-09 2009-10 2010-11 2011-12
0% 10% 20% 30% 40% 50% 60% 70% 80% 90%
100%
Racine Kenosha Green Bay State 2007-08 2008-09 2009-10 2010-11 2011-12
0% 10% 20% 30% 40% 50% 60% 70% 80% 90%
100%
Racine Kenosha Green Bay State 2007-08 2008-09 2009-10 2010-11 2011-12

15th Comparative Analysis of RUSD Page 43
Chart 22: 4th graders proficient or advanced in math, 2007-08 to 2011-12
Chart 23: 8th graders proficient or advanced in math, 2007-08 to 2011-12
Chart 24: 10th graders proficient or advanced in math, 2007-08 to 2011-12
0% 10% 20% 30% 40% 50% 60% 70% 80% 90%
100%
Racine Kenosha Green Bay State 2007-08 2008-09 2009-10 2010-11 2011-12
0% 10% 20% 30% 40% 50% 60% 70% 80% 90%
100%
Racine Kenosha Green Bay State 2007-08 2008-09 2009-10 2010-11 2011-12
0% 10% 20% 30% 40% 50% 60% 70% 80% 90%
100%
Racine Kenosha Green Bay State 2007-08 2008-09 2009-10 2010-11 2011-12

15th Comparative Analysis of RUSD Page 44
Racine’s Parental Private School Choice Program The 2011-13 Wisconsin state budget created a Parental Private School Choice Program (PPSCP) that allowed 250 low-income Racine students to attend private schools with taxpayer-funded vouchers during its first year, which was the 2011-12 school year. The cap on voucher students in the program expanded to 500 for 2012-13, after which time the cap will be removed, allowing any student who meets the eligibility criteria to receive public vouchers to attend private schools. During the 2011-12 school year, the program enrolled 228 voucher users in eight schools. Table 20 shows aggregate WKCE performance for the Racine PPSCP students for all tested grades in 2011-12. Overall, the students using vouchers scored proficient or advanced in reading at a rate of 56%. In math, the rate of proficient or advanced achievement was slightly lower at 51%. By comparison, RUSD students overall tested at 70% proficient or advanced in reading, and 62% in math. Because these results represent the first year of the program and an extremely small pool of test takers, caution should be taken in drawing conclusions from these results. As the new Racine choice program grows in future years, it may be possible to draw more meaningful comparisons between Racine’s PPSCP student achievement levels and those of RUSD overall, participants in the Milwaukee Parental Choice Program, and students statewide. Table 20: WKCE scores in Racine Parental Private School Choice Program (PPSCP) Student Performance
Enrollment
% Not Tested
Reading
% Proficient/ Advanced Reading
% Not Tested Math
% Proficient/ Advanced
Math John Paul II Academy 27 19% 44% 19% 44% Mount Pleasant Renaissance School 8 0% 63% 0% 63% Our Lady Of Grace Academy 13 0% 77% 0% 62% Saint Joseph School 7 0% 57% 0% 57% Shoreland Lutheran High School 1 * * * * Wisconsin Lutheran School 5 * * * * Racine PPSCP 61 8.2% 50.8% 8.2% 47.5% RUSD 9,652 0.9% 69.7% 0.4% 62.1% State of Wisconsin 431,363 0.6% 81.9% 0.4% 78.0%
* To protect student privacy, DPI suppresses testing data when the number of students per grade is below six.
Note: The total number of students with test results is 61, instead of 228 because the WKCE is only required for students in grades 3 through 8 and 10. The difference between total 2011-12 PPSCP enrollment of 228 and the number of students who took the WKCE is the number of voucher students who were below 3rd grade or in 9th grade during the school year. Only six schools appear on the chart because two of the eight participating schools enrolled voucher students below grade 3 only, and therefore did not administer state tests to their voucher students.

15th Comparative Analysis of RUSD Page 45
Measures of Academic Progress (MAP) individual growth scores in reading and math The North Star vision’s specific function is to measure the district’s progress toward giving all students the knowledge and skills they need to graduate from high school ready for success. North Star targets are focused on aggregate annual snapshots of district WKCE performance and are applied to different cohorts of students each year. They do not measure individual student growth over time. Fortunately, over the past several years, the district has also administered the Measures of Academic Progress (MAP) test, an assessment that does measure individual student achievement growth. Used widely across the state and nationwide, the MAP test has a purpose distinct from that of the WKCE. Whereas the WKCE gives parents and taxpayers an understanding of how well districts and schools are meeting state standards, the MAP test provides parents and teachers with a sense of how much improvement students show in the their understanding of academic material. The MAP test is administered repeatedly over the course of a year, and the scores are used to create growth targets that are tailored for each individual student. In this way, MAP scores complement North Star results and help create a more robust assessment of district performance. Tables 21 and 22 show the five-year trend in MAP growth scores in math and reading from the fall to spring of each school year. The “average growth” figure equals the average change in students’ scores over the course of the year. Each student has an individualized growth target based on a national norm for students starting at the same score in the fall. The “percent of growth target” figure equals the total student growth divided by the total of the individual growth targets; a result of 100% would be considered average, as it would indicate that total student growth equaled, but did not exceed, the aggregate growth target. The “percentage of students hitting the growth target” figure equals the portion of students in that grade who met or exceeded their individual growth targets in that year. The developer of the MAP test, the Northwest Evaluation Association (NWEA), considers any school or district having 70% or more of its students meeting their individual growth targets to be exemplary. Table 21 presents individual growth indicators in math scores over a five-year period for several cohorts of students. 24
24 MAP score trend tables generally measure growth twice per year – from Fall to Spring, to reflect growth over a school year, and from Spring to Fall of the next year, to capture any summer learning loss. However, Tables 21 and 22 do not include Fall 2011 data points because of a NWEA test administration problem that affected districts that use MAP testing.
A quick glance reveals that with the exception of 1st grade, average math growth rarely comes close to reaching 100% of a grade level’s target. Each row shows how the students at a given grade level performed each year from 2007-08 through 2011-12. Using Grade 5 as an example because it is the first station on the North Star trajectory that evaluates math performance, it appears that, for the past five years, average growth for RUSD 5th graders has been between 6.1 and 7.5 points, that total growth in any given year reached between 66% and 99% of that year’s individual growth targets, and that the percentage of 5th graders hitting their targets ranged between 37% and 53%. Although some

15th Comparative Analysis of RUSD Page 46
variation in performance between grade levels is to be expected, the fact that only 37% of the most recent class of 5th graders met its targets, and that their total growth represented only 66% of the aggregate growth target, raises some concern for the district, especially in light of its missed 5th grade North Star math targets. Following the shaded cells allows for an analysis of each cohort of students as they progress through successive grades. Although the cohort that entered 2nd grade in the fall of 2007 (blue cohort) saw its average growth fall each year, the growth compared favorably to the aggregate growth target through 5th grade, ranging between 82% and 97%. In 6th grade, the growth slowed to 67% of the aggregate growth target. Although it is more difficult as students grow older for growth trajectories to stay on a steep slope, the NWEA adjusts growth targets to accommodate this typical flatter growth. A significant decline in growth as a percentage of aggregate growth target is of concern. Table 21: RUSD math MAP growth scores, 2007-08 to 2011-12
MATH 2007-08 2008-09 2009-10 2010-11 2011-12
Ave.
growth
% of growth target
% of students hitting target
Ave. growth
% of growth target
% of students hitting target
Ave. growth
% of growth target
% of students
hitting target
Ave. growth
% of growth target
% of students
hitting target
Ave. growth
% of growth target
% of students hitting target
1st 18.5 109 62 19.6 116 67 19.7 116 69 18.5 109 59 18.3 78 22 2nd 11.5 82 35 11.5 84 36 11.2 81 36 12.0 89 44 12.0 79 39 3rd 8.8 81 39 10.8 97 50 11.1 101 53 11.3 102 53 10.7 80 38 4th 6.8 74 38 8 89 46 7.7 84 43 7.6 90 46 8.1 37 43 5th 6.6 86 45 7.5 99 53 7 92 50 6.8 84 45 6.1 66 37 6th 5.6 81 46 6.1 89 48 5.5 80 45 4.3 73 43 4.0 67 43 7th 4.6 72 43 4.5 71 44 4.3 68 42 3.6 74 46 5.1 94 53 8th 3.8 74 46 3.6 73 46 3.8 77 46 3.7 91 50 4.8 96 51 9th 2.4 80 50 1.6 54 47 1.4 46 46 0.8 38 47
Table 22: RUSD reading MAP growth scores, 2007-08 to 2011-12
READING 2007-08 2008-09 2009-10 2010-11 2011-12
Ave.
growth
% of growth target
% of students hitting target
Ave. growth
% of growth target
% of students
hitting target
Ave. growth
% of growth target
% of students hitting target
Ave. growth
% of growth target
% of students
hitting target
Ave. growth
% of growth target
% of students hitting target
1st 17.9 126 68 17.5 123 66 17.0 121 66 15.8 95 46 19.0 91 42 2nd 12.1 87 42 12.8 91 46 12.1 87 43 10.0 73 33 9.0 58 29 3rd 8.8 86 46 11 104 54 11.2 105 56 10.6 107 53 8.3 69 41 4th 7 93 49 7.6 101 53 7.6 100 53 7.3 101 53 7.8 89 50 5th 5.6 99 53 6.5 116 58 6.2 108 56 5.2 94 50 5.5 81 48 6th 4.7 90 49 4.9 98 52 4.6 93 53 4.3 101 53 4.8 98 53 7th 3.9 81 49 3.5 74 48 3.4 72 48 2.7 74 46 3.1 78 50 8th 2.9 74 49 2.3 60 46 2.4 62 46 2.3 68 48 3.7 90 50 9th 1.3 52 47 1.6 62 47 1.7 61 48 0.0 2 45

15th Comparative Analysis of RUSD Page 47
Table 22 permits a similar analysis for MAP reading scores. The table shows that although average growth in reading is not typically higher than in math, the percentage of total growth that meets aggregate growth targets and the percentage of students hitting their targets are generally higher in reading than in math for any given year and grade. To illustrate, whereas total math growth reaches 100% of the target only a few times and only for 1st and 3rd graders, total reading growth hits 100% of the growth target more consistently, affecting 1st, 3rd, 4th, 5th, and 6th grades. The relationship between MAP scores and district performance on the North Star scorecard is less clear in the case of reading. According to Table 22, the 2011-12 3rd grade cohort reading growth equaled 69% of the cohort’s aggregate growth target and only 41% of 3rd graders hit their target. This coincides loosely with 3rd grade WKCE reading performance, which improved over 2010-11 but did not meet its North Star targets. In contrast, Grade 6 missed its North Star targets in 2011-12, but that cohort’s MAP reading score growth made up 98% of the cohort’s aggregate growth targets and more than half of the cohort met its targets, the highest percentage of students meeting their targets of any grade that year. Notably, 2011-12 is the only school year where no grade met 100% of its growth target in reading or math, and only 7th and 8th grade exceeded 90%. These dynamics illustrate how MAP scores can help fill out the details on the district’s overall path toward the North Star. Charts 25 and 26 present MAP score trends over the past five years for three of the cohorts appearing in Tables 21 and 22. The expectation is that each spring, most students should be performing at about the same level as the fall scores in the next higher grade. MAP scores, therefore, allow the district to monitor both growth during the school year and the extent of any learning loss due to the summer recess. The charts demonstrate that, especially in recent years, the three cohorts lose very little learning during the summer between spring and fall tests. In addition, it appears that the cohort that entered 2nd grade in fall 2007 (blue cohort) is growing at a faster rate than the other two cohorts, gradually narrowing the difference between its MAP score achievement and that of older cohorts. This could be an indication that recent efforts to improve and strengthen early childhood and early elementary education are beginning to show in the form of higher growth rates and higher achievement levels. As efforts such as the School Readiness Coalition continue to develop, the district will be able to use MAP scores to compare growth among various cohorts for comparable grades to begin to assess the longer-term effects of early childhood interventions.

15th Comparative Analysis of RUSD Page 48
Chart 25: MAP math scores by cohort, Fall 2007 to Spring 2012
Note: Fall 2011 data unavailable due to a test reporting error by NWEA.
Chart 26: MAP reading scores by cohort, Fall 2007 to Spring 2012
Note: Fall 2011 data unavailable due to a test reporting error by NWEA.
170
180
190
200
210
220
230
Fall 07 Spring 08 Fall 08 Spring 09 Fall 09 Spring 10 Fall 10 Spring 11 Fall 11* Spring 12
2nd to 6th
3rd to 7th
4th to 8th
170
180
190
200
210
220
230
Fall 07 Spring 08 Fall 08 Spring 09 Fall 09 Spring 10 Fall 10 Spring 11 Fall 11* Spring 12
2nd to 6th
3rd to 7th
4th to 8th

15th Comparative Analysis of RUSD Page 49
Achievement growth and value-added analysis In addition to individual student achievement growth analysis based on MAP testing, this year’s report includes an analysis of achievement growth based on value-added growth models, a statistical method for measuring the value imparted on student learning by teachers and the school environment. This section presents an overview of the strengths and limitations of value-added growth models, followed by an analysis of average annual value-added scores for RUSD as a whole, its peer districts, and RUSD elementary schools. Definition and purpose of value-added analysis Most state standardized tests in use today, including the WKCE, are designed to measure student attainment at a particular point in time, rather than student growth in attainment over time. These tests cannot reveal whether a student is learning at a faster or slower rate than his or her peers or whether a student’s performance is attributable to teaching quality, innate abilities, or other factors. In order to address the shortfalls of this type of testing, the Value-Added Research Center (VARC) at the University of Wisconsin-Madison has developed a model that computes individual student growth and value-added growth scores based on WKCE scores. VARC calculates value-added scores for students, schools, and districts across Wisconsin. Forty-six districts statewide actively use VARC data, including RUSD. Value-added growth is defined as the portion of annual student growth in individual student test scores that can be attributed to educator and school effectiveness. The value-added model controls for non-school factors known to affect test scores, such as a student’s past performance, gender, race, ethnicity, income, English language learner status, or disability status. Any growth or decline in a student’s test score that exists after controlling for these variables is attributed to the effectiveness of a school and its educators. Value-added growth models provide school administrators with powerful tools not only to measure student growth and assess instructor performance, but also to identify effective teaching practices and provide targeted support to improve effectiveness of all educators. For instance, analyzing subgroup value-added growth by classroom can help administrators identify teachers who work well with particular subgroups of students, and learn from their success. Value-added scores also can help administrators place teachers in environments where they are most likely to excel. Limitations of value-added analysis Value-added analysis is a relatively new way of measuring student achievement that was developed to be a fair method of quantifying student learning over time. Several caveats should be taken into account before examining value-added data, however. For example, classrooms are not tightly

15th Comparative Analysis of RUSD Page 50
controlled laboratory environments, students are not randomly assigned to teachers or schools, and standardized tests are not always reliable predictors of student knowledge. In addition, the value-added growth model attempts to measure value-added growth through a process of elimination. Any growth in a student’s test score that is “left over” after controlling for the previously-mentioned factors is considered “value-added” growth attributable to the teacher and school environment. Because all the factors that affect student test scores are not necessarily known, the model may inaccurately attribute a portion of growth or decline in a student’s test scores to value-added growth, when the change in scores could be due to another variable for which the model does not account. An additional concern with using value-added growth models is that the value-added measure can be misused or abused by those who do not understand the intricacies and limitations of value-added models. At its best, value-added is a tool that can be used to increase educator effectiveness. At its worst, value-added can be used unfairly to evaluate teachers. Interpreting value-added scores Charts 27 and 28 present district-level value-added scores for RUSD and its nine peer districts, averaged over three years (Fall 2008 to Fall 2011) of WKCE growth in reading and math. The charts contain each district’s aggregate value-added growth calculated relative to the state average, plotted on the chart as a colored box. Aggregate growth is the average of the growth of each individual student with three years of test scores in the district. The box is larger for districts with more students contributing to the aggregate growth. Because value-added growth is an estimated measure, each box is bracketed by a confidence interval line showing 95% statistical confidence. The confidence line indicates the range within which VARC is 95% certain that the district’s true aggregate value-added growth falls. Confidence intervals are smaller for larger districts because statistical confidence improves as the number of students included in the calculation increases. Growth is charted on a value-added “tier” scale that ranges from one to five. A score of three on the tier scale is equal to the state average growth over a three-year period. Districts with growth less than the state average fall between one and three on the scale, while districts with growth exceeding the state average fall between three and five on the scale. The charts use a color code to classify districts by their value-added performance relative to state average: • Districts with a yellow box have a value-added score significantly below the state average when
confidence intervals are taken into account. • Districts with a gray box have value-added growth within the 95% confidence interval that is not
statistically different than the state average. • Districts with a green box have value-added growth that is significantly higher than the state
average.

15th Comparative Analysis of RUSD Page 51
Chart 27: Peer district value-added reading three-year average score, Fall 2008 to Fall 2011
Chart 28: Peer district value-added math three-year average score, Fall 2008 to Fall 2011
1 2 3 4 5
Sheboygan
Oshkosh
Janesville
Eau Claire
Waukesha
Appleton
Green Bay
Racine
Kenosha
Madison
1 2 3 4 5
Sheboygan
Oshkosh
Janesville
Eau Claire
Waukesha
Appleton
Green Bay
Racine
Kenosha
Madison
15th Comparative Analysis of RUSD Page 52
As an example, the aggregate value-added growth in reading for RUSD is 2.88 on the tier scale. The 95% confidence interval line for RUSD estimates that the district’s true value-added growth lies anywhere between 2.71 and 3.04 on the tier scale. Even though the district’s value-added growth estimate of 2.88 falls below the state average of 3.0, because the confidence interval overlaps with 3.0 there is still a chance that the district’s true score could be at or slightly above the state average. Therefore, the district’s box is gray. In the case of growth in math, RUSD’s value-added math score is 2.41 on the tier scale. The 95% confidence interval predicts that the district’s true value-added growth lies somewhere between 2.30 and 2.52. RUSD therefore shows up as a yellow box because the district’s entire confidence interval is below the statewide average. Comparing the two value-added charts shows that none of the 10 peer districts perform substantially above or below the state average (all are between 2.0 and 4.0, within one tier of the state average). Half of the districts performed similarly relative to the state average in reading and math (Sheboygan, Janesville, Waukesha, Appleton and Green Bay), while the other half showed inconsistent performance between the two subjects (Oshkosh, Eau Claire, RUSD, Kenosha, and Madison). Value-added RUSD school-level analysis Charts 29 and 30 focus on individual school, showing how both value-added performance and WKCE attainment in RUSD elementary schools compares to the Wisconsin average. Along the vertical axis, the schools are classified by how their value-added scores compare with the average statewide value-added growth. They are classified on the horizontal axis in terms of their attainment (WKCE proficiency rates) as compared to state average proficiency rates in 2008-09. Contrary to what might be expected in light of the district’s historical struggle with average test scores and achievement gaps, the majority of RUSD elementary schools show value-added performance equivalent to or greater than the state average in both reading and math. In reading, all but two of the schools, 19 in all, fit this description. In addition, with the exception of two schools, each of the schools at or above average in growth started with below-average attainment. In math, the image is similar with 15 schools showing value-added growth equivalent to or exceeding average growth in the state, all but two of which started with attainment levels below the state average.

15th Comparative Analysis of RUSD Page 53
Chart 29: RUSD school level attainment (Fall 2008) and value-added growth analysis (Fall 2008 to Fall 2011): Reading
Greater than State
Average Growth
North Park El
Jefferson Lighthouse El
Fratt El Johnson El Mitchell El
West Ridge El Red Apple El O Brown El
Jones El
Not Significantly
Different than State
Average Growth
Roosevelt El
Fine Arts El
Wind Point El Wadewitz El
Knapp El Goodland El
Janes El Julian Thomas El
Jerstad Agerholm El Schulte El
Lower than State
Average Growth
Giese El Gifford El
Lower than State
Average Attainment
Greater than State
Average Attainment

15th Comparative Analysis of RUSD Page 54
Chart 30: RUSD school level attainment (Fall 2008) and value-added growth analysis (Fall 2008 to Fall 2011): Math
Greater than State
Average Growth
Jones El North Park El
Not Significantly
Different than State
Average Growth
Fratt El
Goodland El Janes El
Johnson El Julian Thomas El Fine Arts El
Knapp El Jefferson Lighthouse
El Mitchell El O Brown El
Roosevelt El Schulte El
West Ridge El
Lower than State
Average Growth
Gifford El
Jerstad Agerholm El Giese El
Red Apple El Wadewitz El Wind Point El
Lower than State
Average Attainment
Greater than State
Average Attainment
Achievement in context Snapshots of student achievement in RUSD show the district lagging behind its peers in both reading and math, as well as lagging behind its own targets for achievement in nearly all areas. Also, certain demographic subgroups of students are well behind fellow students in RUSD and elsewhere. When student achievement growth over time is analyzed, however, it is clear that progress is being made in many schools and across many grade levels. The district may wish to revisit its North Star goals to investigate why this progress is not picked up by the annual North Star scorecard.

15th Comparative Analysis of RUSD Page 55
In addition, the phase-out of the WKCE requires the district to revisit the North Star targets. The district could continue to employ its North Star scorecard as a performance monitoring tool by revising both its past and current proficiency percentages to align with the new proficiency standards and adjust its short-term future targets accordingly. By the time the Smarter Balanced Assessment fully rolls out in the 2014-15 school year, new performance benchmarks will have been defined uniformly for all participating states and the assessment results will appear on the new school accountability report cards. Fortunately, the significant investment in MAP testing to which RUSD already has committed to measure student achievement and growth could serve as a bridge linking the district’s understanding of its students’ performance under WKCE to that under the SBA. In fact, as part of its efforts to measure Adequate Yearly Progress for the purposes of NCLB, the district has used MAP scores to predict students’ performance on the WKCE test.25
In addition, the computer-adaptive format of the SBA mirrors the method used on the MAP.
Going forward, the district could continue to administer MAP tests after the SBA has been phased in. It could use the MAP scores to predict how RUSD students would have performed on the WKCE and identify any differences between its SBA-based proficiency rates and those predicted by the MAP scores. It also could compare the first set of SBA proficiency rates with the previous year’s WKCE rates. It could compare these differences with those at the state level or within peer districts. Using such comparisons, the district could then analyze to what extent changes observed among RUSD students appear to be true changes in achievement, a temporary shift resulting from the new assessment that influences scores similarly across the state, or a combination of both. If these analyses do not yield clear indications of how RUSD performance under the new assessment compares to historical trends, then, at minimum, the SBA may create a “new normal” baseline proficiency rate from which the district may wish to establish fresh North Star targets.
25 http://www.racine.k12.wi.us/?do=dept.content&pageID=862

15th Comparative Analysis of RUSD Page 56
DISTRICT FINANCES Recent legislative changes adopted through the budget repair bill known as Act 10 and the 2011-13 state budget have profoundly changed the landscape of local school finance. This section captures some of the key fiscal indicators affecting RUSD within the first year of the passage of Act 10. It includes an overview of state-level policy changes affecting school finance in general, followed by a discussion of specific impacts for the RUSD fiscal picture and a description of some of the district’s policy responses.
District revenues Table 23 shows that RUSD ranks ninth among 10 peer districts in school district tax rate. At $8.94 per $1,000 of assessed property value in 2010-11, Racine’s school district tax rate rose by $1.09 over the previous year and exceeded only one peer district, Oshkosh. RUSD and Oshkosh are the only districts with a tax rate below $9.00 per $1,000 of assessed value. Table 23: School district tax rates among peer districts, 2010-11 Finances
School District Tax Rate Rank
Madison $11.14 2 Kenosha $11.02 3 Racine $8.94 9 Green Bay $10.02 5 Appleton $9.17 8 Waukesha $9.24 7 Eau Claire $10.18 4 Janesville $9.92 6 Sheboygan $11.70 1 Oshkosh $8.53 10 Milwaukee $11.51 State of Wisconsin $9.84
As shown in the peer tables in Appendix I, RUSD moved up one spot to sixth place in terms of property tax revenue per pupil, still lower than the median among peer districts due to its relatively low school district tax rate. At the same time, RUSD went from second to third place in terms of its largest source of revenue per pupil, state aid ($7,793 per pupil). RUSD remained the district receiving the highest amount of federal aid per pupil at $1,377, an increase of about 8%, or $100 per pupil. Overall, in 2011-12, RUSD rank moved down from third to fourth in terms of total operations revenue per pupil even with an increase of about 7%, exceeded only by Madison, Waukesha, and Sheboygan.

15th Comparative Analysis of RUSD Page 57
Chart 31: Per-pupil operations revenue, 2007-08 to 2011-12
As seen in Chart 31, RUSD outpaces Kenosha and Green Bay for the fourth year in a row in terms of total operations revenue per pupil. Green Bay moved up from sixth to fifth with a one-year growth rate exceeding 10% (see Appendix I for peer tables). If the upward trend in overall revenue gains in Green Bay continues, RUSD could again fall below Green Bay in the near future. Table 24: 10-year change in aggregate revenue among peer districts, 2002-03 to 2011-12
Finances Property Tax State Aid Federal Aid
Change Rank Change Rank Change Rank Madison 35.3% 7 -12.7% 10 158.0% 2 Kenosha 67.9% 2 27.9% 1 47.3% 10 Racine 82.8% 1 6.5% 4 89.9% 6 Green Bay 38.2% 6 22.8% 2 57.0% 8 Appleton 56.6% 4 2.8% 7 710.4% 1 Waukesha 31.7% 9 5.1% 6 130.8% 4 Eau Claire 43.1% 5 -3.6% 9 53.9% 9 Janesville 20.4% 10 6.2% 5 106.5% 5 Sheboygan 32.6% 8 14.1% 3 147.7% 3 Oshkosh 63.4% 3 -1.6% 8 82.2% 7 Milwaukee 64.6% -8.1% 58.5% State of Wisconsin 50.9% 1.8% 70.1%
In terms of the 10-year growth in its three main revenue sources (as shown in Table 24), RUSD’s comparisons among its peer districts have changed slightly from a year ago. As of 2011-12, the district saw the 10-year growth in all three revenue sources exceed the average growth statewide. With a 10-year growth rate of 82.8%, RUSD has seen its property tax levy grow more than any other peer district, about 32 percentage points greater than the statewide growth rate and almost 15 percentage points higher than Kenosha, the district with the next highest 10-year growth. Relative to its place among peer districts in 2010-11, RUSD remained in fourth place in terms of the change in state aid over the past 10 years with an average annual increase of 6.5%, higher than the statewide average. However, the
$8,000
$9,000
$10,000
$11,000
$12,000
$13,000
$14,000
$15,000
2007-08 2008-09 2009-10 2010-11 2011-12
Madison Racine Kenosha Green Bay

15th Comparative Analysis of RUSD Page 58
district’s growth in federal aid revenue of almost 90% since 2002-03 exceeded the average growth statewide by almost 20%, and outpaced federal aid growth in Oshkosh, Green Bay, Eau Claire, and Kenosha.
District expenditures Chart 32 shows that over the past five years, like per-pupil operations revenue, RUSD’s total per-pupil operations spending has grown more than that of Green Bay and Kenosha and exceeds both districts in 2011-12 by a small margin. RUSD currently ranks fourth among the 10 peer districts (down from third in 2010-11), spending $13,333 per pupil, $373 more than Kenosha and $324 more than Green Bay (see Appendix I for peer tables). Chart 32: Per-pupil operations spending, 2007-08 to 2011-12
As shown in Table 25, compared to average expenditures statewide, RUSD’s spending has increased over the past 10 years at a faster rate in all spending categories except transportation, ranking second or third among peer districts in terms of spending growth in expenses related to instruction, pupil services, instructional staff services, and general administration. RUSD’s instructional expenses, which comprise the largest spending category for all districts, reached $7,973 per pupil in 2011-12 (see Appendix I for peer tables). This marks a growth rate of 22.8% over the past 10 years, higher than the growth in all peer districts except Kenosha and Appleton. Whereas last year, RUSD had the third-highest per pupil instructional spending level, exceeded only by Sheboygan and Madison, its 2011-12 instructional spending drops it to sixth place among its peers (see Appendix I for peer tables).
$8,000
$9,000
$10,000
$11,000
$12,000
$13,000
$14,000
$15,000
$16,000
2007-08 2008-09 2009-10 2010-11 2011-12
Madison Racine Kenosha Green Bay

15th Comparative Analysis of RUSD Page 59
Table 25: Ten-year change in aggregate expenditures among peer districts, 2002-03 to 2011-12 Finances
Instruction Pupil Services Instructional
Staff Services General
Administration Building
Adminstration Trans-
portation Change Rank Change Rank Change Rank Change Rank Change Rank Change Rank
Madison 18.0% 7 39.7% 4 42.5% 1 14.4% 6 39.6% 2 56.5% 2 Kenosha 48.1% 1 36.0% 5 42.1% 2 34.6% 4 57.8% 1 19.5% 7 Racine 22.8% 3 57.3% 2 27.3% 3 44.1% 2 18.8% 8 0.9% 10 Green Bay 18.2% 6 47.0% 3 15.4% 6 42.5% 3 34.5% 4 72.0% 1 Appleton 30.1% 2 15.9% 10 27.1% 4 -5.1% 9 21.2% 6 51.0% 3 Waukesha 19.5% 5 59.8% 1 14.5% 7 175.2% 1 27.2% 5 48.2% 4 Eau Claire 16.0% 9 29.6% 8 -29.9% 10 -17.7% 10 9.5% 10 29.4% 6 Janesville 16.7% 8 33.1% 7 -19.6% 8 8.7% 7 19.5% 7 12.0% 9 Sheboygan 20.1% 4 34.9% 6 -24.3% 9 -2.2% 8 34.9% 3 15.8% 8 Oshkosh 7.8% 10 22.6% 9 26.0% 5 31.4% 5 18.6% 9 32.7% 5 Milwaukee 3.5% 48.2% 21.3% 55.3% -12.7% -3.7% Wisconsin 18.6% 30.6% 14.4% 20.9% 16.7% 25.7%
Support services expenditures In light of growing fiscal pressures on school districts, especially those such as RUSD with high concentrations of poverty and low-income students who depend heavily on state aid, the following tables and analysis examine non-instructional, or outside-of-classroom, categories of spending. The intent is to shed light on opportunities for potential cost savings that do not involve cuts to instructional resources and, therefore, may be less likely to compromise educator effectiveness, academic performance, or RUSD’s overall progress toward the North Star. This analysis refers to these outside-of-classroom expenditures as support services, defined by DPI as those financed by general and special project funds. They are divided into two categories: 1) pupil services and instructional staff services; and 2) administrative functions, which consist of general administration, school building administration, business administration, and central services. Table 26 shows that, on average, spending on support services both statewide and among the 10 peer districts comprises about one-third of school district spending. RUSD allocates 32.5% of its total operations spending to support services, which places it even with Green Bay and near the median (fourth among its peers). At almost 60% of overall operations spending, most of the remainder of district expenditures are instructional costs.

15th Comparative Analysis of RUSD Page 60
Table 26: Instruction and support service expenditures among peer districts, 2011-12 Finances
Total Operations
Spending
Instruction
Support Services
Expenditures
Rank Rank Rank
Madison $340,010,865 1 58.9% 9 34.4% 1 Kenosha $262,571,362 2 64.6% 3 33.6% 2 Racine $247,005,303 3 59.8% 7 32.5% 4 Green Bay $236,408,486 4 59.0% 8 32.5% 4 Appleton $158,039,850 6 65.1% 2 28.1% 10 Waukesha $162,167,896 5 55.3% 10 31.3% 6 Eau Claire $121,375,567 7 60.2% 6 33.1% 3 Janesville $111,791,474 9 63.6% 4 29.5% 8 Sheboygan $120,002,744 8 65.9% 1 29.0% 9 Oshkosh $105,597,734 10 61.8% 5 30.3% 7 Milwaukee $1,107,853,606 54.0% 35.4% State of Wisconsin $9,962,269,366 58.1% 33.5%
Table 27 shows support services in total and on a per-pupil basis. With total spending on support services of $80.4 million, RUSD ranks third among the 10 comparison districts. In terms of per pupil spending on support services, RUSD ranks fourth at $4,337, spending $117 less than the state average and $95 more than the median for the 10 districts, which ranged between $3,456 per pupil in Appleton and $5,045 in Madison. Table 27: Total and per pupil support service expenditures among peer districts, 2011-12 Finances
Support service
expenditures Support service
expenditures per pupil
Rank Madison $116,894,914 $5,045 1 Kenosha $88,222,996 $4,355 3 Racine $80,352,056 $4,337 4 Green Bay $76,891,043 $4,231 6 Appleton $44,434,520 $3,456 10 Waukesha $50,790,880 $4,366 2 Eau Claire $40,183,857 $4,253 5 Janesville $32,991,169 $3,764 8 Sheboygan $34,832,621 $4,030 7 Oshkosh $31,986,361 $3,704 9 Milwaukee $391,951,936 $5,359 State of Wisconsin $3,337,317,453 $4,454
Rounding out the picture, Table 28 compares per-pupil expenditures for pupil and instructional staff services to expenditures strictly for administrative functions. RUSD ranks just above the median among its peers in terms of purely administrative functions, spending $2,872 per pupil, or about 66% of its support services allocation. This pattern matches Kenosha, both in terms of spending per pupil and proportion of support services spent on administrative functions. In contrast, Sheboygan spends a similar amount per pupil but allocates 71% of its support services to administrative functions. In fact, the only districts that spend considerably less than RUSD on administrative functions in percentage terms are Madison ($320 more per pupil) and Green Bay ($197 less per pupil), which both allocate about 3% less of their support services budget to purely administrative functions than RUSD.
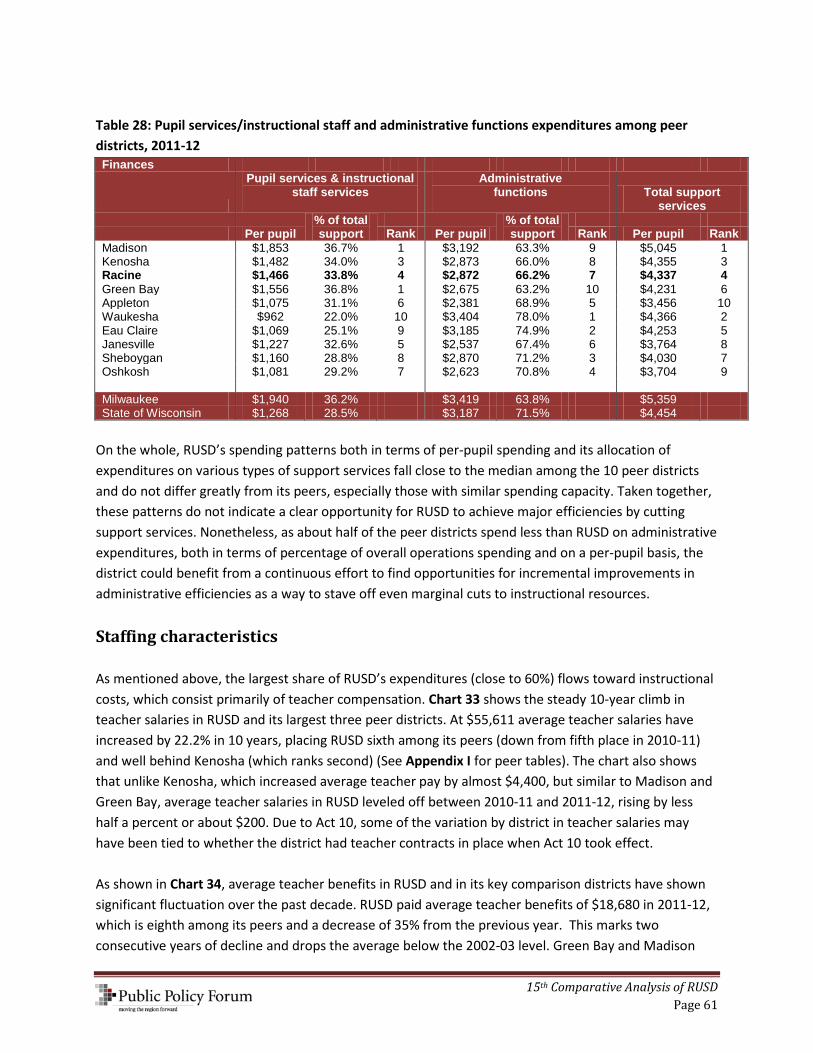
15th Comparative Analysis of RUSD Page 61
Table 28: Pupil services/instructional staff and administrative functions expenditures among peer districts, 2011-12 Finances
Pupil services & instructional staff services
Administrative functions
Total support
services
Per pupil % of total support
Per pupil
% of total support
Per pupil
Rank Rank Rank
Madison $1,853 36.7% 1 $3,192 63.3% 9 $5,045 1 Kenosha $1,482 34.0% 3 $2,873 66.0% 8 $4,355 3 Racine $1,466 33.8% 4 $2,872 66.2% 7 $4,337 4 Green Bay $1,556 36.8% 1 $2,675 63.2% 10 $4,231 6 Appleton $1,075 31.1% 6 $2,381 68.9% 5 $3,456 10 Waukesha $962 22.0% 10 $3,404 78.0% 1 $4,366 2 Eau Claire $1,069 25.1% 9 $3,185 74.9% 2 $4,253 5 Janesville $1,227 32.6% 5 $2,537 67.4% 6 $3,764 8 Sheboygan $1,160 28.8% 8 $2,870 71.2% 3 $4,030 7 Oshkosh $1,081 29.2% 7 $2,623 70.8% 4 $3,704 9 Milwaukee $1,940 36.2% $3,419 63.8% $5,359 State of Wisconsin $1,268 28.5% $3,187 71.5% $4,454
On the whole, RUSD’s spending patterns both in terms of per-pupil spending and its allocation of expenditures on various types of support services fall close to the median among the 10 peer districts and do not differ greatly from its peers, especially those with similar spending capacity. Taken together, these patterns do not indicate a clear opportunity for RUSD to achieve major efficiencies by cutting support services. Nonetheless, as about half of the peer districts spend less than RUSD on administrative expenditures, both in terms of percentage of overall operations spending and on a per-pupil basis, the district could benefit from a continuous effort to find opportunities for incremental improvements in administrative efficiencies as a way to stave off even marginal cuts to instructional resources. Staffing characteristics As mentioned above, the largest share of RUSD’s expenditures (close to 60%) flows toward instructional costs, which consist primarily of teacher compensation. Chart 33 shows the steady 10-year climb in teacher salaries in RUSD and its largest three peer districts. At $55,611 average teacher salaries have increased by 22.2% in 10 years, placing RUSD sixth among its peers (down from fifth place in 2010-11) and well behind Kenosha (which ranks second) (See Appendix I for peer tables). The chart also shows that unlike Kenosha, which increased average teacher pay by almost $4,400, but similar to Madison and Green Bay, average teacher salaries in RUSD leveled off between 2010-11 and 2011-12, rising by less half a percent or about $200. Due to Act 10, some of the variation by district in teacher salaries may have been tied to whether the district had teacher contracts in place when Act 10 took effect. As shown in Chart 34, average teacher benefits in RUSD and in its key comparison districts have shown significant fluctuation over the past decade. RUSD paid average teacher benefits of $18,680 in 2011-12, which is eighth among its peers and a decrease of 35% from the previous year. This marks two consecutive years of decline and drops the average below the 2002-03 level. Green Bay and Madison

15th Comparative Analysis of RUSD Page 62
saw average teacher benefits decrease from the previous year as well, but by a smaller proportion, falling by 20% and 25% respectively. Meanwhile, Kenosha’s teacher benefits, like its teacher salaries, have climbed for two years running, increasing by about 20% since 2009-10 and placing it first among the 10 peer districts in both average benefits and average total compensation per teacher. One of the major factors driving changes in teacher compensation is teacher experience. As Chart 35 shows, RUSD’s relatively flat growth in teacher salaries is reflected in its marginal change in average years of teacher experience, both of which grew by roughly the same percentage during the past year (about 0.3%). Although RUSD ranks third from the bottom in average years of teacher experience among the 10 peer districts, it has progressed from last place in 2010-11. The district’s steady rise in this measure over the past four years demonstrates a capacity to retain its teachers in the face of considerable economic challenges and stands in contrast to large peer districts such as Madison and Green Bay, which demonstrate relatively sharp declines in this measure over the same period. Chart 33: Average teacher salaries, 2002-03 to 2011-12
$35,000
$40,000
$45,000
$50,000
$55,000
$60,000
$65,000
2003 2004 2005 2006 2007 2008 2009 2010 2011 2012
Madison
Racine
Kenosha
Green Bay

15th Comparative Analysis of RUSD Page 63
Chart 34: Average teacher benefits, 2002-03 to 2011-12
Chart 35: Average teacher experience, 2002-03 to 2011-12
Like experience, teacher qualifications (such as level of education) also influence teacher compensation. As shown in Table 29, more than half of the teachers in all 10 peer districts hold master’s degrees or higher. Similar to last year, about 44% of RUSD’s teachers had obtained only a bachelor’s degree in 2011-12, while another 51% held master’s degrees. Although this represents the lowest proportion of teachers holding a master’s degree of any of the 10 peer districts, it is not unexpected given RUSD’s rank as eighth out of the 10 peer districts in total teacher compensation (See Appendix I for peer tables).
$0
$5,000
$10,000
$15,000
$20,000
$25,000
$30,000
$35,000
$40,000
$45,000
2003 2004 2005 2006 2007 2008 2009 2010 2011 2012
Madison Racine Kenosha Green Bay
8
9
10
11
12
13
14
15
2003 2004 2005 2006 2007 2008 2009 2010 2011 2012
Year
s
Madison
Racine

15th Comparative Analysis of RUSD Page 64
Table 29: Percentage of degrees obtained by teachers, 2011-12 Staffing
Bachelor's
Degree Master's degree
Higher than Master's Degree Other
Madison 43.8% 51.7% 2.2% 2.3% Kenosha 31.8% 67.9% 0.3% 0.0% Racine 44.4% 51.0% 0.4% 4.2% Green Bay 47.6% 52.3% 0.1% 0.0% Appleton 39.5% 60.4% 0.1% 0.0% Waukesha 36.1% 63.8% 0.1% 0.0% Eau Claire 45.0% 55.0% 0.0% 0.0% Janesville 23.2% 76.3% 0.4% 0.0% Sheboygan 30.3% 69.7% 0.0% 0.0% Oshkosh 47.0% 53.0% 0.0% 0.0% Milwaukee 62.8% 34.7% 0.4% 2.0%
As shown in Chart 36, the number of students per FTE teacher in RUSD has fallen by almost 10% on average since 2006-07, and by more than 7% over the past decade. At first glance, this may be surprising given the fiscal pressures on the district in recent years and the common belief that student-teacher ratios tend to suffer during times of tight budget. The gradual downward trend in RUSD’s total enrollment since the 2006-07 school year, however, has at least partially contributed to the steady decline in RUSD’s student-teacher ratio. Chart 36: RUSD student-teacher ratio, 2002-03 to 2011-12
13.51
12.52
10.0
11.0
12.0
13.0
14.0
15.0
2002-03 2003-04 2004-05 2005-06 2006-07 2007-08 2008-09 2009-10 2010-11 2011-12

15th Comparative Analysis of RUSD Page 65
Effects of state budget legislation on regional schools Act 10 aimed to achieve cost reductions in three mains ways: by severely restricting the topics subject to collective bargaining by public employees; by requiring most public employees to contribute 5.8% of their salary toward their pensions; and by requiring public employees in state-sponsored health care plans to pay 12.6% of their health insurance premiums. These tools were designed to allow districts to absorb the loss of state aid and the reduction in their revenue limits that were passed as part of the 2011-13 biennial state budget. From the perspective of local school districts, perhaps the most significant provision of Act 10 was its elimination from the collective bargaining process of all topics other than wage increases, which the law limits to the rate of inflation. Topics that traditionally were subject to labor negotiations – such as tenure, seniority, fringe benefits, and retirement age – now may be established at the discretion of local school boards. Wage increases negotiated beyond the rate of inflation must be approved by a referendum, and unions and employers no longer are allowed to bargain over supplementary pay above base wages. This means, for example, that districts now may make non-negotiated decisions about raises, merit pay, extra-duty pay for non-classroom duties, teacher workload, and incentive payments to recruit in areas with teacher shortages. Given the short period of time that Act 10 has been in effect, and the litigation surrounding it since its passage, the overall impact of the legislation and the long-term implications remain unclear. The recent ruling by a district court judge in Dane County striking down the law now puts many districts on uncertain footing, for example. In addition, in 2011-12, nearly 20% of all school districts statewide were still operating under labor contracts that were in place before the passage of Act 10.26
Until the law’s legality is settled and all schools in the state are able to utilize the new fiscal tools, it will be difficult to draw conclusions about the impacts of the changes.
Also, each individual district’s ability to secure savings from the Act 10 tools depends on several factors that vary widely from district to district. For example, employees of some districts already may have been contributing substantially to the cost of their health care, while other districts may have collectively bargained to achieve significant savings from changes in their health care plans. In addition, in some districts, large numbers of teacher retirements may have had a greater impact on fringe benefit budgets than did the Act 10 provisions. Despite these limitations in the data, we do know that since the adoption of Act 10, the state has seen an overall reduction in the size of its teacher workforce,27
26
overall reductions in state aid and property
http://www.jsonline.com/news/education/17-burlington-school-employees-receive-nonrenewal-notices-9v4tbd7-146622535.html 27A Wisconsin Taxpayer’s Alliance study released in May 2012 shows that the number of teachers in the state declined by 2.4% between 2011 and 2012, outpacing the decline in student enrollment. Between 2004 and 2009, student and teacher counts mirrored one another closely. Between 2009 and 2012, however, the number of

15th Comparative Analysis of RUSD Page 66
tax revenues, and lower per-pupil expenses. The following section delves into the impacts of state budget legislation for RUSD in particular, shedding light on the district’s strategies both to capitalize on the new opportunities and to confront the fiscal challenges that emerged from the 2011-13 Wisconsin state budget process. Impact of state budget provisions in Racine and RUSD’s response General condition of RUSD budget Cuts in state and federal funding to RUSD during 2011-12 totaled more than $18.43 million. Yet, despite the revenue cap provision in the 2011-13 state budget, RUSD was able to make up some of these cuts through an increase in property taxes, raising the mill rate from $8.41 in 2010-11 to $8.94 in 2011-12. The district also extended contracts with its represented employees, including teachers, in the spring of 2011, and then engaged in negotiations that allowed it to cut costs by reducing employee benefits and overtime, eliminating 119 positions. For example, employees now pay 5.8% of their salary toward retirement benefits and higher health insurance deductibles, and salary schedules have been frozen. As a result, the district maintained class sizes and avoided major lay-offs of staff members.28
In June 2012, the Racine Unified School Board approved a preliminary 2012-13 budget that was projected to be $6.6 million smaller than the 2011-12 budget.29 Although the final 2012-13 budget is pending,30 district officials attributed the expected decrease to a decline of about 9% in federal stimulus funding, a projected drop in federal monies for low-income students, and an expected decline in state aid of about $2.4 million. In fact, the actual drop in state aid will be slightly higher at $2.55 million (a decrease of 2%), according to DPI’s official state aid figures.31
In the preliminary budget, the district uses a variety of strategies to cope with these challenges. It plans to reduce personnel expenditures through retirements and resignations, spend down federal jobs funding by $450,000, and tap $200,000 from a referendum debt service fund balance. In addition, it
teachers statewide declined more rapidly than total enrollment, leading to a higher student-teacher ratio. Between 2009 and 2012, the statewide student-teacher ratio increased from 13.8:1 to 14.4:1, indicating that districts are reducing staff (http://media.jsonline.com/documents/schoolreports.pdf) 28 RUSD 2012 Report to Our Community; Email correspondence with Dave Hazen, RUSD Chief Financial Officer, September 24, 2012 29 http://www.journaltimes.com/news/local/racine-unified-oks-preliminary-budget-which-includes-percent-tax-rate/article_702c45ee-bf46-11e1-b57b-0019bb2963f4.html 30 Final district budgets are approved each year in October after DPI has certified 2012-13 state aid figures based on audited data from the Department of Revenue on property values and data from the districts such as enrollment figures. As of the writing of this report, the 2012-13 budget had yet to be adopted. 31 http://dpi.wi.gov/eis/pdf/dpinr2012_116_general_aid.pdf

15th Comparative Analysis of RUSD Page 67
preliminarily planned to increase the property tax rate by 6.4% and the tax levy itself to $85 million, an increase of 4.4%.32
Fiscal impacts of Racine Parental Private School Choice Program As noted in the student performance analysis, the 2011-12 school year marked the first year of Parental Private School Choice Program, a new private school voucher program created as part of the 2011-13 state budget bill that extended vouchers to 10 cities throughout Wisconsin, including Racine. During the program’s first year in Racine, 250 taxpayer-funded vouchers were available, with 228 vouchers used within eight schools. The limit increases to 500 available vouchers for the 2012-13 school year. Unless the legislature changes the program in the next state budget, the cap on the number of Racine vouchers will be eliminated beginning with the 2014-15 school year.33
Of the roughly $2.5 million in reduced state aid to RUSD for 2012-13, $1.2 million is attributable to per-pupil state aid transferred to the Racine Parental Private School Choice Program in the form of tuition vouchers for students.34 The district estimates it will lose an additional $1.7 million because of the way voucher students will affect the district’s student count used in the state aid funding formula.35 In addition, according to RUSD, of the 4.4% increase in the property tax levy that RUSD has built into the 2012-13 budget, about 1.4% is intended to help offset drops in state funding resulting from the expansion of school choice slots in the district.36
In addition, given the district’s heavy reliance on state aid per pupil, a sustained downward trend in enrollment precipitated by expansion of the voucher program could create other fiscal challenges for the district. Although incremental declines in the number of students from year to year lowers some costs tied to each individual student, declining enrollment does not reduce fixed costs such as administration, facilities, or personnel, especially teaching staff. Unless large units of these costs can be reduced – such as by decreasing the number of classes or closing an entire school – declining enrollment could pose a threat to the long-term fiscal stability of the district.
32 http://www.journaltimes.com/news/local/racine-taxpayers-association-pair-unhappy-with-rusd-budget/article_9bbe9c56-eb2a-11e1-ae0a-0019bb2963f4.html 33 The cap on vouchers was eliminated for MPS in 2011-12. 34 http://www.jsonline.com/blogs/news/174213531.html 35 http://www.journaltimes.com/news/opinion/editorial/commentary-state-aid-cuts-a-big-reason-for-projected-unified/article_26112762-e9b3-11e1-9051-001a4bcf887a.html 36 http://www.journaltimes.com/news/local/a-voucher-tax-unified-says-property-tax-increase-is-due/article_fb44949c-eb83-11e1-a0f9-0019bb2963f4.html

15th Comparative Analysis of RUSD Page 68
APPENDIX I – PEER DISTRICT COMPARISON Table 30: Enrollment by race/ethnicity, 2011-12
Enrollment Overall Racial composition
District 2011-12 1-year
change White African
American Hispanic Asian American
Indian Pacific
Islander
Two or more races
% African American Rank
% Minority Rank
Madison 26,817 8.1% 12,153 5,385 4,813 2,530 127 25 1,784 20.1% 2 54.7% 2 Kenosha 22,905 -0.4% 12,935 3,557 5,322 380 63 20 628 15.5% 3 43.5% 4 Racine 20,809 -1.4% 9,235 5,469 5,214 285 72 5 529 26.3% 1 55.6% 1 Green Bay 20,636 1.3% 11,342 1,709 4,816 1,398 851 3 517 8.3% 4 45.0% 3 Appleton 15,119 -0.5% 11,487 676 1,141 1,687 125 0 3 4.5% 7 24.0% 7 Waukesha 13,770 -0.2% 9,880 638 2,438 525 41 7 241 4.6% 5 28.2% 6 Eau Claire 11,030 1.1% 8,958 277 354 1,007 89 17 328 2.5% 10 18.8% 9 Janesville 10,325 -0.1% 8,001 469 1,100 198 47 9 501 4.5% 6 22.5% 8 Sheboygan 10,129 0.0% 6,298 393 1,619 1,622 59 7 131 3.9% 8 37.8% 5 Oshkosh 10,064 -0.5% 8,313 279 489 618 47 11 307 2.8% 9 17.4% 10
Milwaukee 79,130 -2.2% 11,260 44,094 18,748 4,186 608 15 219 55.7% 85.8% Wisconsin 870,470 -0.2% 642,020 85,084 84,524 30,739 11,260 662 16,181 9.8% 26.2%
Table 31: Enrollment by race/ethnicity and grade, 2011-12
Racine K4 K5 01 02 03 04 05 06 07 08 09 10 11 12 Total Asian 20 15 16 28 19 20 21 23 15 20 17 26 22 23 285 African American 321 373 380 383 395 384 389 403 383 368 393 403 387 507 5,469 Hispanic 305 433 431 417 392 425 414 411 356 355 346 295 292 342 5,214 Indian 7 5 5 5 4 2 9 5 6 7 3 3 6 5 72 Pacific Islander 0 1 1 0 0 0 0 0 1 0 0 1 0 1 5 Two or more races 84 101 64 36 37 34 34 32 13 19 25 13 17 20 529 White 633 601 649 602 607 628 616 579 634 676 704 749 735 822 9,235 Total 1,370 1,529 1,546 1,471 1,454 1,493 1,483 1,453 1,408 1,445 1,488 1,490 1,459 1,720 20,809
Kenosha K4 K5 01 02 03 04 05 06 07 08 09 10 11 12 Total Asian 19 29 27 26 22 22 29 28 23 26 31 37 30 31 380 African American 183 231 254 231 254 244 257 283 251 258 304 301 313 193 3,557 Hispanic 338 441 415 433 423 379 437 395 407 356 352 350 351 245 5,322 Indian 0 3 6 2 4 2 6 5 4 8 3 5 7 8 63 Pacific Islander 0 1 3 3 1 3 0 0 0 4 2 0 2 1 20 Two or more races 59 72 80 70 55 45 33 42 37 40 38 10 25 22 628 White 561 842 831 836 926 913 927 932 990 954 1,016 1,052 1,153 1,002 12,935 Total 1,160 1,619 1,616 1,601 1,685 1,608 1,689 1,685 1,712 1,646 1,746 1,755 1,881 1,502 22,905
Wisconsin K4 K5 01 02 03 04 05 06 07 08 09 10 11 12 Total Asian 1,924 2,300 2,274 2,266 2,197 2,128 2,195 2,139 2,074 2,003 2,167 2,257 2,428 2,390 30,742 African American 6,273 5,985 5,952 5,939 5,884 5,934 5,843 6,046 5,968 5,956 7,650 6,048 6,199 5,818 85,495 Hispanic 6,621 7,380 6,954 6,795 6,535 6,404 6,364 5,914 5,719 5,463 5,739 5,123 5,040 4,510 84,561 Indian 584 779 794 813 808 805 794 789 789 827 861 823 873 938 11,277 Pacific Islander 74 66 53 50 47 32 44 43 45 47 48 41 30 45 665 Two or more races 1,542 1,760 1,517 1,348 1,203 1,128 1,082 1,109 1,008 997 1,074 852 828 741 16,189 White 37,420 42,605 43,028 43,773 43,542 43,663 44,636 45,778 45,839 46,120 50,003 50,366 51,453 53,950 642,176 Total 54,438 60,875 60,572 60,984 60,216 60,094 60,958 61,818 61,442 61,413 67,542 65,510 66,851 68,392 871,105

15th Comparative Analysis of RUSD Page 69
Table 32: Operations revenue per pupil, 2011-12 Finances
Property tax Rank
State aid Rank
Federal aid Rank
Total operations
revenue Rank Madison $9,759 1 $3,159 10 $1,243 3 $14,522 1 Kenosha $3,804 8 $7,654 5 $931 5 $12,554 7 Racine $4,137 6 $7,793 3 $1,377 1 $13,405 4 Green Bay $3,701 9 $7,733 4 $1,353 2 $12,988 5 Appleton $4,317 4 $6,449 7 $855 6 $12,277 9 Waukesha $6,767 2 $4,657 9 $832 7 $13,868 2 Eau Claire $5,177 3 $6,246 8 $802 10 $12,650 6 Janesville $3,293 10 $7,813 2 $815 8 $12,327 8 Sheboygan $4,023 7 $8,342 1 $1,003 4 $13,658 3 Oshkosh $4,286 5 $6,812 6 $810 9 $12,179 10
Milwaukee $3,763 $8,612 $2,485 $15,151 State of Wisconsin $5,305 $6,339 $902 $13,195
Table 33: Operations expenditures per pupil, 2011-12
Finances
Instruction Pupil
services
Instructional staff
services General admin
Building admin
Business admin
Trans- portation
Central services
Total operations spending
Madison $8,649 $972 $880 $101 $845 $1,978 $520 $337 $14,674 Kenosha $8,376 $782 $700 $71 $722 $1,804 $314 $283 $12,960 Racine $7,973 $778 $687 $118 $593 $2,121 $474 $342 $13,333 Green Bay $7,672 $844 $712 $128 $654 $1,738 $459 $374 $13,009 Appleton $8,004 $574 $501 $81 $614 $1,420 $284 $291 $12,292 Waukesha $7,716 $546 $416 $249 $729 $1,767 $579 $661 $13,940 Eau Claire $7,738 $535 $533 $79 $635 $2,023 $594 $633 $12,847 Janesville $8,117 $818 $409 $99 $535 $1,613 $224 $331 $12,753 Sheboygan $9,149 $783 $377 $183 $769 $1,713 $291 $280 $13,883 Oshkosh $7,553 $586 $495 $66 $577 $1,801 $345 $345 $12,228
Milwaukee $8,186 $901 $1,039 $392 $692 $2,133 $768 $300 $15,148 Wisconsin $7,719 $620 $647 $259 $646 $2,057 $571 $300 $13,296
Finances
Rank Instruction Pupil
services
Instructional staff
services General admin
Building admin
Business admin
Trans- portation
Central services
Total operations spending
Madison 2 1 1 5 1 3 3 6 1 Kenosha 3 5 3 9 4 4 7 9 6 Racine 6 6 4 4 8 1 4 5 4 Green Bay 9 2 2 3 5 7 5 3 5 Appleton 5 8 6 7 7 10 9 8 9 Waukesha 8 9 8 1 3 6 2 1 2 Eau Claire 7 10 5 8 6 2 1 2 7 Janesville 4 3 9 6 10 9 10 7 8 Sheboygan 1 4 10 2 2 8 8 10 3 Oshkosh 10 7 7 10 9 5 6 4 10

15th Comparative Analysis of RUSD Page 70
Table 34: Average teacher compensation, 2011-12 Staffing
Average salary Rank
Average fringe Rank
Total compensation Rank
Madison $52,318 7 $17,389 10 $69,707 9 Kenosha $61,872 2 $36,073 1 $97,945 1 Racine $55,611 6 $18,680 8 $74,291 8 Green Bay $52,232 8 $22,454 7 $74,686 7 Appleton $59,918 4 $24,331 6 $84,249 4 Waukesha $61,223 3 $26,250 4 $87,473 3 Eau Claire $51,627 9 $27,185 2 $78,812 6 Janesville $56,972 5 $27,089 3 $84,061 5 Sheboygan $62,292 1 $25,624 5 $87,916 2 Oshkosh $50,629 10 $18,037 9 $68,666 10
Milwaukee $60,978 $32,191 $93,169 Table 35: Average teacher experience, 2011-12 Staffing
Average local experience Rank
Average total experience Rank
Madison 11.36 8 13.54 6 Kenosha 12.39 5 13.58 5 Racine 10.9 9 12.58 8 Green Bay 12.22 7 12.29 9 Appleton 13.19 3 15.81 2 Waukesha 12.34 6 13.66 4 Eau Claire 13.48 2 16.09 1 Janesville 12.58 4 14.78 3 Sheboygan 13.5 1 13.5 7 Oshkosh 10.46 10 12.25 10
Milwaukee 13.16 13.54 Table 36: Attendance, truancy, and dropout rates, 2010-11 Engagement
Attendance Habitual truancy High school dropouts Rate Rank Truants Rate Rank Dropouts Rate Rank
Madison 96.0% 1 1,734 7.1% 6 245 2.2% 3 Kenosha 93.7% 8 4,165 19.2% 1 142 1.4% 6 Racine 93.3% 10 3,022 15.2% 3 434 4.6% 1 Green Bay 93.4% 9 3,360 17.7% 2 209 2.4% 2 Appleton 95.9% 2 647 4.3% 8 85 1.2% 8 Waukesha 94.1% 7 107 0.8% 10 90 1.4% 5 Eau Claire 95.9% 3 491 4.9% 7 51 1.1% 9 Janesville 94.6% 6 1,269 13.1% 4 80 1.6% 4 Sheboygan 94.8% 5 331 3.5% 9 44 1.0% 10 Oshkosh 95.5% 4 838 8.9% 5 58 1.3% 7
Milwaukee 90.1% 31,672 43.3% 1,690 4.9% Wisconsin 94.8% 71,043 8.6% 5,794 1.5%

15th Comparative Analysis of RUSD Page 71
Table 37: Suspensions and expulsions, 2010-11 Engagement
Suspensions Expulsions
Students Percent Rank Students Percent Rank Madison 2,108 8.5% 3 29 0.12% 4 Kenosha 2,166 9.4% 2 2 0.01% 9 Racine 2,569 12.2% 1 112 0.53% 1 Green Bay 1,243 6.1% 4 2 0.01% 7 Appleton 483 3.2% 7 11 0.07% 5 Waukesha 355 2.6% 9 27 0.20% 2 Eau Claire 297 2.7% 8 1 0.01% 8 Janesville 536 5.2% 5 13 0.13% 3 Sheboygan 180 1.8% 10 0 0.00% 10 Oshkosh 458 4.5% 6 6 0.06% 6
Milwaukee 18,797 23.2% 391 0.48% State of Wisconsin 48,276 5.5% 1,123 0.13%
Table 38: 3rd grade WKCE reading and math scores, 2011-12
Performance 3rd grade scores Reading Math Minimal Basic Proficient Advanced Rank Minimal Basic Proficient Advanced Rank Madison 8.3% 19.6% 29.3% 41.0% 8 21.7% 9.4% 30.3% 36.8% 9 Kenosha 5.4% 19.2% 35.5% 38.8% 7 16.9% 10.1% 38.6% 33.3% 8 Racine 6.8% 21.1% 39.4% 28.8% 9 21.2% 11.7% 42.0% 22.7% 10 Green Bay 4.5% 12.5% 30.9% 36.1% 10 16.8% 8.8% 40.7% 32.3% 6 Appleton 4.4% 15.2% 33.8% 45.4% 6 16.1% 9.5% 35.5% 37.3% 7 Waukesha 3.6% 14.9% 35.6% 45.1% 2 14.9% 7.7% 35.3% 41.3% 4 Eau Claire 4.2% 14.7% 32.8% 47.5% 3 17.1% 7.1% 37.1% 37.9% 5 Janesville 4.4% 13.7% 33.5% 46.7% 4 9.0% 9.1% 40.3% 39.9% 3 Sheboygan 2.8% 11.9% 42.7% 41.8% 1 9.7% 6.0% 43.8% 39.7% 1 Oshkosh 3.3% 15.3% 35.5% 44.5% 5 9.9% 7.5% 38.8% 42.3% 2
Milwaukee 12.5% 26.9% 36.4% 21.2% 36.1% 12.9% 34.3% 13.8% State 4.5% 14.6% 35.5% 43.3% 14.4% 8.4% 38.7% 37.0%
Table 39: 4th grade WKCE reading and math scores, 2011-12
Performance 4th grade scores Reading Math Minimal Basic Proficient Advanced Rank Minimal Basic Proficient Advanced Rank Madison 8.9% 17.9% 31.5% 39.9% 9 15.5% 9.3% 32.9% 40.5% 9 Kenosha 6.6% 14.3% 39.9% 38.2% 7 14.8% 8.9% 38.2% 37.0% 8 Racine 8.8% 20.4% 40.6% 28.8% 10 19.7% 10.6% 45.1% 23.6% 10 Green Bay 4.2% 13.4% 37.1% 35.1% 8 10.8% 8.7% 39.1% 40.2% 6 Appleton 5.5% 11.5% 39.8% 41.4% 4 10.6% 7.9% 39.7% 40.2% 5 Waukesha 4.2% 11.2% 37.7% 45.8% 1 7.1% 9.4% 43.0% 39.4% 2 Eau Claire 4.6% 13.7% 36.9% 43.7% 5 11.6% 9.0% 44.7% 33.9% 7 Janesville 5.0% 12.7% 37.6% 44.1% 3 10.3% 6.9% 32.6% 49.5% 3 Sheboygan 4.1% 14.4% 40.5% 38.8% 6 8.1% 8.5% 41.6% 39.6% 4 Oshkosh 4.1% 12.5% 41.2% 40.7% 2 6.5% 8.2% 39.7% 44.0% 1
Milwaukee 12.2% 25.2% 40.5% 18.6% 30.5% 13.6% 35.9% 16.7% State 4.7% 12.8% 38.1% 42.4% 11.2% 8.1% 38.3% 40.8%

15th Comparative Analysis of RUSD Page 72
Table 40: 5th grade WKCE reading and math scores, 2011-12 Performance 5th grade scores Reading Math Minimal Basic Proficient Advanced Rank Minimal Basic Proficient Advanced Rank Madison 8.0% 16.3% 35.9% 38.1% 9 17.4% 9.4% 27.5% 44.1% 9 Kenosha 6.8% 17.7% 41.6% 33.1% 8 13.2% 9.0% 32.4% 44.7% 8 Racine 8.6% 19.5% 43.4% 26.6% 10 22.2% 11.7% 35.9% 28.7% 10 Green Bay 3.9% 13.9% 43.7% 31.7% 7 10.4% 6.9% 32.5% 49.3% 2 Appleton 3.4% 14.5% 42.1% 38.3% 3 11.3% 8.3% 31.0% 47.5% 5 Waukesha 3.4% 11.6% 44.2% 39.7% 1 12.3% 9.0% 35.2% 42.5% 6 Eau Claire 3.1% 11.7% 42.9% 40.9% 2 12.4% 8.9% 40.2% 37.0% 7 Janesville 5.3% 14.5% 38.2% 40.0% 5 10.5% 4.5% 25.3% 57.7% 1 Sheboygan 4.9% 16.4% 42.9% 34.5% 6 10.7% 6.6% 30.8% 50.6% 4 Oshkosh 4.9% 13.7% 49.6% 30.0% 4 8.7% 7.9% 29.9% 51.8% 3
Milwaukee 14.1% 27.4% 39.9% 15.5% 30.6% 14.2% 31.6% 20.6% State 5.0% 13.7% 42.0% 37.5% 12.1% 8.2% 31.1% 47.2%
Table 41: 6th grade WKCE reading and math scores, 2011-12
Performance 6th grade scores Reading Math Minimal Basic Proficient Advanced Rank Minimal Basic Proficient Advanced Rank Madison 9.4% 14.4% 33.5% 41.2% 9 17.7% 11.3% 35.9% 33.5% 9 Kenosha 5.4% 12.9% 41.9% 39.3% 7 10.9% 9.6% 41.7% 37.3% 6 Racine 9.0% 17.0% 41.8% 30.1% 10 22.0% 15.9% 42.4% 17.7% 10 Green Bay 5.6% 14.0% 40.7% 36.7% 8 12.7% 9.8% 40.4% 35.9% 8 Appleton 4.1% 7.2% 38.6% 47.4% 3 8.4% 8.7% 39.5% 40.7% 5 Waukesha 5.5% 9.4% 38.3% 45.6% 5 12.5% 9.3% 39.2% 37.8% 7 Eau Claire 3.5% 7.0% 37.6% 50.1% 1 7.6% 5.9% 41.1% 43.7% 2 Janesville 3.0% 10.2% 36.9% 49.2% 2 6.3% 8.2% 35.7% 49.0% 3 Sheboygan 3.5% 11.1% 43.9% 38.9% 6 7.7% 9.3% 40.2% 40.3% 4 Oshkosh 3.1% 10.6% 39.3% 44.8% 4 6.7% 5.3% 36.7% 49.1% 1
Milwaukee 15.3% 20.8% 43.6% 16.9% 31.4% 17.6% 34.8% 13.0% State 4.8% 10.1% 38.5% 44.8% 10.9% 9.8% 39.9% 37.7%
Table 42: 7th grade WKCE reading and math scores, 2011-12
Performance 7th grade scores Reading Math Minimal Basic Proficient Advanced Rank Minimal Basic Proficient Advanced Rank Madison 8.4% 11.4% 31.2% 47.4% 9 14.3% 14.2% 37.7% 32.4% 9 Kenosha 5.5% 8.4% 43.8% 40.8% 7 6.7% 10.4% 45.5% 36.3% 6 Racine 9.7% 12.6% 40.1% 34.8% 10 14.9% 17.8% 47.7% 17.0% 10 Green Bay 5.4% 10.5% 38.7% 40.4% 8 7.9% 11.3% 39.5% 39.6% 8 Appleton 3.5% 5.8% 31.8% 57.7% 2 6.2% 9.1% 44.3% 39.3% 5 Waukesha 5.4% 7.7% 34.2% 50.7% 6 7.2% 11.5% 43.5% 35.7% 7 Eau Claire 2.6% 5.3% 32.7% 56.9% 1 5.6% 8.1% 50.0% 33.9% 3 Janesville 3.2% 9.6% 35.7% 49.4% 5 5.1% 9.6% 42.4% 41.5% 4 Sheboygan 3.2% 8.5% 41.2% 46.1% 3 4.4% 8.7% 47.6% 38.2% 2 Oshkosh 4.2% 7.5% 37.0% 48.5% 4 3.9% 7.5% 42.8% 43.1% 1
Milwaukee 14.9% 18.2% 43.7% 19.6% 23.6% 20.3% 41.3% 10.9% State 4.9% 8.2% 36.7% 48.4% 8.2% 10.2% 43.3% 36.6%

15th Comparative Analysis of RUSD Page 73
Table 43: 8th grade WKCE reading and math scores, 2011-12 Performance 8th grade scores Reading Math Minimal Basic Proficient Advanced Rank Minimal Basic Proficient Advanced Rank Madison 8.6% 11.4% 38.2% 39.2% 9 10.0% 12.5% 41.5% 33.3% 9 Kenosha 6.1% 11.6% 43.5% 37.7% 6 8.3% 9.7% 50.9% 30.0% 3 Racine 11.6% 17.1% 41.7% 26.8% 10 17.5% 19.5% 45.6% 15.0% 10 Green Bay 5.9% 10.7% 44.6% 33.8% 8 9.5% 11.7% 45.3% 32.2% 8 Appleton 3.7% 8.0% 38.2% 49.2% 1 6.6% 11.1% 45.6% 35.7% 2 Waukesha 4.6% 12.8% 41.3% 39.8% 7 7.3% 10.4% 47.6% 33.1% 4 Eau Claire 3.8% 8.2% 40.5% 45.3% 2 7.8% 9.8% 46.8% 33.5% 5 Janesville 3.3% 11.8% 40.0% 42.2% 4 6.7% 12.1% 47.6% 30.7% 6 Sheboygan 4.4% 12.1% 47.3% 34.8% 4 6.4% 14.3% 49.8% 27.9% 7 Oshkosh 4.3% 7.4% 40.4% 45.3% 3 3.5% 7.0% 46.9% 40.1% 1
Milwaukee 15.3% 19.4% 44.8% 16.9% 22.5% 22.4% 42.0% 9.4% State 5.3% 9.9% 43.3% 39.7% 8.1% 11.7% 47.7% 30.7%
Table 44: 10th grade WKCE reading and math scores, 2011-12
Performance 10th grade scores Reading Math Minimal Basic Proficient Advanced Rank Minimal Basic Proficient Advanced Rank Madison 10.5% 14.0% 22.8% 50.2% 8 18.7% 11.3% 36.7% 30.7% 7 Kenosha 10.1% 18.5% 29.2% 38.7% 9 20.0% 17.8% 40.9% 17.6% 9 Racine 19.5% 19.3% 27.1% 31.9% 10 34.5% 18.4% 34.2% 11.2% 10 Green Bay 8.1% 13.4% 28.8% 45.7% 6 17.5% 13.8% 42.5% 24.4% 8 Appleton 6.1% 12.1% 28.1% 52.5% 3 11.8% 12.1% 47.9% 26.8% 3 Waukesha 6.9% 12.7% 28.1% 49.3% 5 11.3% 12.3% 46.6% 26.8% 6 Eau Claire 5.0% 11.9% 26.4% 54.3% 2 10.1% 12.5% 47.4% 27.7% 2 Janesville 6.9% 11.6% 30.5% 49.9% 4 11.5% 13.7% 50.5% 23.3% 4 Sheboygan 9.2% 15.1% 29.7% 44.3% 7 13.1% 11.3% 44.6% 28.9% 5 Oshkosh 2.4% 10.8% 29.9% 54.4% 1 5.1% 7.7% 47.1% 37.5% 1
Milwaukee 24.8% 23.6% 29.0% 17.4% 42.7% 20.3% 28.0% 3.8% State 7.7% 12.6% 29.1% 48.2% 14.2% 13.1% 45.6% 24.8%
Table 45: High school completion, 2010-11 Graduation
Total expected to
complete high school Regular
diplomas % Regular diplomas Rank
Madison 1,929 1,619 83.9% 9 Kenosha 1,724 1,534 89.0% 6 Racine 1,651 1,210 73.2% 10 Green Bay 1,445 1,246 86.2% 8 Appleton 1,322 1,211 91.6% 5 Waukesha 1,347 1,249 92.7% 3 Eau Claire 862 810 94.0% 2 Janesville * * 87.9% 7 Sheboygan 820 778 94.9% 1 Oshkosh 843 779 92.4% 4
Milwaukee 6,624 4,543 68.6% State of Wisconsin 70,880 64,136 90.5%

15th Comparative Analysis of RUSD Page 74
Table 46: Advanced placement (AP) exam participation and passage rates, 2010-11 Performance
Exams passed
% Exams passed
Passed as a % of HS enrollment Rank
Madison 1,163 81.3% 15.6% 4 Kenosha 635 64.9% 9.1% 6 Racine AP & IB 345 53.7% 5.5% 10
Racine AP 217 44.7% 3.4% Racine IB 128 81.5% 2.0%
Green Bay 673 75.0% 11.4% 5 Appleton 799 67.8% 16.6% 3 Waukesha 879 70.7% 19.1% 1 Eau Claire 615 72.9% 18.8% 2 Janesville 299 54.7% 8.9% 7 Sheboygan 203 74.4% 6.3% 9 Oshkosh 260 72.0% 8.4% 8
Milwaukee 399 22.7% 1.7% State of Wisconsin 31,517 67.6% 11.5%
Table 47: ACT exam participation and average scores, 2011-12 Performance ACT test scores
Percent tested Rank Reading English Math Science Composite Rank
Madison 56.9% 5 23.9 23.2 23.6 23.3 23.7 1 Kenosha 60.9% 1 21.7 21.0 20.7 21.4 21.3 8 Racine 43.0% 10 20.5 19.4 19.9 20.6 20.2 10 Green Bay 45.7% 9 22.2 21.3 23.0 22.3 22.4 6 Appleton 59.9% 2 23.3 22.3 23.1 23.2 23.1 3 Waukesha 57.2% 4 22.5 22.2 22.3 22.5 22.5 5 Eau Claire 50.7% 8 23.0 23.1 23.4 23.3 23.3 2 Janesville 59.9% 2 21.8 20.7 20.7 22.0 21.5 7 Sheboygan 51.1% 7 20.8 20.3 21.7 21.5 21.2 9 Oshkosh 55.1% 6 22.2 21.0 23.5 23.2 22.6 4
Milwaukee 85.0% 15.9 14.4 16.3 16.5 15.9 State of Wisconsin 60.8% 22.0 21.3 21.9 22.1 22.0

APPENDIXII–SCHOOL‐BY‐SCHOOLDATA
HighRacine School Report
Principal:
CaseNovember 2012
Jeffrey Eben
Total Enrollment by Year
Enrollment Demographics
Attendance
Standardized Tests
1,8852011-2012:
2002-2003: 1,942
Attendance Rate: 91.9%
Habitual Truants: 429
Truancy Rate: 21.7%
Pupils Suspended: 343
Suspension Rate: 17.3%
2003-2004: 1,954
2004-2005: 2,053
1,9662005-2006:
Dropouts:
Dropout Rate:
139
6.9%2006-2007: 1,976
2,0202007-2008:
ACT Percent Tested: 39.1%
English: 19.8
Math: 20.3
Reading: 21.1
Science: 21.1
Composite: 20.7
1,9922008-2009:
2009-2010: 1,984
Graduation Rate: 73.2%
2010-2011: 1,981
Asian: 37
African American: 531
Hispanic: 382
American Indian 7
White: 902
% Minority: 52.1%
% African American: 28.2%
Native Hawaiian or Pacific Islander: 2
Two or more races: 24
10th 62.9%Reading:
Language:
Math:
Science:
Social Studies:
At/Above Proficient
55.4%
51.2%
54.6%
60.8%
Note: Blank cells are not applicable.
http://reportcards.dpi.wi.gov/files/reportcards/pdf/SRCDetail_Public_Case_Hi_2011-12_005830-005897.PDFDPI 2012 School Report Card Link:
15thAnnualComparativeAnalysisofRUSD75Page

HighRacine School Report
Principal:
HorlickNovember 2012
Angela Apmann
Total Enrollment by Year
Enrollment Demographics
Attendance
Standardized Tests
2,0762011-2012:
2002-2003: 2,175
Attendance Rate: 92.1%
Habitual Truants: 497
Truancy Rate: 24.8%
Pupils Suspended: 304
Suspension Rate: 15.2%
2003-2004: 2,163
2004-2005: 2,154
2,1662005-2006:
Dropouts:
Dropout Rate:
156
7.3%2006-2007: 2,207
2,1682007-2008:
ACT Percent Tested: 38.6%
English: 19.0
Math: 19.5
Reading: 20.2
Science: 20.4
Composite: 19.9
2,0592008-2009:
2009-2010: 2,093
Graduation Rate: 70.7%
2010-2011: 2,004
Asian: 24
African American: 532
Hispanic: 447
American Indian 5
White: 1,046
% Minority: 49.6%
% African American: 25.6%
Native Hawaiian or Pacific Islander: 0
Two or more races: 22
10th 51.4%Reading:
Language:
Math:
Science:
Social Studies:
At/Above Proficient
45.3%
38.2%
42.9%
44.0%
Note: Blank cells are not applicable.
http://reportcards.dpi.wi.gov/files/reportcards/pdf/SRCDetail_Public_Horlick_Hi_2011-12_005830-005827.PDFDPI 2012 School Report Card Link:
15thAnnualComparativeAnalysisofRUSD76Page

HighRacine School Report
Principal:
ParkNovember 2012
Dan Thielen
Total Enrollment by Year
Enrollment Demographics
Attendance
Standardized Tests
1,7662011-2012:
2002-2003: 2,252
Attendance Rate: 92.1%
Habitual Truants: 479
Truancy Rate: 25.7%
Pupils Suspended: 302
Suspension Rate: 16.2%
2003-2004: 2,224
2004-2005: 2,287
2,3052005-2006:
Dropouts:
Dropout Rate:
131
6.7%2006-2007: 2,324
2,2752007-2008:
ACT Percent Tested: 42.8%
English: 18.4
Math: 19.2
Reading: 19.8
Science: 19.9
Composite: 19.4
2,1682008-2009:
2009-2010: 2,034
Graduation Rate: 72.1%
2010-2011: 1,862
Asian: 13
African American: 578
Hispanic: 369
American Indian 5
White: 781
% Minority: 55.8%
% African American: 32.7%
Native Hawaiian or Pacific Islander: 0
Two or more races: 20
10th 58.2%Reading:
Language:
Math:
Science:
Social Studies:
At/Above Proficient
38.3%
42.1%
43.9%
51.0%
Note: Blank cells are not applicable.
http://reportcards.dpi.wi.gov/files/reportcards/pdf/SRCDetail_Public_Park_Hi_2011-12_005830-005756.PDFDPI 2012 School Report Card Link:
15thAnnualComparativeAnalysisofRUSD77Page

HighRacine School Report
Principal:
Walden IIINovember 2012
Robert Holzem
Total Enrollment by Year
Enrollment Demographics
Attendance
Standardized Tests
2962011-2012:
2002-2003: 226
Attendance Rate: 94.6%
Habitual Truants: 8
Truancy Rate: 2.7%
Pupils Suspended: 9
Suspension Rate: 3.0%
2003-2004: 269
2004-2005: 281
2842005-2006:
Dropouts:
Dropout Rate:
0
0.0%2006-2007: 287
2902007-2008:
ACT Percent Tested: 86.5%
English: 22.7
Math: 22.4
Reading: 22.3
Science: 22.0
Composite: 22.4
2982008-2009:
2009-2010: 299
Graduation Rate: 100.0%
2010-2011: 300
Asian: 10
African American: 27
Hispanic: 61
American Indian 0
White: 194
% Minority: 34.5%
% African American: 9.1%
Native Hawaiian or Pacific Islander: 0
Two or more races: 4
10th 95.8%Reading:
Language:
Math:
Science:
Social Studies:
At/Above Proficient
79.2%
84.7%
86.1%
90.3%
Note: Blank cells are not applicable.
http://reportcards.dpi.wi.gov/files/reportcards/pdf/SRCDetail_Public_Walden_III_Hi_2011-12_005830-005757.PDFDPI 2012 School Report Card Link:
15thAnnualComparativeAnalysisofRUSD78Page

Middle & HighRacine School Report
Principal:
The REAL SchoolNovember 2012
Robert Holzem
Total Enrollment by Year
Enrollment Demographics
Attendance
Standardized Tests
2952011-2012:
2002-2003: 208
Attendance Rate: 93.1%
Habitual Truants: 7
Truancy Rate: 2.4%
Pupils Suspended: 7
Suspension Rate: 2.4%
2003-2004: 200
2004-2005: 195
2202005-2006:
Dropouts:
Dropout Rate:
0
0.0%2006-2007: 220
2422007-2008:
10th 88.9%Reading:
Language:
Math:
Science:
Social Studies:
At/Above Proficient
88.9%
73.3%
71.1%
86.7%
ACT Percent Tested: 88.9%
English: 20.6
Math: 20.0
Reading: 21.3
Science: 21.2
Composite: 20.9
2342008-2009:
2009-2010:
Graduation Rate: 100.0%
2010-2011:
296
293
Asian: 8
African American: 47
Hispanic: 38
American Indian 0
White: 191
% Minority: 35.3%
% African American: 15.9%
Native Hawaiian or Pacific Islander: 1
Two or more races: 10
6th
8th
7th
100.0%
71.4%
94.2%Reading:
Language:
Math:
Science:
Social Studies:
Reading:
Math:
At/Above Proficient
At/Above Proficient
78.8%
86.5%
98.1%
92.3%
97.8%
88.9%
Reading:
Math:
At/Above Proficient
Note: Blank cells are not applicable.
http://reportcards.dpi.wi.gov/files/reportcards/pdf/SRCDetail_Public_The_REAL_School_2011-12_005830-071269.PDFDPI 2012 School Report Card Link:
15thAnnualComparativeAnalysisofRUSD79Page

MiddleRacine School Report
Principal:
GilmoreNovember 2012
Kevin Brown
Total Enrollment by Year
Enrollment Demographics
Attendance
Standardized Tests
7922011-2012:
2002-2003: 979
Asian: 7
African American: 250
Hispanic: 231
American Indian: 5
White: 290
Attendance Rate: 93.2%
Habitual Truants: 110
Truancy Rate: 14.6%
Pupils Suspended: 238
Suspension Rate: 31.5%
% Minority: 63.4%
2003-2004: 919
2004-2005: 824
% African American: 31.6%
7872005-2006:
Dropouts:
Dropout Rate:
3
0.6%2006-2007: 752
6th
8th
7th
62.4%
51.5%
66.1%Reading:
Language:
Math:
Science:
Social Studies:
Reading:
Math:
At/Above Proficient
At/Above Proficient
35.3%
48.7%
49.1%
56.7%
66.5%
57.7%
Reading:
Math:
At/Above Proficient
7562007-2008:
7492008-2009:
2009-2010: 799
2010-2011: 755
Native Hawaiian or Pacific Islander: 0
Two or more races: 9
Note: Blank cells are not applicable.
http://reportcards.dpi.wi.gov/files/reportcards/pdf/SRCDetail_Public_Gilmore_Mid_2011-12_005830-005826.PDFDPI 2012 School Report Card Link:
15thAnnualComparativeAnalysisofRUSD80Page

MiddleRacine School Report
Principal:
Jerstad-AgerholmNovember 2012
Doug Clum
Total Enrollment by Year
Enrollment Demographics
Attendance
Standardized Tests
7382011-2012:
2002-2003: 760
Asian: 5
African American: 169
Hispanic: 189
American Indian: 4
White: 358
Attendance Rate: 93.3%
Habitual Truants: 115
Truancy Rate: 14.6%
Pupils Suspended: 163
Suspension Rate: 20.7%
% Minority: 51.5%
2003-2004: 820
2004-2005: 810
% African American: 22.9%
7852005-2006:
Dropouts:
Dropout Rate:
1
0.2%2006-2007: 772
6th
8th
7th
71.5%
60.3%
63.9%Reading:
Language:
Math:
Science:
Social Studies:
Reading:
Math:
At/Above Proficient
At/Above Proficient
42.9%
56.2%
57.9%
56.7%
74.4%
63.3%
Reading:
Math:
At/Above Proficient
7612007-2008:
7842008-2009:
2009-2010: 789
2010-2011: 786
Native Hawaiian or Pacific Islander: 0
Two or more races: 13
Note: Blank cells are not applicable.
http://reportcards.dpi.wi.gov/files/reportcards/pdf/SRCDetail_Public_Jerstad-Agerholm_Mid_2011-12_005830-005708.PDFDPI 2012 School Report Card Link:
15thAnnualComparativeAnalysisofRUSD81Page

MiddleRacine School Report
Principal:
McKinleyNovember 2012
Cheri Kulland
Total Enrollment by Year
Enrollment Demographics
Attendance
Standardized Tests
8622011-2012:
2002-2003: 1,022
Asian: 7
African American: 230
Hispanic: 194
American Indian: 3
White: 415
Attendance Rate: 93.8%
Habitual Truants: 127
Truancy Rate: 14.2%
Pupils Suspended: 218
Suspension Rate: 24.3%
% Minority: 51.9%
2003-2004: 988
2004-2005: 911
% African American: 26.7%
8242005-2006:
Dropouts:
Dropout Rate:
1
0.2%2006-2007: 791
6th
8th
7th
79.2%
61.3%
73.0%Reading:
Language:
Math:
Science:
Social Studies:
Reading:
Math:
At/Above Proficient
At/Above Proficient
58.6%
61.5%
57.4%
73.4%
77.1%
66.0%
Reading:
Math:
At/Above Proficient
8092007-2008:
8572008-2009:
2009-2010: 870
2010-2011: 897
Native Hawaiian or Pacific Islander: 0
Two or more races: 13
Note: Blank cells are not applicable.
http://reportcards.dpi.wi.gov/files/reportcards/pdf/SRCDetail_Public_McKinley_Mid_2011-12_005830-005862.PDFDPI 2012 School Report Card Link:
15thAnnualComparativeAnalysisofRUSD82Page

MiddleRacine School Report
Principal:
MitchellNovember 2012
Soren Gajewski
Total Enrollment by Year
Enrollment Demographics
Attendance
Standardized Tests
7722011-2012:
2002-2003: 1,017
Asian: 11
African American: 221
Hispanic: 252
American Indian: 3
White: 275
Attendance Rate: 93.1%
Habitual Truants: 104
Truancy Rate: 14.3%
Pupils Suspended: 147
Suspension Rate: 20.2%
% Minority: 64.4%
2003-2004: 981
2004-2005: 935
% African American: 28.6%
8912005-2006:
Dropouts:
Dropout Rate:
1
0.2%2006-2007: 916
6th
8th
7th
66.1%
61.0%
66.3%Reading:
Language:
Math:
Science:
Social Studies:
Reading:
Math:
At/Above Proficient
At/Above Proficient
47.1%
67.3%
57.7%
69.7%
73.5%
59.3%
Reading:
Math:
At/Above Proficient
7462007-2008:
7302008-2009:
2009-2010: 698
2010-2011: 726
Native Hawaiian or Pacific Islander: 0
Two or more races: 10
Note: Blank cells are not applicable.
http://reportcards.dpi.wi.gov/files/reportcards/pdf/SRCDetail_Public_Mitchell_Mid_2011-12_005830-005754.PDFDPI 2012 School Report Card Link:
15thAnnualComparativeAnalysisofRUSD83Page

MiddleRacine School Report
Principal:
StarbuckNovember 2012
Janet Colvin
Total Enrollment by Year
Enrollment Demographics
Attendance
Standardized Tests
7572011-2012:
2002-2003: 864
Asian: 13
African American: 241
Hispanic: 181
American Indian: 2
White: 310
Attendance Rate: 92.5%
Habitual Truants: 123
Truancy Rate: 15.3%
Pupils Suspended: 204
Suspension Rate: 25.4%
% Minority: 59.0%
2003-2004: 830
2004-2005: 839
% African American: 31.8%
8472005-2006:
Dropouts:
Dropout Rate:
2
0.4%2006-2007: 743
6th
8th
7th
70.0%
56.7%
66.2%Reading:
Language:
Math:
Science:
Social Studies:
Reading:
Math:
At/Above Proficient
At/Above Proficient
44.8%
65.7%
61.7%
63.2%
79.3%
71.0%
Reading:
Math:
At/Above Proficient
7992007-2008:
7542008-2009:
2009-2010: 796
2010-2011: 804
Native Hawaiian or Pacific Islander: 0
Two or more races: 10
Note: Blank cells are not applicable.
http://reportcards.dpi.wi.gov/files/reportcards/pdf/SRCDetail_Public_Starbuck_Mid_2011-12_005830-005863.PDFDPI 2012 School Report Card Link:
15thAnnualComparativeAnalysisofRUSD84Page

MiddleRacine School Report
Principal:
Walden IIINovember 2012
Robert Holzem
Total Enrollment by Year
Enrollment Demographics
Attendance
Standardized Tests
2242011-2012:
2002-2003: 214
Asian: 11
African American: 18
Hispanic: 53
American Indian: 1
White: 137
Attendance Rate: 96.4%
Habitual Truants: 0
Truancy Rate: 0.0%
Pupils Suspended: 6
Suspension Rate: 2.7%
% Minority: 38.8%
2003-2004: 220
2004-2005: 223
% African American: 8.0%
2202005-2006:
Dropouts:
Dropout Rate:
0
0.0%2006-2007: 224
6th
8th
7th
91.2%
91.2%
95.5%Reading:
Language:
Math:
Science:
Social Studies:
Reading:
Math:
At/Above Proficient
At/Above Proficient
81.8%
98.5%
93.9%
97.0%
95.7%
94.3%
Reading:
Math:
At/Above Proficient
2242007-2008:
2262008-2009:
2009-2010: 225
2010-2011: 226
Native Hawaiian or Pacific Islander: 0
Two or more races: 4
Note: Blank cells are not applicable.
http://reportcards.dpi.wi.gov/files/reportcards/pdf/SRCDetail_Public_Walden_III_Mid_2011-12_005830-005753.PDFDPI 2012 School Report Card Link:
15thAnnualComparativeAnalysisofRUSD85Page

GradeRacine School Report
Principal:
Bull Fine ArtsNovember 2012
Jennifer Barncard
Total Enrollment by Year
Enrollment Demographics
Attendance
Standardized Tests
3rd
4th
5th
2011-2012:
2002-2003: 306
Attendance Rate: 95.7%
Habitual Truants: 1
Truancy Rate: 0.3%
Pupils Suspended: 2
Suspension Rate: 0.6%
73.9%
67.4%
83.7%Reading:
Language:
Math:
Science:
Social Studies:
Reading:
Math:
At/Above Proficient
Note: Blank cells are not applicable.
At/Above Proficient
2003-2004: 325
83.7%
77.6%
85.7%
87.8%
75.0%
58.3%
2004-2005: 329
3362005-2006:
Reading:
Math:
At/Above Proficient
2006-2007: 305
3092007-2008:
301
2008-2009:
2009-2010:
304
2010-2011: 312
315
Asian: 7
African American: 75
Hispanic: 48
American Indian: 2
White: 172
% Minority: 45.4%
% African American: 23.8%
Native Hawaiian or Pacific Islander: 0
Two or more races: 11
http://reportcards.dpi.wi.gov/files/reportcards/pdf/SRCDetail_Public_Fine_Arts_El_2011-12_005830-005746.PDFDPI 2012 School Report Card Link:
15thAnnualComparativeAnalysisofRUSD86Page

GradeRacine School Report
Principal:
Dr. JonesNovember 2012
Ronald Sandoval
Total Enrollment by Year
Enrollment Demographics
Attendance
Standardized Tests
3rd
4th
5th
2011-2012:
2002-2003: 458
Attendance Rate: 94.1%
Habitual Truants: 46
Truancy Rate: 10.2%
Pupils Suspended: 8
Suspension Rate: 1.6%
67.2%
70.5%
69.0%Reading:
Language:
Math:
Science:
Social Studies:
Reading:
Math:
At/Above Proficient
Note: Blank cells are not applicable.
At/Above Proficient
2003-2004: 461
65.5%
69.0%
65.5%
84.5%
77.8%
74.6%
2004-2005: 465
4612005-2006:
Reading:
Math:
At/Above Proficient
2006-2007: 482
4902007-2008:
475
2008-2009:
2009-2010:
476
2010-2011: 487
463
Asian: 7
African American: 70
Hispanic: 176
American Indian: 0
White: 199
% Minority: 57.0%
% African American: 15.1%
Native Hawaiian or Pacific Islander: 0
Two or more races: 11
http://reportcards.dpi.wi.gov/files/reportcards/pdf/SRCDetail_Public_Jones_El_2011-12_005830-005747.PDFDPI 2012 School Report Card Link:
15thAnnualComparativeAnalysisofRUSD87Page

GradeRacine School Report
Principal:
FrattNovember 2012
James Haas
Total Enrollment by Year
Enrollment Demographics
Attendance
Standardized Tests
3rd
4th
5th
2011-2012:
2002-2003: 576
Attendance Rate: 94.3%
Habitual Truants: 33
Truancy Rate: 6.4%
Pupils Suspended: 39
Suspension Rate: 7.6%
76.3%
54.2%
71.9%Reading:
Language:
Math:
Science:
Social Studies:
Reading:
Math:
At/Above Proficient
Note: Blank cells are not applicable.
At/Above Proficient
2003-2004: 543
71.9%
62.5%
56.3%
79.7%
82.8%
69.0%
2004-2005: 533
5322005-2006:
Reading:
Math:
At/Above Proficient
2006-2007: 536
5412007-2008:
524
2008-2009:
2009-2010:
536
2010-2011: 514
495
Asian: 3
African American: 89
Hispanic: 202
American Indian: 1
White: 179
% Minority: 63.8%
% African American: 18.0%
Native Hawaiian or Pacific Islander: 0
Two or more races: 21
http://reportcards.dpi.wi.gov/files/reportcards/pdf/SRCDetail_Public_Fratt_El_2011-12_005830-005858.PDFDPI 2012 School Report Card Link:
15thAnnualComparativeAnalysisofRUSD88Page

GradeRacine School Report
Principal:
GieseNovember 2012
Richard Wytonick
Total Enrollment by Year
Enrollment Demographics
Attendance
Standardized Tests
3rd
4th
5th
2011-2012:
2002-2003: 363
Attendance Rate: 93.2%
Habitual Truants: 90
Truancy Rate: 25.7%
Pupils Suspended: 37
Suspension Rate: 9.5%
71.0%
64.5%
57.1%Reading:
Language:
Math:
Science:
Social Studies:
Reading:
Math:
At/Above Proficient
Note: Blank cells are not applicable.
At/Above Proficient
2003-2004: 341
61.9%
59.5%
40.5%
78.6%
72.1%
51.2%
2004-2005: 341
3412005-2006:
Reading:
Math:
At/Above Proficient
2006-2007: 314
3052007-2008:
383
2008-2009:
2009-2010:
346
2010-2011: 391
391
Asian: 3
African American: 204
Hispanic: 86
American Indian: 1
White: 82
% Minority: 79.0%
% African American: 52.2%
Native Hawaiian or Pacific Islander: 0
Two or more races: 15
http://reportcards.dpi.wi.gov/files/reportcards/pdf/SRCDetail_Public_Giese_El_2011-12_005830-005859.PDFDPI 2012 School Report Card Link:
15thAnnualComparativeAnalysisofRUSD89Page

GradeRacine School Report
Principal:
GiffordNovember 2012
Les Hunt
Total Enrollment by Year
Enrollment Demographics
Attendance
Standardized Tests
3rd
4th
5th
2011-2012:
2002-2003: 832
Attendance Rate: 95.9%
Habitual Truants: 9
Truancy Rate: 1.0%
Pupils Suspended: 23
Suspension Rate: 2.3%
92.5%
88.8%
88.0%Reading:
Language:
Math:
Science:
Social Studies:
Reading:
Math:
At/Above Proficient
Note: Blank cells are not applicable.
At/Above Proficient
2003-2004: 843
84.0%
84.0%
84.0%
95.3%
86.8%
82.9%
2004-2005: 837
9092005-2006:
Reading:
Math:
At/Above Proficient
2006-2007: 858
9252007-2008:
946
2008-2009:
2009-2010:
961
2010-2011: 982
944
Asian: 21
African American: 65
Hispanic: 124
American Indian: 1
White: 715
% Minority: 24.3%
% African American: 6.9%
Native Hawaiian or Pacific Islander: 1
Two or more races: 17
http://reportcards.dpi.wi.gov/files/reportcards/pdf/SRCDetail_Public_Gifford_El_2011-12_005830-005894.PDFDPI 2012 School Report Card Link:
15thAnnualComparativeAnalysisofRUSD90Page

GradeRacine School Report
Principal:
GoodlandNovember 2012
Billie Marie Novick
Total Enrollment by Year
Enrollment Demographics
Attendance
Standardized Tests
3rd
4th
5th
2011-2012:
2002-2003: 376
Attendance Rate: 93.3%
Habitual Truants: 77
Truancy Rate: 25.8%
Pupils Suspended: 44
Suspension Rate: 12.9%
61.1%
52.8%
51.9%Reading:
Language:
Math:
Science:
Social Studies:
Reading:
Math:
At/Above Proficient
Note: Blank cells are not applicable.
At/Above Proficient
2003-2004: 352
40.7%
55.6%
40.7%
74.1%
53.1%
53.1%
2004-2005: 341
3212005-2006:
Reading:
Math:
At/Above Proficient
2006-2007: 370
3902007-2008:
348
2008-2009:
2009-2010:
317
2010-2011: 342
350
Asian: 3
African American: 143
Hispanic: 90
American Indian: 0
White: 106
% Minority: 69.7%
% African American: 40.9%
Native Hawaiian or Pacific Islander: 0
Two or more races: 8
http://reportcards.dpi.wi.gov/files/reportcards/pdf/SRCDetail_Public_Goodland_El_2011-12_005830-005895.PDFDPI 2012 School Report Card Link:
15thAnnualComparativeAnalysisofRUSD91Page

GradeRacine School Report
Principal:
JanesNovember 2012
Walter Robles
Total Enrollment by Year
Enrollment Demographics
Attendance
Standardized Tests
3rd
4th
5th
2011-2012:
2002-2003: 397
Attendance Rate: 95.1%
Habitual Truants: 76
Truancy Rate: 19.5%
Pupils Suspended: 0
Suspension Rate: 0.0%
59.2%
71.4%
64.7%Reading:
Language:
Math:
Science:
Social Studies:
Reading:
Math:
At/Above Proficient
Note: Blank cells are not applicable.
At/Above Proficient
2003-2004: 384
56.9%
64.7%
60.8%
90.2%
62.5%
79.2%
2004-2005: 394
4032005-2006:
Reading:
Math:
At/Above Proficient
2006-2007: 419
4212007-2008:
407
2008-2009:
2009-2010:
415
2010-2011: 423
396
Asian: 0
African American: 84
Hispanic: 252
American Indian: 6
White: 42
% Minority: 89.4%
% African American: 21.2%
Native Hawaiian or Pacific Islander: 0
Two or more races: 12
http://reportcards.dpi.wi.gov/files/reportcards/pdf/SRCDetail_Public_Janes_El_2011-12_005830-005748.PDFDPI 2012 School Report Card Link:
15thAnnualComparativeAnalysisofRUSD92Page

GradeRacine School Report
Principal:
Jefferson LighthouseNovember 2012
Rosalie Daca
Total Enrollment by Year
Enrollment Demographics
Attendance
Standardized Tests
3rd
4th
5th
2011-2012:
2002-2003: 564
Attendance Rate: 95.6%
Habitual Truants: 5
Truancy Rate: 0.9%
Pupils Suspended: 0
Suspension Rate: 0.0%
92.3%
89.0%
97.9%Reading:
Language:
Math:
Science:
Social Studies:
Reading:
Math:
At/Above Proficient
Note: Blank cells are not applicable.
At/Above Proficient
2003-2004: 550
93.6%
93.6%
90.4%
97.9%
96.7%
96.7%
2004-2005: 542
5612005-2006:
Reading:
Math:
At/Above Proficient
2006-2007: 547
5432007-2008:
563
2008-2009:
2009-2010:
554
2010-2011: 566
565
Asian: 27
African American: 72
Hispanic: 83
American Indian: 3
White: 356
% Minority: 37.0%
% African American: 12.7%
Native Hawaiian or Pacific Islander: 1
Two or more races: 23
http://reportcards.dpi.wi.gov/files/reportcards/pdf/SRCDetail_Public_Jefferson_Lighthouse_El_2011-12_005830-005749.PDFDPI 2012 School Report Card Link:
15thAnnualComparativeAnalysisofRUSD93Page

GradeRacine School Report
Principal:
Jerstad-AgerholmNovember 2012
Cecilia Holley-Young
Total Enrollment by Year
Enrollment Demographics
Attendance
Standardized Tests
3rd
4th
5th
2011-2012:
2002-2003: 404
Attendance Rate: 92.9%
Habitual Truants: 40
Truancy Rate: 12.4%
Pupils Suspended: 51
Suspension Rate: 14.1%
65.7%
68.6%
77.3%Reading:
Language:
Math:
Science:
Social Studies:
Reading:
Math:
At/Above Proficient
Note: Blank cells are not applicable.
At/Above Proficient
2003-2004: 361
86.4%
77.3%
72.7%
100.0%
74.4%
69.8%
2004-2005: 334
3652005-2006:
Reading:
Math:
At/Above Proficient
2006-2007: 381
3762007-2008:
335
2008-2009:
2009-2010:
368
2010-2011: 361
362
Asian: 2
African American: 99
Hispanic: 82
American Indian: 1
White: 165
% Minority: 54.4%
% African American: 27.3%
Native Hawaiian or Pacific Islander: 0
Two or more races: 13
http://reportcards.dpi.wi.gov/files/reportcards/pdf/SRCDetail_Public_Jerstad-Agerholm_El_2011-12_005830-005704.PDFDPI 2012 School Report Card Link:
15thAnnualComparativeAnalysisofRUSD94Page

GradeRacine School Report
Principal:
Julian ThomasNovember 2012
Bryan Terry
Total Enrollment by Year
Enrollment Demographics
Attendance
Standardized Tests
3rd
4th
5th
2011-2012:
2002-2003:
Attendance Rate: 94.1%
Habitual Truants: 103
Truancy Rate: 25.2%
Pupils Suspended: 69
Suspension Rate: 14.9%
53.2%
66.0%
49.0%Reading:
Language:
Math:
Science:
Social Studies:
Reading:
Math:
At/Above Proficient
Note: Blank cells are not applicable.
At/Above Proficient
2003-2004: 374
43.1%
52.9%
43.1%
72.5%
48.9%
48.9%
2004-2005: 357
3492005-2006:
Reading:
Math:
At/Above Proficient
2006-2007: 370
3422007-2008:
434
2008-2009:
2009-2010:
426
2010-2011: 464
465
Asian: 1
African American: 176
Hispanic: 246
American Indian: 0
White: 31
% Minority: 93.3%
% African American: 37.8%
Native Hawaiian or Pacific Islander: 0
Two or more races: 11
http://reportcards.dpi.wi.gov/files/reportcards/pdf/SRCDetail_Public_Julian_Thomas_El_2011-12_005830-072500.PDFDPI 2012 School Report Card Link:
15thAnnualComparativeAnalysisofRUSD95Page

GradeRacine School Report
Principal:
KnappNovember 2012
Chelsia Stallworth
Total Enrollment by Year
Enrollment Demographics
Attendance
Standardized Tests
3rd
4th
5th
2011-2012:
2002-2003: 513
Attendance Rate: 90.9%
Habitual Truants: 116
Truancy Rate: 28.4%
Pupils Suspended: 0
Suspension Rate: 0.0%
39.0%
24.4%
53.5%Reading:
Language:
Math:
Science:
Social Studies:
Reading:
Math:
At/Above Proficient
Note: Blank cells are not applicable.
At/Above Proficient
2003-2004: 490
69.8%
51.2%
53.5%
83.7%
41.9%
48.8%
2004-2005: 516
5452005-2006:
Reading:
Math:
At/Above Proficient
2006-2007: 569
5622007-2008:
501
2008-2009:
2009-2010:
523
2010-2011: 445
449
Asian: 3
African American: 207
Hispanic: 107
American Indian: 2
White: 110
% Minority: 75.5%
% African American: 46.1%
Native Hawaiian or Pacific Islander: 0
Two or more races: 20
http://reportcards.dpi.wi.gov/files/reportcards/pdf/SRCDetail_Public_Knapp_El_2011-12_005830-005861.PDFDPI 2012 School Report Card Link:
15thAnnualComparativeAnalysisofRUSD96Page

GradeRacine School Report
Principal:
MitchellNovember 2012
Isaac Kirkwood
Total Enrollment by Year
Enrollment Demographics
Attendance
Standardized Tests
3rd
4th
5th
2011-2012:
2002-2003: 418
Attendance Rate: 94.1%
Habitual Truants: 32
Truancy Rate: 7.9%
Pupils Suspended: 42
Suspension Rate: 9.4%
52.1%
43.8%
66.7%Reading:
Language:
Math:
Science:
Social Studies:
Reading:
Math:
At/Above Proficient
Note: Blank cells are not applicable.
At/Above Proficient
2003-2004: 454
70.6%
62.7%
60.8%
96.1%
57.1%
44.6%
2004-2005: 457
4702005-2006:
Reading:
Math:
At/Above Proficient
2006-2007: 484
4812007-2008:
467
2008-2009:
2009-2010:
511
2010-2011: 446
471
Asian: 2
African American: 103
Hispanic: 211
American Indian: 0
White: 143
% Minority: 69.6%
% African American: 21.9%
Native Hawaiian or Pacific Islander: 0
Two or more races: 12
http://reportcards.dpi.wi.gov/files/reportcards/pdf/SRCDetail_Public_Mitchell_El_2011-12_005830-005750.PDFDPI 2012 School Report Card Link:
15thAnnualComparativeAnalysisofRUSD97Page

GradeRacine School Report
Principal:
North ParkNovember 2012
Mark Zanin
Total Enrollment by Year
Enrollment Demographics
Attendance
Standardized Tests
3rd
4th
5th
2011-2012:
2002-2003: 443
Attendance Rate: 94.4%
Habitual Truants: 59
Truancy Rate: 12.8%
Pupils Suspended: 52
Suspension Rate: 11.0%
67.9%
66.0%
73.2%Reading:
Language:
Math:
Science:
Social Studies:
Reading:
Math:
At/Above Proficient
Note: Blank cells are not applicable.
At/Above Proficient
2003-2004: 398
64.3%
67.9%
73.2%
87.5%
83.9%
69.6%
2004-2005: 413
4212005-2006:
Reading:
Math:
At/Above Proficient
2006-2007: 505
5002007-2008:
483
2008-2009:
2009-2010:
467
2010-2011: 472
426
Asian: 0
African American: 119
Hispanic: 67
American Indian: 3
White: 217
% Minority: 49.1%
% African American: 27.9%
Native Hawaiian or Pacific Islander: 0
Two or more races: 20
http://reportcards.dpi.wi.gov/files/reportcards/pdf/SRCDetail_Public_North_Park_El_2011-12_005830-005705.PDFDPI 2012 School Report Card Link:
15thAnnualComparativeAnalysisofRUSD98Page

GradeRacine School Report
Principal:
Olympia BrownNovember 2012
Joan Kuehl
Total Enrollment by Year
Enrollment Demographics
Attendance
Standardized Tests
3rd
4th
5th
2011-2012:
2002-2003: 562
Attendance Rate: 93.8%
Habitual Truants: 41
Truancy Rate: 9.7%
Pupils Suspended: 29
Suspension Rate: 6.0%
80.4%
76.8%
68.8%Reading:
Language:
Math:
Science:
Social Studies:
Reading:
Math:
At/Above Proficient
Note: Blank cells are not applicable.
At/Above Proficient
2003-2004: 466
65.6%
76.6%
67.2%
87.5%
76.8%
80.4%
2004-2005: 443
4552005-2006:
Reading:
Math:
At/Above Proficient
2006-2007: 501
5052007-2008:
476
2008-2009:
2009-2010:
510
2010-2011: 481
453
Asian: 1
African American: 72
Hispanic: 67
American Indian: 2
White: 296
% Minority: 34.7%
% African American: 15.9%
Native Hawaiian or Pacific Islander: 0
Two or more races: 15
http://reportcards.dpi.wi.gov/files/reportcards/pdf/SRCDetail_Public_O_Brown_El_2011-12_005830-005703.PDFDPI 2012 School Report Card Link:
15thAnnualComparativeAnalysisofRUSD99Page

GradeRacine School Report
Principal:
Red AppleNovember 2012
Dr. Byran Matera
Total Enrollment by Year
Enrollment Demographics
Attendance
Standardized Tests
3rd
4th
5th
2011-2012:
2002-2003: 477
Attendance Rate: 94.5%
Habitual Truants: 6
Truancy Rate: 1.9%
Pupils Suspended: 2
Suspension Rate: 0.5%
73.2%
75.6%
77.8%Reading:
Language:
Math:
Science:
Social Studies:
Reading:
Math:
At/Above Proficient
Note: Blank cells are not applicable.
At/Above Proficient
2003-2004: 414
79.6%
77.8%
81.5%
98.1%
90.2%
68.3%
2004-2005: 456
4582005-2006:
Reading:
Math:
At/Above Proficient
2006-2007: 492
4302007-2008:
449
2008-2009:
2009-2010:
410
2010-2011: 436
446
Asian: 7
African American: 99
Hispanic: 84
American Indian: 4
White: 234
% Minority: 47.5%
% African American: 22.2%
Native Hawaiian or Pacific Islander: 0
Two or more races: 18
http://reportcards.dpi.wi.gov/files/reportcards/pdf/SRCDetail_Public_Red_Apple_El_2011-12_005830-005707.PDFDPI 2012 School Report Card Link:
15thAnnualComparativeAnalysisofRUSD100Page

GradeRacine School Report
Principal:
RooseveltNovember 2012
Amber Lamers
Total Enrollment by Year
Enrollment Demographics
Attendance
Standardized Tests
3rd
4th
5th
2011-2012:
2002-2003: 469
Attendance Rate: 92.8%
Habitual Truants: 33
Truancy Rate: 9.3%
Pupils Suspended: 0
Suspension Rate: 0.0%
88.1%
69.0%
85.7%Reading:
Language:
Math:
Science:
Social Studies:
Reading:
Math:
At/Above Proficient
Note: Blank cells are not applicable.
At/Above Proficient
2003-2004: 428
71.4%
85.7%
73.5%
98.0%
67.3%
56.4%
2004-2005: 435
4392005-2006:
Reading:
Math:
At/Above Proficient
2006-2007: 451
4702007-2008:
359
2008-2009:
2009-2010:
383
2010-2011: 353
319
Asian: 4
African American: 75
Hispanic: 91
American Indian: 0
White: 138
% Minority: 56.7%
% African American: 23.5%
Native Hawaiian or Pacific Islander: 0
Two or more races: 11
http://reportcards.dpi.wi.gov/files/reportcards/pdf/SRCDetail_Public_Roosevelt_El_2011-12_005830-005706.PDFDPI 2012 School Report Card Link:
15thAnnualComparativeAnalysisofRUSD101Page

GradeRacine School Report
Principal:
S.C. JohnsonNovember 2012
Kim DeLaO
Total Enrollment by Year
Enrollment Demographics
Attendance
Standardized Tests
3rd
4th
5th
2011-2012:
2002-2003: 507
Attendance Rate: 93.6%
Habitual Truants: 94
Truancy Rate: 15.6%
Pupils Suspended: 77
Suspension Rate: 12.8%
60.3%
59.0%
49.2%Reading:
Language:
Math:
Science:
Social Studies:
Reading:
Math:
At/Above Proficient
Note: Blank cells are not applicable.
At/Above Proficient
2003-2004: 483
54.0%
54.0%
44.4%
76.2%
50.8%
49.2%
2004-2005: 407
5752005-2006:
Reading:
Math:
At/Above Proficient
2006-2007: 545
5382007-2008:
587
2008-2009:
2009-2010:
581
2010-2011: 601
582
Asian: 6
African American: 242
Hispanic: 169
American Indian: 0
White: 145
% Minority: 75.1%
% African American: 41.6%
Native Hawaiian or Pacific Islander: 0
Two or more races: 20
http://reportcards.dpi.wi.gov/files/reportcards/pdf/SRCDetail_Public_Johnson_El_2011-12_005830-005860.PDFDPI 2012 School Report Card Link:
15thAnnualComparativeAnalysisofRUSD102Page

GradeRacine School Report
Principal:
SchulteNovember 2012
Rebecca Zahn
Total Enrollment by Year
Enrollment Demographics
Attendance
Standardized Tests
3rd
4th
5th
2011-2012:
2002-2003: 415
Attendance Rate: 94.5%
Habitual Truants: 42
Truancy Rate: 9.8%
Pupils Suspended: 16
Suspension Rate: 3.7%
75.4%
77.0%
83.7%Reading:
Language:
Math:
Science:
Social Studies:
Reading:
Math:
At/Above Proficient
Note: Blank cells are not applicable.
At/Above Proficient
2003-2004: 392
81.6%
89.8%
81.6%
98.0%
82.9%
75.7%
2004-2005: 393
4112005-2006:
Reading:
Math:
At/Above Proficient
2006-2007: 410
4092007-2008:
383
2008-2009:
2009-2010:
374
2010-2011: 429
417
Asian: 5
African American: 67
Hispanic: 66
American Indian: 3
White: 256
% Minority: 38.6%
% African American: 16.1%
Native Hawaiian or Pacific Islander: 0
Two or more races: 20
http://reportcards.dpi.wi.gov/files/reportcards/pdf/SRCDetail_Public_Schulte_El_2011-12_005830-003699.PDFDPI 2012 School Report Card Link:
15thAnnualComparativeAnalysisofRUSD103Page

GradeRacine School Report
Principal:
WadewitzNovember 2012
Chad Chapin
Total Enrollment by Year
Enrollment Demographics
Attendance
Standardized Tests
3rd
4th
5th
2011-2012:
2002-2003: 656
Attendance Rate: 93.7%
Habitual Truants: 67
Truancy Rate: 10.7%
Pupils Suspended: 68
Suspension Rate: 9.7%
51.2%
53.6%
43.6%Reading:
Language:
Math:
Science:
Social Studies:
Reading:
Math:
At/Above Proficient
Note: Blank cells are not applicable.
At/Above Proficient
2003-2004: 616
48.7%
47.4%
35.9%
66.7%
55.7%
37.5%
2004-2005: 610
5982005-2006:
Reading:
Math:
At/Above Proficient
2006-2007: 590
6272007-2008:
695
2008-2009:
2009-2010:
606
2010-2011: 703
757
Asian: 6
African American: 238
Hispanic: 334
American Indian: 2
White: 148
% Minority: 80.4%
% African American: 31.4%
Native Hawaiian or Pacific Islander: 0
Two or more races: 29
http://reportcards.dpi.wi.gov/files/reportcards/pdf/SRCDetail_Public_Wadewitz_El_2011-12_005830-005824.PDFDPI 2012 School Report Card Link:
15thAnnualComparativeAnalysisofRUSD104Page

GradeRacine School Report
Principal:
West RidgeNovember 2012
Christopher Thompson
Total Enrollment by Year
Enrollment Demographics
Attendance
Standardized Tests
3rd
4th
5th
2011-2012:
2002-2003: 423
Attendance Rate: 94.4%
Habitual Truants: 26
Truancy Rate: 6.1%
Pupils Suspended: 17
Suspension Rate: 4.0%
75.5%
66.0%
92.0%Reading:
Language:
Math:
Science:
Social Studies:
Reading:
Math:
At/Above Proficient
Note: Blank cells are not applicable.
At/Above Proficient
2003-2004: 436
84.0%
88.0%
88.0%
100.0%
82.8%
81.3%
2004-2005: 451
4472005-2006:
Reading:
Math:
At/Above Proficient
2006-2007: 444
4612007-2008:
411
2008-2009:
2009-2010:
423
2010-2011: 423
404
Asian: 12
African American: 88
Hispanic: 69
American Indian: 1
White: 215
% Minority: 46.8%
% African American: 21.8%
Native Hawaiian or Pacific Islander: 0
Two or more races: 19
http://reportcards.dpi.wi.gov/files/reportcards/pdf/SRCDetail_Public_West_Ridge_El_2011-12_005830-005896.PDFDPI 2012 School Report Card Link:
15thAnnualComparativeAnalysisofRUSD105Page

GradeRacine School Report
Principal:
Wind PointNovember 2012
Kathryn Poznanski
Total Enrollment by Year
Enrollment Demographics
Attendance
Standardized Tests
3rd
4th
5th
2011-2012:
2002-2003: 295
Attendance Rate: 93.1%
Habitual Truants: 27
Truancy Rate: 11.0%
Pupils Suspended: 52
Suspension Rate: 18.4%
44.8%
44.8%
48.0%Reading:
Language:
Math:
Science:
Social Studies:
Reading:
Math:
At/Above Proficient
Note: Blank cells are not applicable.
At/Above Proficient
2003-2004: 286
52.0%
56.0%
48.0%
76.0%
59.4%
53.1%
2004-2005: 236
2742005-2006:
Reading:
Math:
At/Above Proficient
2006-2007: 358
3242007-2008:
283
2008-2009:
2009-2010:
292
2010-2011: 282
265
Asian: 9
African American: 96
Hispanic: 54
American Indian: 0
White: 93
% Minority: 64.9%
% African American: 36.2%
Native Hawaiian or Pacific Islander: 0
Two or more races: 13
http://reportcards.dpi.wi.gov/files/reportcards/pdf/SRCDetail_Public_Wind_Point_El_2011-12_005830-005751.PDFDPI 2012 School Report Card Link:
15thAnnualComparativeAnalysisofRUSD106Page

15th Comparative Analysis of RUSD Page 107
APPENDIX III – DEFINITION OF TERMS This report is based on information supplied periodically by school districts to the Wisconsin Department of Public Instruction (DPI). Enrollment and financial data, and 3rd, 4th, 5th, 6th, 7th, 8th, and 10th grade test scores, are current as of 2011-12. Other information on performance, attendance, and discipline is from 2010-11. Here are the definitions of the included measurements: ACT scores: ACT data are reported for the class of 2012. Most students take the test to fulfill admissions requirements for colleges and universities. If a student has taken the test more than once (in either his or her junior or senior year), the most recent score was reported. The maximum possible score on any individual section is 36. The four sections of the test are English, math, reading, and science reasoning. The composite score is the weighted average of the subject area scores, out of a possible 36. The percentage of students tested is the number of students tested divided by the 12th grade enrollment. Advanced placement tests: If a high school student receives a score of three, four, or five on an AP exam, he or she passed the test and may receive college credit. Students can take 29 exams in 16 fields. Schools may or may not offer formal courses in preparation for these exams. Enrollment data are used to calculate the percentage of students taking the tests. Attendance: Based upon the state-required 180 school days, and with attendance taken twice daily, the attendance rate (expressed as a percentage) is computed by dividing the aggregate number of days students are in school by the aggregate number of possible student days in the school year. An attendance rate of 95% means that 5 out of every 100 students enrolled were not in school on a typical day. Dropouts: According to the DPI, the definition of a dropout is a student who was enrolled in school at some time during the reported school year, was not enrolled at the beginning of the following school year, has not graduated from high school or completed a state or district-approved educational program, and does not meet any of the following exclusionary conditions: transfer to another public school district, private school, or state or district-approved educational program; temporary absence due to expulsion, suspension, or school-approved illness; or death. Starting with 2003-04, the dropout rate is the number of students who dropped out during the school term divided by the total number of students who were expected to complete the school term in that school or district. The latter number may be more or less than the enrollment due to student transfers in and out after the fall enrollment count date. “Total number of students expected to complete the school term” is the denominator used to calculate all dropout rates and is the sum of students who actually completed the school term plus dropouts.

15th Comparative Analysis of RUSD Page 108
Enrollment: Two types of enrollment data are important: 1) the enrollment as of the third Friday in September, a head count of how many children are enrolled in school on a specific day, and 2) the full-time equivalent enrollment, which accounts for pre-school and Kindergarten children in school for only a portion of the day to calculate state aid and other financial data. In this report, head count enrollments are reported in the tables, but full-time equivalents are the basis for calculation of spending and revenue per pupil. Expulsions: Expulsion is the removal of a student for school permanently. Expulsions are recorded in terms of students expelled as well as days lost due to expulsion. The expulsion rates were calculated by dividing the number of expelled students by the pre-Kindergarten through 12th grade enrollment of the school district. 4th, 8th, and 10th grade knowledge and concept tests: These tests measure student knowledge in the areas of reading, language arts, mathematics, science and social studies. Proficiency levels describe how well students performed on the statewide tests. The proficiency levels are advanced, proficient, basic, and minimal performance. WKCE scores only are reported in the analysis. The Wisconsin Student Assessment System (WSAS) also includes the Wisconsin Alternate Assessments (WAA) for students with more severe disabilities and students at early levels of English language proficiency. Students scoring proficient or advanced on the WAA exam are not included in the proficient and advanced percentages in this report. 3rd, 5th, 6th and 7th grade knowledge and concept tests: These tests measure student knowledge in the areas of reading and mathematics. The 2005-06 year was the first year in which Knowledge and Concept Examinations were administered to students in 3rd, 5th, 6th and 7th grades. As a result, historical comparisons beyond that date are not available for these grades. WKCE scores only are reported in the analysis. The Wisconsin Student Assessment System (WSAS) also includes the Wisconsin Alternate Assessments (WAA) for students with more severe disabilities and students at early levels of English language proficiency. Students scoring proficient or advanced on the WAA exam are not included in the proficient and advanced percentages in this report. Free lunch eligibility: The only available measure of the income level of pupils. It is the percentage of pupils who qualify under federal guidelines for free or reduced-price lunch, and, therefore, roughly measures the percentage of low-income children in a school. Habitual truancy: According to DPI, the definition of a habitual truant is a student who is absent from school without an acceptable excuse for part of all of five or more days on which school is held during a semester. The habitual truancy rate (expressed as a percentage) is the number of habitual truants divided by Kindergarten through 12th grade enrollment counted on the third Friday in September.

15th Comparative Analysis of RUSD Page 109
High school completion rate: Starting in 2003-04, high school completion rates are defined as the number of graduates divided by an estimate of the total cohort group measured from the beginning of high school, expressed as a percentage. This cohort group included graduate, other high school graduates, and other students who reached the age 21 in the school year. The cohort group also included cohort dropouts over four years. Prior to 2003-04, it was calculated by taking the number of graduates divided by the number of graduates plus dropouts over four years, expressed as a percentage. Income per pupil: Based on state tax returns, this is a calculation of aggregate earned income among residents of each school district divided by the district fill-time enrollment (FTE). The result is an indicator of community wealth that takes into account both the relative number of children in the community and the proportion of the district’s children who attend public schools. Income per return: The aggregate income that was reported to the Wisconsin Department of Revenue divided by the number of returns filed. Property taxes: An equalized school tax rate, which makes it possible to compare the school tax effort from one community to another. The equalized rate is the amount of money property taxpayers were charged in December 2011 (for the 2011-12 school year) for each $1,000 of property value at full market value.
Property value per pupil: Another measure of community wealth, this relates directly to Wisconsin’s formula for calculating state aid to school districts. The numbers represent the tax base of the school district as measured by equalized taxable property values as of 2011-12. It is a reliable measurement for purposes of comparing the property wealth of school districts.
Retention rates: Retentions are students who, by local district policy, must either repeat a grade or need additional time to complete the prescribed program. The number of retentions is reported for all grades except pre-Kindergarten. The retention rate is the number of retentions divided by the Kindergarten through 12th grade enrollment.
Revenue per pupil: Each autumn, school districts file reports on budgeted revenue and spending. Data in this report were taken from those reports filed in fall 2010. The two principal sources of revenue for schools – property taxes and state aid – are reported on a per-pupil basis (using full-time equivalent enrollments). Also reported are the per-pupil revenues from federal sources.

15th Comparative Analysis of RUSD Page 110
Spending per pupil: Operations spending per pupil refers to the cost of running the system on a daily basis. It is more useful to look at operations spending for comparative purposes because capital spending and debt service can vary dramatically from year to year (depending on whether a district is building new schools). Operations spending is divided into six categories for the purposes of this report:
• Instruction – Direct spending on educational programs that generally take place in the
classroom. • Pupil services – A wide variety of services outside the classroom, such as guidance
counseling, social work, curriculum development, libraries, vocational services, and extracurricular activities.
• Instructional staff services – Includes spending on improvement to instructional staff,
library media, and supervision and coordination of staff.
• General administration – Central office expenses related to district administration, such as the superintendent’s office and the school board.
• Building administration – Expenses related to the administration of each school building,
primarily the principal’s office.
• Transportation. Suspensions: Suspension is an administrative action that temporarily excludes a student from school. Suspensions are recorded three ways: 1) the number of individual students suspended at least once during the school year, 2) the number of suspensions (a larger number because some students are suspended more than once), and 3) the number of days lost because of suspension. This report measures suspensions as the number of days lost because of suspension. The measurement is reported as a percentage of total possible school days lost to suspension.