1526: colorado connections academy @ durango | 1520
TRANSCRIPT
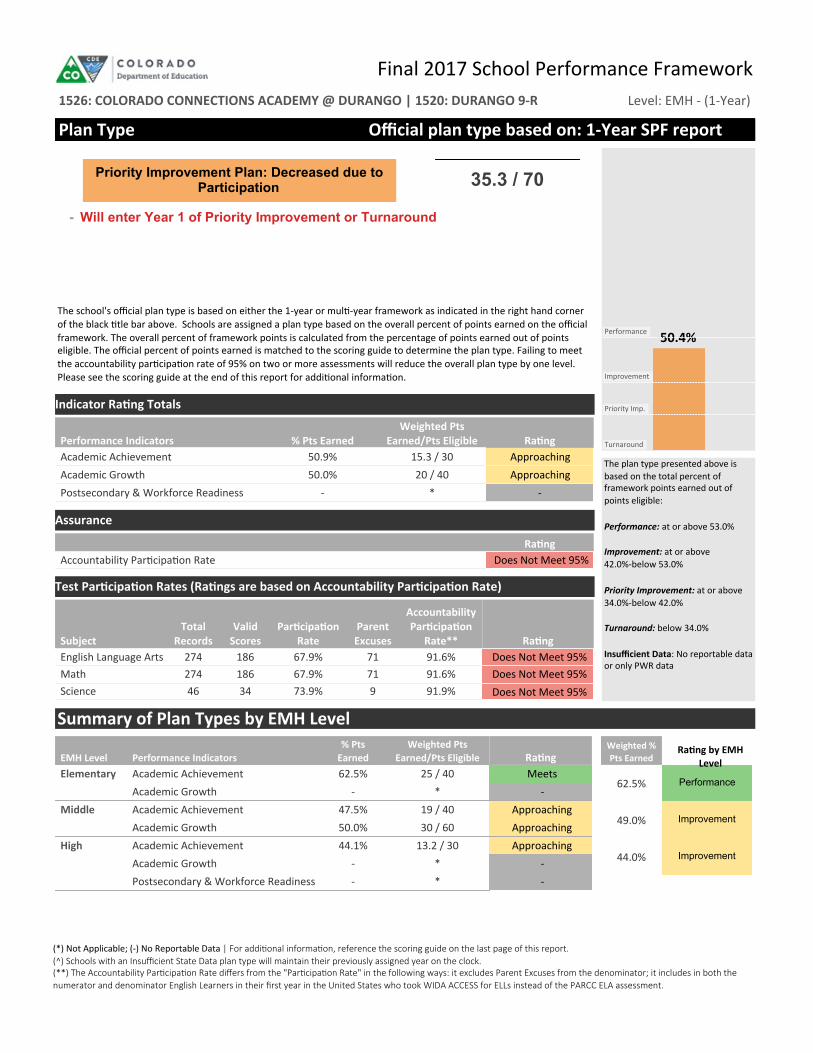
Summary of Plan Types by EMH Level
50.4%
Turnaround
Priority Imp.
Improvement
Performance
Performance Indicators % Pts EarnedWeighted Pts
Earned/Pts Eligible RangAcademic Achievement 50.9% 15.3 / 30Academic Growth 50.0% 20 / 40Postsecondary & Workforce Readiness - *
ApproachingApproaching
-
Indicator Rang Totals
The school's official plan type is based on either the 1-year or mul-year framework as indicated in the right hand cornerof the black tle bar above. Schools are assigned a plan type based on the overall percent of points earned on the officialframework. The overall percent of framework points is calculated from the percentage of points earned out of pointseligible. The official percent of points earned is matched to the scoring guide to determine the plan type. Failing to meetthe accountability parcipaon rate of 95% on two or more assessments will reduce the overall plan type by one level.Please see the scoring guide at the end of this report for addional informaon.
The plan type presented above isbased on the total percent offramework points earned out ofpoints eligible:
Performance: at or above 53.0%
Improvement: at or above42.0%-below 53.0%
Priority Improvement: at or above34.0%-below 42.0%
Turnaround: below 34.0%
Insufficient Data: No reportable dataor only PWR data
EMH Level Performance Indicators% PtsEarned
Weighted PtsEarned/Pts Eligible Rang
Elementary Academic Achievement 62.5% 25 / 40Academic Growth - *
Middle Academic Achievement 47.5% 19 / 40Academic Growth 50.0% 30 / 60
High Academic Achievement 44.1% 13.2 / 30Academic Growth - *Postsecondary & Workforce Readiness - *
Meets -
Approaching Approaching Approaching
- -
SubjectTotalRecords
ValidScores
ParcipaonRate
ParentExcuses
AccountabilityParcipaonRate** Rang
English Language Arts 274 186 67.9% 71 91.6%Math 274 186 67.9% 71 91.6%Science 46 34 73.9% 9 91.9%
Does Not Meet 95% Does Not Meet 95% Does Not Meet 95%
Test Parcipaon Rates (Rangs are based on Accountability Parcipaon Rate)
RangAccountability Parcipaon Rate Does Not Meet 95%
Assurance
1526: COLORADO CONNECTIONS ACADEMY @ DURANGO | 1520: DURANGO 9-R
Final 2017 School Performance FrameworkLevel: EMH - (1-Year)
Weighted %Pts Earned
62.5%
49.0%
44.0%
Performance
Improvement
Improvement
Plan Type Official plan type based on: 1-Year SPF report
Priority Improvement Plan: Decreased due toParticipation 35.3 / 70
(*) Not Applicable; (-) No Reportable Data | For addional informaon, reference the scoring guide on the last page of this report.(̂) Schools with an Insufficient State Data plan type will maintain their previously assigned year on the clock.(**) The Accountability Parcipaon Rate differs from the "Parcipaon Rate" in the following ways: it excludes Parent Excuses from the denominator; it includes in both thenumerator and denominator English Learners in their first year in the United States who took WIDA ACCESS for ELLs instead of the PARCC ELA assessment.
Rang by EMHLevel
Will enter Year 1 of Priority Improvement or Turnaround-
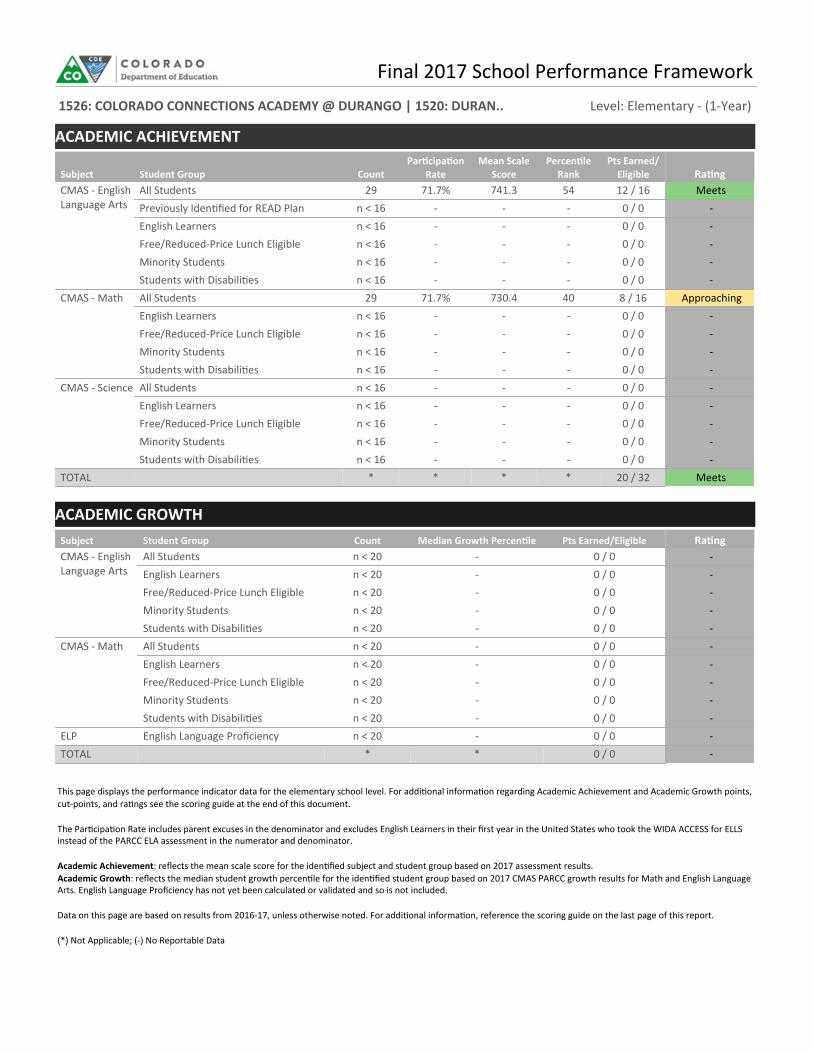
Final 2017 School Performance Framework1526: COLORADO CONNECTIONS ACADEMY @ DURANGO | 1520: DURAN..
Subject Student Group CountParcipaonRate
Mean ScaleScore
PercenleRank
Pts Earned/Eligible Rang
CMAS - EnglishLanguage Arts
All Students 29 71.7% 741.3 54 12 / 16Previously Idenfied for READ Plan n < 16 - - - 0 / 0English Learners n < 16 - - - 0 / 0Free/Reduced-Price Lunch Eligible n < 16 - - - 0 / 0Minority Students n < 16 - - - 0 / 0Students with Disabilies n < 16 - - - 0 / 0
CMAS - Math All Students 29 71.7% 730.4 40 8 / 16English Learners n < 16 - - - 0 / 0Free/Reduced-Price Lunch Eligible n < 16 - - - 0 / 0Minority Students n < 16 - - - 0 / 0Students with Disabilies n < 16 - - - 0 / 0
CMAS - ScienceAll Students n < 16 - - - 0 / 0English Learners n < 16 - - - 0 / 0Free/Reduced-Price Lunch Eligible n < 16 - - - 0 / 0Minority Students n < 16 - - - 0 / 0Students with Disabilies n < 16 - - - 0 / 0
TOTAL * * * * 20 / 32
Meets - - - - -
Approaching - - - - - - - - -
Meets
ACADEMIC ACHIEVEMENT
Subject Student Group Count Median Growth Percenle Pts Earned/Eligible RangCMAS - EnglishLanguage Arts
All Students n < 20 - 0 / 0English Learners n < 20 - 0 / 0Free/Reduced-Price Lunch Eligible n < 20 - 0 / 0Minority Students n < 20 - 0 / 0Students with Disabilies n < 20 - 0 / 0
CMAS - Math All Students n < 20 - 0 / 0English Learners n < 20 - 0 / 0Free/Reduced-Price Lunch Eligible n < 20 - 0 / 0Minority Students n < 20 - 0 / 0Students with Disabilies n < 20 - 0 / 0
ELP English Language Proficiency n < 20 - 0 / 0TOTAL * * 0 / 0
- - - - - - - - - - - -
ACADEMIC GROWTH
This page displays the performance indicator data for the elementary school level. For addional informaon regarding Academic Achievement and Academic Growth points,cut-points, and rangs see the scoring guide at the end of this document.
The Parcipaon Rate includes parent excuses in the denominator and excludes English Learners in their first year in the United States who took the WIDA ACCESS for ELLSinstead of the PARCC ELA assessment in the numerator and denominator.
Academic Achievement: reflects the mean scale score for the idenfied subject and student group based on 2017 assessment results.Academic Growth: reflects the median student growth percenle for the idenfied student group based on 2017 CMAS PARCC growth results for Math and English LanguageArts. English Language Proficiency has not yet been calculated or validated and so is not included.
Data on this page are based on results from 2016-17, unless otherwise noted. For addional informaon, reference the scoring guide on the last page of this report.
(*) Not Applicable; (-) No Reportable Data
Level: Elementary - (1-Year)

Final 2017 School Performance Framework
Subject Student Group CountParcipaonRate
Mean ScaleScore
PercenleRank
Pts Earned/Eligible Rang
CMAS - EnglishLanguage Arts
All Students 38 73.3% 735.4 37 8 / 16English Learners n < 16 - - - 0 / 0Free/Reduced-Price Lunch Eligible 21 80.0% 737.4 43 1 / 2Minority Students 16 88.9% 731.9 30 1 / 2Students with Disabilies n < 16 - - - 0 / 0
CMAS - Math All Students 38 73.3% 719.1 20 8 / 16English Learners n < 16 - - - 0 / 0Free/Reduced-Price Lunch Eligible 21 80.0% 716.0 13 .5 / 2Minority Students 16 88.9% 709.9 5 .5 / 2Students with Disabilies n < 16 - - - 0 / 0
CMAS - ScienceAll Students n < 16 - - - 0 / 0English Learners n < 16 - - - 0 / 0Free/Reduced-Price Lunch Eligible n < 16 - - - 0 / 0Minority Students n < 16 - - - 0 / 0Students with Disabilies n < 16 - - - 0 / 0
TOTAL * * * * 19 / 40
Approaching -
Approaching Approaching
- Approaching
- Does Not Meet Does Not Meet
- - - - - -
Approaching
ACADEMIC ACHIEVEMENT
Level: Middle - (1-Year)1526: COLORADO CONNECTIONS ACADEMY @ DURANGO | 1520: DURANGO 9..
Subject Student Group Count Median Growth Percenle Pts Earned/Eligible RangCMAS - EnglishLanguage Arts
All Students 27 44.0 8 / 16English Learners n < 20 - 0 / 0Free/Reduced-Price Lunch Eligible n < 20 - 0 / 0Minority Students n < 20 - 0 / 0Students with Disabilies n < 20 - 0 / 0
CMAS - Math All Students 27 48.0 8 / 16English Learners n < 20 - 0 / 0Free/Reduced-Price Lunch Eligible n < 20 - 0 / 0Minority Students n < 20 - 0 / 0Students with Disabilies n < 20 - 0 / 0
ELP English Language Proficiency n < 20 - 0 / 0TOTAL * * 16 / 32
Approaching - - - -
Approaching - - - - -
Approaching
ACADEMIC GROWTH
This page displays the performance indicator data for the middle school level. For addional informaon regarding Academic Achievement and Academic Growth points,cut-points, and rangs see the scoring guide at the end of this document.
The Parcipaon Rate includes parent excuses in the denominator and excludes English Learners in their first year in the United States who took the WIDA ACCESS for ELLSinstead of the PARCC ELA assessment in the numerator and denominator.
Academic Achievement: reflects the mean scale score for the idenfied subject and student group based on 2017 assessment results.Academic Growth: reflects the median student growth percenle for the idenfied student group based on 2017 CMAS PARCC growth results for Math and English LanguageArts. English Language Proficiency growth is based on 2015 student growth percenles (from WIDA ACCESS for ELLs results).
Data on this page are based on results from 2016-17, unless otherwise noted. For addional informaon, reference the scoring guide on the last page of this report.
(*) Not Applicable; (-) No Reportable Data
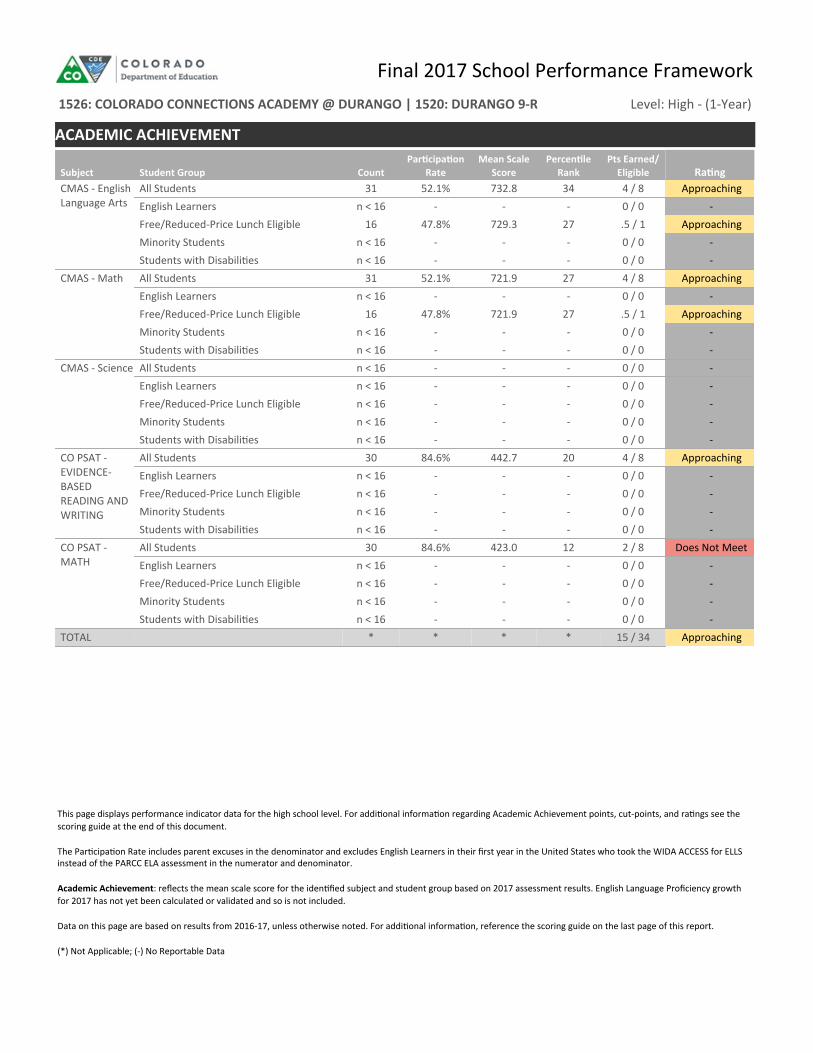
Subject Student Group CountParcipaonRate
Mean ScaleScore
PercenleRank
Pts Earned/Eligible Rang
CMAS - EnglishLanguage Arts
All Students 31 52.1% 732.8 34 4 / 8English Learners n < 16 - - - 0 / 0Free/Reduced-Price Lunch Eligible 16 47.8% 729.3 27 .5 / 1Minority Students n < 16 - - - 0 / 0Students with Disabilies n < 16 - - - 0 / 0
CMAS - Math All Students 31 52.1% 721.9 27 4 / 8English Learners n < 16 - - - 0 / 0Free/Reduced-Price Lunch Eligible 16 47.8% 721.9 27 .5 / 1Minority Students n < 16 - - - 0 / 0Students with Disabilies n < 16 - - - 0 / 0
CMAS - ScienceAll Students n < 16 - - - 0 / 0English Learners n < 16 - - - 0 / 0Free/Reduced-Price Lunch Eligible n < 16 - - - 0 / 0Minority Students n < 16 - - - 0 / 0Students with Disabilies n < 16 - - - 0 / 0
CO PSAT -EVIDENCE-BASEDREADING ANDWRITING
All Students 30 84.6% 442.7 20 4 / 8English Learners n < 16 - - - 0 / 0Free/Reduced-Price Lunch Eligible n < 16 - - - 0 / 0Minority Students n < 16 - - - 0 / 0Students with Disabilies n < 16 - - - 0 / 0
CO PSAT -MATH
All Students 30 84.6% 423.0 12 2 / 8English Learners n < 16 - - - 0 / 0Free/Reduced-Price Lunch Eligible n < 16 - - - 0 / 0Minority Students n < 16 - - - 0 / 0Students with Disabilies n < 16 - - - 0 / 0
TOTAL * * * * 15 / 34
Approaching -
Approaching - -
Approaching -
Approaching - - - - - - -
Approaching - - - -
Does Not Meet - - - -
Approaching
ACADEMIC ACHIEVEMENT
Final 2017 School Performance Framework
This page displays performance indicator data for the high school level. For addional informaon regarding Academic Achievement points, cut-points, and rangs see thescoring guide at the end of this document.
The Parcipaon Rate includes parent excuses in the denominator and excludes English Learners in their first year in the United States who took the WIDA ACCESS for ELLSinstead of the PARCC ELA assessment in the numerator and denominator.
Academic Achievement: reflects the mean scale score for the idenfied subject and student group based on 2017 assessment results. English Language Proficiency growthfor 2017 has not yet been calculated or validated and so is not included.
Data on this page are based on results from 2016-17, unless otherwise noted. For addional informaon, reference the scoring guide on the last page of this report.
(*) Not Applicable; (-) No Reportable Data
Level: High - (1-Year)1526: COLORADO CONNECTIONS ACADEMY @ DURANGO | 1520: DURANGO 9-R
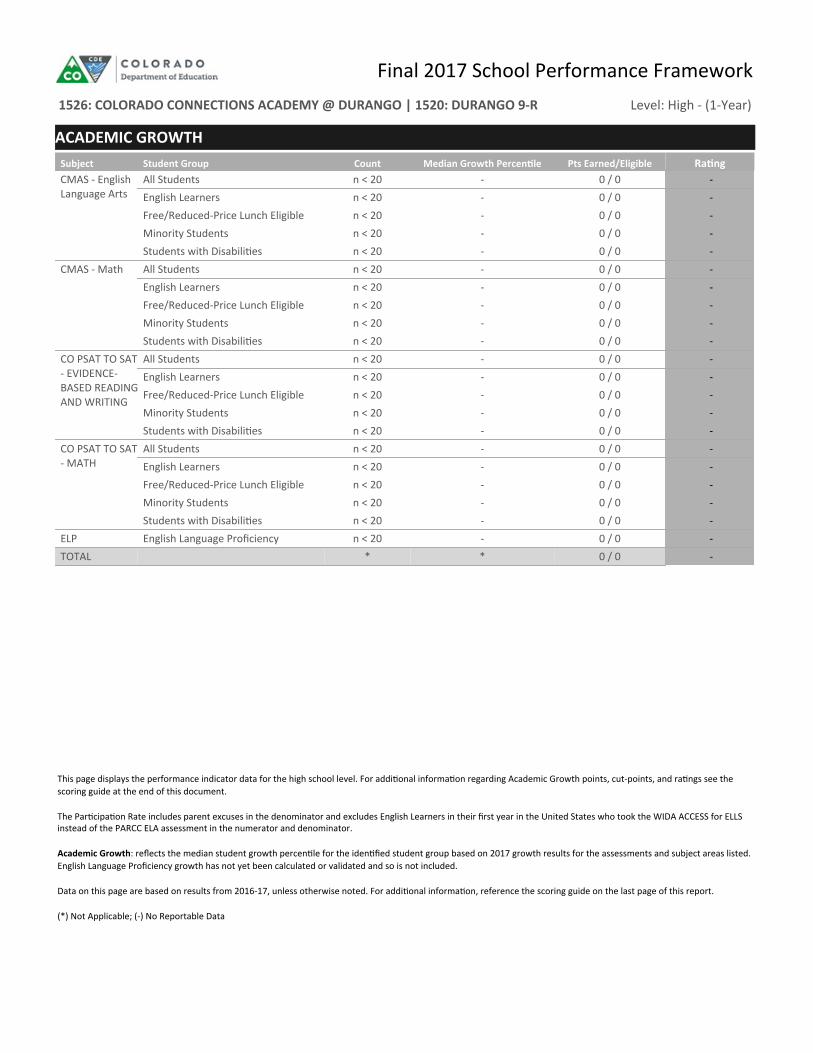
Subject Student Group Count Median Growth Percenle Pts Earned/Eligible RangCMAS - EnglishLanguage Arts
All Students n < 20 - 0 / 0English Learners n < 20 - 0 / 0Free/Reduced-Price Lunch Eligible n < 20 - 0 / 0Minority Students n < 20 - 0 / 0Students with Disabilies n < 20 - 0 / 0
CMAS - Math All Students n < 20 - 0 / 0English Learners n < 20 - 0 / 0Free/Reduced-Price Lunch Eligible n < 20 - 0 / 0Minority Students n < 20 - 0 / 0Students with Disabilies n < 20 - 0 / 0
CO PSAT TO SAT- EVIDENCE-BASED READINGAND WRITING
All Students n < 20 - 0 / 0English Learners n < 20 - 0 / 0Free/Reduced-Price Lunch Eligible n < 20 - 0 / 0Minority Students n < 20 - 0 / 0Students with Disabilies n < 20 - 0 / 0
CO PSAT TO SAT- MATH
All Students n < 20 - 0 / 0English Learners n < 20 - 0 / 0Free/Reduced-Price Lunch Eligible n < 20 - 0 / 0Minority Students n < 20 - 0 / 0Students with Disabilies n < 20 - 0 / 0
ELP English Language Proficiency n < 20 - 0 / 0TOTAL * * 0 / 0
- - - - - - - - - - - - - - - - - - - - - -
ACADEMIC GROWTH
Final 2017 School Performance Framework
This page displays the performance indicator data for the high school level. For addional informaon regarding Academic Growth points, cut-points, and rangs see thescoring guide at the end of this document.
The Parcipaon Rate includes parent excuses in the denominator and excludes English Learners in their first year in the United States who took the WIDA ACCESS for ELLSinstead of the PARCC ELA assessment in the numerator and denominator.
Academic Growth: reflects the median student growth percenle for the idenfied student group based on 2017 growth results for the assessments and subject areas listed.English Language Proficiency growth has not yet been calculated or validated and so is not included.
Data on this page are based on results from 2016-17, unless otherwise noted. For addional informaon, reference the scoring guide on the last page of this report.
(*) Not Applicable; (-) No Reportable Data
Level: High - (1-Year)1526: COLORADO CONNECTIONS ACADEMY @ DURANGO | 1520: DURANGO 9-R
Final 2017 School Performance Framework1526: COLORADO CONNECTIONS ACADEMY @ DURANGO | 1520: DURANGO 9-R
Subject Student Group Count Best Rate Rate/ScoreParcipaonRate
PtsEarned/Eligible Rang
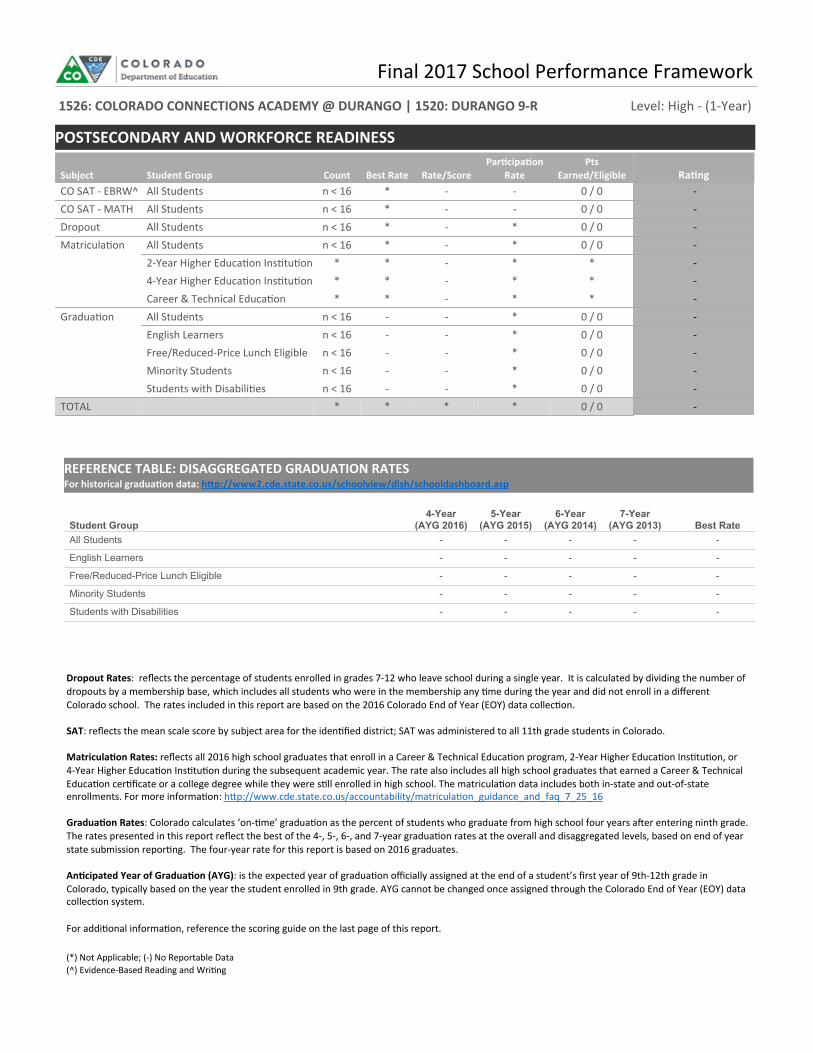
CO SAT - EBRW^All Students n < 16 * - - 0 / 0CO SAT - MATH All Students n < 16 * - - 0 / 0Dropout All Students n < 16 * - * 0 / 0Matriculaon All Students n < 16 * - * 0 / 0
2-Year Higher Educaon Instuon * * - * *4-Year Higher Educaon Instuon * * - * *Career & Technical Educaon * * - * *
Graduaon All Students n < 16 - - * 0 / 0English Learners n < 16 - - * 0 / 0Free/Reduced-Price Lunch Eligible n < 16 - - * 0 / 0Minority Students n < 16 - - * 0 / 0Students with Disabilies n < 16 - - * 0 / 0
TOTAL * * * * 0 / 0
- - - - - - - - - - - - -
POSTSECONDARY AND WORKFORCE READINESS
Student Group4-Year
(AYG 2016)5-Year
(AYG 2015)6-Year
(AYG 2014)7-Year
(AYG 2013) Best RateAll Students - - - - -
English Learners - - - - -
Free/Reduced-Price Lunch Eligible - - - - -
Minority Students - - - - -
Students with Disabilities - - - - -
REFERENCE TABLE: DISAGGREGATED GRADUATION RATESFor historical graduaon data: hp://www2.cde.state.co.us/schoolview/dish/schooldashboard.asp
Dropout Rates: reflects the percentage of students enrolled in grades 7-12 who leave school during a single year. It is calculated by dividing the number ofdropouts by a membership base, which includes all students who were in the membership any me during the year and did not enroll in a differentColorado school. The rates included in this report are based on the 2016 Colorado End of Year (EOY) data collecon.
SAT: reflects the mean scale score by subject area for the idenfied district; SAT was administered to all 11th grade students in Colorado.
Matriculaon Rates: reflects all 2016 high school graduates that enroll in a Career & Technical Educaon program, 2-Year Higher Educaon Instuon, or4-Year Higher Educaon Instuon during the subsequent academic year. The rate also includes all high school graduates that earned a Career & TechnicalEducaon cerficate or a college degree while they were sll enrolled in high school. The matriculaon data includes both in-state and out-of-stateenrollments. For more informaon: hp://www.cde.state.co.us/accountability/matriculaon_guidance_and_faq_7_25_16
Graduaon Rates: Colorado calculates ‘on-me’ graduaon as the percent of students who graduate from high school four years aer entering ninth grade.The rates presented in this report reflect the best of the 4-, 5-, 6-, and 7-year graduaon rates at the overall and disaggregated levels, based on end of yearstate submission reporng. The four-year rate for this report is based on 2016 graduates.
Ancipated Year of Graduaon (AYG): is the expected year of graduaon officially assigned at the end of a student’s first year of 9th-12th grade inColorado, typically based on the year the student enrolled in 9th grade. AYG cannot be changed once assigned through the Colorado End of Year (EOY) datacollecon system.
For addional informaon, reference the scoring guide on the last page of this report.
(*) Not Applicable; (-) No Reportable Data(̂) Evidence-Based Reading and Wring
Level: High - (1-Year)
Performance Indicator
H8 -6 -4 -2 -
15th percentile50th percentile85th percentile
Indicator
Achievement
Growth
Postsecondary Readiness
August 21, 2017
34.0%25.0%
Schoolnot applicable
53.0%42.0%34.0%25.0%
Accreditation Category/Plan TypeAccredited w/Distinction (District only)
Accredited w/Improvement Plan (District) or Improvement Plan (School)Accredited w/Priority Improvement Plan (District) or Priority Improvement (School)
Accredited (District) or Performance Plan (School)
Accredited w/Turnaround Plan(District) or Turnaround Plan (School)
Total Possible Points per EMH LevelE & M- 72 points (16 per subject for all students and 8 per subject by disaggregated group)H- 72 points (8 per ELA/EBRW & Math for all students and 4 by disaggregated group, 16 for Science for all students and 8 by disaggregated group)E & M- 48 total points (16 per subject for all students, 8 per subject by disaggregated group)H- 48 points (8 per subject for all students, 4 per subject by disaggregated group)18 total points (8 for graduation, 2 for matriculation and 4 for all other sub-indicators)
Elementary/Middle
40%
60%
not applicable
High/District
30%
40%
30%
Percentile
• below 75.0%
Dropout Rate: The district or school dropout rate was (of all schools in 2016):
Each Disaggregated Group1.000.750.50
• at or below 2.0% but above 0.5% • at or below 5.0% but above 2.0%
32
Total Framework Points
Cut-Points for Plan/Category Type AssignmentDistrict74.0%56.0%44.0%
2.0
Does Not Meet
Exceeds • at or above 543.4 2.0 • at or above 491.7 but below 543.4 1.5 • at or above 446.5 but below 491.7 1.0 • below 446.5 0.5
0.5
Total Possible Points by Performance Indicator
Achievement; Growth; Postsecondary Readiness
• at or above 559.1
0.25
Cut-Points for Each Performance IndicatorCut-Point:The district or school earned...of the points eligible.
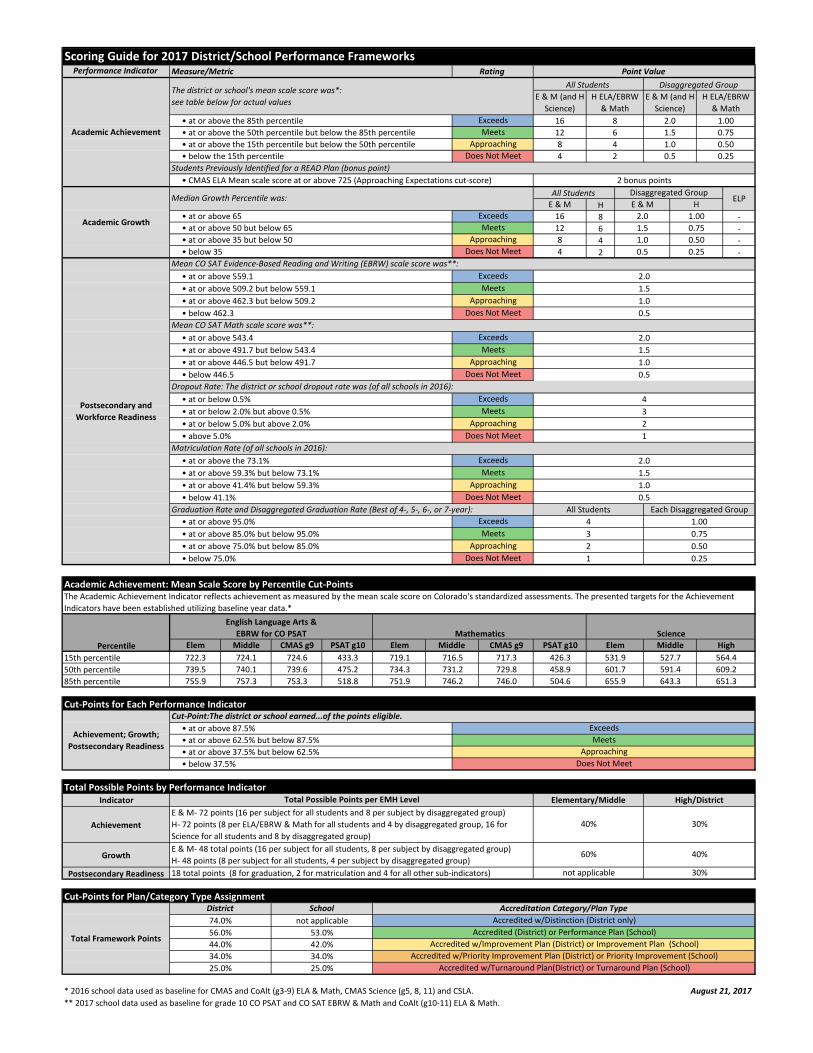
Scoring Guide for 2017 District/School Performance FrameworksPoint Value
• at or above the 85th percentile • at or above the 50th percentile but below the 85th percentile • at or above the 15th percentile but below the 50th percentile • below the 15th percentile
Academic Growth
Measure/Metric
Students Previously Identified for a READ Plan (bonus point)
Disaggregated Group
2 bonus points
RatingAll Students
• at or above 37.5% but below 62.5% • below 37.5%
• at or above 87.5%
• at or above 75.0% but below 85.0%
• below 41.1%
• at or above 62.5% but below 87.5%
1
Science
Academic Achievement: Mean Scale Score by Percentile Cut-Points
Elem Middle CMAS g9 PSAT g10
English Language Arts & EBRW for CO PSAT
CMAS g9
ApproachingDoes Not Meet
722.3739.5755.9
724.1740.1
• at or above 41.4% but below 59.3%
• at or above 95.0%
734.3751.9
Middle 716.5731.2
321
729.8746.0
458.9504.6
• at or above 85.0% but below 95.0%
ExceedsMeets
ApproachingDoes Not Meet
161284
ExceedsMeets
ApproachingDoes Not Meet
• CMAS ELA Mean scale score at or above 725 (Approaching Expectations cut-score)
Median Growth Percentile was:
717.3PSAT g10
426.3
Mathematics
1.0
746.2
The Academic Achievement Indicator reflects achievement as measured by the mean scale score on Colorado's standardized assessments. The presented targets for the Achievement Indicators have been established utilizing baseline year data.*
Matriculation Rate (of all schools in 2016):2.01.51.00.5
MeetsApproaching
757.3
724.6739.6753.3
Approaching
433.3475.2518.8
Elem719.1
Mean CO SAT Evidence-Based Reading and Writing (EBRW) scale score was**:
• at or below 0.5%
• at or above 65 • at or above 50 but below 65 • at or above 35 but below 50 • below 35
4
Mean CO SAT Math scale score was**:
ELP
Exceeds1.5Meets
• below 462.3
• at or above 509.2 but below 559.1 • at or above 462.3 but below 509.2
4All StudentsGraduation Rate and Disaggregated Graduation Rate (Best of 4-, 5-, 6-, or 7-year):
Does Not Meet
ExceedsMeets
ApproachingDoes Not Meet
ExceedsMeets
• above 5.0%
• at or above the 73.1% • at or above 59.3% but below 73.1%
2
* 2016 school data used as baseline for CMAS and CoAlt (g3-9) ELA & Math, CMAS Science (g5, 8, 11) and CSLA. ** 2017 school data used as baseline for grade 10 CO PSAT and CO SAT EBRW & Math and CoAlt (g10-11) ELA & Math.
Postsecondary and Workforce Readiness
ExceedsMeets
ApproachingDoes Not Meet
HighMiddleElem531.9601.7655.9
527.7591.4643.3
564.4609.2651.3
ExceedsMeets
ApproachingDoes Not Meet
Academic Achievement
The district or school's mean scale score was*: see table below for actual values
E & M All Students
E & M (and H Science)
H ELA/EBRW & Math
2.01.51.00.5
1.000.750.500.25
E & M (and H Science)
161284
H ELA/EBRW & Math
864
Disaggregated GroupE & M
2.01.51.00.5
1.000.750.500.25
H